Next Issue
Volume 9, March
Previous Issue
Volume 9, January
 
 
remotesensing-logo

Journal Browser

Journal Browser

Remote Sens., Volume 9, Issue 2 (February 2017) – 86 articles

Cover Story (view full-size image): 
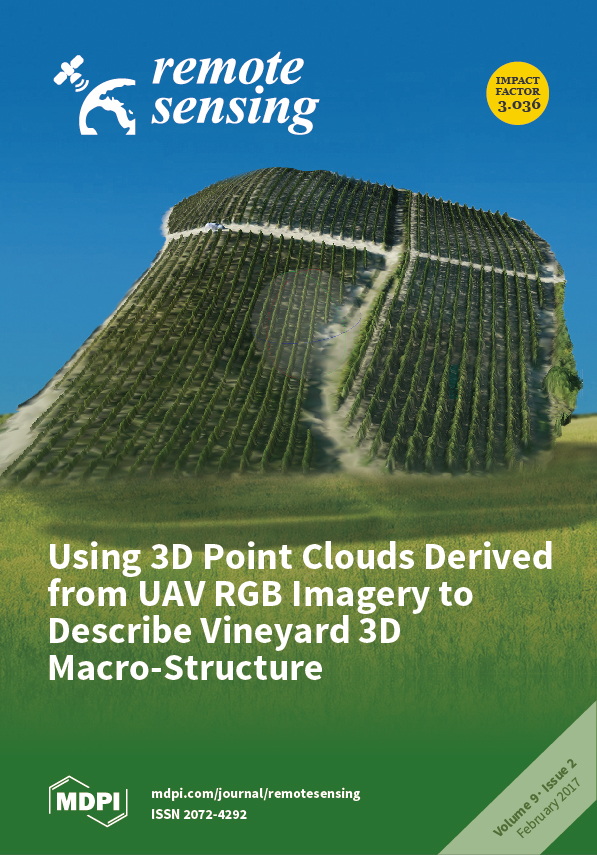
An algorithm, based on RGB imagery, acquired with a UAV is proposed to characterize the 3D macro-structure of vineyards. We apply a photogrammetric technique on the overlapping RGB images to derive the canopy height model. By applying a threshold, we separate the rows from the inter-rows to estimate the row orientation, height, width and spacing, the cover fraction and the percentage of missing segments along the rows. Comparison with ground measurements provides a root mean square error of 9.8 cm for row height, 8.7 cm for row width, and 7 cm for row spacing. Conversely to height and spacing, the ability of the algorithm to accurately estimate row width, cover fraction and percentage of missing row segments, depends on the success of the photogrammetric technique. It is therefore mandatory to combine optimal flight configuration and camera settings to get good quality images with a high overlapping [...] Read more.
  • Issues are regarded as officially published after their release is announced to the table of contents alert mailing list.
  • You may sign up for e-mail alerts to receive table of contents of newly released issues.
  • PDF is the official format for papers published in both, html and pdf forms. To view the papers in pdf format, click on the "PDF Full-text" link, and use the free Adobe Reader to open them.
Order results
Result details
Section
Select all
Export citation of selected articles as:
5369 KiB  
Article
Accuracy Assessment of Digital Surface Models from Unmanned Aerial Vehicles’ Imagery on Glaciers
by Saskia Gindraux, Ruedi Boesch and Daniel Farinotti
Remote Sens. 2017, 9(2), 186; https://doi.org/10.3390/rs9020186 - 22 Feb 2017
Cited by 178 | Viewed by 11079
Abstract
The use of Unmanned Aerial Vehicles (UAV) for photogrammetric surveying has recently gained enormous popularity. Images taken from UAVs are used for generating Digital Surface Models (DSMs) and orthorectified images. In the glaciological context, these can serve for quantifying ice volume change or [...] Read more.
The use of Unmanned Aerial Vehicles (UAV) for photogrammetric surveying has recently gained enormous popularity. Images taken from UAVs are used for generating Digital Surface Models (DSMs) and orthorectified images. In the glaciological context, these can serve for quantifying ice volume change or glacier motion. This study focuses on the accuracy of UAV-derived DSMs. In particular, we analyze the influence of the number and disposition of Ground Control Points (GCPs) needed for georeferencing the derived products. A total of 1321 different DSMs were generated from eight surveys distributed on three glaciers in the Swiss Alps during winter, summer and autumn. The vertical and horizontal accuracy was assessed by cross-validation with thousands of validation points measured with a Global Positioning System. Our results show that the accuracy increases asymptotically with increasing number of GCPs until a certain density of GCPs is reached. We call this the optimal GCP density. The results indicate that DSMs built with this optimal GCP density have a vertical (horizontal) accuracy ranging between 0.10 and 0.25 m (0.03 and 0.09 m) across all datasets. In addition, the impact of the GCP distribution on the DSM accuracy was investigated. The local accuracy of a DSM decreases when increasing the distance to the closest GCP, typically at a rate of 0.09 m per 100-m distance. The impact of the glacier’s surface texture (ice or snow) was also addressed. The results show that besides cases with a surface covered by fresh snow, the surface texture does not significantly influence the DSM accuracy. Full article
(This article belongs to the Special Issue Recent Trends in UAV Remote Sensing)
Show Figures

Graphical abstract

4297 KiB  
Article
Aerosol Retrieval Sensitivity and Error Analysis for the Cloud and Aerosol Polarimetric Imager on Board TanSat: The Effect of Multi-Angle Measurement
by Xi Chen, Dongxu Yang, Zhaonan Cai, Yi Liu and Robert J. D. Spurr
Remote Sens. 2017, 9(2), 183; https://doi.org/10.3390/rs9020183 - 22 Feb 2017
Cited by 27 | Viewed by 6125
Abstract
Aerosol scattering is an important source of error in CO2 retrievals from satellite. This paper presents an analysis of aerosol information content from the Cloud and Aerosol Polarimetric Imager (CAPI) onboard the Chinese Carbon Dioxide Observation Satellite (TanSat) to be launched in [...] Read more.
Aerosol scattering is an important source of error in CO2 retrievals from satellite. This paper presents an analysis of aerosol information content from the Cloud and Aerosol Polarimetric Imager (CAPI) onboard the Chinese Carbon Dioxide Observation Satellite (TanSat) to be launched in 2016. Based on optimal estimation theory, aerosol information content is quantified from radiance and polarization observed by CAPI in terms of the degrees of freedom for the signal (DFS). A linearized vector radiative transfer model is used with a linearized Mie code to simulate observation and sensitivity (or Jacobians) with respect to aerosol parameters. In satellite nadir mode, the DFS for aerosol optical depth is the largest, but for mode radius, it is only 0.55. Observation geometry is found to affect aerosol DFS based on the aerosol scattering phase function from the comparison between different viewing zenith angles or solar zenith angles. When TanSat is operated in target mode, we note that multi-angle retrieval represented by three along-track measurements provides additional 0.31 DFS on average, mainly from mode radius. When adding another two measurements, the a posteriori error decreases by another 2%–6%. The correlation coefficients between retrieved parameters show that aerosol is strongly correlated with surface reflectance, but multi-angle retrieval can weaken this correlation. Full article
(This article belongs to the Special Issue Remote Sensing of Atmospheric Pollution)
Show Figures

Graphical abstract

1421 KiB  
Article
Coupling Fine-Scale Root and Canopy Structure Using Ground-Based Remote Sensing
by Brady S. Hardiman, Christopher M. Gough, John R. Butnor, Gil Bohrer, Matteo Detto and Peter S. Curtis
Remote Sens. 2017, 9(2), 182; https://doi.org/10.3390/rs9020182 - 21 Feb 2017
Cited by 12 | Viewed by 6045
Abstract
Ecosystem physical structure, defined by the quantity and spatial distribution of biomass, influences a range of ecosystem functions. Remote sensing tools permit the non-destructive characterization of canopy and root features, potentially providing opportunities to link above- and belowground structure at fine spatial resolution [...] Read more.
Ecosystem physical structure, defined by the quantity and spatial distribution of biomass, influences a range of ecosystem functions. Remote sensing tools permit the non-destructive characterization of canopy and root features, potentially providing opportunities to link above- and belowground structure at fine spatial resolution in functionally meaningful ways. To test this possibility, we employed ground-based portable canopy LiDAR (PCL) and ground penetrating radar (GPR) along co-located transects in forested sites spanning multiple stages of ecosystem development and, consequently, of structural complexity. We examined canopy and root structural data for coherence (i.e., correlation in the frequency of spatial variation) at multiple spatial scales ≤10 m within each site using wavelet analysis. Forest sites varied substantially in vertical canopy and root structure, with leaf area index and root mass more becoming even vertically as forests aged. In all sites, above- and belowground structure, characterized as mean maximum canopy height and root mass, exhibited significant coherence at a scale of 3.5–4 m, and results suggest that the scale of coherence may increase with stand age. Our findings demonstrate that canopy and root structure are linked at characteristic spatial scales, which provides the basis to optimize scales of observation. Our study highlights the potential, and limitations, for fusing LiDAR and radar technologies to quantitatively couple above- and belowground ecosystem structure. Full article
Show Figures

Graphical abstract

4103 KiB  
Article
Specific Land Cover Class Mapping by Semi-Supervised Weighted Support Vector Machines
by Joel Silva, Fernando Bacao and Mario Caetano
Remote Sens. 2017, 9(2), 181; https://doi.org/10.3390/rs9020181 - 21 Feb 2017
Cited by 15 | Viewed by 5110
Abstract
In many remote sensing projects on land cover mapping, the interest is often in a sub-set of classes presented in the study area. Conventional multi-class classification may lead to a considerable training effort and to the underestimation of the classes of interest. On [...] Read more.
In many remote sensing projects on land cover mapping, the interest is often in a sub-set of classes presented in the study area. Conventional multi-class classification may lead to a considerable training effort and to the underestimation of the classes of interest. On the other hand, one-class classifiers require much less training, but may overestimate the real extension of the class of interest. This paper illustrates the combined use of cost-sensitive and semi-supervised learning to overcome these difficulties. This method utilises a manually-collected set of pixels of the class of interest and a random sample of pixels, keeping the training effort low. Each data point is then weighted according to its distance to its near positive data point to inform the learning algorithm. The proposed approach was compared with a conventional multi-class classifier, a one-class classifier, and a semi-supervised classifier in the discrimination of high-mangrove in Saloum estuary, Senegal, from Landsat imagery. The derived classification accuracies were high: 93.90% for the multi-class supervised classifier, 90.75% for the semi-supervised classifier, 88.75% for the one-class classifier, and 93.75% for the proposed method. The results show that accuracy achieved with the proposed method is statistically non-inferior to that achieved with standard binary classification, requiring however much less training effort. Full article
Show Figures

Graphical abstract

5665 KiB  
Article
An Empirical Ocean Colour Algorithm for Estimating the Contribution of Coloured Dissolved Organic Matter in North-Central Western Adriatic Sea
by Alessandra Campanelli, Simone Pascucci, Mattia Betti, Federica Grilli, Mauro Marini, Stefano Pignatti and Stefano Guicciardi
Remote Sens. 2017, 9(2), 180; https://doi.org/10.3390/rs9020180 - 21 Feb 2017
Cited by 11 | Viewed by 5428
Abstract
The performance of empirical band ratio models were evaluated for the estimation of Coloured Dissolved Organic Matter (CDOM) using MODIS ocean colour sensor images and data collected on the North-Central Western Adriatic Sea (Mediterranean Sea). Relationships between in situ measurements (2013–2016) of CDOM [...] Read more.
The performance of empirical band ratio models were evaluated for the estimation of Coloured Dissolved Organic Matter (CDOM) using MODIS ocean colour sensor images and data collected on the North-Central Western Adriatic Sea (Mediterranean Sea). Relationships between in situ measurements (2013–2016) of CDOM absorption coefficients at 355 nm (aCDOM355) with several MODIS satellite band ratios were evaluated on a test data set. The prediction capability of the different linear models was assessed on a validation data set. Based on some statistical diagnostic parameters (R2, APD and RMSE), the best MODIS band ratio performance in retrieving CDOM was obtained by a simple linear model of the transformed dependent variable using the remote sensing reflectance band ratio Rrs(667)/Rrs(488) as the only independent variable. The best-retrieved CDOM algorithm provides very good results for the complex coastal area along the North-Central Western Adriatic Sea where the Po River outflow is the main driving force in CDOM and nutrient circulation, which in winter mostly remains confined to a coastal boundary layer, whereas in summer it spreads to the open sea as well. Full article
(This article belongs to the Special Issue Water Optics and Water Colour Remote Sensing)
Show Figures

Graphical abstract

10797 KiB  
Article
Leveraging Multi-Sensor Time Series Datasets to Map Short- and Long-Term Tropical Forest Disturbances in the Colombian Andes
by Paulo J. Murillo-Sandoval, Jamon Van Den Hoek and Thomas Hilker
Remote Sens. 2017, 9(2), 179; https://doi.org/10.3390/rs9020179 - 21 Feb 2017
Cited by 17 | Viewed by 6126
Abstract
The spatial distribution of disturbances in Andean tropical forests and protected areas has commonly been calculated using bi or tri-temporal analysis because of persistent cloud cover and complex topography. Long-term trends of vegetative decline (browning) or improvement (greening) have thus not been evaluated [...] Read more.
The spatial distribution of disturbances in Andean tropical forests and protected areas has commonly been calculated using bi or tri-temporal analysis because of persistent cloud cover and complex topography. Long-term trends of vegetative decline (browning) or improvement (greening) have thus not been evaluated despite their importance for assessing conservation strategy implementation in regions where field-based monitoring by environmental authorities is limited. Using Colombia’s Cordillera de los Picachos National Natural Park as a case study, we provide a temporally rigorous assessment of regional vegetation change from 2001–2015 with two remote sensing-based approaches using the Breaks For Additive Season and Trend (BFAST) algorithm. First, we measured long-term vegetation trends using a Moderate Resolution Imaging Spectroradiometer (MODIS)-based Multi-Angle Implementation of Atmospheric Correction (MAIAC) time series, and, second, we mapped short-term disturbances using all available Landsat images. MAIAC-derived trends indicate a net greening in 6% of the park, but in the surrounding 10 km area outside of the park, a net browning trend prevails at 2.5%. We also identified a 12,500 ha area within Picachos (4% of the park’s total area) that has shown at least 13 years of consecutive browning, a result that was corroborated with our Landsat-based approach that recorded a 12,642 ha (±1440 ha) area of disturbed forest within the park. Landsat vegetation disturbance results had user’s and producer’s accuracies of 0.95 ± 0.02 and 0.83 ± 0.18, respectively, and 75% of Landsat-detected dates of disturbance events were accurate within ±6 months. This study provides new insights into the contribution of short-term disturbance to long-term trends of vegetation change, and offers an unprecedented perspective on the distribution of small-scale disturbances over a 15-year period in one of the most inaccessible national parks in the Andes. Full article
Show Figures

Graphical abstract

5318 KiB  
Article
A Radiometric Uncertainty Tool for the Sentinel 2 Mission
by Javier Gorroño, Norman Fomferra, Marco Peters, Ferran Gascon, Craig I. Underwood, Nigel P. Fox, Grit Kirches and Carsten Brockmann
Remote Sens. 2017, 9(2), 178; https://doi.org/10.3390/rs9020178 - 21 Feb 2017
Cited by 18 | Viewed by 8206
Abstract
In the framework of the European Copernicus programme, the European Space Agency (ESA) has launched the Sentinel-2 (S2) Earth Observation (EO) mission which provides optical high spatial resolution imagery over land and coastal areas. As part of this mission, a tool (named S2-RUT, [...] Read more.
In the framework of the European Copernicus programme, the European Space Agency (ESA) has launched the Sentinel-2 (S2) Earth Observation (EO) mission which provides optical high spatial resolution imagery over land and coastal areas. As part of this mission, a tool (named S2-RUT, from Sentinel-2 Radiometric Uncertainty Tool) has been developed. The tool estimates the radiometric uncertainty associated with each pixel in the top-of-atmosphere (TOA) reflectance factor images provided by ESA. This paper describes the design and development process of the initial version of the S2-RUT tool. The initial design step describes the S2 radiometric model where a set of uncertainty contributors are identified. Each of the uncertainty contributors is specified by reviewing the pre- and post-launch characterisation. The identified uncertainty contributors are combined following the guidelines in the ‘Guide to Expression of Uncertainty in Measurement’ (GUM) model and this combination model is further validated by comparing the results to a multivariate Monte Carlo Method (MCM). In addition, the correlation between the different uncertainty contributions and the impact of simplifications in the combination model have been studied. The software design of the tool prioritises an efficient strategy to read the TOA reflectance factor images, extract the auxiliary information from the metadata in the satellite products and the codification of the resulting uncertainty image. This initial version of the tool has been implemented and integrated as part of the Sentinels Application Platform (SNAP). Full article
Show Figures

Graphical abstract

13376 KiB  
Article
Comparison of Two Simulation Methods of the Temperature Vegetation Dryness Index (TVDI) for Drought Monitoring in Semi-Arid Regions of China
by Lingtong Du, Naiping Song, Ke Liu, Jing Hou, Yue Hu, Yuguo Zhu, Xinyun Wang, Lei Wang and Yige Guo
Remote Sens. 2017, 9(2), 177; https://doi.org/10.3390/rs9020177 - 20 Feb 2017
Cited by 61 | Viewed by 10805
Abstract
The Temperature Vegetation Dryness Index (TVDI), a drought monitoring index based on an empirical parameterization of the Land Surface Temperature (LST)–Normalized Difference Vegetation Index (NDVI) space, has been widely implemented in a variety of ecosystems worldwide because it does not depend on ancillary [...] Read more.
The Temperature Vegetation Dryness Index (TVDI), a drought monitoring index based on an empirical parameterization of the Land Surface Temperature (LST)–Normalized Difference Vegetation Index (NDVI) space, has been widely implemented in a variety of ecosystems worldwide because it does not depend on ancillary data. However, the simulation of dry/wet edges in the TVDI model can be problematic because remote sensing images do not have sufficient pixels to identify the wetness and dryness extremes of different vegetation coverages. In this study, an improvement in dry/wet edge simulation was proposed, and a comparison of the original TVDI and the modified Temperature Vegetation Dryness Index (TVDIm) was performed for drought monitoring in Ningxia Province, which is a typical semi-arid region in China. First, the difference between the land surface temperatures in day and night (∆LST) was used as an alternative to LST when building the TVDIm model. In addition, the wet edges were improved by removing outliers using a statistical method, and the dry edges were optimized by removing the “tail down” points in the NDVI range of 0.0–0.1. Here, the modeling process of TVDIm in 2005, one of recent extreme drought year is illustrated. The results show that both the TVDI and TVDIm can be used to monitor the temporal and spatial variations of drought, and the onset, duration, extent, and severity of drought can be reflected by TVDI and TVDIm maps. However, the magnitude of TVDI is higher than that of TVDIm, which could cause the TVDI-simulated drought condition to be elevated in normal years and underestimated in dry years. The TVDIm has higher coefficients of correlation with in situ meteorological drought index and agricultural drought statistical data than does the original TVDI, and it exhibits better performance in drought monitoring compared to that of the original TVDI in semi-arid regions of China. Full article
Show Figures

Graphical abstract

8470 KiB  
Article
Combined Usage of TanDEM-X and CryoSat-2 for Generating a High Resolution Digital Elevation Model of Fast Moving Ice Stream and Its Application in Grounding Line Estimation
by Seung Hee Kim and Duk-jin Kim
Remote Sens. 2017, 9(2), 176; https://doi.org/10.3390/rs9020176 - 20 Feb 2017
Cited by 7 | Viewed by 6022
Abstract
Definite surface topography of ice provides fundamental information for most glaciologists to study climate change. However, the topography at the marginal region of ice sheets exhibits noticeable dynamical changes from fast flow velocity and large thinning rates; thus, it is difficult to determine [...] Read more.
Definite surface topography of ice provides fundamental information for most glaciologists to study climate change. However, the topography at the marginal region of ice sheets exhibits noticeable dynamical changes from fast flow velocity and large thinning rates; thus, it is difficult to determine instantaneous topography. In this study, the surface topography of the marginal region of Thwaites Glacier in the Amundsen Sector of West Antarctica, where ice melting and thinning are prevailing, is extracted using TanDEM-X interferometry in combination with data from the near-coincident CryoSat-2 radar altimeter. The absolute height offset, which has been a persistent problem in applying the interferometry technique for generating DEMs, is determined by linear least-squares fitting between the uncorrected TanDEM-X heights and reliable reference heights from CryoSat-2. The reliable heights are rigorously selected at locations of high normalized cross-correlation and low RMS heights between segments of data points. The generated digital elevation model with the resolved absolute height offset is assessed with airborne laser altimeter data from the Operation IceBridge that were acquired five months after TanDEM-X and show high correlation with biases of 3.19 m and −4.31 m at the grounding zone and over the ice sheet surface, respectively. For practical application of the generated DEM, grounding line estimation assuming hydrostatic equilibrium was carried out, and the feasibility was seen through comparison with the previous grounding line. Finally, it is expected that the combination of interferometry and altimetery with similar datasets can be applied at regions even with a lack of ground control points. Full article
Show Figures

Graphical abstract

3711 KiB  
Article
Urban Land Extraction Using VIIRS Nighttime Light Data: An Evaluation of Three Popular Methods
by Yinyin Dou, Zhifeng Liu, Chunyang He and Huanbi Yue
Remote Sens. 2017, 9(2), 175; https://doi.org/10.3390/rs9020175 - 20 Feb 2017
Cited by 84 | Viewed by 9211
Abstract
Timely and accurate extraction of urban land area using the Suomi National Polar-orbiting Partnership Visible Infrared Imaging Radiometer Suite (VIIRS) nighttime light data is important for urban studies. However, a comprehensive assessment of the existing methods for extracting urban land using VIIRS nighttime [...] Read more.
Timely and accurate extraction of urban land area using the Suomi National Polar-orbiting Partnership Visible Infrared Imaging Radiometer Suite (VIIRS) nighttime light data is important for urban studies. However, a comprehensive assessment of the existing methods for extracting urban land using VIIRS nighttime light data remains inadequate. Therefore, we first reviewed the relevant methods and selected three popular methods for extracting urban land area using nighttime light data. These methods included local-optimized thresholding (LOT), vegetation-adjusted nighttime light urban index (VANUI), integrated nighttime lights, normalized difference vegetation index, and land surface temperature support vector machine classification (INNL-SVM). Then, we assessed the performance of these methods for extracting urban land area based on the VIIRS nighttime light data in seven evaluation areas with various natural and socioeconomic conditions in China. We found that INNL-SVM had the best performance with an average kappa of 0.80, which was 6.67% higher than the LOT and 2.56% higher than the VANUI. The superior performance of INNL-SVM was mainly attributed to the integration of information on nighttime light, vegetation cover, and land surface temperature. This integration effectively reduced the commission and omission errors arising from the overflow effect and low light brightness of the VIIRS nighttime light data. Additionally, INNL-SVM can extract urban land area more easily. Thus, we suggest that INNL-SVM has great potential for effectively extracting urban land with VIIRS nighttime light data at large scales. Full article
(This article belongs to the Special Issue Recent Advances in Remote Sensing with Nighttime Lights)
Show Figures

Graphical abstract

3892 KiB  
Article
Hydrological Modelling using Satellite-Based Crop Coefficients: A Comparison of Methods at the Basin Scale
by Johannes E. Hunink, Joris P. C. Eekhout, Joris De Vente, Sergio Contreras, Peter Droogers and Alain Baille
Remote Sens. 2017, 9(2), 174; https://doi.org/10.3390/rs9020174 - 18 Feb 2017
Cited by 16 | Viewed by 6635
Abstract
The parameterization of crop coefficients (kc) is critical for determining a water balance. We used satellite-based and literature-based methods to derive kc values for a distributed hydrologic model. We evaluated the impact of different kc parametrization methods on the water balance [...] Read more.
The parameterization of crop coefficients (kc) is critical for determining a water balance. We used satellite-based and literature-based methods to derive kc values for a distributed hydrologic model. We evaluated the impact of different kc parametrization methods on the water balance and simulated hydrologic response at the basin and sub-basin scale. The hydrological model SPHY was calibrated and validated for a period of 15 years for the upper Segura basin (~2500 km2) in Spain, which is characterized by a wide range of terrain, soil, and ecosystem conditions. The model was then applied, using six kc parameterization methods, to determine their spatial and temporal impacts on actual evapotranspiration, streamflow, and soil moisture. The parameterization methods used include: (i) Normalized Difference Vegetation Index (NDVI) observations from MODIS; (ii) seasonally-averaged NDVI patterns, cell-based and landuse-based; and (iii) literature-based tabular values per land use type. The analysis shows that the influence of different kc parametrization methods on basin-level streamflow is relatively small and constant throughout the year, but it has a bigger effect on seasonal evapotranspiration and soil moisture. In the autumn especially, deviations can go up to about 15% of monthly streamflow. At smaller, sub-basin scale, deviations from the NDVI-based reference run can be more than 30%. Overall, the study shows that modeling of future hydrological changes can be improved by using remote sensing information for the parameterization of crop coefficients. Full article
Show Figures

Graphical abstract

552 KiB  
Article
Effect of Training Class Label Noise on Classification Performances for Land Cover Mapping with Satellite Image Time Series
by Charlotte Pelletier, Silvia Valero, Jordi Inglada, Nicolas Champion, Claire Marais Sicre and Gérard Dedieu
Remote Sens. 2017, 9(2), 173; https://doi.org/10.3390/rs9020173 - 18 Feb 2017
Cited by 152 | Viewed by 9641
Abstract
Supervised classification systems used for land cover mapping require accurate reference databases. These reference data come generally from different sources such as field measurements, thematic maps, or aerial photographs. Due to misregistration, update delay, or land cover complexity, they may contain class label [...] Read more.
Supervised classification systems used for land cover mapping require accurate reference databases. These reference data come generally from different sources such as field measurements, thematic maps, or aerial photographs. Due to misregistration, update delay, or land cover complexity, they may contain class label noise, i.e., a wrong label assignment. This study aims at evaluating the impact of mislabeled training data on classification performances for land cover mapping. Particularly, it addresses the random and systematic label noise problem for the classification of high resolution satellite image time series. Experiments are carried out on synthetic and real datasets with two traditional classifiers: Support Vector Machines (SVM) and Random Forests (RF). A synthetic dataset has been designed for this study, simulating vegetation profiles over one year. The real dataset is composed of Landsat-8 and SPOT-4 images acquired during one year in the south of France. The results show that both classifiers are little influenced for low random noise levels up to 25%–30%, but their performances drop down for higher noise levels. Different classification configurations are tested by increasing the number of classes, using different input feature vectors, and changing the number of training instances. Algorithm complexities are also analyzed. The RF classifier achieves high robustness to random and systematic label noise for all the tested configurations; whereas the SVM classifier is more sensitive to the kernel choice and to the input feature vectors. Finally, this work reveals that the cross-validation procedure is impacted by the presence of class label noise. Full article
Show Figures

Graphical abstract

3064 KiB  
Article
Testing Accuracy and Repeatability of UAV Blocks Oriented with GNSS-Supported Aerial Triangulation
by Francesco Benassi, Elisa Dall’Asta, Fabrizio Diotri, Gianfranco Forlani, Umberto Morra di Cella, Riccardo Roncella and Marina Santise
Remote Sens. 2017, 9(2), 172; https://doi.org/10.3390/rs9020172 - 18 Feb 2017
Cited by 143 | Viewed by 10424
Abstract
UAV Photogrammetry today already enjoys a largely automated and efficient data processing pipeline. However, the goal of dispensing with Ground Control Points looks closer, as dual-frequency GNSS receivers are put on board. This paper reports on the accuracy in object space obtained by [...] Read more.
UAV Photogrammetry today already enjoys a largely automated and efficient data processing pipeline. However, the goal of dispensing with Ground Control Points looks closer, as dual-frequency GNSS receivers are put on board. This paper reports on the accuracy in object space obtained by GNSS-supported orientation of four photogrammetric blocks, acquired by a senseFly eBee RTK and all flown according to the same flight plan at 80 m above ground over a test field. Differential corrections were sent to the eBee from a nearby ground station. Block orientation has been performed with three software packages: PhotoScan, Pix4D and MicMac. The influence on the checkpoint errors of the precision given to the projection centers has been studied: in most cases, values in Z are critical. Without GCP, the RTK solution consistently achieves a RMSE of about 2–3 cm on the horizontal coordinates of checkpoints. In elevation, the RMSE varies from flight to flight, from 2 to 10 cm. Using at least one GCP, with all packages and all test flights, the geocoding accuracy of GNSS-supported orientation is almost as good as that of a traditional GCP orientation in XY and only slightly worse in Z. Full article
(This article belongs to the Special Issue Recent Trends in UAV Remote Sensing)
Show Figures

Graphical abstract

5383 KiB  
Article
Contour Detection for UAV-Based Cadastral Mapping
by Sophie Crommelinck, Rohan Bennett, Markus Gerke, Michael Ying Yang and George Vosselman
Remote Sens. 2017, 9(2), 171; https://doi.org/10.3390/rs9020171 - 18 Feb 2017
Cited by 47 | Viewed by 11335
Abstract
Unmanned aerial vehicles (UAVs) provide a flexible and low-cost solution for the acquisition of high-resolution data. The potential of high-resolution UAV imagery to create and update cadastral maps is being increasingly investigated. Existing procedures generally involve substantial fieldwork and many manual processes. Arguably, [...] Read more.
Unmanned aerial vehicles (UAVs) provide a flexible and low-cost solution for the acquisition of high-resolution data. The potential of high-resolution UAV imagery to create and update cadastral maps is being increasingly investigated. Existing procedures generally involve substantial fieldwork and many manual processes. Arguably, multiple parts of UAV-based cadastral mapping workflows could be automated. Specifically, as many cadastral boundaries coincide with visible boundaries, they could be extracted automatically using image analysis methods. This study investigates the transferability of gPb contour detection, a state-of-the-art computer vision method, to remotely sensed UAV images and UAV-based cadastral mapping. Results show that the approach is transferable to UAV data and automated cadastral mapping: object contours are comprehensively detected at completeness and correctness rates of up to 80%. The detection quality is optimal when the entire scene is covered with one orthoimage, due to the global optimization of gPb contour detection. However, a balance between high completeness and correctness is hard to achieve, so a combination with area-based segmentation and further object knowledge is proposed. The localization quality exhibits the usual dependency on ground resolution. The approach has the potential to accelerate the process of general boundary delineation during the creation and updating of cadastral maps. Full article
(This article belongs to the Special Issue Recent Trends in UAV Remote Sensing)
Show Figures

Graphical abstract

7999 KiB  
Article
Analyses of Recent Sediment Surface Dynamic of a Namibian Kalahari Salt Pan Based on Multitemporal Landsat and Hyperspectral Hyperion Data
by Robert Milewski, Sabine Chabrillat and Robert Behling
Remote Sens. 2017, 9(2), 170; https://doi.org/10.3390/rs9020170 - 18 Feb 2017
Cited by 21 | Viewed by 7544
Abstract
This study combines spaceborne multitemporal and hyperspectral data to analyze the spatial distribution of surface evaporite minerals and changes in a semi-arid depositional environment associated with episodic flooding events, the Omongwa salt pan (Kalahari, Namibia). The dynamic of the surface crust is evaluated [...] Read more.
This study combines spaceborne multitemporal and hyperspectral data to analyze the spatial distribution of surface evaporite minerals and changes in a semi-arid depositional environment associated with episodic flooding events, the Omongwa salt pan (Kalahari, Namibia). The dynamic of the surface crust is evaluated by a change-detection approach using the Iterative-reweighted Multivariate Alteration Detection (IR-MAD) based on the Landsat archive imagery from 1984 to 2015. The results show that the salt pan is a highly dynamic and heterogeneous landform. A change gradient is observed from very stable pan border to a highly dynamic central pan. On the basis of hyperspectral EO-1 Hyperion images, the current distribution of surface evaporite minerals is characterized using Spectral Mixture Analysis (SMA). Assessment of field and image endmembers revealed that the pan surface can be categorized into three major crust types based on diagnostic absorption features and mineralogical ground truth data. The mineralogical crust types are related to different zones of surface change as well as pan morphology that influences brine flow during the pan inundation and desiccation cycles. These combined information are used to spatially map depositional environments where the more dynamic halite crust concentrates in lower areas although stable gypsum and calcite/sepiolite crusts appear in higher elevated areas. Full article
Show Figures

Graphical abstract

3466 KiB  
Article
Marsh Loss Due to Cumulative Impacts of Hurricane Isaac and the Deepwater Horizon Oil Spill in Louisiana
by Shruti Khanna, Maria J. Santos, Alexander Koltunov, Kristen D. Shapiro, Mui Lay and Susan L. Ustin
Remote Sens. 2017, 9(2), 169; https://doi.org/10.3390/rs9020169 - 17 Feb 2017
Cited by 13 | Viewed by 5940
Abstract
Coastal ecosystems are greatly endangered due to anthropogenic development and climate change. Multiple disturbances may erode the ability of a system to recover from stress if there is little time between disturbance events. We evaluated the ability of the saltmarshes in Barataria Bay, [...] Read more.
Coastal ecosystems are greatly endangered due to anthropogenic development and climate change. Multiple disturbances may erode the ability of a system to recover from stress if there is little time between disturbance events. We evaluated the ability of the saltmarshes in Barataria Bay, Louisiana, USA, to recover from two successive disturbances, the DeepWater Horizon oil spill in 2010 and Hurricane Isaac in 2012. We measured recovery using vegetation indices and land cover change metrics. We found that after the hurricane, land loss along oiled shorelines was 17.8%, while along oil-free shorelines, it was 13.6% within the first 7 m. At a distance of 7–14 m, land loss from oiled regions was 11.6%, but only 6.3% in oil-free regions. We found no differences in vulnerability to land loss between narrow and wide shorelines; however, vegetation in narrow sites was significantly more stressed, potentially leading to future land loss. Treated oiled regions also lost more land due to the hurricane than untreated regions. These results suggest that ecosystem recovery after the two disturbances is compromised, as the observed high rates of land loss may prevent salt marsh from establishing in the same areas where it existed prior to the oil spill. Full article
Show Figures

Graphical abstract

10864 KiB  
Article
A Soil Moisture Retrieval Method Based on Typical Polarization Decomposition Techniques for a Maize Field from Full-Polarization Radarsat-2 Data
by Qiuxia Xie, Qingyan Meng, Linlin Zhang, Chunmei Wang, Yunxiao Sun and Zhenhui Sun
Remote Sens. 2017, 9(2), 168; https://doi.org/10.3390/rs9020168 - 17 Feb 2017
Cited by 17 | Viewed by 5244
Abstract
Soil moisture (SM) estimates are important to research, but are not accurately predictable in areas with tall vegetation. Full-polarization Radarsat-2 C-band data were used to retrieve SM contents using typical polarization decomposition (Freeman–Durden, Yamaguchi and VanZly) at different growth stages of maize. Applicability [...] Read more.
Soil moisture (SM) estimates are important to research, but are not accurately predictable in areas with tall vegetation. Full-polarization Radarsat-2 C-band data were used to retrieve SM contents using typical polarization decomposition (Freeman–Durden, Yamaguchi and VanZly) at different growth stages of maize. Applicability analyses were conducted, including proportion, regression and surface scattering model analyses. Furthermore, the Bragg, the extended Bragg scattering model (X-Bragg) and improved surface scattering models (ISSM) were used to retrieve SM content. The results indicated that the VanZly decomposition method was the best. The proportion of surface scattering in the proportion analysis was highest (>52%), followed by that in the Yamaguchi method (>41%). The R2 (>0.6144) between surface scattering and SM was significantly higher (R2 < 0.4484) between dihedral scattering and SM in the regression analysis. The ISSM was better at different maize growth stages than the Bragg and X-Bragg models with a higher R2 (>0.6599) and lower absolute error (AE) (<5.82) and root mean square error (RMSE) (<3.73). The best algorithm was obtained at the sowing stage (R2 = 0.8843, AE = 3.13, RMSE = 1.76). In addition, the X-Bragg model provided better approximation of actual surface scattering without the measured data (better algorithm: R2 = 0.8314, AE = 4.39, RMSE = 2.81). Full article
(This article belongs to the Special Issue Earth Observations for Precision Farming in China (EO4PFiC))
Show Figures

Graphical abstract

3449 KiB  
Article
A Broad-Area Method for the Diurnal Characterisation of Upwelling Medium Wave Infrared Radiation
by Bryan Hally, Luke Wallace, Karin Reinke and Simon Jones
Remote Sens. 2017, 9(2), 167; https://doi.org/10.3390/rs9020167 - 17 Feb 2017
Cited by 13 | Viewed by 4796
Abstract
Fire detection from satellite sensors relies on an accurate estimation of the unperturbed state of a target pixel, from which an anomaly can be isolated. Methods for estimating the radiation budget of a pixel without fire depend upon training data derived from the [...] Read more.
Fire detection from satellite sensors relies on an accurate estimation of the unperturbed state of a target pixel, from which an anomaly can be isolated. Methods for estimating the radiation budget of a pixel without fire depend upon training data derived from the location’s recent history of brightness temperature variation over the diurnal cycle, which can be vulnerable to cloud contamination and the effects of weather. This study proposes a new method that utilises the common solar budget found at a given latitude in conjunction with an area’s local solar time to aggregate a broad-area training dataset, which can be used to model the expected diurnal temperature cycle of a location. This training data is then used in a temperature fitting process with the measured brightness temperatures in a pixel, and compared to pixel-derived training data and contextual methods of background temperature determination. Results of this study show similar accuracy between clear-sky medium wave infrared upwelling radiation and the diurnal temperature cycle estimation compared to previous methods, with demonstrable improvements in processing time and training data availability. This method can be used in conjunction with brightness temperature thresholds to provide a baseline for upwelling radiation, from which positive thermal anomalies such as fire can be isolated. Full article
Show Figures

Graphical abstract

15296 KiB  
Article
Monitoring the Rapid-Moving Reactivation of Earth Flows by Means of GB-InSAR: The April 2013 Capriglio Landslide (Northern Appennines, Italy)
by Federica Bardi, Federico Raspini, William Frodella, Luca Lombardi, Massimiliano Nocentini, Giovanni Gigli, Stefano Morelli, Alessandro Corsini and Nicola Casagli
Remote Sens. 2017, 9(2), 165; https://doi.org/10.3390/rs9020165 - 17 Feb 2017
Cited by 35 | Viewed by 6276
Abstract
This paper presents the main results of the GB-InSAR (ground based interferometric synthetic aperture radar) monitoring of the Capriglio landslide (Northern Apennines, Emilia Romagna Region, Italy), activated on 6 April 2013. The landslide, triggered by prolonged rainfall, is constituted by two main adjacent [...] Read more.
This paper presents the main results of the GB-InSAR (ground based interferometric synthetic aperture radar) monitoring of the Capriglio landslide (Northern Apennines, Emilia Romagna Region, Italy), activated on 6 April 2013. The landslide, triggered by prolonged rainfall, is constituted by two main adjacent enlarging bodies with a roto-translational kinematics. They activated in sequence and subsequently joined into a large earth flow, channelizing downstream of the Bardea Creek, for a total length of about 3600 m. The displacement rate of this combined mass was quite high, so that the landslide toe evolved with velocities of several tens of meters per day (with peaks of 70–80 m/day) in the first month, and of several meters per day (with peaks of 13–14 m/day) from early May to mid-July 2013. In the crown area, the landslide completely destroyed a 450 m sector of provincial roadway S.P. 101, and its retrogression tendency exposed the villages of Capriglio and Pianestolla, located in the upper watershed area of the Bardea Creek, to great danger. Furthermore, the advancing toe seriously threatened the Antria bridge, representing the “Massese” provincial roadway S.P. 665R transect over the Bardea Creek, the only strategic roadway left able to connect the above-mentioned villages. With the final aim of supporting local authorities in the hazard assessment and risk management during the emergency phase, on 4 May 2013 aerial optical surveys were conducted to accurately map the landslide extension and evolution. Moreover, a GB-InSAR monitoring campaign was started in order to assess displacements of the whole landslide area. The versatility and flexibility of the GB-InSAR sensors allowed acquiring data with two different configurations, designed and set up to continuously retrieve information on the landslide movement rates (both in its upper slow-moving sectors and in its fast-moving toe). The first acquisition mode revealed that the Capriglio and Pianestolla villages were affected by minor displacements (at an order of magnitude of a few millimeters per month). The second acquisition mode allowed to acquire data every 28 seconds, reaching very high temporal resolution values by applying the GB-InSAR technique. Full article
(This article belongs to the Special Issue Remote Sensing of Landslides)
Show Figures

Graphical abstract

1233 KiB  
Article
Texture-Analysis-Incorporated Wind Parameters Extraction from Rain-Contaminated X-Band Nautical Radar Images
by Weimin Huang, Ying Liu and Eric W. Gill
Remote Sens. 2017, 9(2), 166; https://doi.org/10.3390/rs9020166 - 16 Feb 2017
Cited by 30 | Viewed by 5181
Abstract
In this paper, a method for extracting wind parameters from rain-contaminated X-band nautical radar images is presented. The texture of the radar image is first generated based on spatial variability analysis. Through this process, the rain clutter in an image can be removed [...] Read more.
In this paper, a method for extracting wind parameters from rain-contaminated X-band nautical radar images is presented. The texture of the radar image is first generated based on spatial variability analysis. Through this process, the rain clutter in an image can be removed while the wave echoes are retained. The number of rain-contaminated pixels in each azimuthal direction of the texture is estimated, and this is used to determine the azimuthal directions in which the rain-contamination is negligible. Then, the original image data in these directions are selected for wind direction and speed retrieval using the modified intensity-level-selection-based wind algorithm. The proposed method is applied to shipborne radar data collected from the east Coast of Canada. The comparison of the radar results with anemometer data shows that the standard deviations of wind direction and speed using the rain mitigation technique can be reduced by about 14.5° and 1.3 m/s, respectively. Full article
(This article belongs to the Special Issue Radar Systems for the Societal Challenges)
Show Figures

Graphical abstract

12863 KiB  
Article
Analyzing Parcel-Level Relationships between Urban Land Expansion and Activity Changes by Integrating Landsat and Nighttime Light Data
by Yimin Chen, Xiaoping Liu and Xia Li
Remote Sens. 2017, 9(2), 164; https://doi.org/10.3390/rs9020164 - 16 Feb 2017
Cited by 34 | Viewed by 5546
Abstract
Urban growth is a process that imposes profound physical and socioeconomic restructuring on cities. Urban land expansion as an immediate physical manifestation of urban growth has been extensively studied using a variety of remote sensing methods. However, little research addresses the interactions between [...] Read more.
Urban growth is a process that imposes profound physical and socioeconomic restructuring on cities. Urban land expansion as an immediate physical manifestation of urban growth has been extensively studied using a variety of remote sensing methods. However, little research addresses the interactions between urban land expansion and corresponding activity changes, especially at local scales. We propose an innovative analytical framework that integrates Landsat and nighttime light data to capture the parcel-level relationships between urban land expansion and activity changes. The urban land data are acquired based on the classification of Landsat images, whereas the activity changes are approximated by the nighttime light data. Using the Local Indicator of Spatial Association (LISA) (local Moran’s I) approach, four types of local relationships between land expansion and activity changes are defined at the parcel level. The proposed analytical framework is applied in Guangzhou, China, as a case study. The results reveal the mismatched growth between urban land and activity intensity at the parcel level, where the increase in urban land area outpaces the increase of activity intensity. Such results are expected to provide a more comprehensive understanding of urban growth, and can be used to assist urban planning and related decision-making. Full article
(This article belongs to the Special Issue Recent Advances in Remote Sensing with Nighttime Lights)
Show Figures

Graphical abstract

5567 KiB  
Article
Quantifying the Effects of Normalisation of Airborne LiDAR Intensity on Coniferous Forest Leaf Area Index Estimations
by Haotian You, Tiejun Wang, Andrew K. Skidmore and Yanqiu Xing
Remote Sens. 2017, 9(2), 163; https://doi.org/10.3390/rs9020163 - 16 Feb 2017
Cited by 27 | Viewed by 5523
Abstract
The range between a sensor and the target, the incidence angle, and the target reflectance, are known factors that can influence the intensity values of LiDAR data and consequently, its use in many applications. However, very few studies have provided a quantitative analysis [...] Read more.
The range between a sensor and the target, the incidence angle, and the target reflectance, are known factors that can influence the intensity values of LiDAR data and consequently, its use in many applications. However, very few studies have provided a quantitative analysis of the effects of normalisation of these three factors on forest leaf area index (LAI) estimations. In this paper, using two coniferous tree species (i.e., Scotch pine and Larch pine) as a case study, the effects of intensity normalisation on coniferous forest LAI estimations have, for the first time, been systematically examined and quantified. It was found that the intensity normalisation had a generally positive effect on the improvement of coniferous forest LAI estimations. However, the improvements were very minor. Specifically, the range normalisation did not improve the accuracy of the LAI estimation for either of the two coniferous tree species. The incidence angle and reflectance normalisation improved the accuracy of the LAI estimation for Scotch pine forests; however, they had no effect on the improvement of the LAI estimation for Larch pine forests. This experimental study suggests that range normalisation is not required for forest LAI estimations in areas with small elevation differences (i.e., less than 114 m). The incidence angle and target reflectance normalisation can marginally improve the accuracy of coniferous forest LAI estimations. However, the extent of this improvement varies among species, depending on the choice of incidence angle and reflectance coefficient. Overall, the effects of normalisation of airborne LiDAR intensity on coniferous forest LAI estimations are closely related to topographic conditions (i.e., elevation and slope), the tree species composition, and its associated structural attributes. Therefore, further research should explore the effects of LiDAR intensity normalisation on forest LAI estimations in regions with large elevation differences and diverse forest structures. Full article
Show Figures

Figure 1

1791 KiB  
Article
From Space to the Rocky Intertidal: Using NASA MODIS Sea Surface Temperature and NOAA Water Temperature to Predict Intertidal Logger Temperature
by Jessica R. P. Sutton and Venkat Lakshmi
Remote Sens. 2017, 9(2), 162; https://doi.org/10.3390/rs9020162 - 16 Feb 2017
Cited by 2 | Viewed by 4145
Abstract
The development of satellite-derived datasets has greatly facilitated large-scale ecological studies, as in situ observations are spatially sparse and expensive undertakings. We tested the efficacy of using satellite sea surface temperature (SST) collected by NASA’s Moderate Resolution Imaging Spectroradiometer (MODIS) and local water [...] Read more.
The development of satellite-derived datasets has greatly facilitated large-scale ecological studies, as in situ observations are spatially sparse and expensive undertakings. We tested the efficacy of using satellite sea surface temperature (SST) collected by NASA’s Moderate Resolution Imaging Spectroradiometer (MODIS) and local water temperature collected from NOAA buoys and onshore stations to estimate submerged intertidal mussel logger temperatures. Daily SST and local water temperatures were compared to mussel logger temperatures at five study sites located along the Oregon coastline. We found that satellite-derived SSTs and local water temperatures were similarly correlated to the submerged mussel logger temperatures. This finding suggests that satellite-derived SSTs may be used in conjunction with local water temperatures to understand the temporal and spatial variation of mussel logger temperatures. While there are limitations to using satellite-derived temperature for ecological studies, including issues with temporal and spatial resolution, our results are promising. Full article
Show Figures

Graphical abstract

5975 KiB  
Article
Algorithm Development for Land Surface Temperature Retrieval: Application to Chinese Gaofen-5 Data
by Yuanyuan Chen, Si-Bo Duan, Huazhong Ren, Jelila Labed and Zhao-Liang Li
Remote Sens. 2017, 9(2), 161; https://doi.org/10.3390/rs9020161 - 16 Feb 2017
Cited by 33 | Viewed by 4870
Abstract
Land surface temperature (LST) is a key variable in the study of the energy exchange between the land surface and the atmosphere. Among the different methods proposed to estimate LST, the quadratic split-window (SW) method has achieved considerable popularity. This method works well [...] Read more.
Land surface temperature (LST) is a key variable in the study of the energy exchange between the land surface and the atmosphere. Among the different methods proposed to estimate LST, the quadratic split-window (SW) method has achieved considerable popularity. This method works well when the emissivities are high in both channels. Unfortunately, it performs poorly for low land surface emissivities (LSEs). To solve this problem, assuming that the LSE is known, the constant in the quadratic SW method was calculated by maintaining the other coefficients the same as those obtained for the black body condition. This procedure permits transfer of the emissivity effect to the constant. The result demonstrated that the constant was influenced by both atmospheric water vapour content (W) and atmospheric temperature (T0) in the bottom layer. To parameterize the constant, an exponential approximation between W and T0 was used. A LST retrieval algorithm was proposed. The error for the proposed algorithm was RMSE = 0.70 K. Sensitivity analysis results showed that under the consideration of NEΔT = 0.2 K, 20% uncertainty in W and 1% uncertainties in the channel mean emissivity and the channel emissivity difference, the RMSE was 1.29 K. Compared with AST 08 product, the proposed algorithm underestimated LST by about 0.8 K for both study areas when ASTER L1B data was used as a proxy of Gaofen-5 (GF-5) satellite data. The GF-5 satellite is scheduled to be launched in 2017. Full article
Show Figures

Graphical abstract

627 KiB  
Addendum
Addendum: Faivre, R.; Colin, J.; Menenti, M. Evaluation of Methods for Aerodynamic Roughness Length Retrieval from Very High-Resolution Imaging LIDAR Observations over the Heihe Basin in China. Remote Sens. 2017, 9, 63
by Robin Faivre, Jérôme Colin and Massimo Menenti
Remote Sens. 2017, 9(2), 157; https://doi.org/10.3390/rs9020157 - 16 Feb 2017
Cited by 34 | Viewed by 2717
Abstract
This work presented in [1] was partly supported by the ESA Dragon 2 programme under proposal no. 5322: ”Key Eco-Hydrological Parameters Retrieval and Land Data Assimilation System Development in a Typical Inland River Basin of China’s Arid Region”, a project which was coordinated [...] Read more.
This work presented in [1] was partly supported by the ESA Dragon 2 programme under proposal no. 5322: ”Key Eco-Hydrological Parameters Retrieval and Land Data Assimilation System Development in a Typical Inland River Basin of China’s Arid Region”, a project which was coordinated at Delft University of Technology (TU Delft) with Massimo Menenti as the Lead Investigator.[...] Full article
11789 KiB  
Article
Assessing Orographic Variability in Glacial Thickness Changes at the Tibetan Plateau Using ICESat Laser Altimetry
by Vu Hien Phan, Roderik Lindenbergh and Massimo Menenti
Remote Sens. 2017, 9(2), 160; https://doi.org/10.3390/rs9020160 - 15 Feb 2017
Cited by 7 | Viewed by 5161
Abstract
Monitoring glacier changes is essential for estimating the water mass balance of the Tibetan Plateau. In this study, we exploit ICESat laser altimetry data in combination with the SRTM DEM and the GLIMS glacier mask to estimate trends in change in glacial thickness [...] Read more.
Monitoring glacier changes is essential for estimating the water mass balance of the Tibetan Plateau. In this study, we exploit ICESat laser altimetry data in combination with the SRTM DEM and the GLIMS glacier mask to estimate trends in change in glacial thickness between 2003 and 2009 on the whole Tibetan Plateau. Considering acquisition conditions of ICESat measurements and terrain surface characteristics, annual glacier elevation trends were estimated for 15 different settings with respect to terrain slope and roughness. In the end, we only included ICESat elevations acquired over terrain with a slope below 20° and a roughness at the footprint scale below 15 m. With this setting, 90 glaciated areas could be distinguished. The results show that most of observed glaciated areas on the Tibetan Plateau are thinning, except for some glaciers in the northwest. In general, glacier elevations on the whole Tibetan Plateau decreased at an average rate of -0.17± 0.47 m per year (m a-1) between 2003 and 2009, taking together glaciers of any size, distribution, and location of the observed glaciated area. Both rate and rate error estimates are obtained by accumulating results from individual regions using least squares techniques. Our results notably show that trends in glacier thickness change indeed strongly depend on the relative position in a mountain range. Full article
Show Figures

Graphical abstract

3885 KiB  
Article
Using UAS Hyperspatial RGB Imagery for Identifying Beach Zones along the South Texas Coast
by Lihong Su and James Gibeaut
Remote Sens. 2017, 9(2), 159; https://doi.org/10.3390/rs9020159 - 15 Feb 2017
Cited by 25 | Viewed by 5633
Abstract
Shoreline information is fundamental for understanding coastal dynamics and for implementing environmental policy. The analysis of shoreline variability usually uses a group of shoreline indicators visibly discernible in coastal imagery, such as the seaward vegetation line, wet beach/dry beach line, and instantaneous water [...] Read more.
Shoreline information is fundamental for understanding coastal dynamics and for implementing environmental policy. The analysis of shoreline variability usually uses a group of shoreline indicators visibly discernible in coastal imagery, such as the seaward vegetation line, wet beach/dry beach line, and instantaneous water line. These indicators partition a beach into four zones: vegetated land, dry sand or debris, wet sand, and water. Unmanned aircraft system (UAS) remote sensing that can acquire imagery with sub-decimeter pixel size provides opportunities to map these four beach zones. This paper attempts to delineate four beach zones based on UAS hyperspatial RGB (Red, Green, and Blue) imagery, namely imagery of sub-decimeter pixel size, and feature textures. Besides the RGB images, this paper also uses USGS (the United States Geological Survey) Munsell HSV (Hue, Saturation, and Value) and CIELUV (the CIE 1976 (L*, u*, v*) color space) images transformed from an RGB image. The four beach zones are identified based on the Gray Level Co-Occurrence Matrix (GLCM) and Local Binary Pattern (LBP) textures. Experiments were conducted with South Padre Island photos acquired by a Nikon D80 camera mounted on the US-16 UAS during March 2014. The results show that USGS Munsell hue can separate land and water reliably. GLCM and LBP textures can slightly improve classification accuracies by both unsupervised and supervised classification techniques. The experiments also indicate that we could reach acceptable results on different photos while using training data from another photo for site-specific UAS remote sensing. The findings imply that parallel processing of classification is feasible. Full article
(This article belongs to the Special Issue Recent Trends in UAV Remote Sensing)
Show Figures

Graphical abstract

12125 KiB  
Article
Seasonal Change in Wetland Coherence as an Aid to Wetland Monitoring
by Brian Brisco, Frank Ahern, Kevin Murnaghan, Lori White, Francis Canisus and Philip Lancaster
Remote Sens. 2017, 9(2), 158; https://doi.org/10.3390/rs9020158 - 15 Feb 2017
Cited by 50 | Viewed by 7936
Abstract
Water is an essential natural resource, and information about surface water conditions can support a wide variety of applications, including urban planning, agronomy, hydrology, electrical power generation, disaster relief, ecology and preservation of natural areas. Synthetic Aperture Radar (SAR) is recognized as an [...] Read more.
Water is an essential natural resource, and information about surface water conditions can support a wide variety of applications, including urban planning, agronomy, hydrology, electrical power generation, disaster relief, ecology and preservation of natural areas. Synthetic Aperture Radar (SAR) is recognized as an important source of data for monitoring surface water, especially under inclement weather conditions, and is used operationally for flood mapping applications. The canopy penetration capability of the microwaves also allows for mapping of flooded vegetation as a result of enhanced backscatter from what is generally believed to be a double-bounce scattering mechanism between the water and emergent vegetation. Recent investigations have shown that, under certain conditions, the SAR response signal from flooded vegetation may remain coherent during repeat satellite over-passes, which can be exploited for interferometric SAR (InSAR) measurements to estimate changes in water levels and water topography. InSAR results also suggest that coherence change detection (CCD) might be applied to wetland monitoring applications. This study examines wetland vegetation characteristics that lead to coherence in RADARSAT-2 InSAR data of an area in eastern Canada with many small wetlands, and determines the annual variation in the coherence of these wetlands using multi-temporal radar data. The results for a three-year period demonstrate that most swamps and marshes maintain coherence throughout the ice-/snow-free time period for the 24-day repeat cycle of RADARSAT-2. However, open water areas without emergent aquatic vegetation generally do not have suitable coherence for CCD or InSAR water level estimation. We have found that wetlands with tree cover exhibit the highest coherence and the least variance; wetlands with herbaceous cover exhibit high coherence, but also high variability of coherence; and wetlands with shrub cover exhibit high coherence, but variability intermediate between treed and herbaceous wetlands. From this knowledge, we have developed a novel image product that combines information about the magnitude of coherence and its variability with radar brightness (backscatter intensity). This product clearly displays the multitude of small wetlands over a wide area. With an interpretation key we have also developed, it is possible to distinguish different wetland types and assess year-to-year changes. In the next few years, satellite SAR systems, such as the European Sentinel and the Canadian RADARSAT Constellation Mission (RCM), will provide rapid revisit capabilities and standard data collection modes, enhancing the operational application of SAR data for assessing wetland conditions and monitoring water levels using InSAR techniques. Full article
(This article belongs to the Special Issue Remote Sensing of Climate Change and Water Resources)
Show Figures

Graphical abstract

2498 KiB  
Article
Combining Airborne Laser Scanning and Aerial Imagery Enhances Echo Classification for Invasive Conifer Detection
by Jonathan P. Dash, Grant D. Pearse, Michael S. Watt and Thomas Paul
Remote Sens. 2017, 9(2), 156; https://doi.org/10.3390/rs9020156 - 15 Feb 2017
Cited by 14 | Viewed by 5302
Abstract
The spread of exotic conifers from commercial plantation forests has significant economic and ecological implications. Accurate methods for invasive conifer detection are required to enable monitoring and guide control. In this research, we combined spectral information from aerial imagery with data from airborne [...] Read more.
The spread of exotic conifers from commercial plantation forests has significant economic and ecological implications. Accurate methods for invasive conifer detection are required to enable monitoring and guide control. In this research, we combined spectral information from aerial imagery with data from airborne laser scanning (ALS) to develop methods to identify invasive conifers using remotely-sensed data. We examined the effect of ALS pulse density and the height threshold of the training dataset on classification accuracy. The results showed that adding spectral values to the ALS metrics/variables in the training dataset led to significant increases in classification accuracy. The most accurate models (kappa range of 0.773–0.837) had either four or five explanatory variables, including ALS elevation, the near-infrared band and different combinations of ALS intensity and red and green bands. The best models were found to be relatively invariant to changes in pulse density (1–21 pls/m2) or the height threshold (0–2 m) used for the inclusion of data in the training dataset. This research has extended and improved the methods for scattered single tree detection and offered valuable insight into campaign settings for the monitoring of invasive conifers (tree weeds) using remote sensing approaches. Full article
(This article belongs to the Special Issue Fusion of LiDAR Point Clouds and Optical Images)
Show Figures

Figure 1

14297 KiB  
Article
A Parameterized Microwave Emissivity Model for Bare Soil Surfaces
by Yanhui Xie, Jiancheng Shi, Dabin Ji, Jiqin Zhong and Shuiyong Fan
Remote Sens. 2017, 9(2), 155; https://doi.org/10.3390/rs9020155 - 15 Feb 2017
Cited by 7 | Viewed by 4267
Abstract
Due to the difficulty in accurately interpreting surface emissivity spectra, problems remain in the application of passive microwave satellite observations over land surfaces. This study develops a parameterized soil surface emissivity model to quantify the microwave emissivity accurately and rapidly for Gaussian-correlated rough [...] Read more.
Due to the difficulty in accurately interpreting surface emissivity spectra, problems remain in the application of passive microwave satellite observations over land surfaces. This study develops a parameterized soil surface emissivity model to quantify the microwave emissivity accurately and rapidly for Gaussian-correlated rough surfaces. We first analyze the sensitivity of surface emissivity to parameters using the advanced integral equation model (AIEM) simulated data. On the basis of the analysis and previous empirical models, two function factors that consider the polarization dependence of surface reflectivity are developed in the parameterized soil surface emissivity model. These factors also comprehensively account for the effects of surface roughness, soil moisture, and incident angle. A comparison with the AIEM simulated data indicates that the absolute error of effective reflectivity estimated by the parameterized soil surface emissivity model is small with a magnitude of 10−2. Validation through experimental measurements suggests that a good agreement could be obtained. The parameterized soil surface emissivity model is applied to simulate satellite measurements of the Advanced Microwave Scanning Radiometer-Earth Observing System (AMSR-E). Compared with the commonly-used microwave land emissivity model developed by Weng et al. (2001), the simulation results using the parameterized soil surface emissivity model yield a lower root-mean-square error (RMSE) and the overall errors are reduced, particularly for horizontal polarization. The newly-developed parameterized soil surface emissivity model should be useful in improving our understanding and modeling the measurements of passive microwave radiometers. Full article
Show Figures

Graphical abstract

Previous Issue
Next Issue
Back to TopTop