


Highlights
What are the main findings?
- The proposed TLE-FEDformer framework demonstrates strong performance under short multi-temporal configurations performance in multi-sensor, multi-temporal flood inundation mapping, with an overall accuracy of 98.12%, an F1-score of 98.55%, and an IoU of 97.38% on the 2019 Aq Qala flood event, significantly outperforming baselines.
- Integration of transfer learning with pre-trained Xception backbones, cross-modal fusion of Sentinel-1 SAR and Sentinel-2 optical data, and frequency-domain temporal modeling via FEDformer effectively captures long-range flood dynamics, with robust generalization.
- Ablation studies and sensitivity analyses confirm the contributions of each component, demonstrating high computational efficiency and reliable uncertainty quantification, making the framework suitable for operational real-time flood monitoring and disaster response.
What are the implications of the main findings?
- The superior accuracy and robustness of TLE-FEDformer enables more reliable and timely flood inundation mapping, directly supporting improved early warning systems, rapid disaster response, and reduced socioeconomic impacts in flood-prone regions worldwide.
- By effectively integrating multi-sensor data with frequency-domain temporal modeling, the framework overcomes limitations of cloud cover and speckle noise, facilitating operational all-weather flood monitoring and enhancing decision-making during extreme events.
- Strong generalization capability and computational efficiency demonstrate the potential for scalable, real-time deployment on cloud platforms, paving the way for integration with hydrological models and multi-hazard risk assessment systems.
Abstract
Floods are among the most devastating natural hazards, intensified by climate change and rapid urbanization. This study introduces a novel deep learning framework, Transfer Learning-Enhanced FEDformer (TLE-FEDformer), designed for accurate and temporally consistent flood inundation mapping. The framework integrates pre-trained Xception backbones for robust multi-sensor feature extraction from Sentinel-1 Synthetic Aperture Radar (SAR) and Sentinel-2 optical imagery, a cross-modal fusion module to align heterogeneous modalities, and the Frequency Enhanced Decomposed Transformer (FEDformer) for efficient frequency-domain temporal modeling. This architecture effectively captures long-range dependencies and flood dynamics including onset, peak, duration, and recession, while addressing challenges such as cloud contamination, speckle noise, and limited labeled data. Comprehensive experiments demonstrate superior performance, achieving an overall accuracy of 98.12%, an F1-score of 98.55%, and an Intersection over Union (IoU) of 97.38%, outperforming baselines including Convolutional Neural Networks, Capsule Networks, and transfer learning alone. Ablation studies validate the contributions of each component, while sensitivity analyses confirm robustness across hyperparameters. Uncertainty quantification via Monte Carlo dropout highlights high confidence in core flooded regions. Preliminary generalization tests on independent events yield IoU > 94%, indicating strong transferability. TLE-FEDformer advances operational flood monitoring by providing reliable, scalable, and temporally consistent mapping from multi-sensor remote sensing data. This approach offers significant potential for real-time disaster response, early warning systems, and damage assessment in flood-prone regions worldwide.
1. Introduction
Floods remain one of the most devastating and frequent natural hazards worldwide, responsible for substantial socioeconomic losses, displacing millions annually, and causing long-term environmental degradation. According to the United Nations Office for Disaster Risk Reduction [1], floods accounted for over 40% of all natural disasters between 2000 and 2020, affecting more than 1.6 billion people and resulting in economic damage exceeding USD 1.5 trillion. The interplay of rapid urbanization, land-use/land-cover changes, and the escalating frequency and intensity of extreme precipitation events due to climate change—projected to increase flood risks by 20–50% in many regions by mid-century [2]—has dramatically heightened both the probability and severity of flood events [3]. These dynamics underscore the urgent need for accurate, rapid, scalable, and robust flood-mapping tools to facilitate early warning systems, damage assessment, and effective disaster response strategies.
Remote sensing has become an essential tool for flood monitoring across vast and often inaccessible areas, providing systematic, repeatable observations, opportunities for multi-sensor data fusion, and data acquisition under diverse weather and lighting conditions [4]. The synergistic integration of optical imagery (e.g., Sentinel-2) and synthetic aperture radar (SAR) data (e.g., Sentinel-1) is widely acknowledged as the most effective approach [5]. Optical sensors deliver high-resolution spectral information that excels in distinguishing open water surfaces, while SAR systems penetrate clouds and vegetation, enabling all-weather, day-night operations, which are particularly vital during monsoon or storm seasons when optical data are frequently obscured [6].
However, precise flood delineation from remote-sensing data is inherently challenging [7]. Optical imagery is prone to contamination by cloud cover, shadows, and atmospheric distortions, especially in tropical and subtropical zones [8]. SAR data, though weather-independent, are hampered by speckle noise, low contrast between water and urban surfaces (e.g., wet asphalt), radar shadows in built-up areas, and scattering effects over vegetated regions, leading to misclassifications in flooded vegetation [9]. Traditional threshold-based techniques and classical machine-learning algorithms often fail to address these nonlinear, multimodal, and context-dependent characteristics, particularly when temporal dynamics—such as flood onset, peak, and recession—must differentiate permanent water bodies from transient inundation [10,11].
Recent advancements in deep learning, particularly convolutional neural networks (CNNs), have significantly enhanced automated flood mapping by extracting hierarchical spectral-spatial features from multi-sensor data [12,13,14]. These models can be categorized into: (i) Single-modality approaches focusing on either optical or SAR data; (ii) fusion-based methods combining modalities for improved robustness; and (iii) temporal models incorporating change detection. For instance, CNN variants like U-Net have been adapted for SAR-based flood segmentation, achieving high accuracy in open areas but struggling with urban complexities. In the prior work of the authors, a Capsule Network (CapsNet) architecture was introduced to preserve part-to-whole spatial relationships via dynamic routing, demonstrating superior performance in urban environments [7]. Nonetheless, most CNN-based methods are limited to static single-date or bi-temporal analysis, overlooking the temporal evolution of floods—such as gradual inundation, persistence, and recession—which is crucial for hydrological modeling and damage estimation.
The emergence of Transformer-based architectures has revolutionized spatiotemporal sequence modeling in remote sensing [15,16,17]. Recent studies have applied vision Transformers for flood detection, leveraging self-attention mechanisms to capture global patterns in Sentinel-1 and Sentinel-2 imagery (e.g., [18]). These approaches have shown promise in semantic segmentation and time series analysis, with accuracies exceeding 80–85% on benchmark datasets. However, standard Transformers suffer from quadratic computational complexity and overfitting risks when labeled data are scarce, a common issue in flood scenarios due to the challenges of ground truth collection during disasters [19]. The Frequency-Enhanced Decomposed Transformer (FEDformer) addresses these limitations through frequency-domain decomposition and sparse attention via Fourier and wavelet transforms, efficiently capturing seasonal trends, periodic patterns, and abrupt changes that mirror flood dynamics [20,21,22]. Transfer learning further bolsters performance by initializing models with pre-trained weights (e.g., from ImageNet), accelerating convergence and enhancing generalization with limited samples [23].
Despite these progressions, few studies have integrated pre-trained multi-sensor feature extractors, robust cross-modal fusion, and frequency-aware temporal modeling into a unified, end-to-end framework for flood mapping. While vision Transformers have been explored for SAR-optical fusion (e.g., Automated Flood Detection from Sentinel-1 Time Series, 2025; AI-Driven Flood Mapping with Dual Satellite Imagery, 2025), they typically lack explicit handling of long multi-temporal sequences in the frequency domain, leading to a suboptimal capture of flood phases and reduced efficiency in operational settings. To the best of the authors’ knowledge, no prior work has combined all these elements: Transfer-learning-based extraction from optical and SAR inputs, heterogeneous modality alignment, FEDformer-driven temporal encoding/decoding, and a segmentation head for extent and depth estimation.
The current study introduces a novel hybrid deep-learning framework, Transfer Learning-Enhanced FEDformer (TLE-FEDformer), which seamlessly merges transfer-learning-enhanced multi-sensor feature extraction with FEDformer-based spatiotemporal modeling for accurate, robust, and temporally coherent flood inundation mapping. The primary contributions are:
- ▪
- An end-to-end architecture synergistically exploiting transfer learning and frequency-domain Transformer modeling (FEDformer) for multi-sensor, multi-temporal flood analysis.
- ▪
- A dedicated cross-modal fusion module that aligns optical and SAR features in a shared semantic space while retaining their complementary strengths under varying conditions.
- ▪
- Explicit modeling of extended multi-temporal sequences to detect and characterize flood onset, peak, duration, and recession phases, surpassing single- or bi-temporal methods.
- ▪
- Comprehensive benchmarking against demonstrates strong performance under short multi-temporal configurations CNN-, attention-, and hybrid architectures using metrics like Accuracy, F1-score, Intersection over Union (IoU), Kappa, and Area Under the Curve (AUC), plus cross-event/region generalization tests, sensitivity analysis, and uncertainty quantification to validate superiority and robustness.
The framework’s practical utility is demonstrated via a case study of the 2019 flood in Aq Qala County, northern Iran, including flood depth estimation for emergency response. The remainder of the paper is organized as follows: Section 2 describes the study area and datasets; Section 3 details the methodology; Section 4 presents experimental results and analyses; and Section 5 discusses implications, limitations, and conclusions.
2. Study Area and Datasets
2.1. Study Area
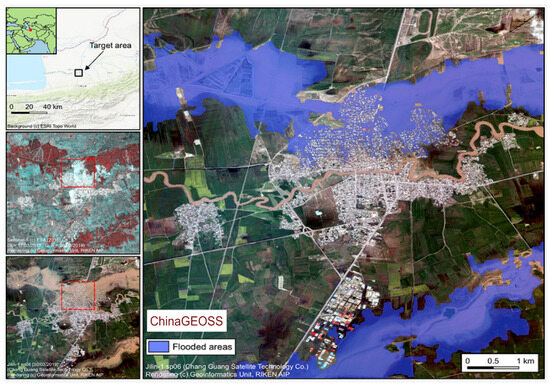
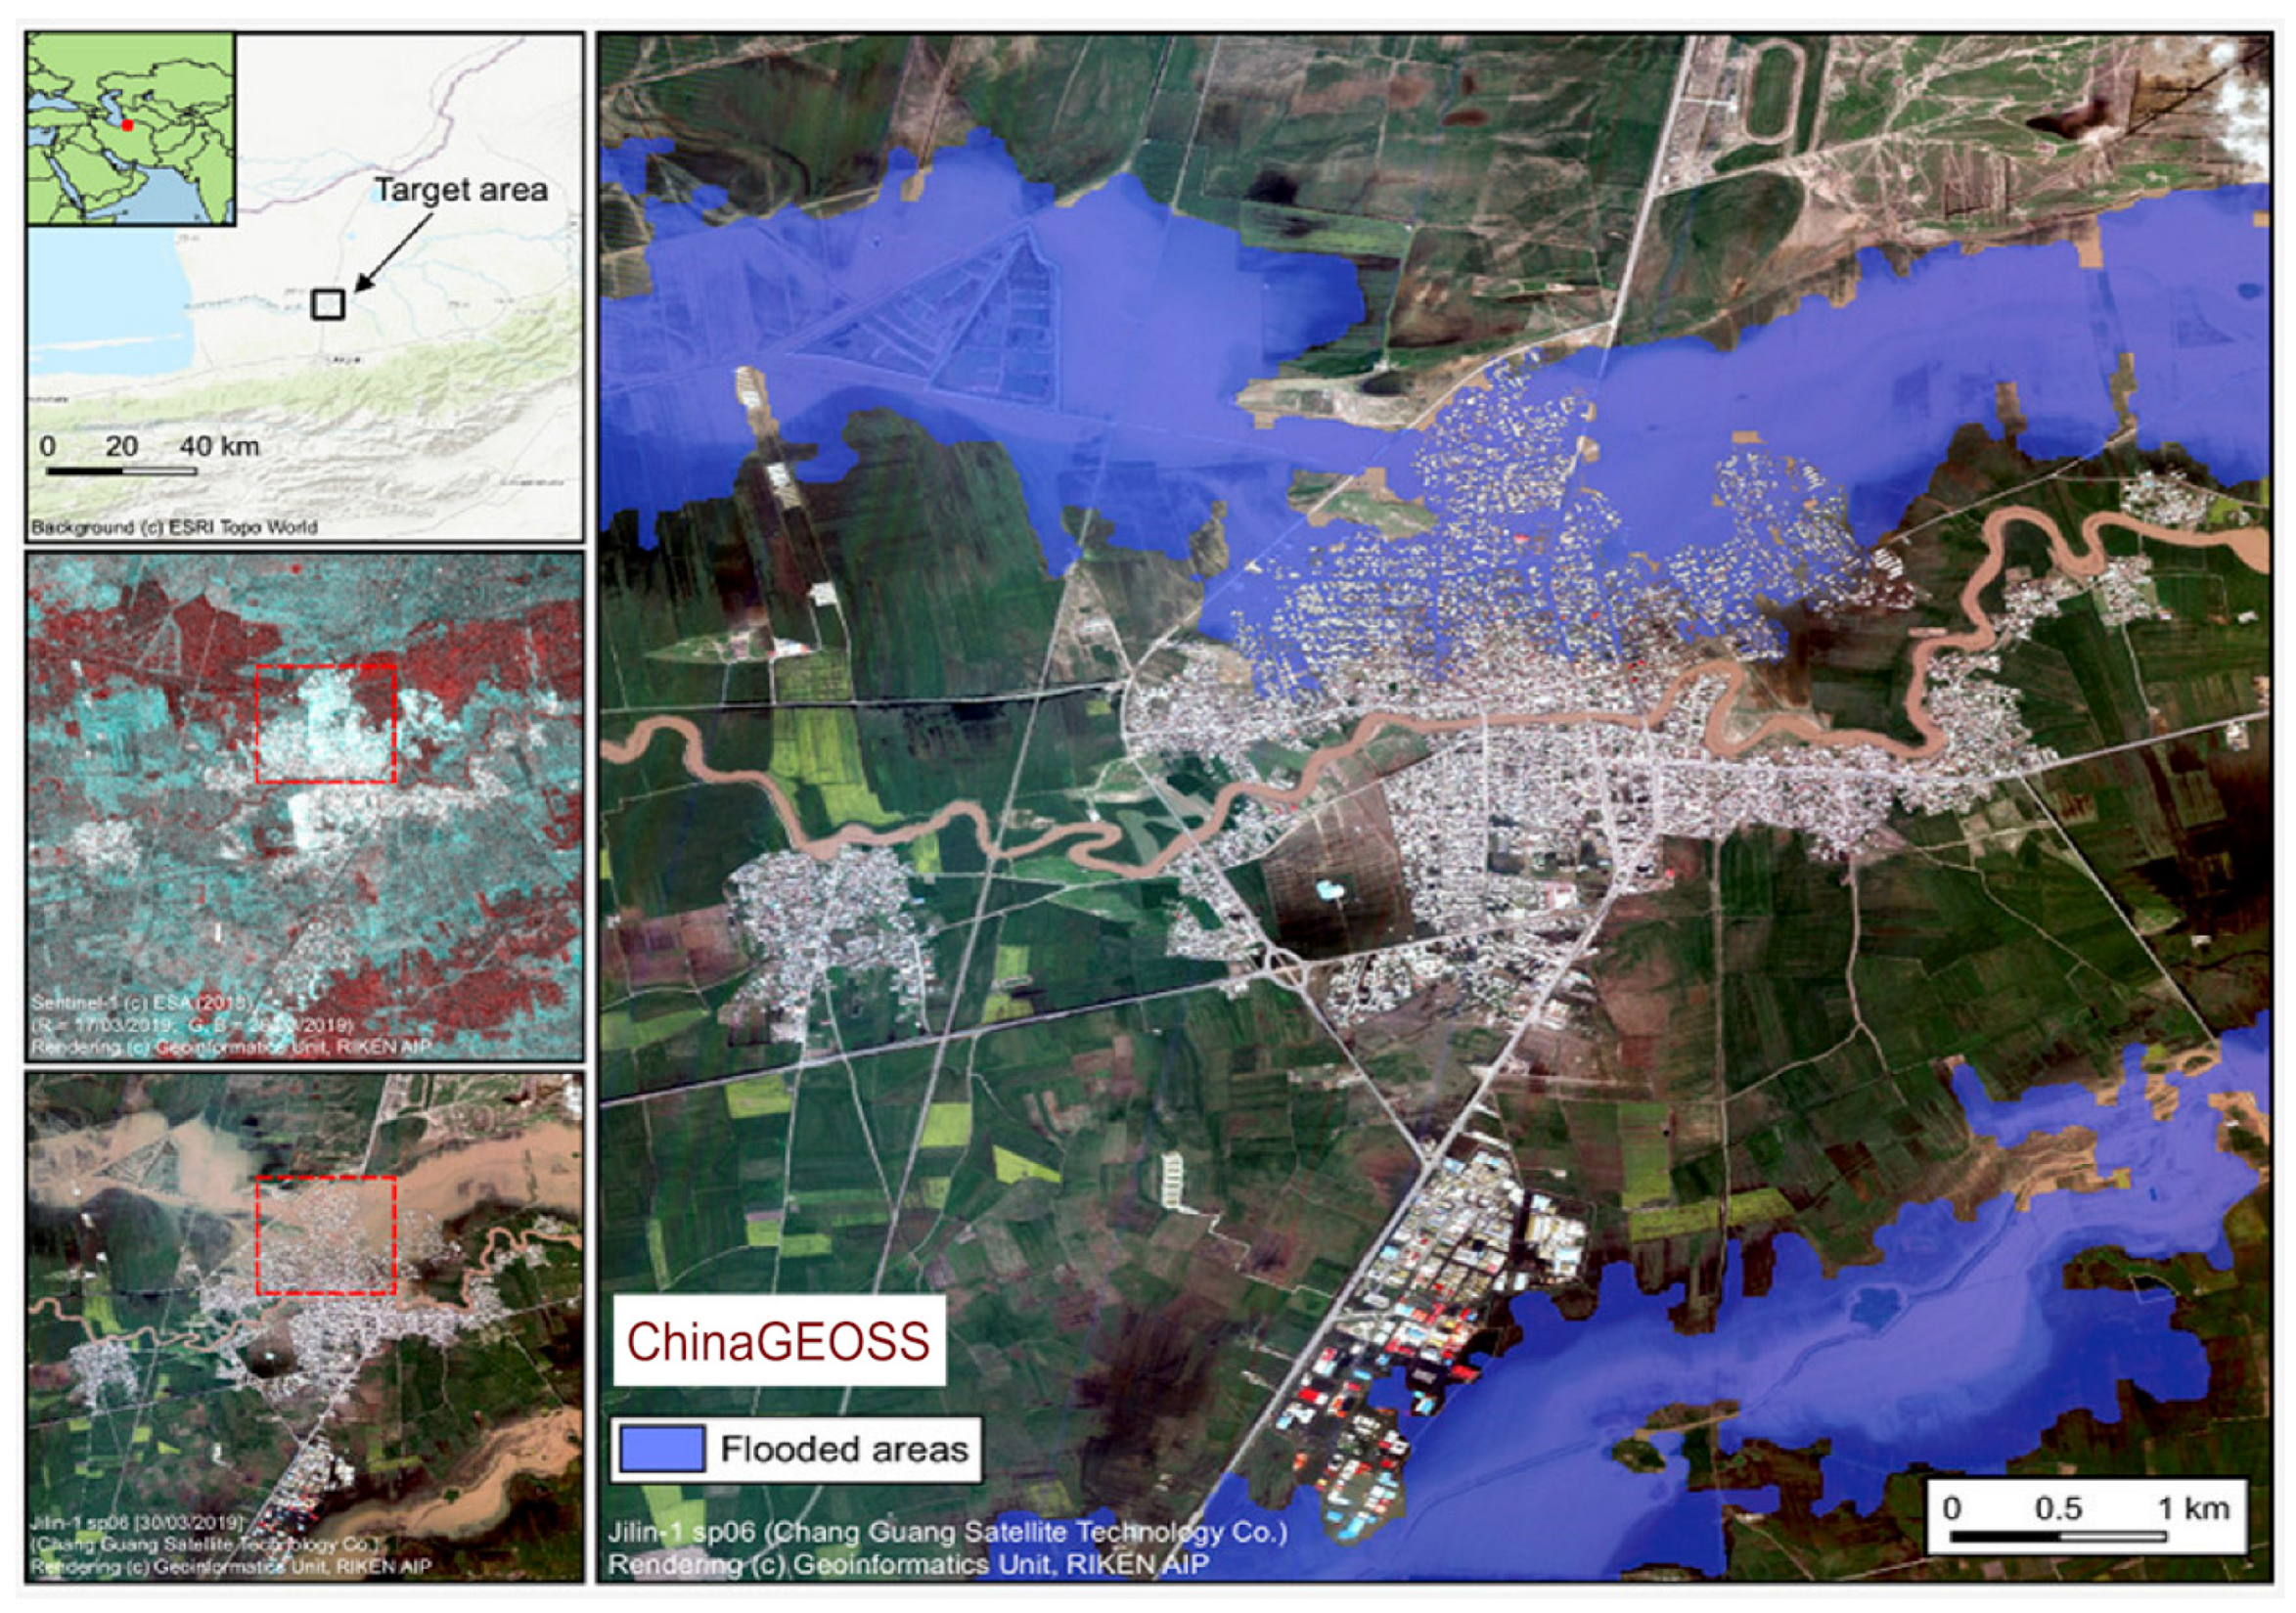
The study focuses on Aq Qala County, located in the Gorganrood River basin in Golestan Province, northern Iran (37°00′–37°20′N, 54°20′–54°40′E; Figure 1). The Gorganrood is the main river draining the basin, flowing approximately 200 km in an east-to-west direction before discharging into the Caspian Sea near the Khajeh Nafas region. The basin covers an area of about 10,000 km2, with elevations ranging from −26 m along the Caspian coastline to over 3600 m in the southern Alborz highlands [24,25]. The average slope of the basin is 1.27%, while the main river channel gradient is approximately 0.1%.
Figure 1.
Study area: AQ Qala in northern Iran.
The region experiences a temperate semi-arid climate with mean annual precipitation of around 450 mm and average temperatures of 17–18 °C. Precipitation is highly seasonal, concentrated in autumn and winter, often leading to intense rainfall events. Hydrological analyses indicate that the 500-year return period flood discharge exceeds 380 m3/s, far surpassing the river channel capacity of approximately 120 m3/s, resulting in frequent overbank flooding [26].
Aq Qala County was selected as the study area due to the devastating flood event of March 2019, triggered by extreme rainfall (approximately 330 mm in 24 h, representing 70% of the annual mean) on 19 March 2019 [27]. This event caused widespread inundation of urban and agricultural lands, highlighting the vulnerability of low-lying areas adjacent to the Gorganrood River. A topographic overview derived from the 30 m SRTM Digital Elevation Model [28] is presented in Figure 1.
2.2. Satellite Datasets
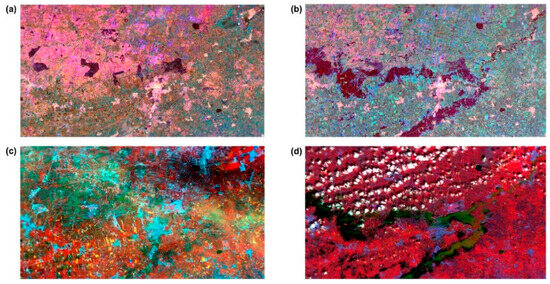
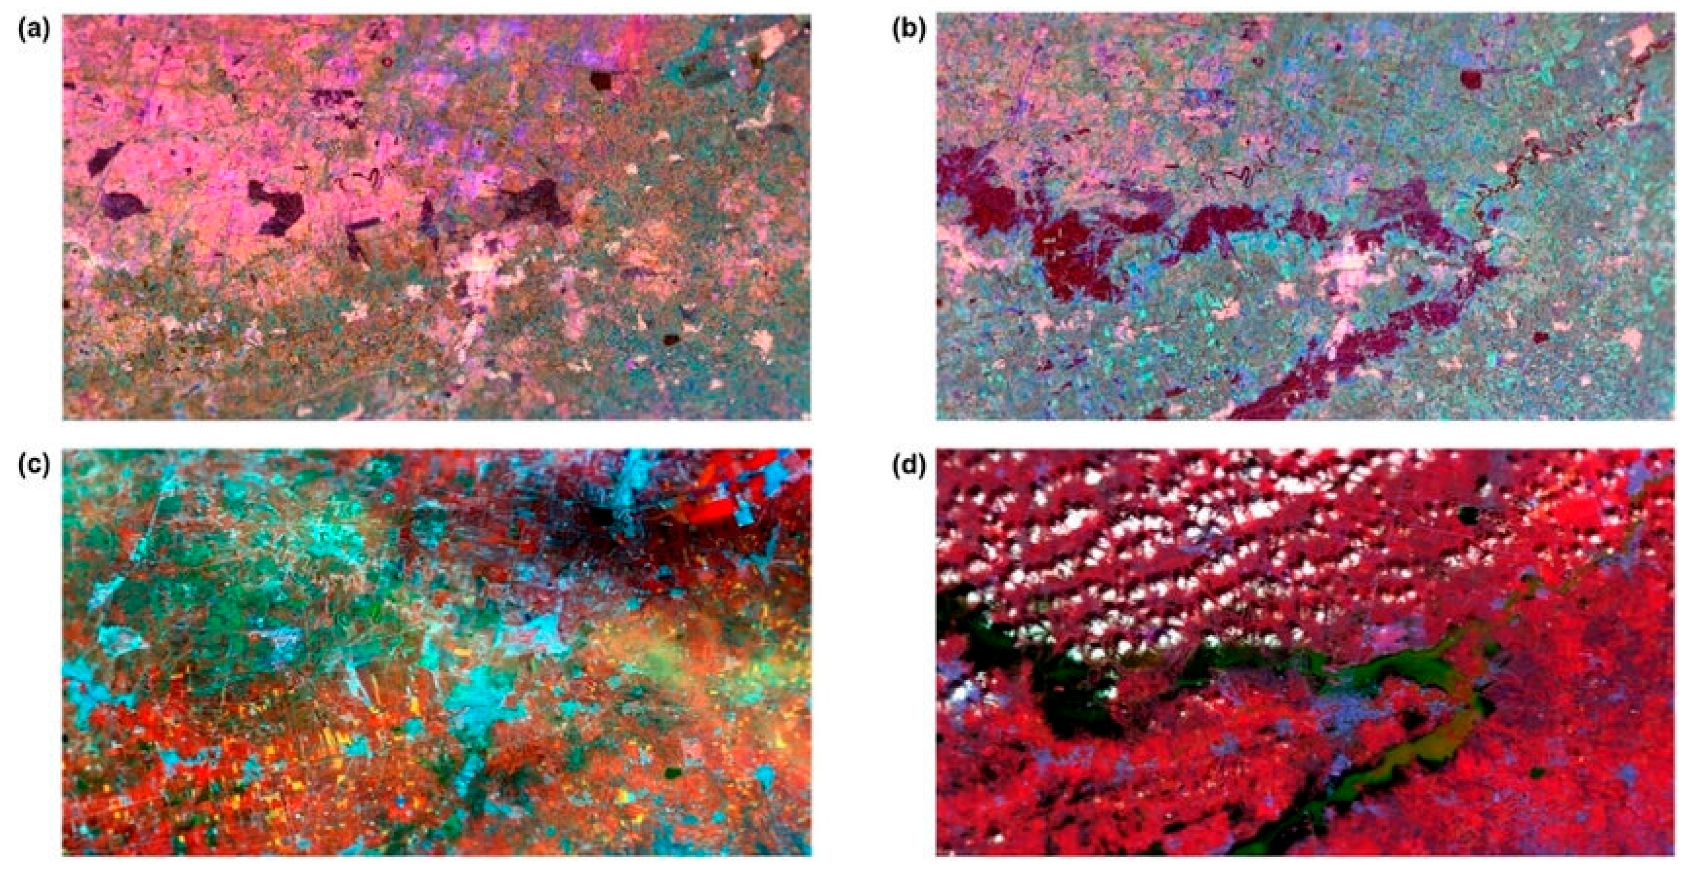
Multi-temporal Sentinel-1 SAR and Sentinel-2 optical imagery were used to capture pre-flood, during-flood, and post-flood conditions (Table 1; Figure 2). Sentinel-1 Ground Range Detected (GRD) products in the Interferometric Wide Swath mode (IW) were acquired with VV and VH polarizations at a spatial resolution of 10 m. Sentinel-2 Level-2A products provide atmospherically corrected surface reflectance in 13 spectral bands, with spatial resolutions of 10 m (visible and NIR), 20 m (red edge and SWIR), and 60 m (atmospheric bands).
Table 1.
Characteristics of Sentinel-1 and Sentinel-2 datasets used for mapping the 2019 Aq Qala flood event.
Figure 2.
Aq-Qala SAR data: (a) Coherence, intensity VH, intensity VV composite of 2019-03-11 (b) coherence, intensity VH, intensity VV composite of 2019-04-04. Aq Qala optical data: (c) R, NIR, SWIR composite of 2019-03-11 11.03.2019, and (d) R, NIR, SWIR composite of 2019-04-05 05.04.2019, see Ref. [7].
Six Sentinel-1 and five Sentinel-2 scenes spanning February to April 2019 were selected to cover the flood evolution phases (pre-flood: February 2019; peak: Late March 2019; recession: Early April 2019). All images were co-registered to a common grid using the Sentinel Application Platform (SNAP) tool.
Sentinel-1 preprocessing included: (i) Thermal and border noise removal, (ii) radiometric calibration to sigma-naught backscatter, (iii) multilook processing (2 × 2), (iv) refined Lee speckle filtering (3 × 3 window), and (v) Range-Doppler terrain correction using the 30 m SRTM DEM [29,30].
Sentinel-2 preprocessing comprised atmospheric correction via the Sen2Cor processor (v2.9), cloud masking, and resampling of 20 m and 60 m bands to 10 m resolution using nearest-neighbor interpolation [31]. Only scenes with cloud cover < 20% over the study area were retained for the optical analysis.
Table 1 summarizes the acquisition dates, sensor specifications, and key pre-processing steps. These complementary datasets provide the multi-sensor, multi-temporal input required for the proposed TLE-FEDformer framework.
3. Methodology
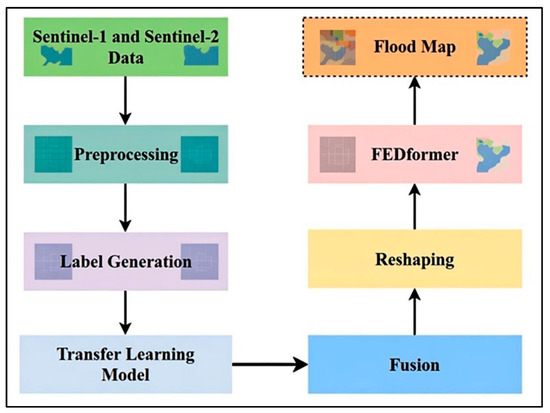
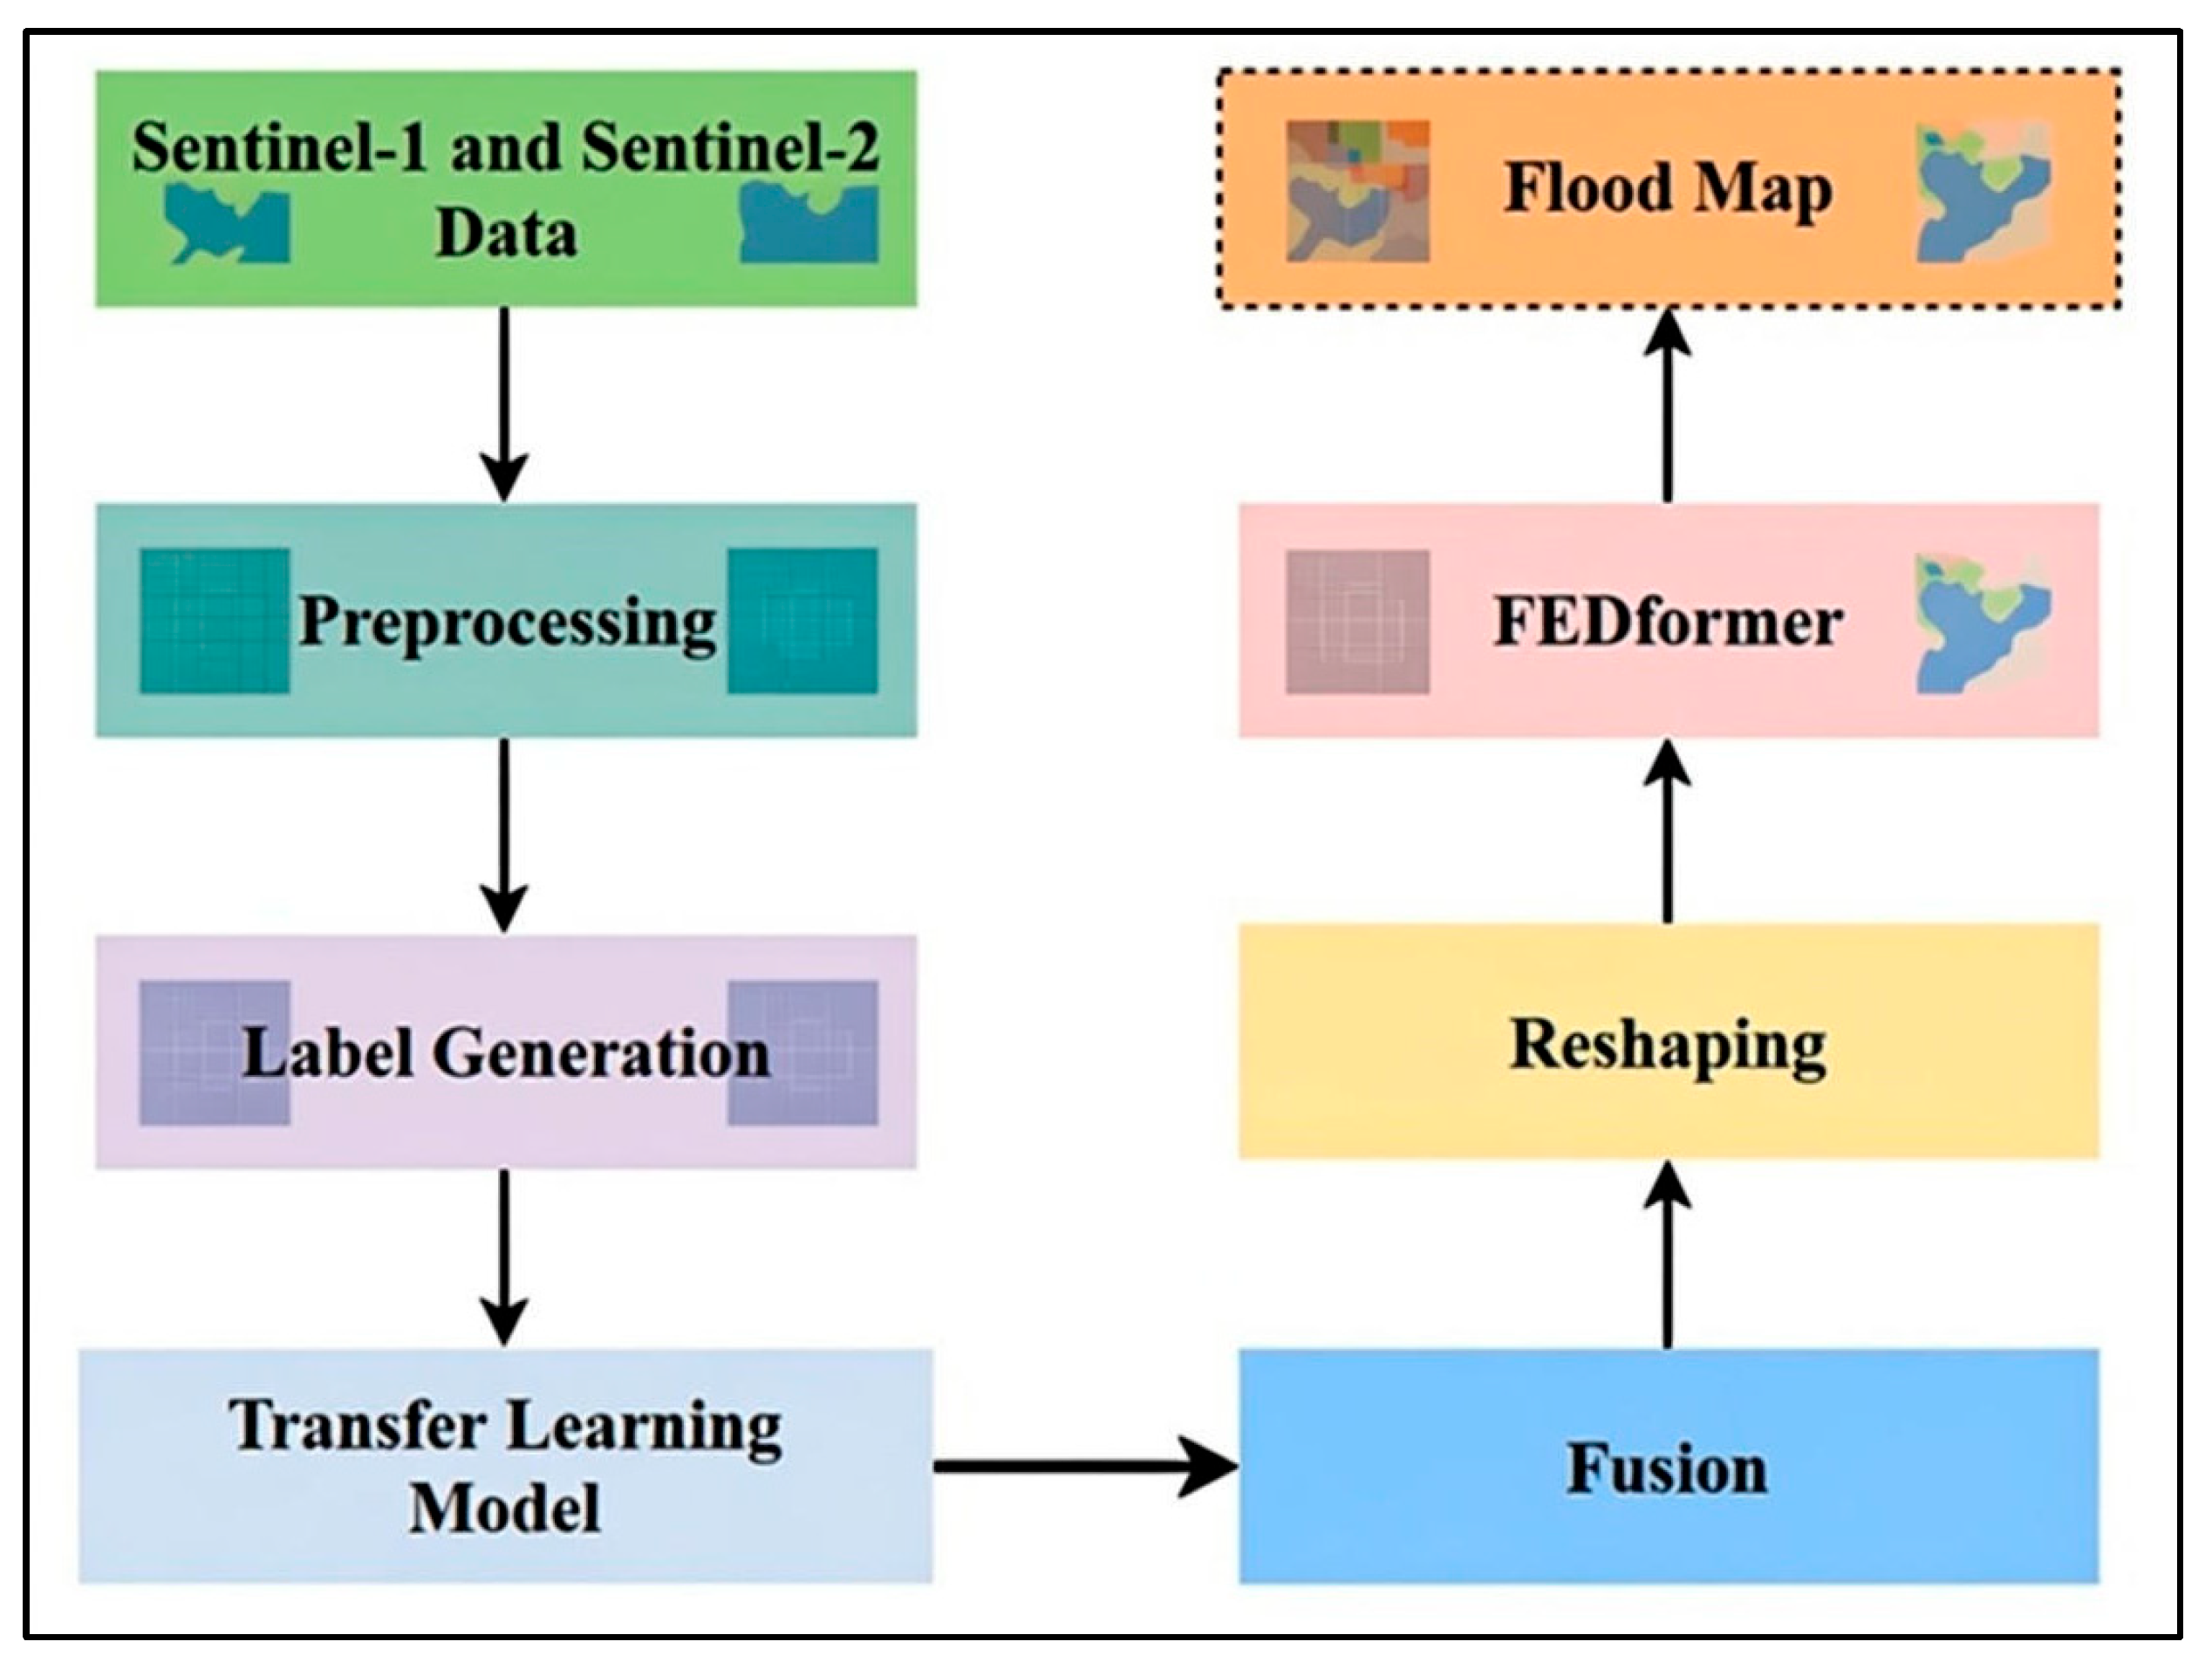
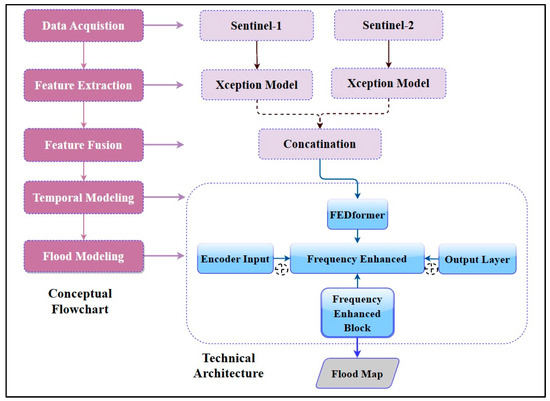
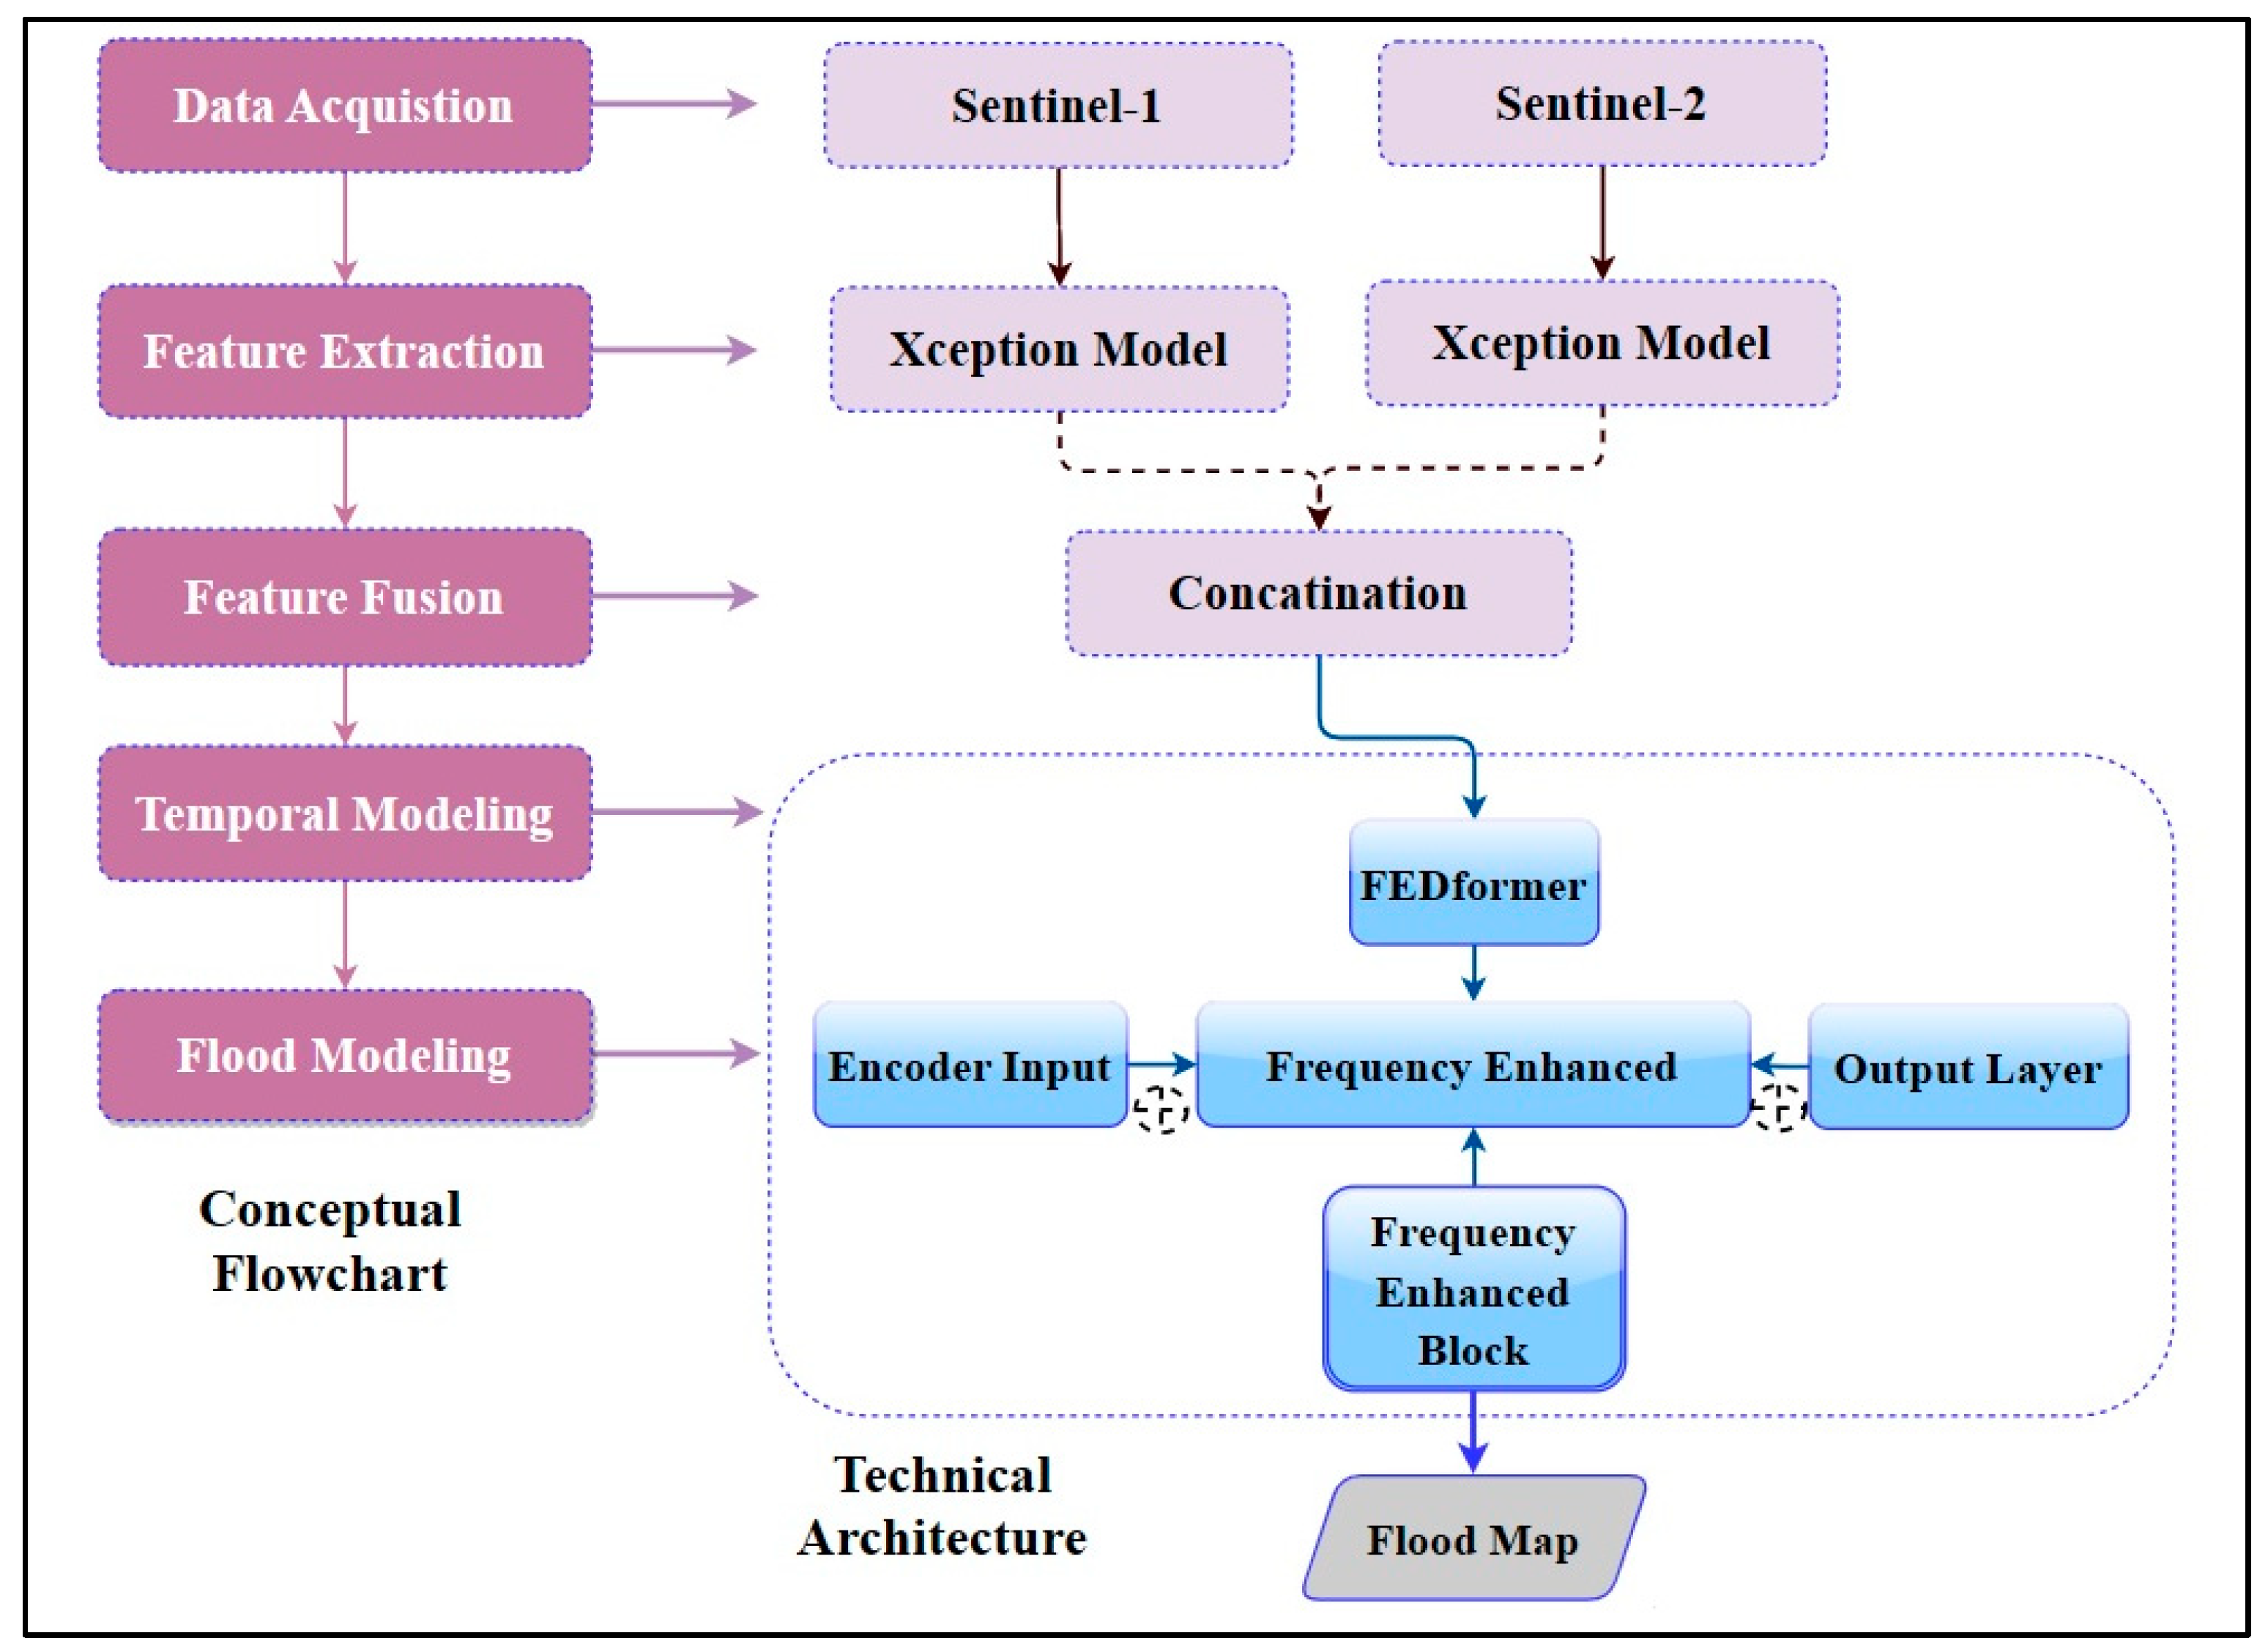
The proposed Transfer Learning-Enhanced FEDformer (TLE-FEDformer) framework integrates multi-source satellite imagery, transfer learning, cross-modal fusion, and frequency-aware temporal modeling to achieve accurate and temporally coherent flood inundation mapping. The overall processing pipeline is illustrated in Figure 3, and the detailed network architecture is shown in Figure 4.
Figure 3.
Overall flowchart of the proposed flood mapping methodology using Sentinel-1 and Sentinel-2 with deep learning framework.
Figure 4.
Detailed architecture of the proposed TLE-FEDformer framework, highlighting parallel Xception backbones, cross-modal fusion, and the FEDformer module with frequency-domain processing.
3.1. Overview of the Proposed Framework
The workflow begins with the acquisition of pre- and post-flood Sentinel-1 (SAR) and Sentinel-2 (optical) images, followed by sensor-specific preprocessing. High-confidence flood masks are automatically generated through the fusion of optical water indices and SAR change detection to serve as ground truth labels.
Spatial feature extraction is performed independently on each modality using pre-trained Xception networks. The extracted features are reshaped and fused into a unified representation, which is then processed as a temporal sequence by the FEDformer module. The FEDformer captures long-range temporal dependencies in the frequency domain to model flood dynamics (onset, peak, duration, and recession). Finally, a pixel-wise segmentation head produces high-resolution flood probability maps, which are thresholders for binary inundation maps and optionally converted to depth estimates using topographic information.
The model is trained end-to-end in a supervised manner using binary cross-entropy loss, with the Adam optimizer (learning rate = 1 × 10⁻⁴, β1 = 0.9, β2 = 0.999), batch size of 16, and 100 epochs. Training was conducted on an NVIDIA RTX 4090 GPU (NVIDIA Corporation, Santa Clara, CA, USA) with early stopping based on the F1-score.
3.2. Multi-Sensor Feature Extraction and Fusion
To effectively extract discriminative spatial features from heterogeneous satellite data under limited labeled samples, transfer learning with the Xception architecture [32] as the backbone is employed herein. Xception was chosen for its strong representational capacity and computational efficiency due to depth-wise separable convolutions.
Let and denote the preprocessed Sentinel-1 and Sentinel-2 input images, respectively. Separate Xception networks, initialized with ImageNet pre-trained weights, extract features as follows:
where and are the feature extractors, yielding feature maps with .
To enable joint temporal modeling, the features are reshaped into a sequence-compatible format and fused along the channel dimension:
A 1 × 1 convolutional layer with batch normalization and ReLU activation is applied to refine the fused representation and reduce domain gaps between optical and SAR modalities.
3.3. Frequency-Enhanced Temporal Modeling with FEDformer
The fused features form a temporal sequence , where T is the number of time steps (typically 2–6 for pre/post-flood and intermediate observations). In the current study, Frequency-Enhanced Decomposed Transformer (FEDformer) is utilized to model long-range temporal dependencies efficiently in the frequency domain [22,33]. FEDformer first decomposes the input sequence into trend and seasonal components using a Mixture-of-Experts (MOE) decomposition module:
where are moving average operations with different window sizes, and are learnable weights ().
Although FEDformer was originally proposed for long-term time-series forecasting, in this study it is employed primarily for its frequency-enhanced attention mechanism rather than its long-horizon prediction. Even with short temporal sequences (2–6 time-steps), spectral decomposition facilitates the separation of stable background components from abrupt flood-induced variations, improving temporal feature representation. Comparative experiments show performance gain over purely spatial models.
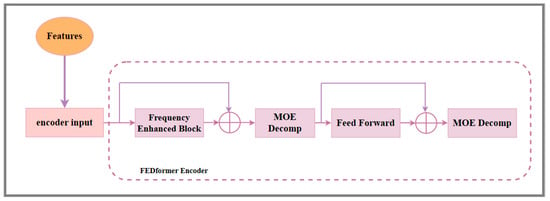
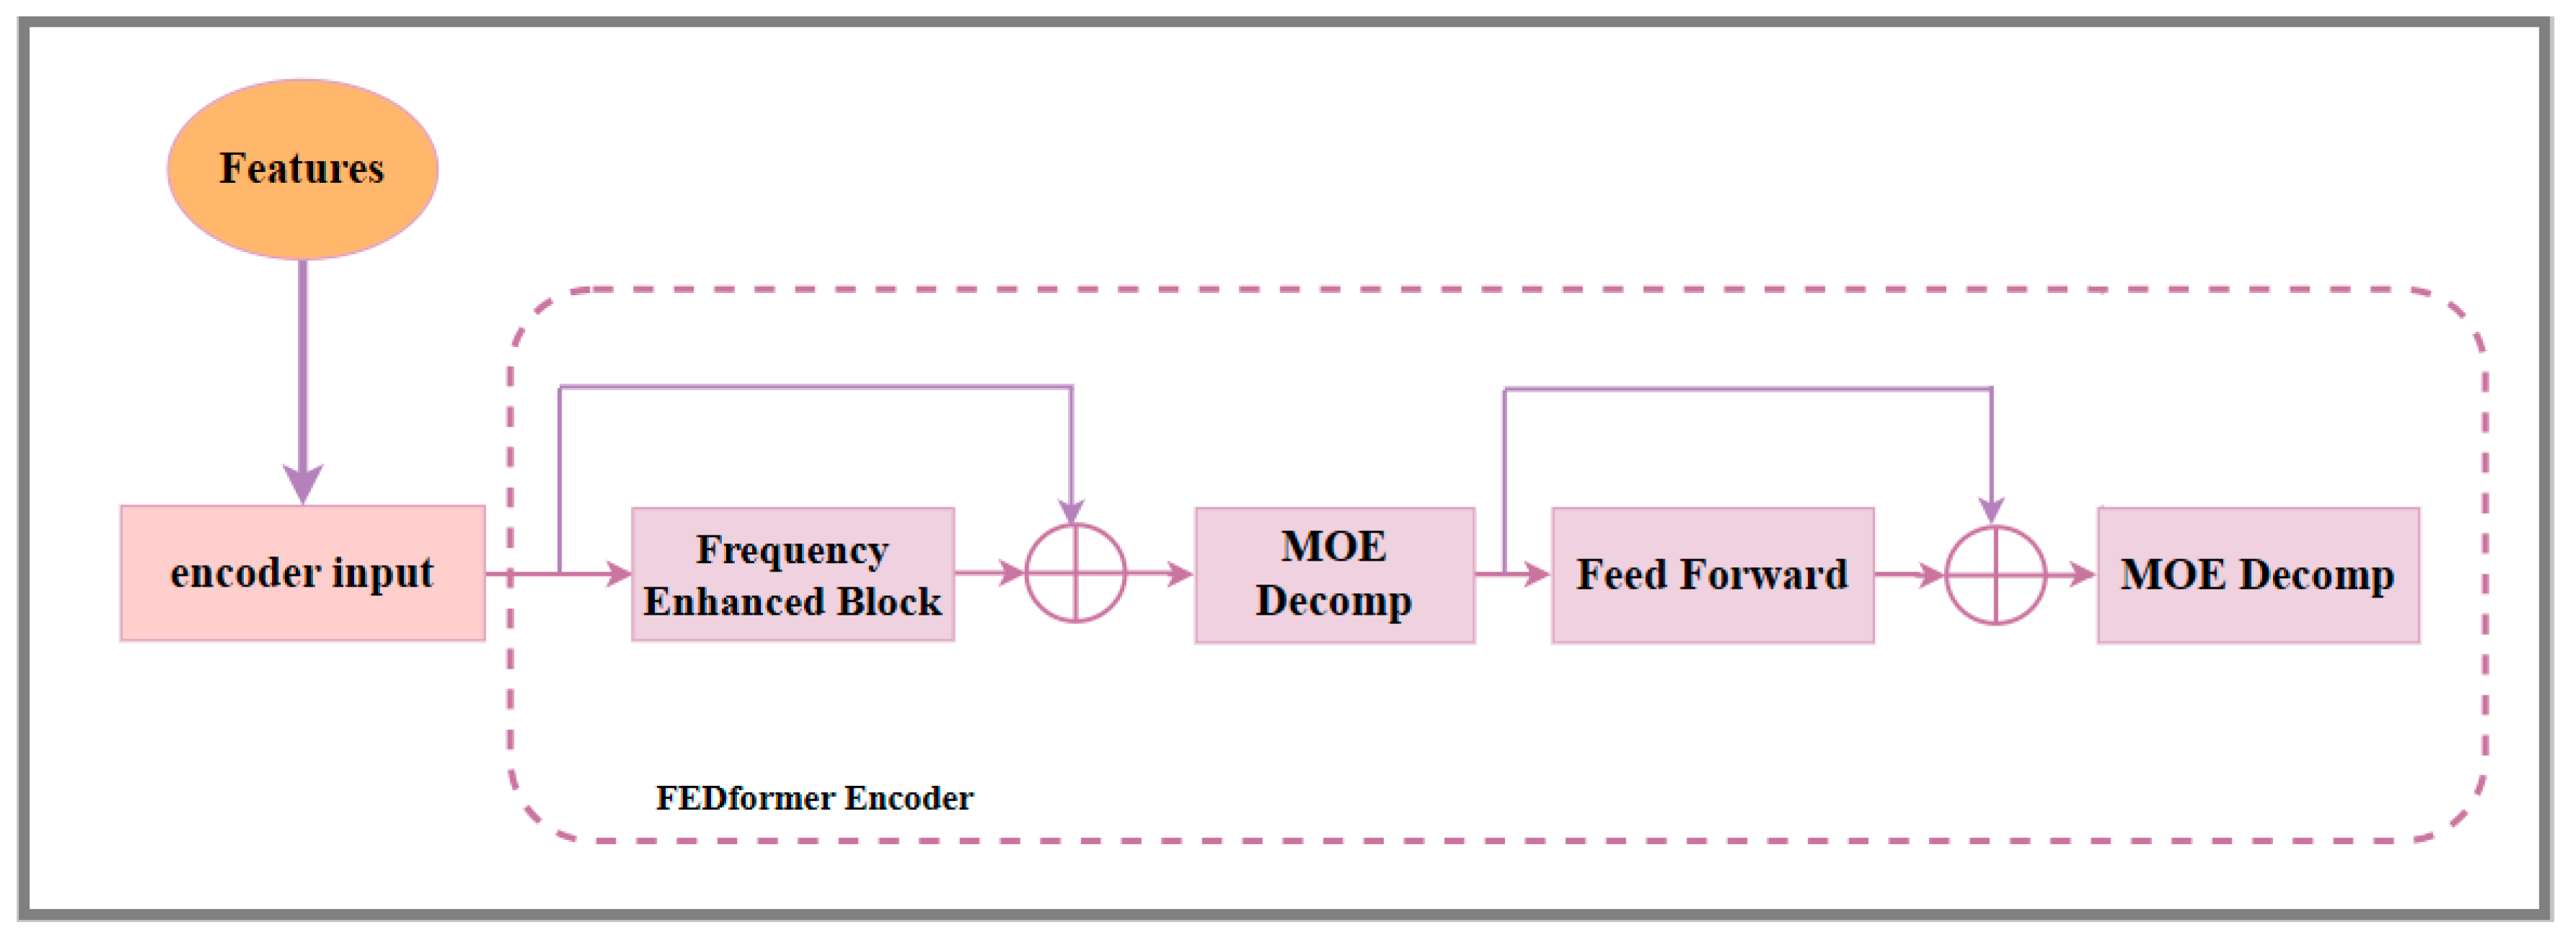
Encoder: Consists of L = 4 stacked layers. The seasonal component is transformed to the frequency domain via Fast Fourier Transform (FFT), dominant frequencies are retained, and the signal is reconstructed with inverse FFT (iFFT):
where is a frequency mask. The trend component is processed via simple moving average. Each layer includes frequency-enhanced feed-forward networks, residual connections, and layer normalization (Figure 5).
Figure 5.
Encoder structure of the FEDformer in the deep learning framework in the TLE-FEDformer framework.
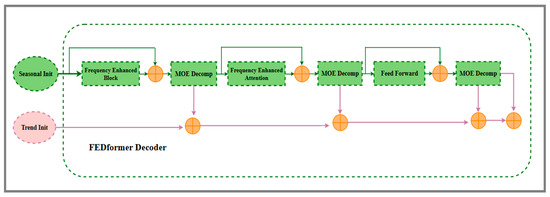
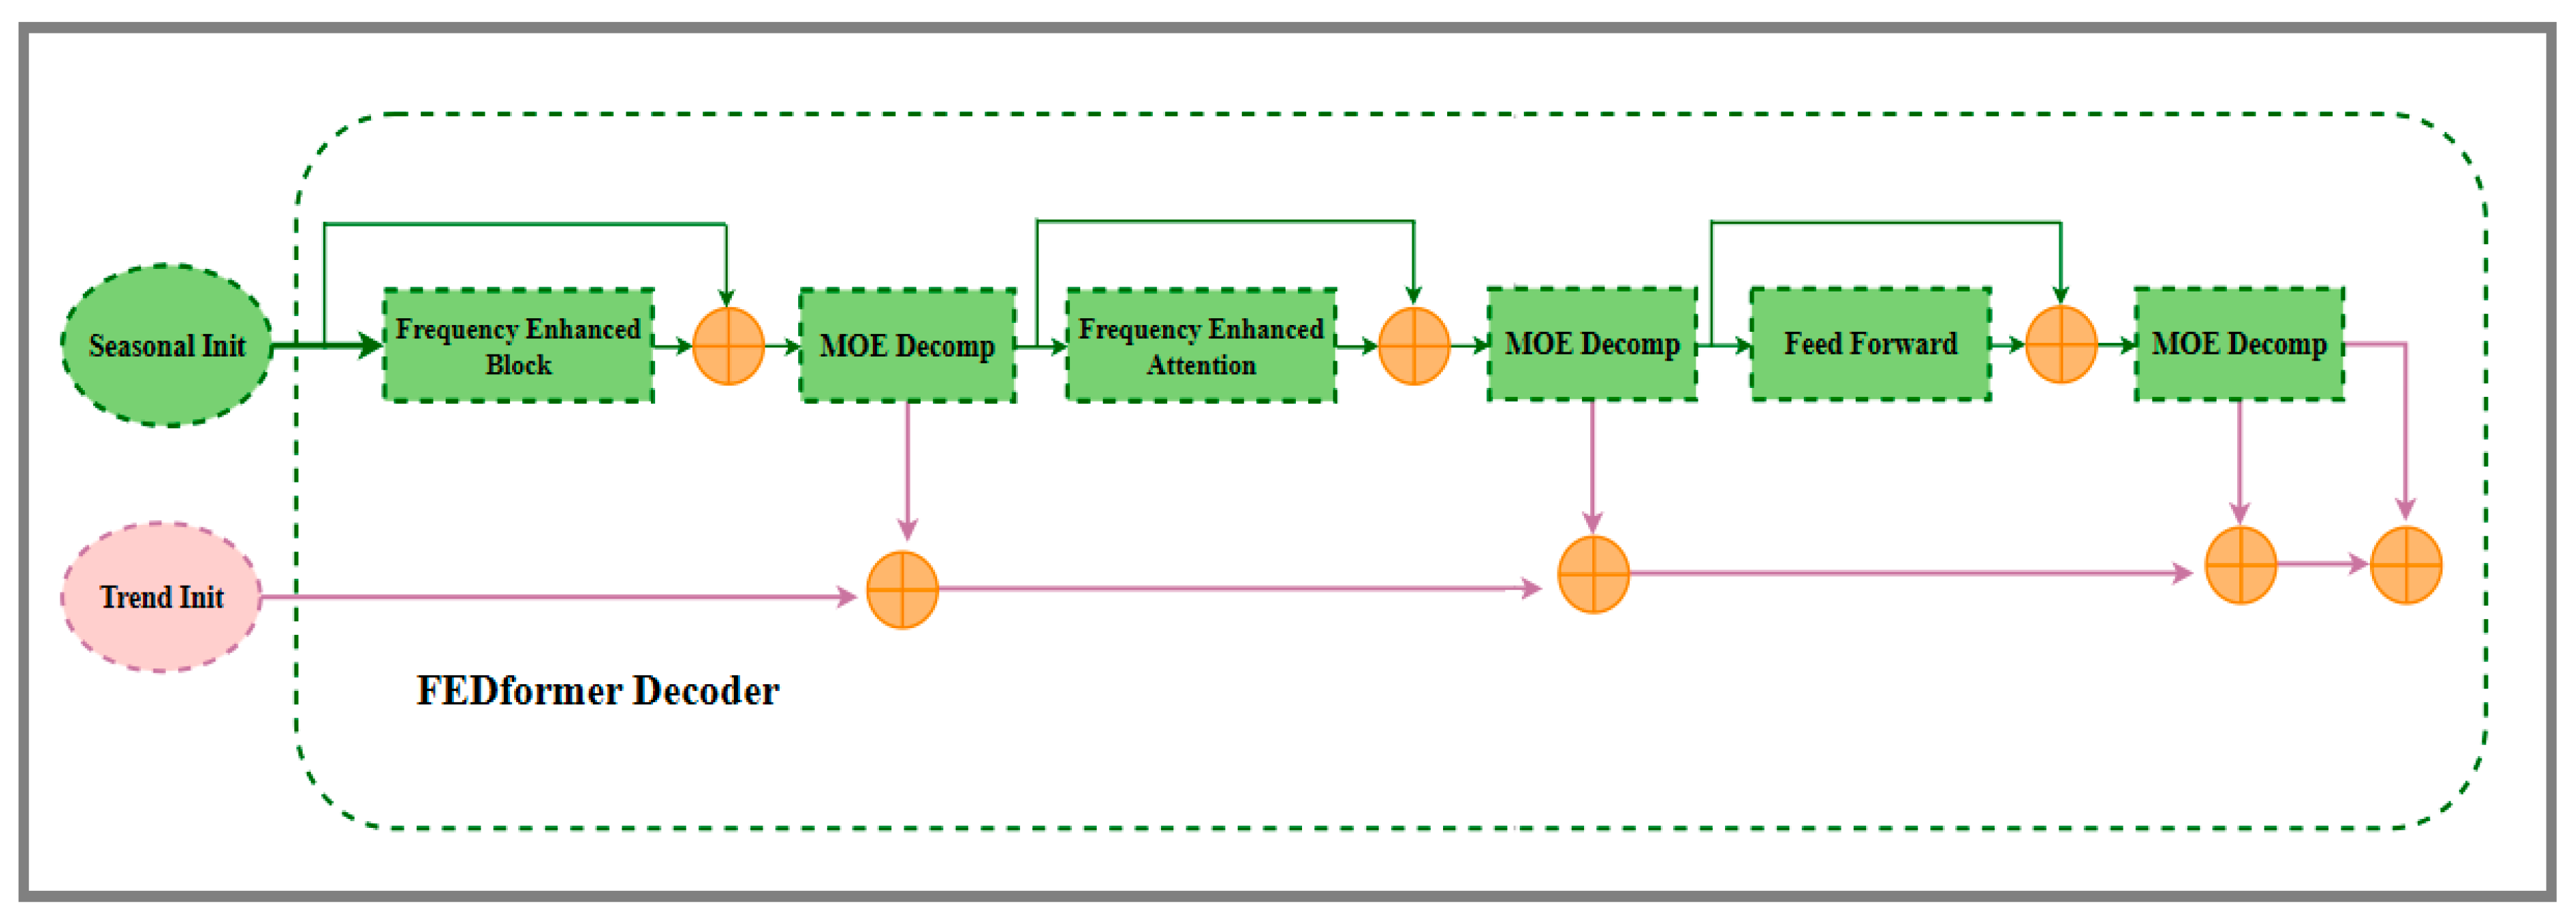
Decoder: Mirrors the encoder structure with L = 4 layers. It employs frequency-domain cross-attention:
where , , are frequency-domain representations of query, key, and value. The final output is reconstructed via MOE decomposition and projected to the original resolution using bilinear up-sampling, yielding the flood probability map (Figure 6).
Figure 6.
Decoder structure of the FEDformer in the deep learning framework in the TLE-FEDformer framework.
The computational complexity is , significantly more efficient than standard Transformers for long sequences. In the present study, was set to two for all experiments. This value was empirically selected through validation experiments (), where provided the best trade-off between noise suppression and preservation of discriminative temporal variations. The frequency selection mask was fixed during training and was not learnable. This design choice was made to reduce the risk of overfitting under limited multi-temporal samples, and to maintain the interpretability of the spectral filtering process.
3.4. Ground Truth Generation and Evaluation Protocol
Ground truth flood masks were generated through a conservative multi-source fusion strategy to ensure high labeling reliability. From Sentinel-2 optical data, three complementary water indices were computed:
- Normalized Difference Water Index (NDWI): (G − NIR)/(G + NIR)
- Modified NDWI (MNDWI): (G − SWIR1)/(G + SWIR1)
- Automated Water Extraction Index (AWEI): 4(Green − SWIR1) − (0.25 NIR + 2.75 SWIR2)
Thresholds were determined adaptively using Otsu’s method, applied to local histograms to reduce scene-dependent bias. A pixel was considered as a candidate flood pixel only if all three optical indices simultaneously exceeded their respective thresholds (intersection rule), thereby increasing label confidence and reducing index-specific uncertainty.
For Sentinel-1 SAR data, radiometric change detection was performed on the VH polarization:
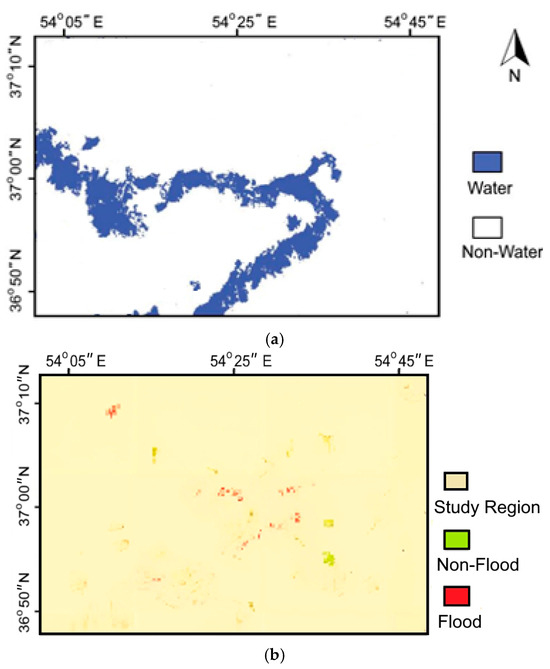
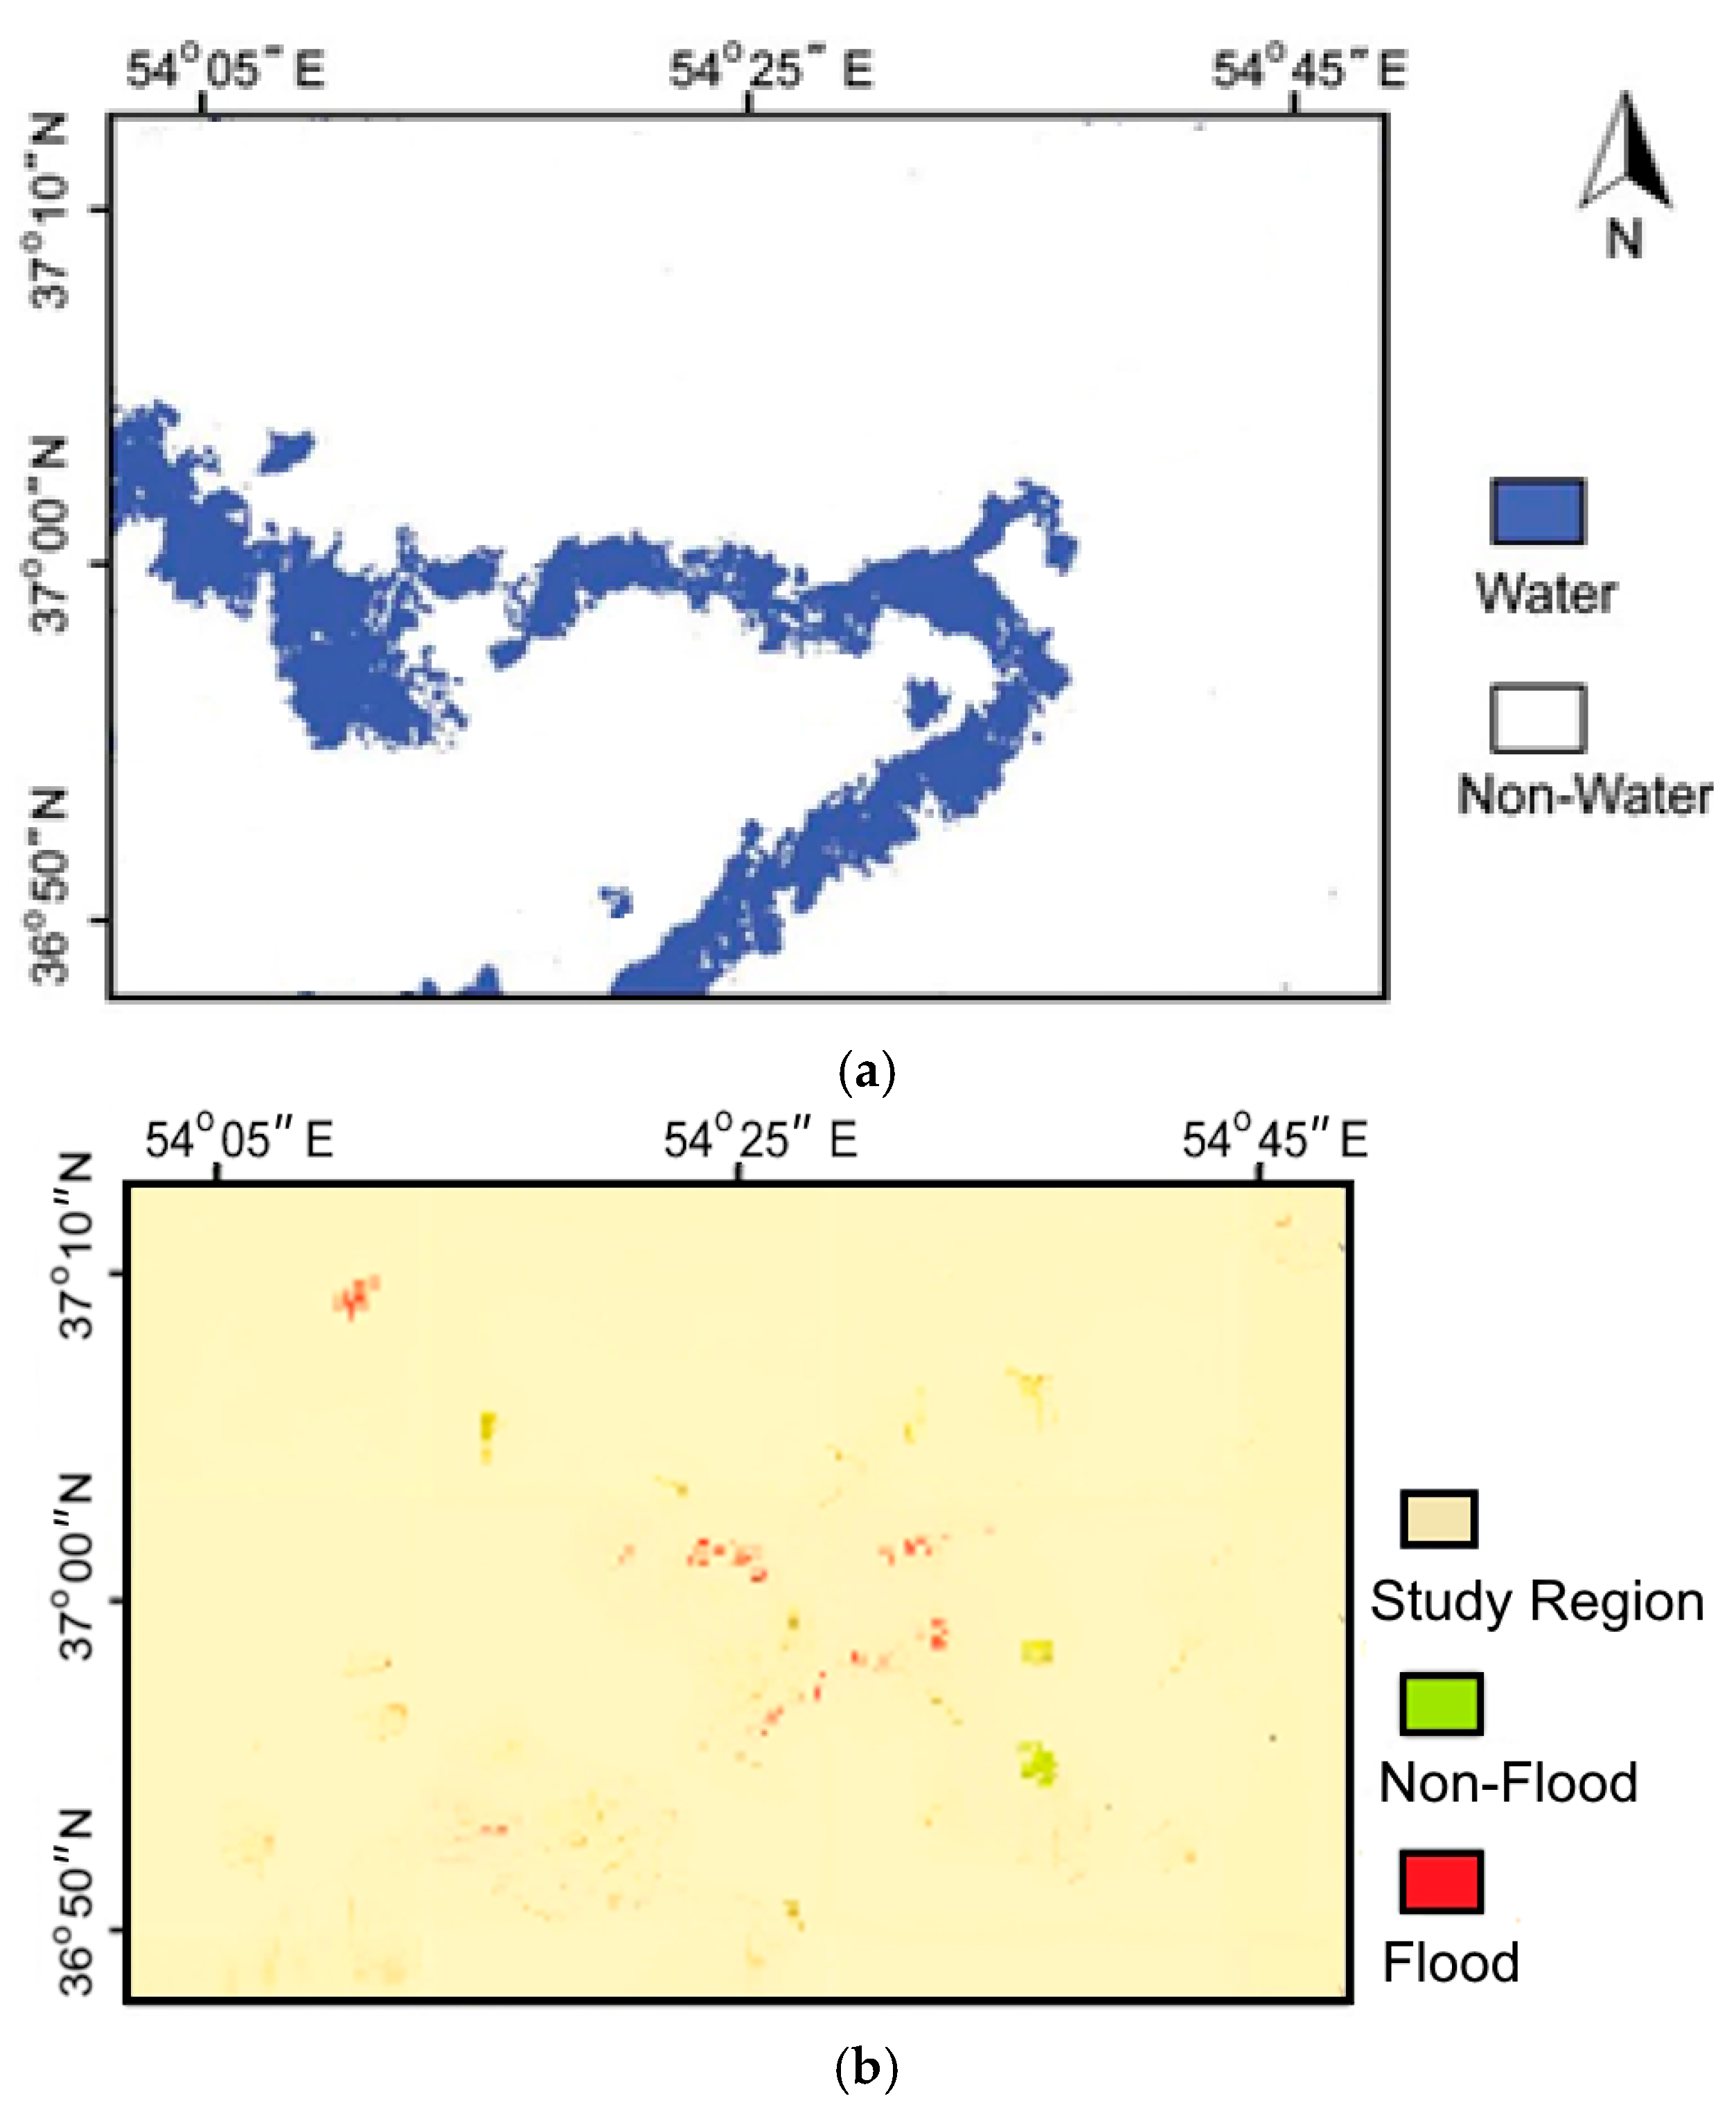
Pixels exhibiting significant backscatter decrease () were identified as potential flood areas. Final flood labels were assigned only to pixels consistently detected by both the optical intersection mask and the SAR change detection mask. This strict cross-sensor agreement strategy minimizes transitional ambiguities and enhances robustness against modality-specific noise. The resulting masks were manually refined in complex transitional zones (e.g., riverbanks and wetlands) to further improve labeling consistency (Figure 7).
Figure 7.
(a) Final ground truth flood mask generated using the cross-sensor agreement strategy (optical indices + SAR change detection); (b) Spatial distribution and class balance of training/validation/testing samples [7].
After ground truth generation, the dataset was partitioned into 70% training, 15% validation, and 15% testing subsets prior to model training. The evaluation samples were not involved in parameter optimization, thereby preventing training–testing overlap within the supervised learning framework.
During training, data augmentation (random flips, rotations, and brightness/contrast jitter) was applied to improve generalization. Model performance was assessed using standard segmentation metrics, including Overall Accuracy (OA), Precision, Recall, F1-score, Intersection over Union (IoU), Cohen’s kappa coefficient, and Area Under the Curve (AUC). It should be noted that the proposed labeling strategy relies on strict cross-sensor agreement between optical water indices and SAR-based change detection, which reduces modality-specific bias and enhances ground truth reliability. By enforcing multi-source consistency and conservative intersection rules, the generated flood masks represent high-confidence core flood regions, thereby improving the robustness of supervised training and minimizing potential circular validation effects. Note that the generated mask represents conservative high-confidence flood regions derived from multi-source agreement, rather than the full inundation extent.
4. Results
This section presents the experimental results of the proposed TLE-FEDformer framework for flood inundation mapping using Sentinel-1 and Sentinel-2 data from the 2019 Aq Qala event. Evaluations include visual and quantitative comparisons with baselines (CNN, Capsule Network, and TLE without FEDformer), computational efficiency, ablation studies, sensitivity analysis, uncertainty quantification, and generalization tests. All models were trained on the same dataset with identical hyperparameters where applicable, using a 70/15/15 train/validation/test split.
4.1. Visual Results
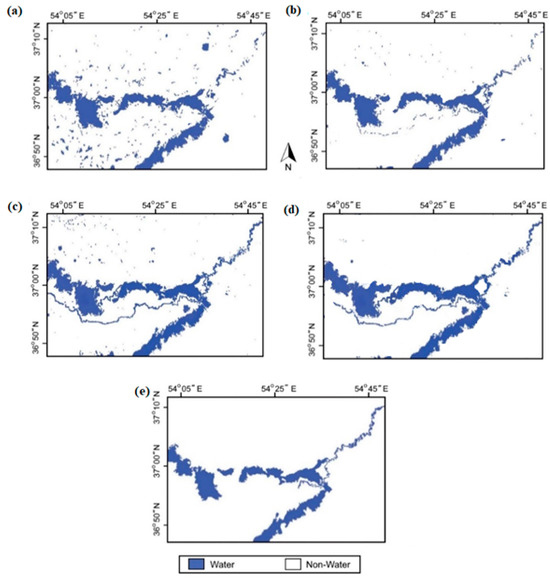
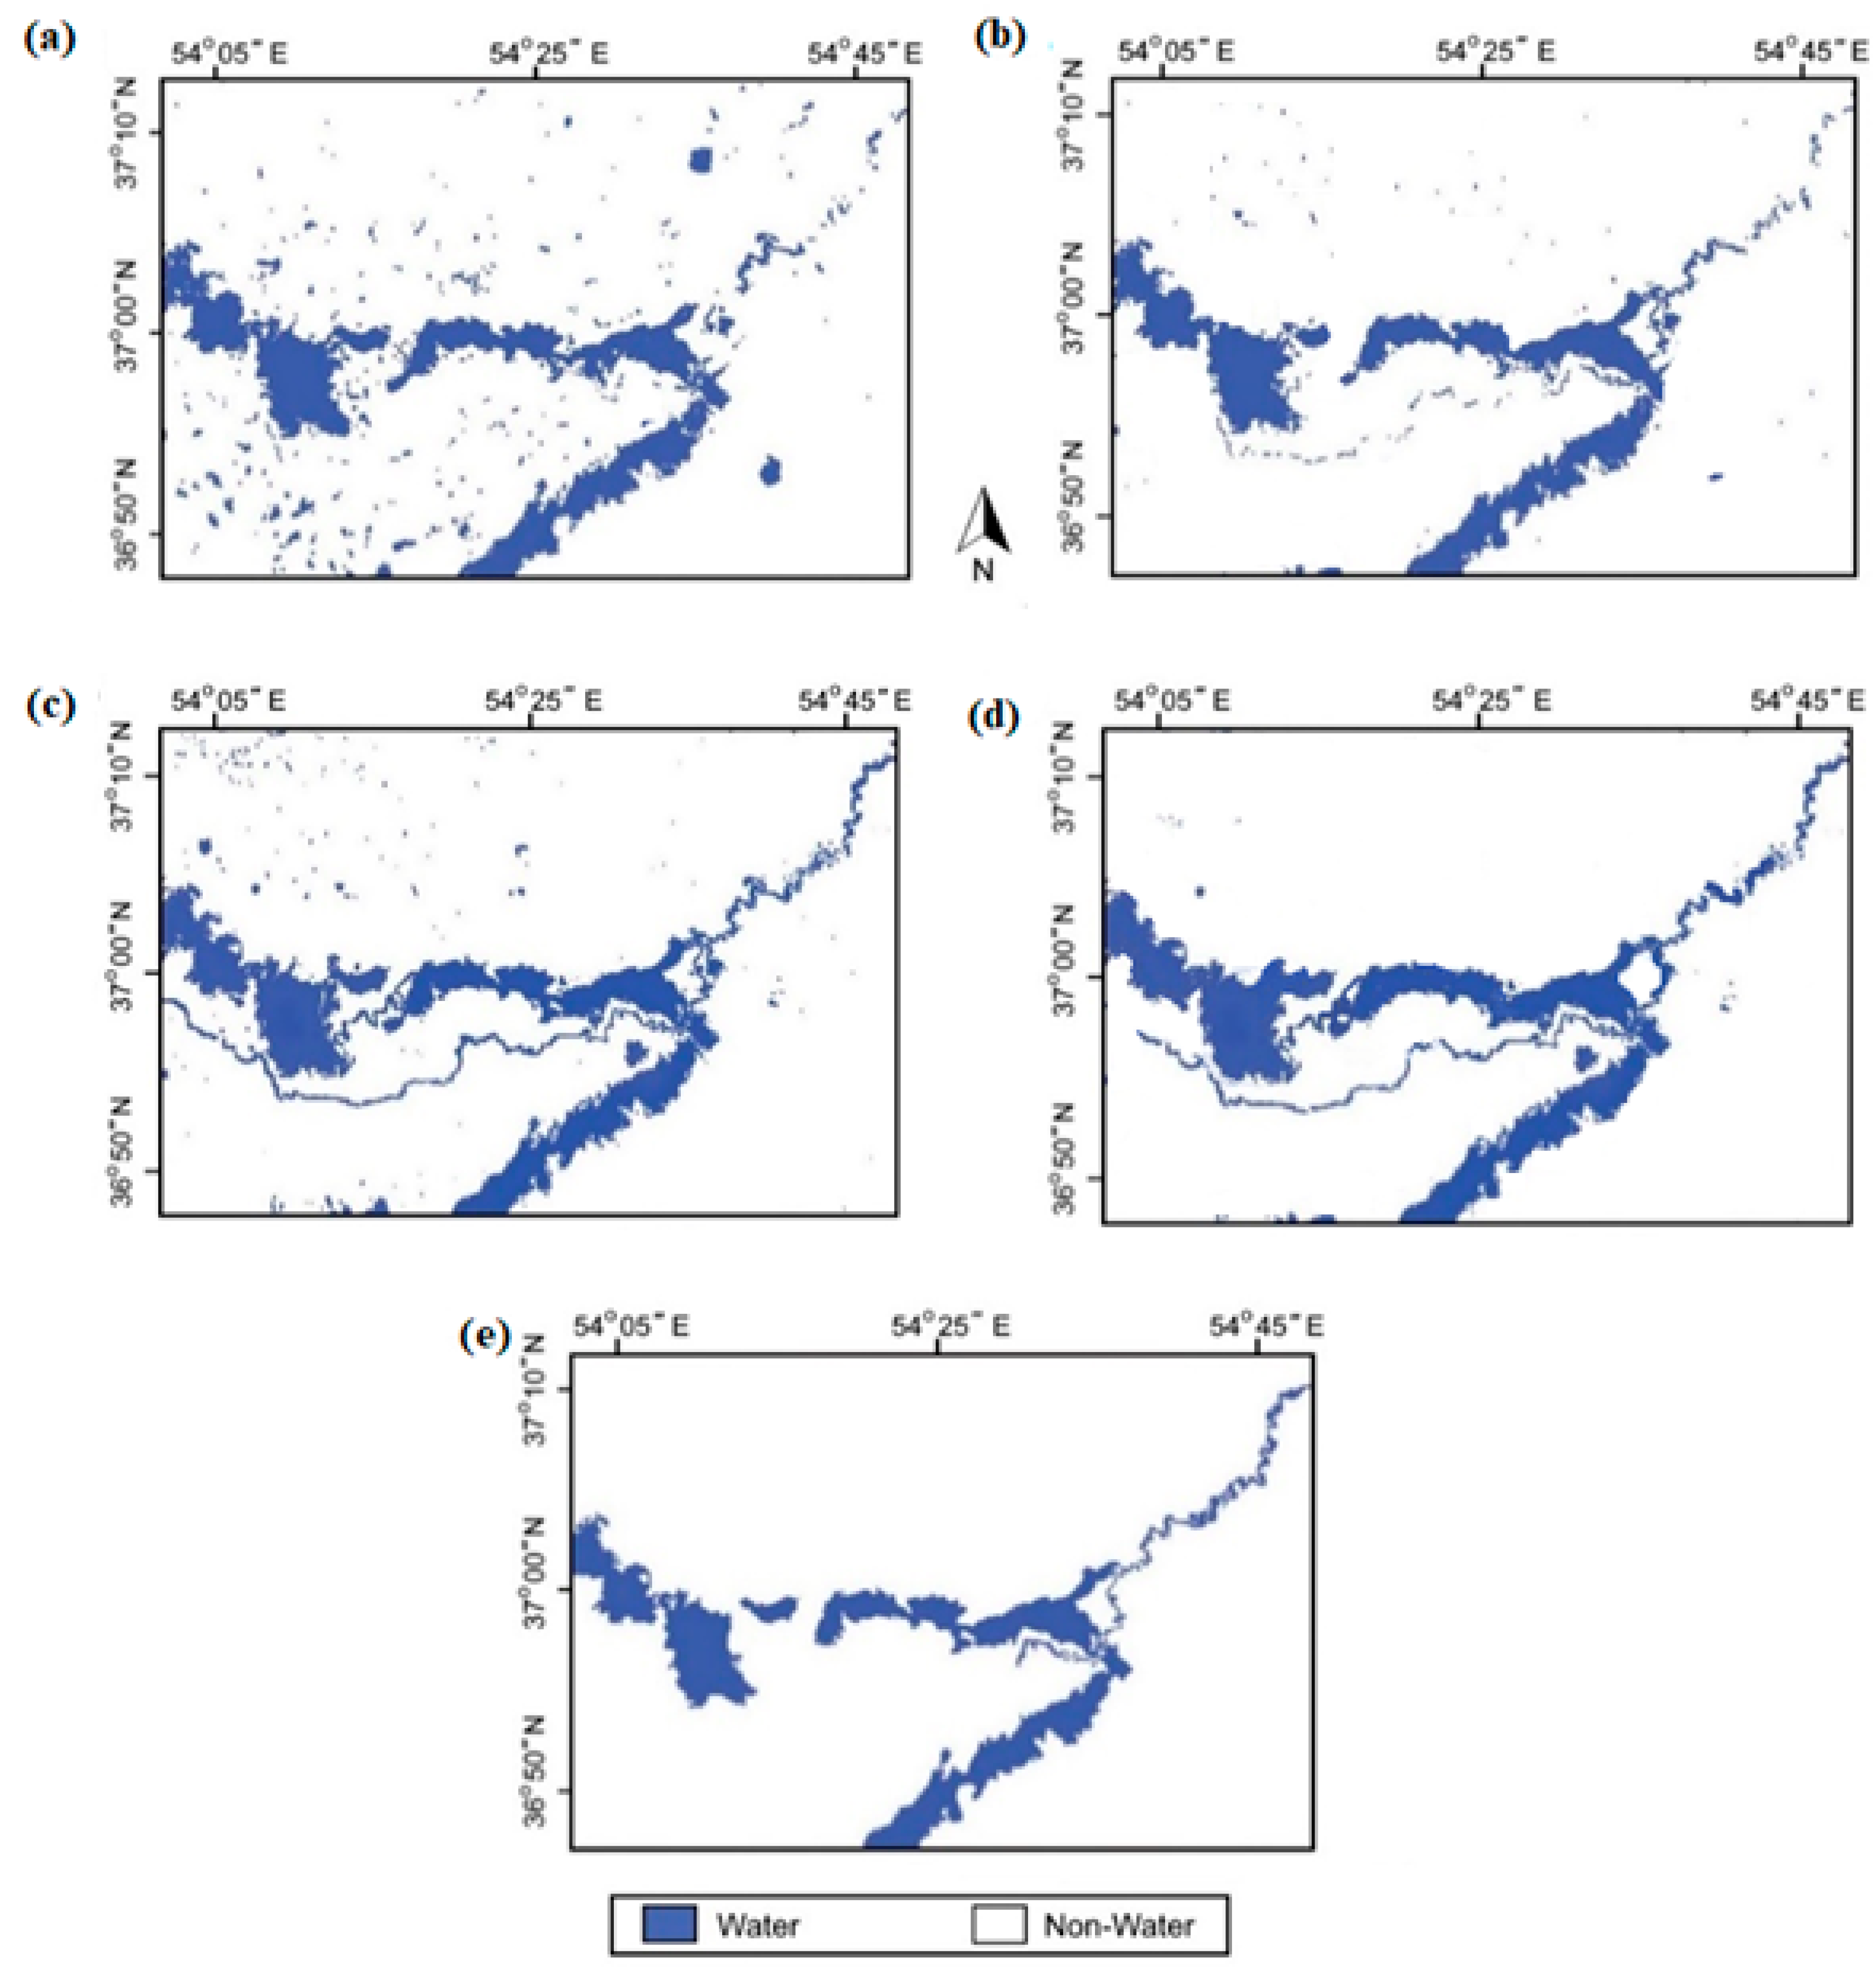
Figure 8 compares the predicted flood maps from each model against the reference. The TLE-FEDformer produces the most accurate delineation, minimizing over-detection in vegetated zones and under-detection in urban areas.
Figure 8.
The result of flood mapping for Aq Qala (a) CNN, (b) TLE, (c) Capsule, (d) TLE-FEDformer, and (e) reference map.
4.2. Quantitative Performance Evaluation
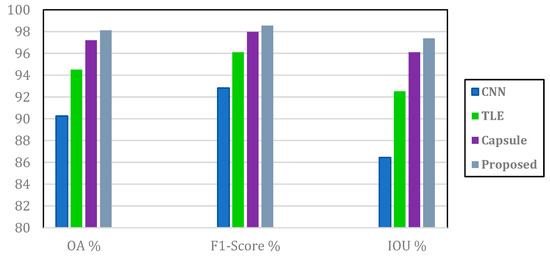
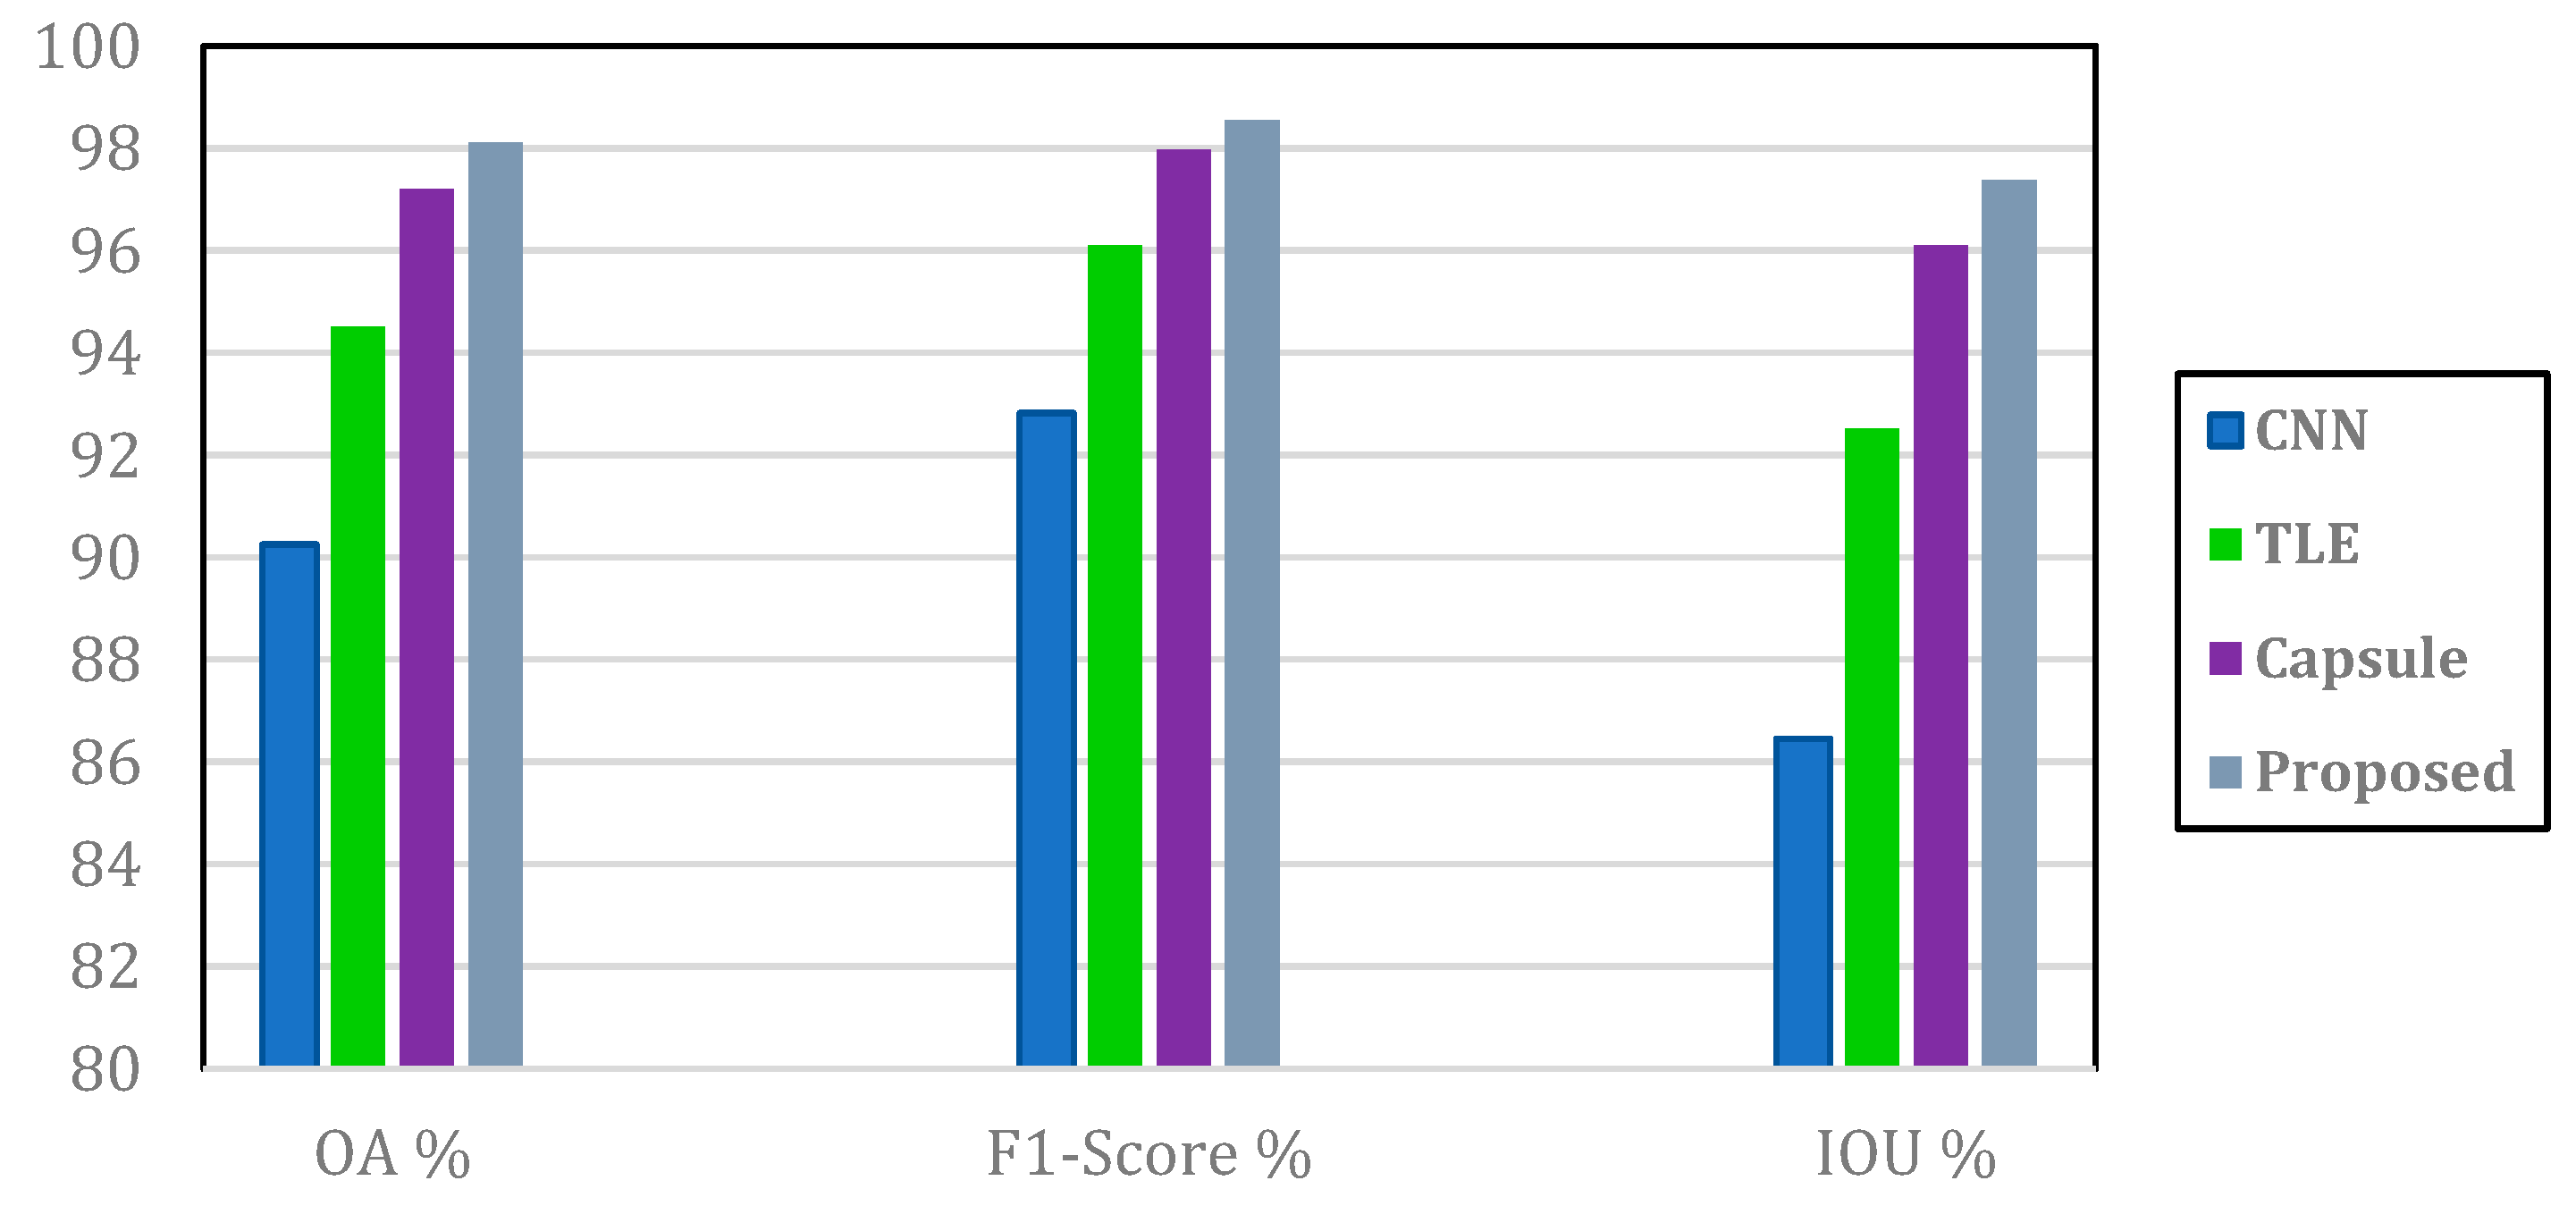
Table 2 presents the segmentation metrics for all models. The TLE-FEDformer outperforms baselines, achieving an OA of 98.12%, an F1-score of 98.55%, and an IoU of 97.38%, with the lowest false negative rate (1.33%). Figure 9 visualizes the performance comparison, highlighting the proposed model’s superiority across metrics.
Table 2.
Accuracy assessment of flood mapping.
Figure 9.
The performance comparison, highlighting the proposed model’s superiority across metrics.
To provide broader benchmarking across representative spatial and spatio-temporal architectures, a ConvLSTM model was additionally implemented as a classical recurrent framework for multi-temporal remote sensing analysis. A standard Vanilla Transformer encoder without frequency decomposition was also evaluated to isolate the contribution of spectral modeling. All models were trained under identical data partitioning and optimization settings to ensure fair comparison.
As shown in Table 2, ConvLSTM achieved an IoU of 93.12% and an F1-score of 96.57%, outperforming purely spatial CNN-based approaches but remaining inferior to the Vanilla Transformer (IoU = 94.90%) and Capsule-based modeling (IoU = 96.11%).
The proposed TLE-FEDformer further improved performance to 97.38% IoU and 98.55% F1-score, while also achieving the lowest false negative rate (1.33%). Notably, the performance gap between the Vanilla Transformer and the proposed method (~2.5% IoU) indicates that even under short multi-temporal configurations (2–6 time-steps), frequency-enhanced decomposition contributes measurable gains beyond standard self-attention or recurrent modeling.
These results confirm that the spectral separation of gradual background trends and abrupt flood-induced variations enhances stability and discrimination, even when long-sequence forecasting is not required.
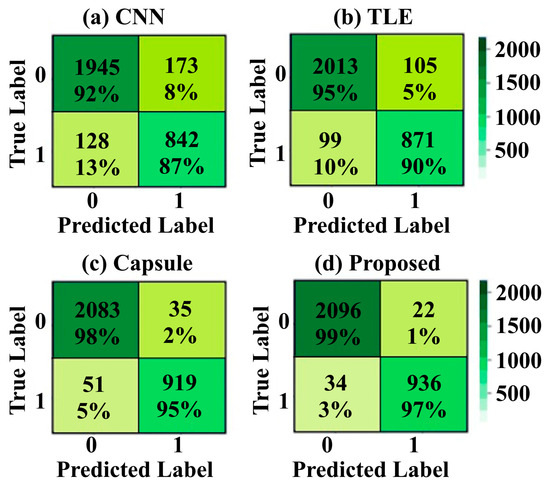
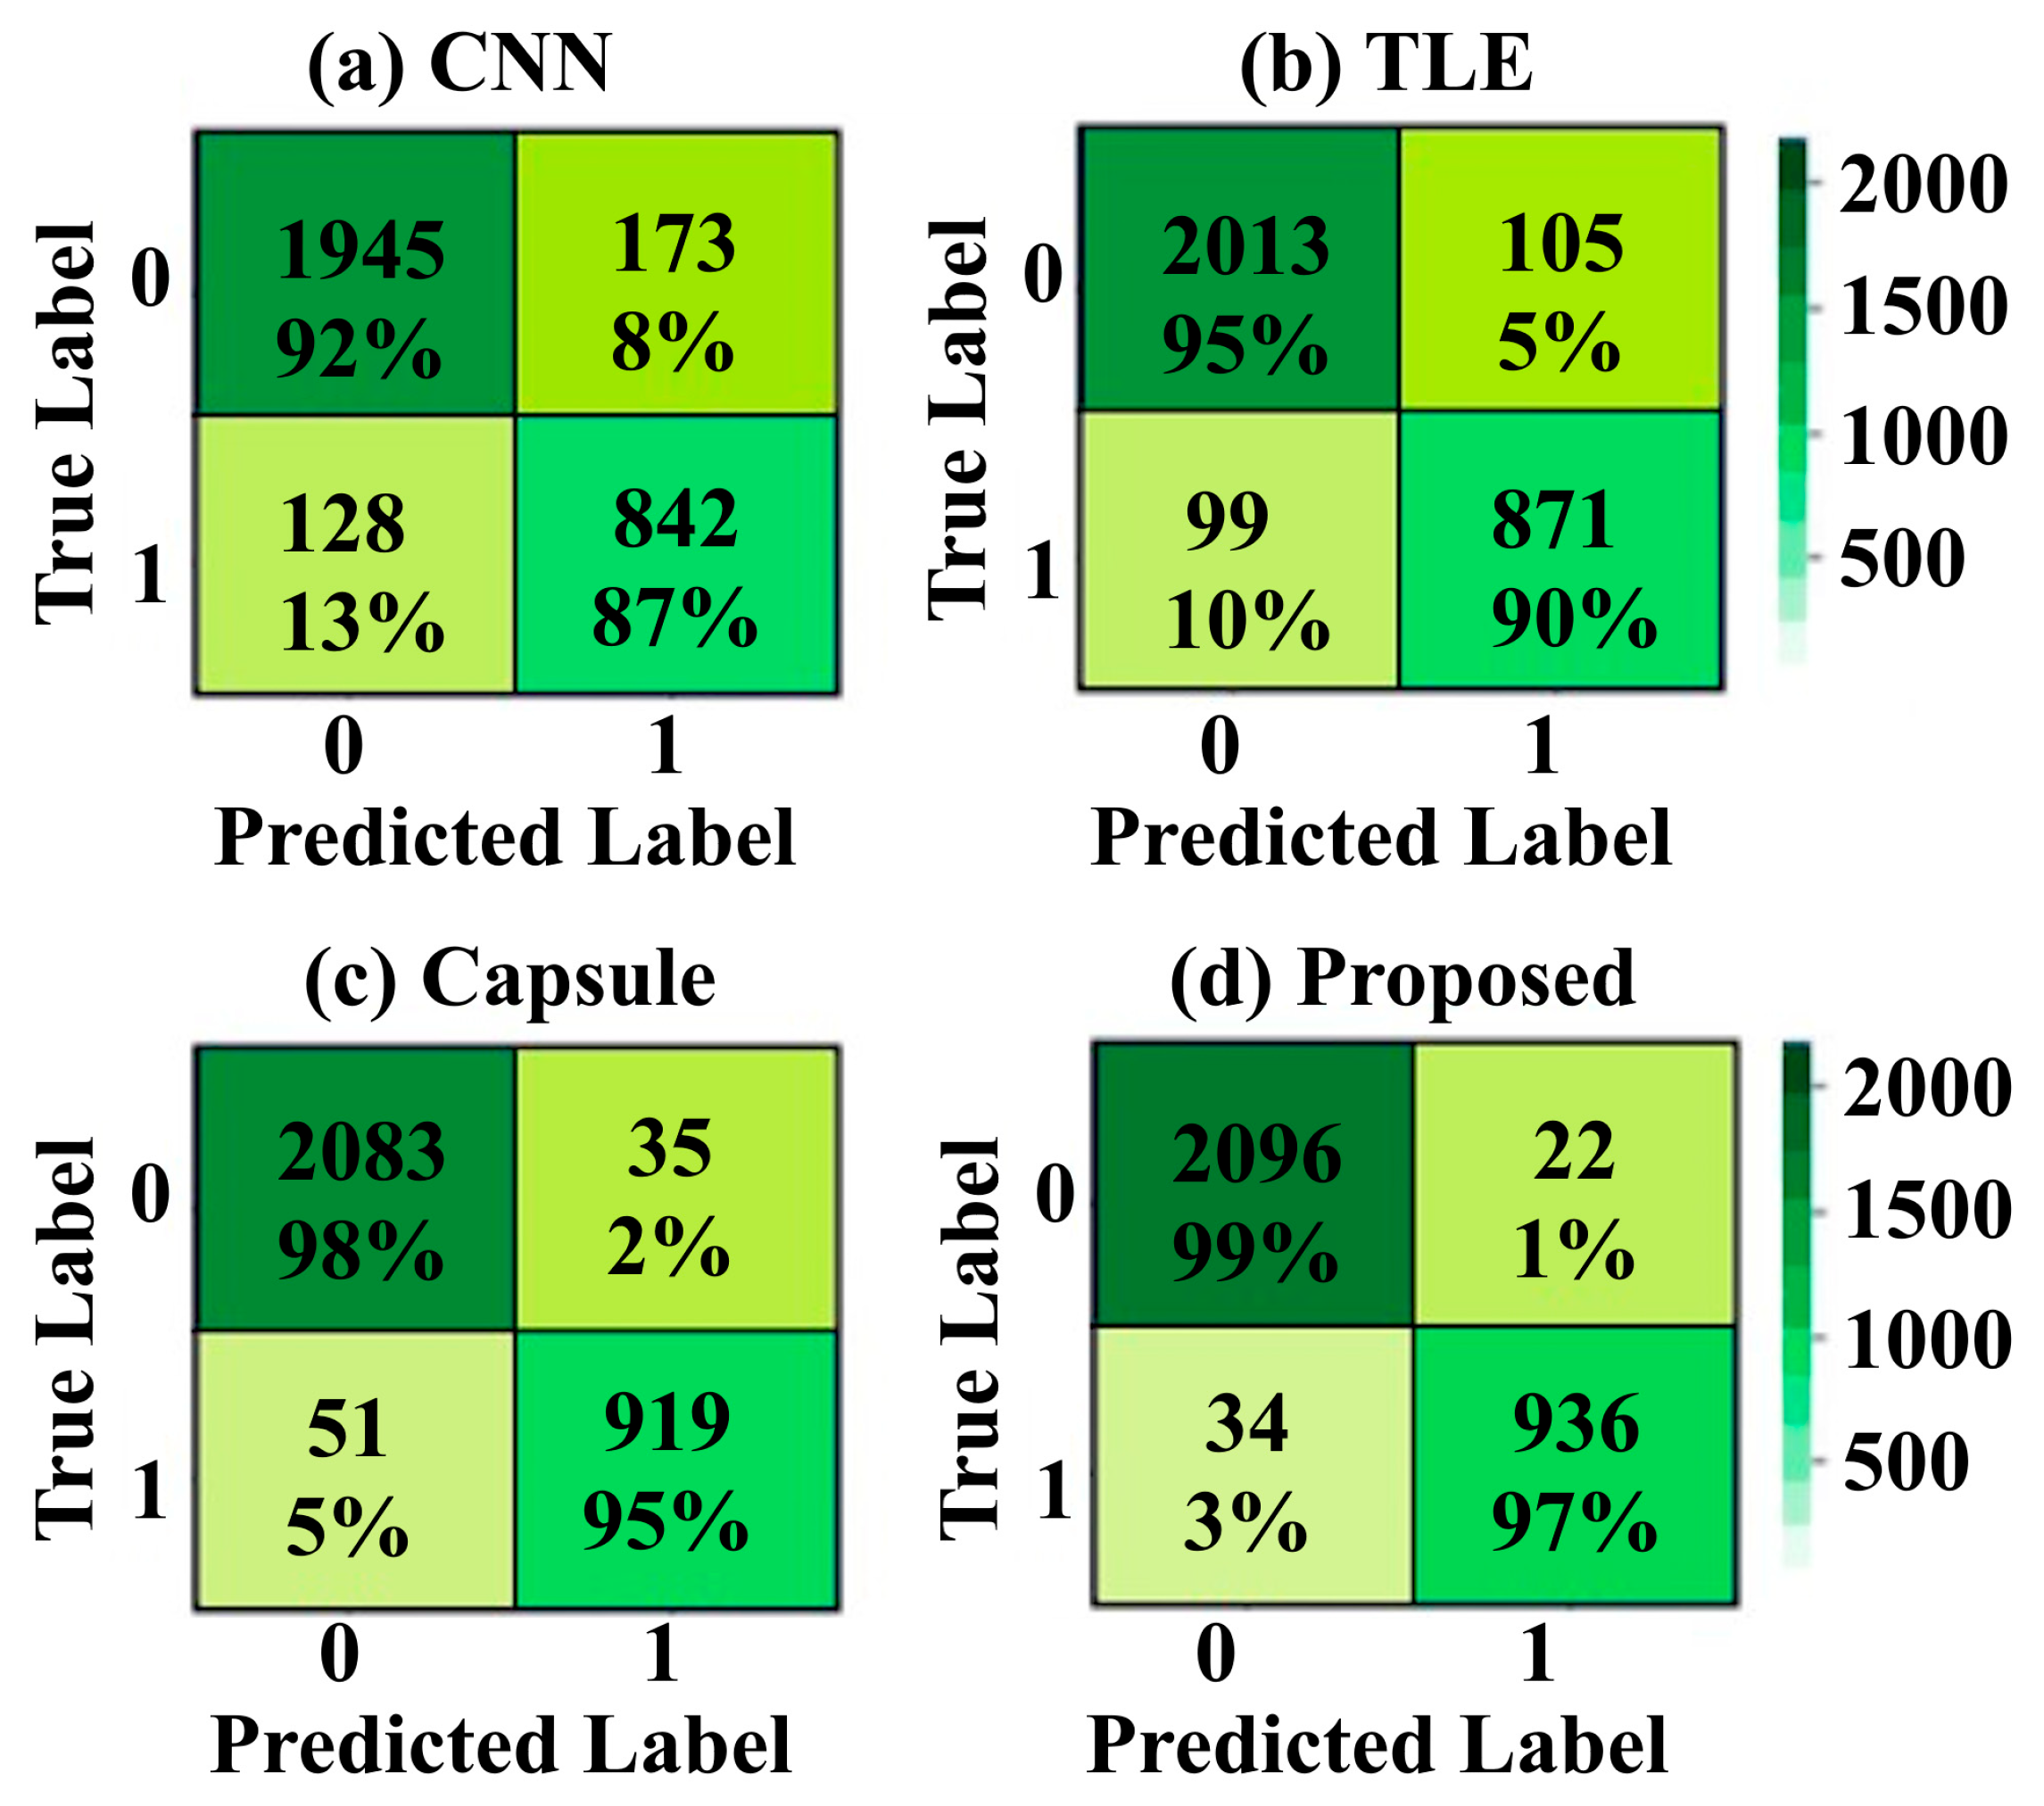
Figure 10 shows the confusion matrices. The proposed model minimizes errors, with 98.67% true positives for flooded pixels.
Figure 10.
Confusion matrix and normalized confusion matrix using (a) CNN, (b) TLE, (c) Capsule, and (d) TLE-FEDformer (Proposed).
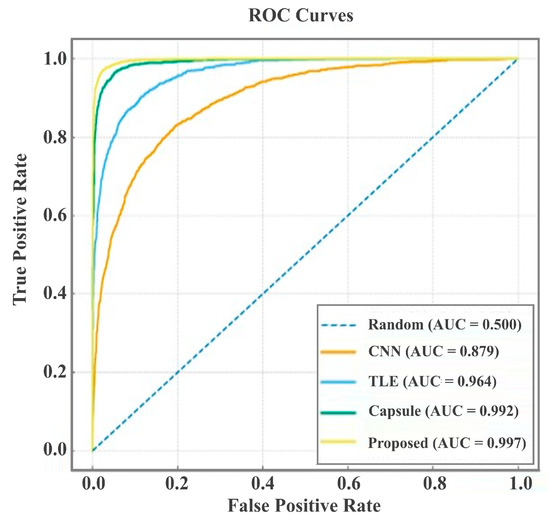
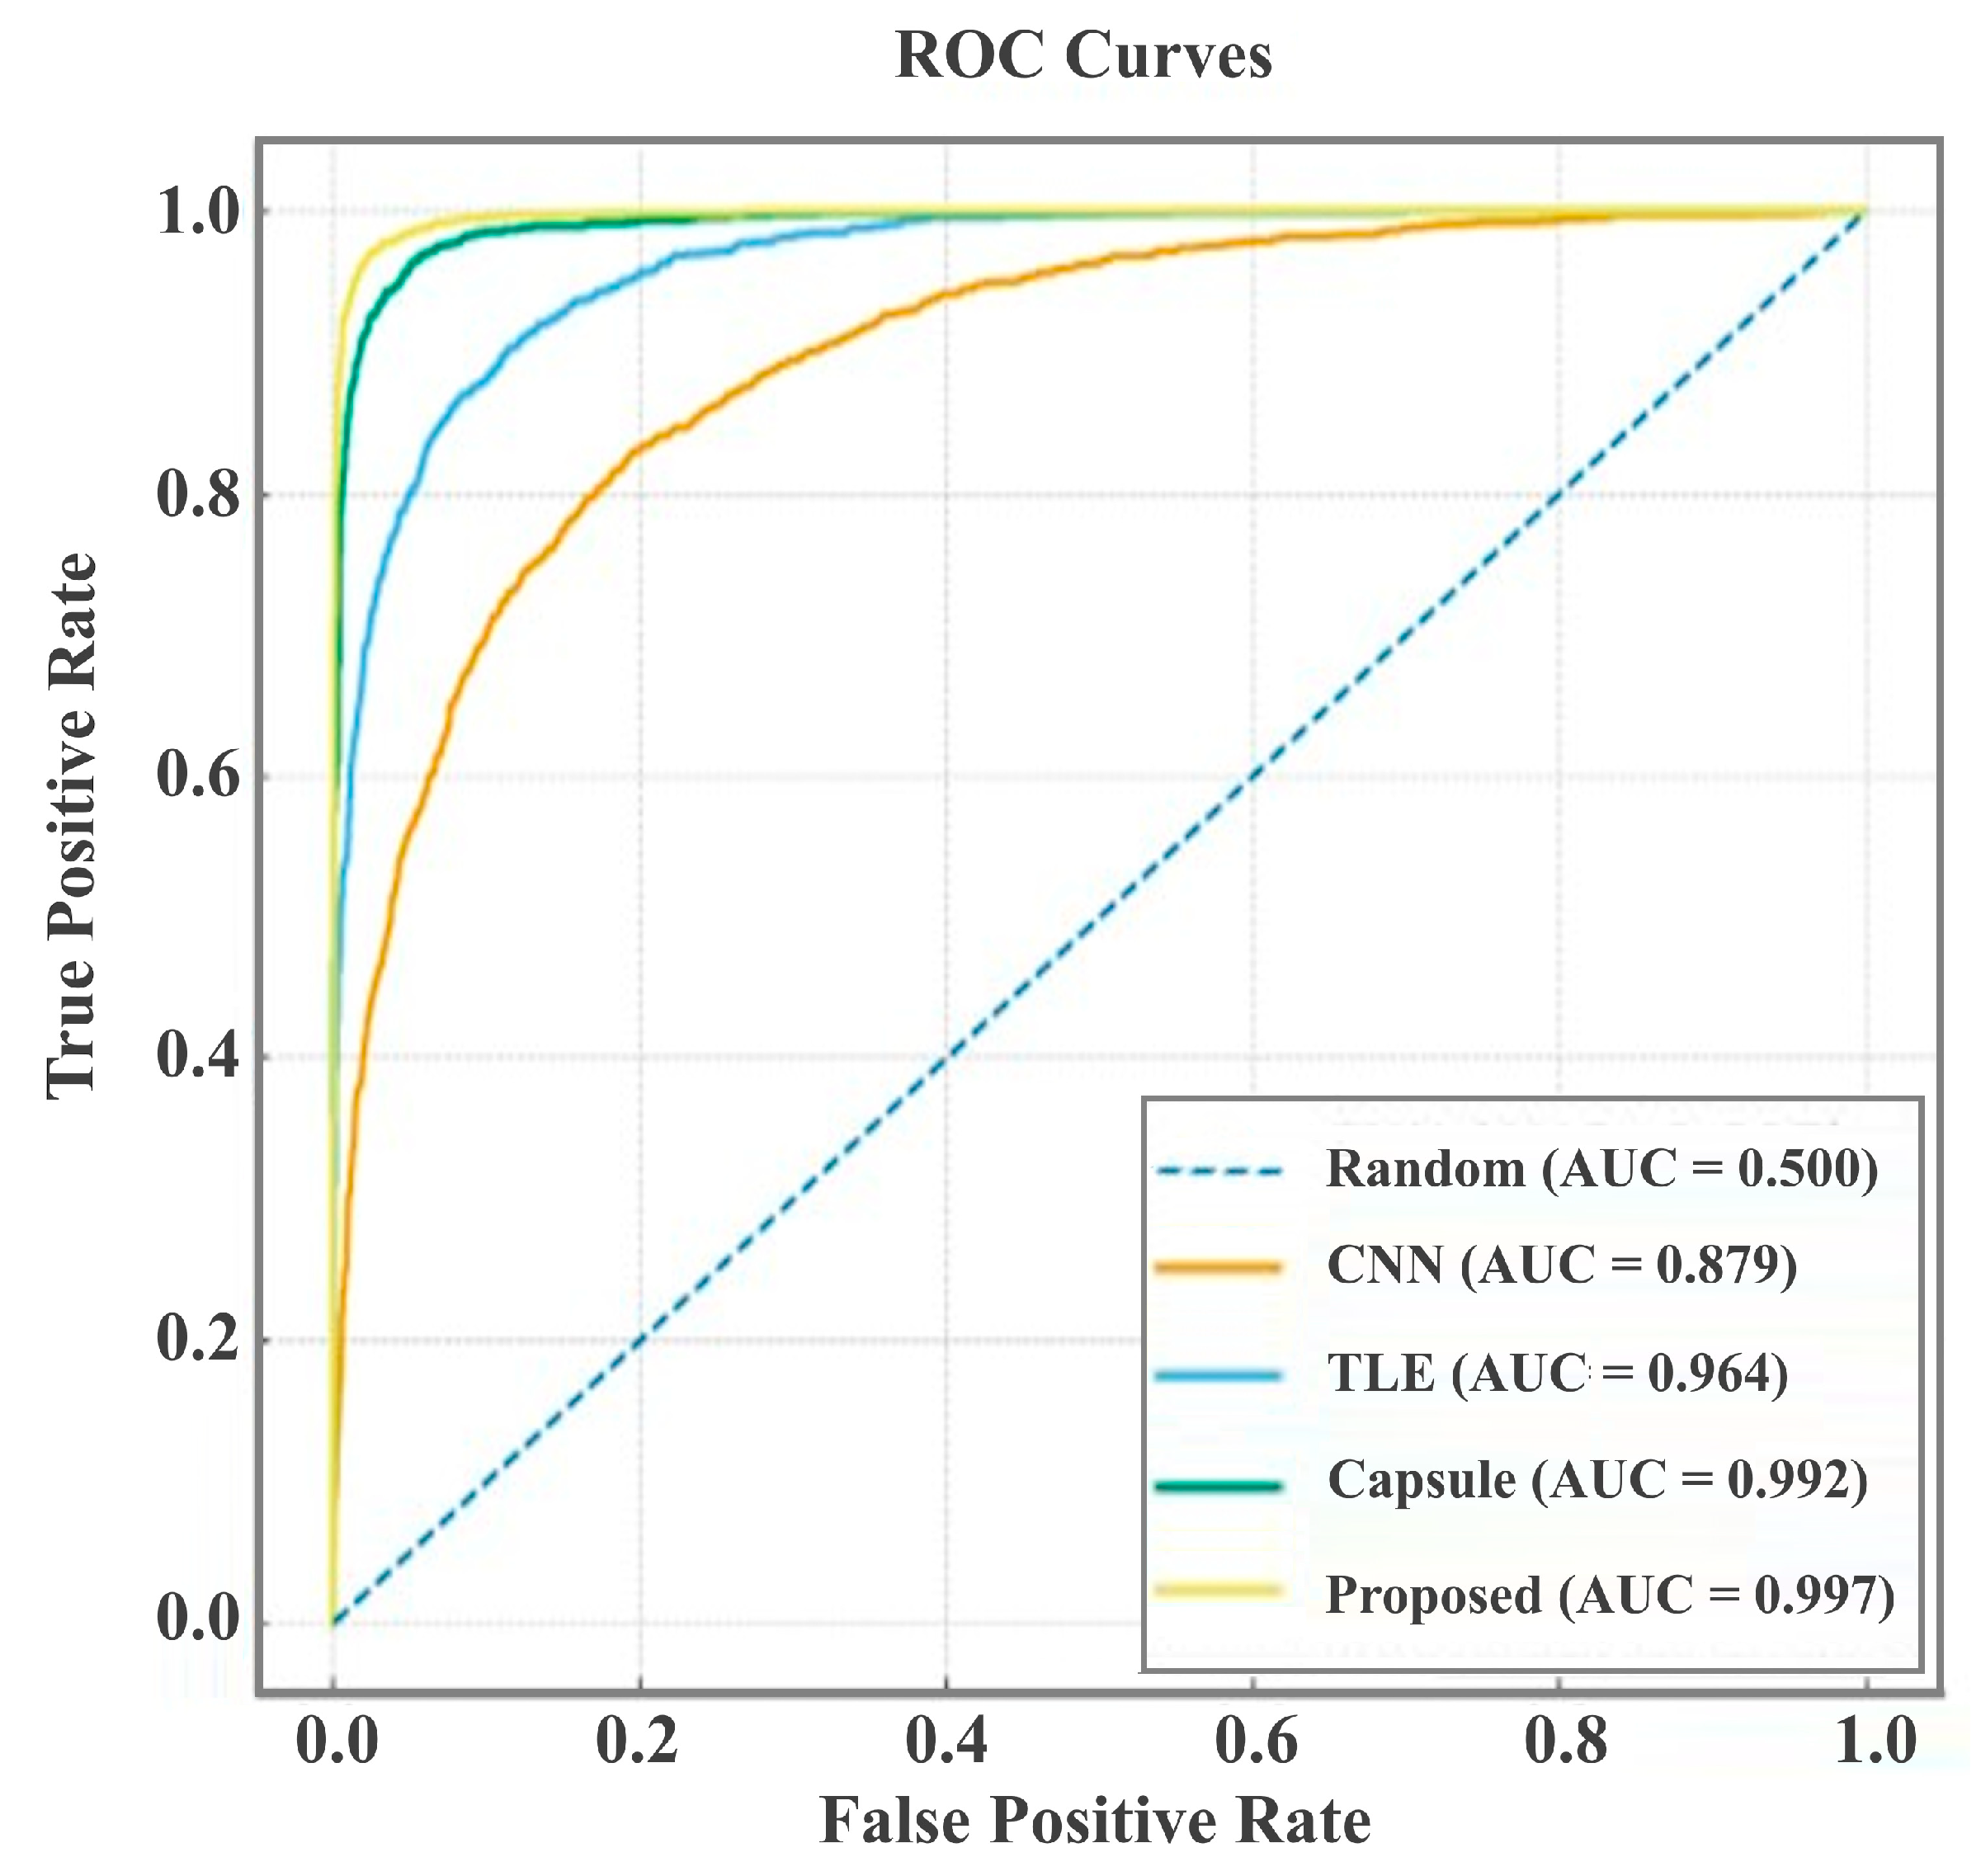
Figure 11 displays ROC curves. The proposed model’s AUC is 0.997, indicating near-perfect discrimination.
Figure 11.
Receiver Operating Characteristic (ROC) curves and Area under the Curve (AUC) values for flood detection performance comparison across models on the 2019 Aq Qala test set. The proposed TLE-FEDformer achieves the highest AUC of 0.99, demonstrating near-perfect discrimination between flooded and non-flooded pixels.
It is worth noting that while several Transformer-based architectures (e.g., ViT and Swin Transformer) and temporal models (e.g., ConvLSTM, Temporal CNN) have been widely adopted in computer vision and time series analysis, they are typically designed for large-scale pretraining or long-sequence modeling scenarios. Given the short multi-temporal configuration (2–6 time-steps) and dataset scale in this study, the focus is on representative baselines with comparable model complexity to ensure fair evaluation.
4.3. Computational Efficiency Evaluation
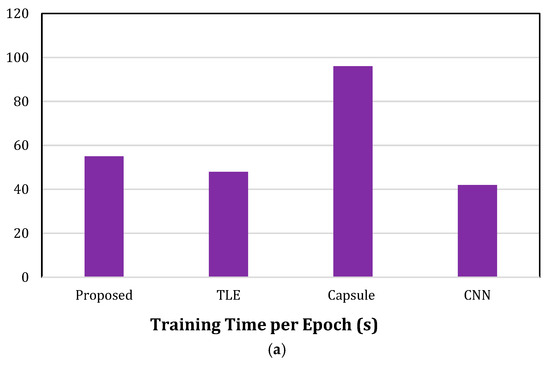
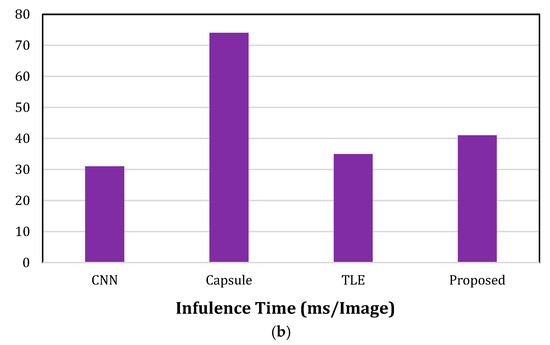
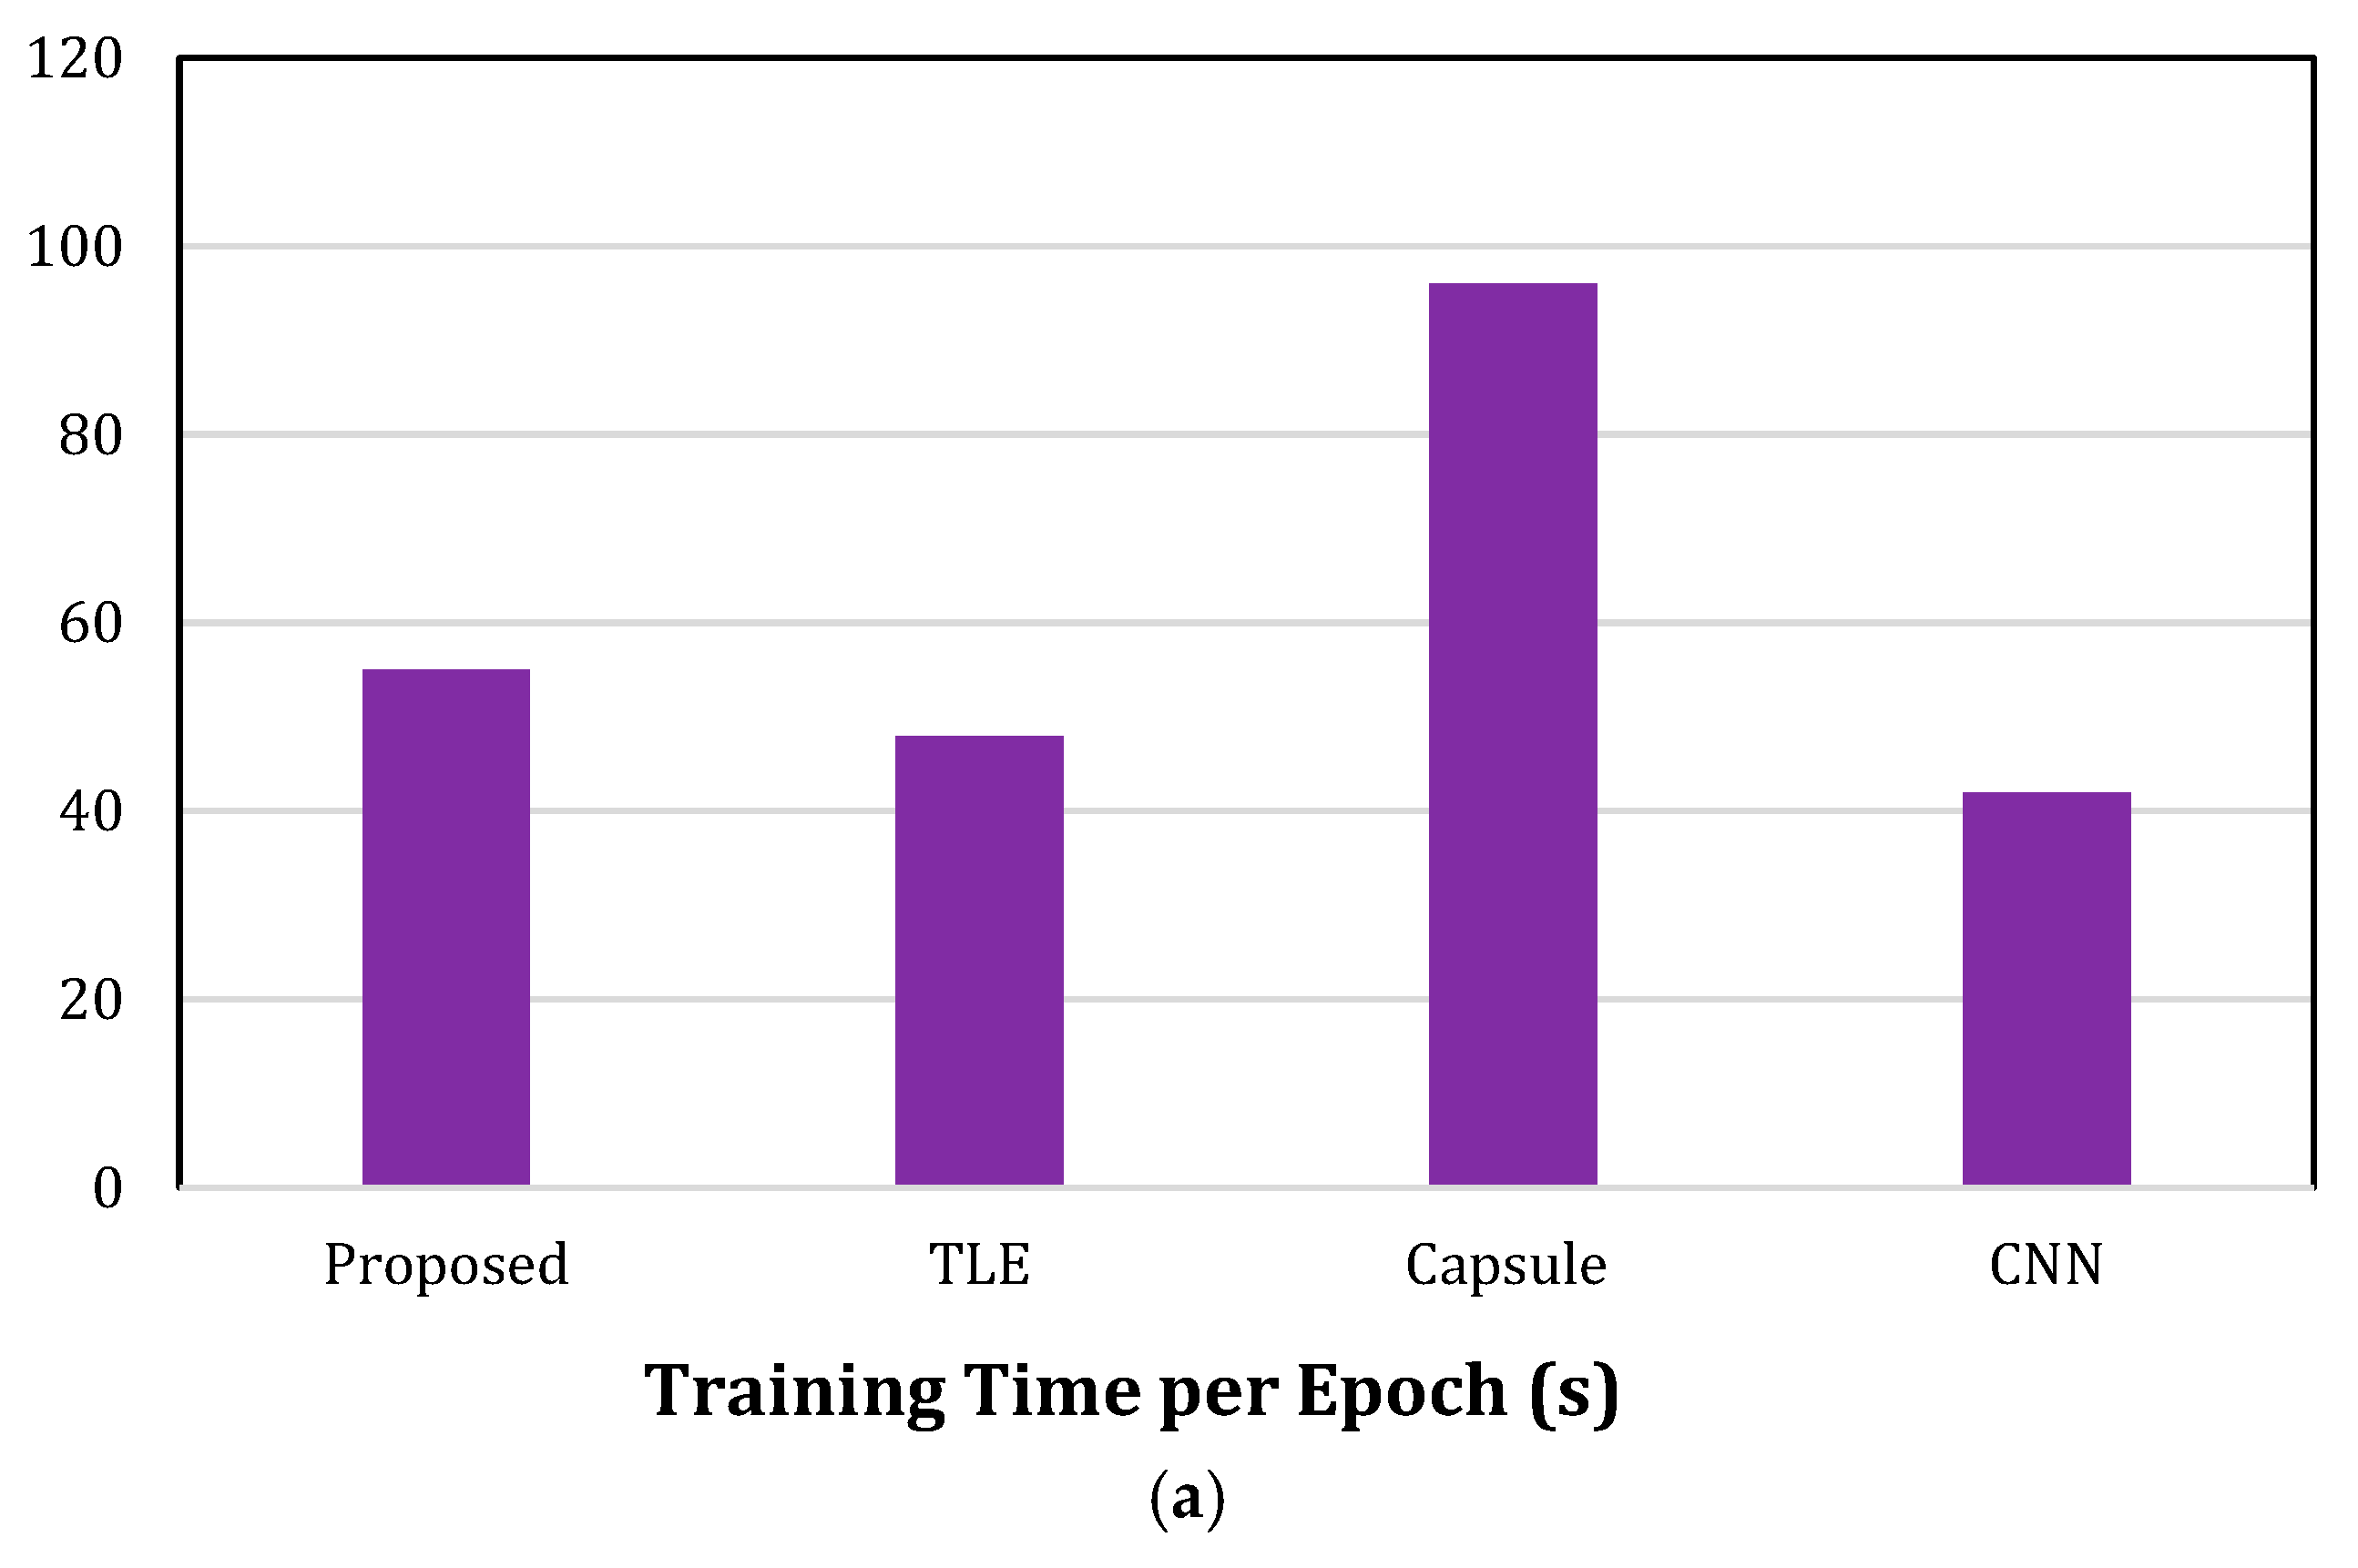
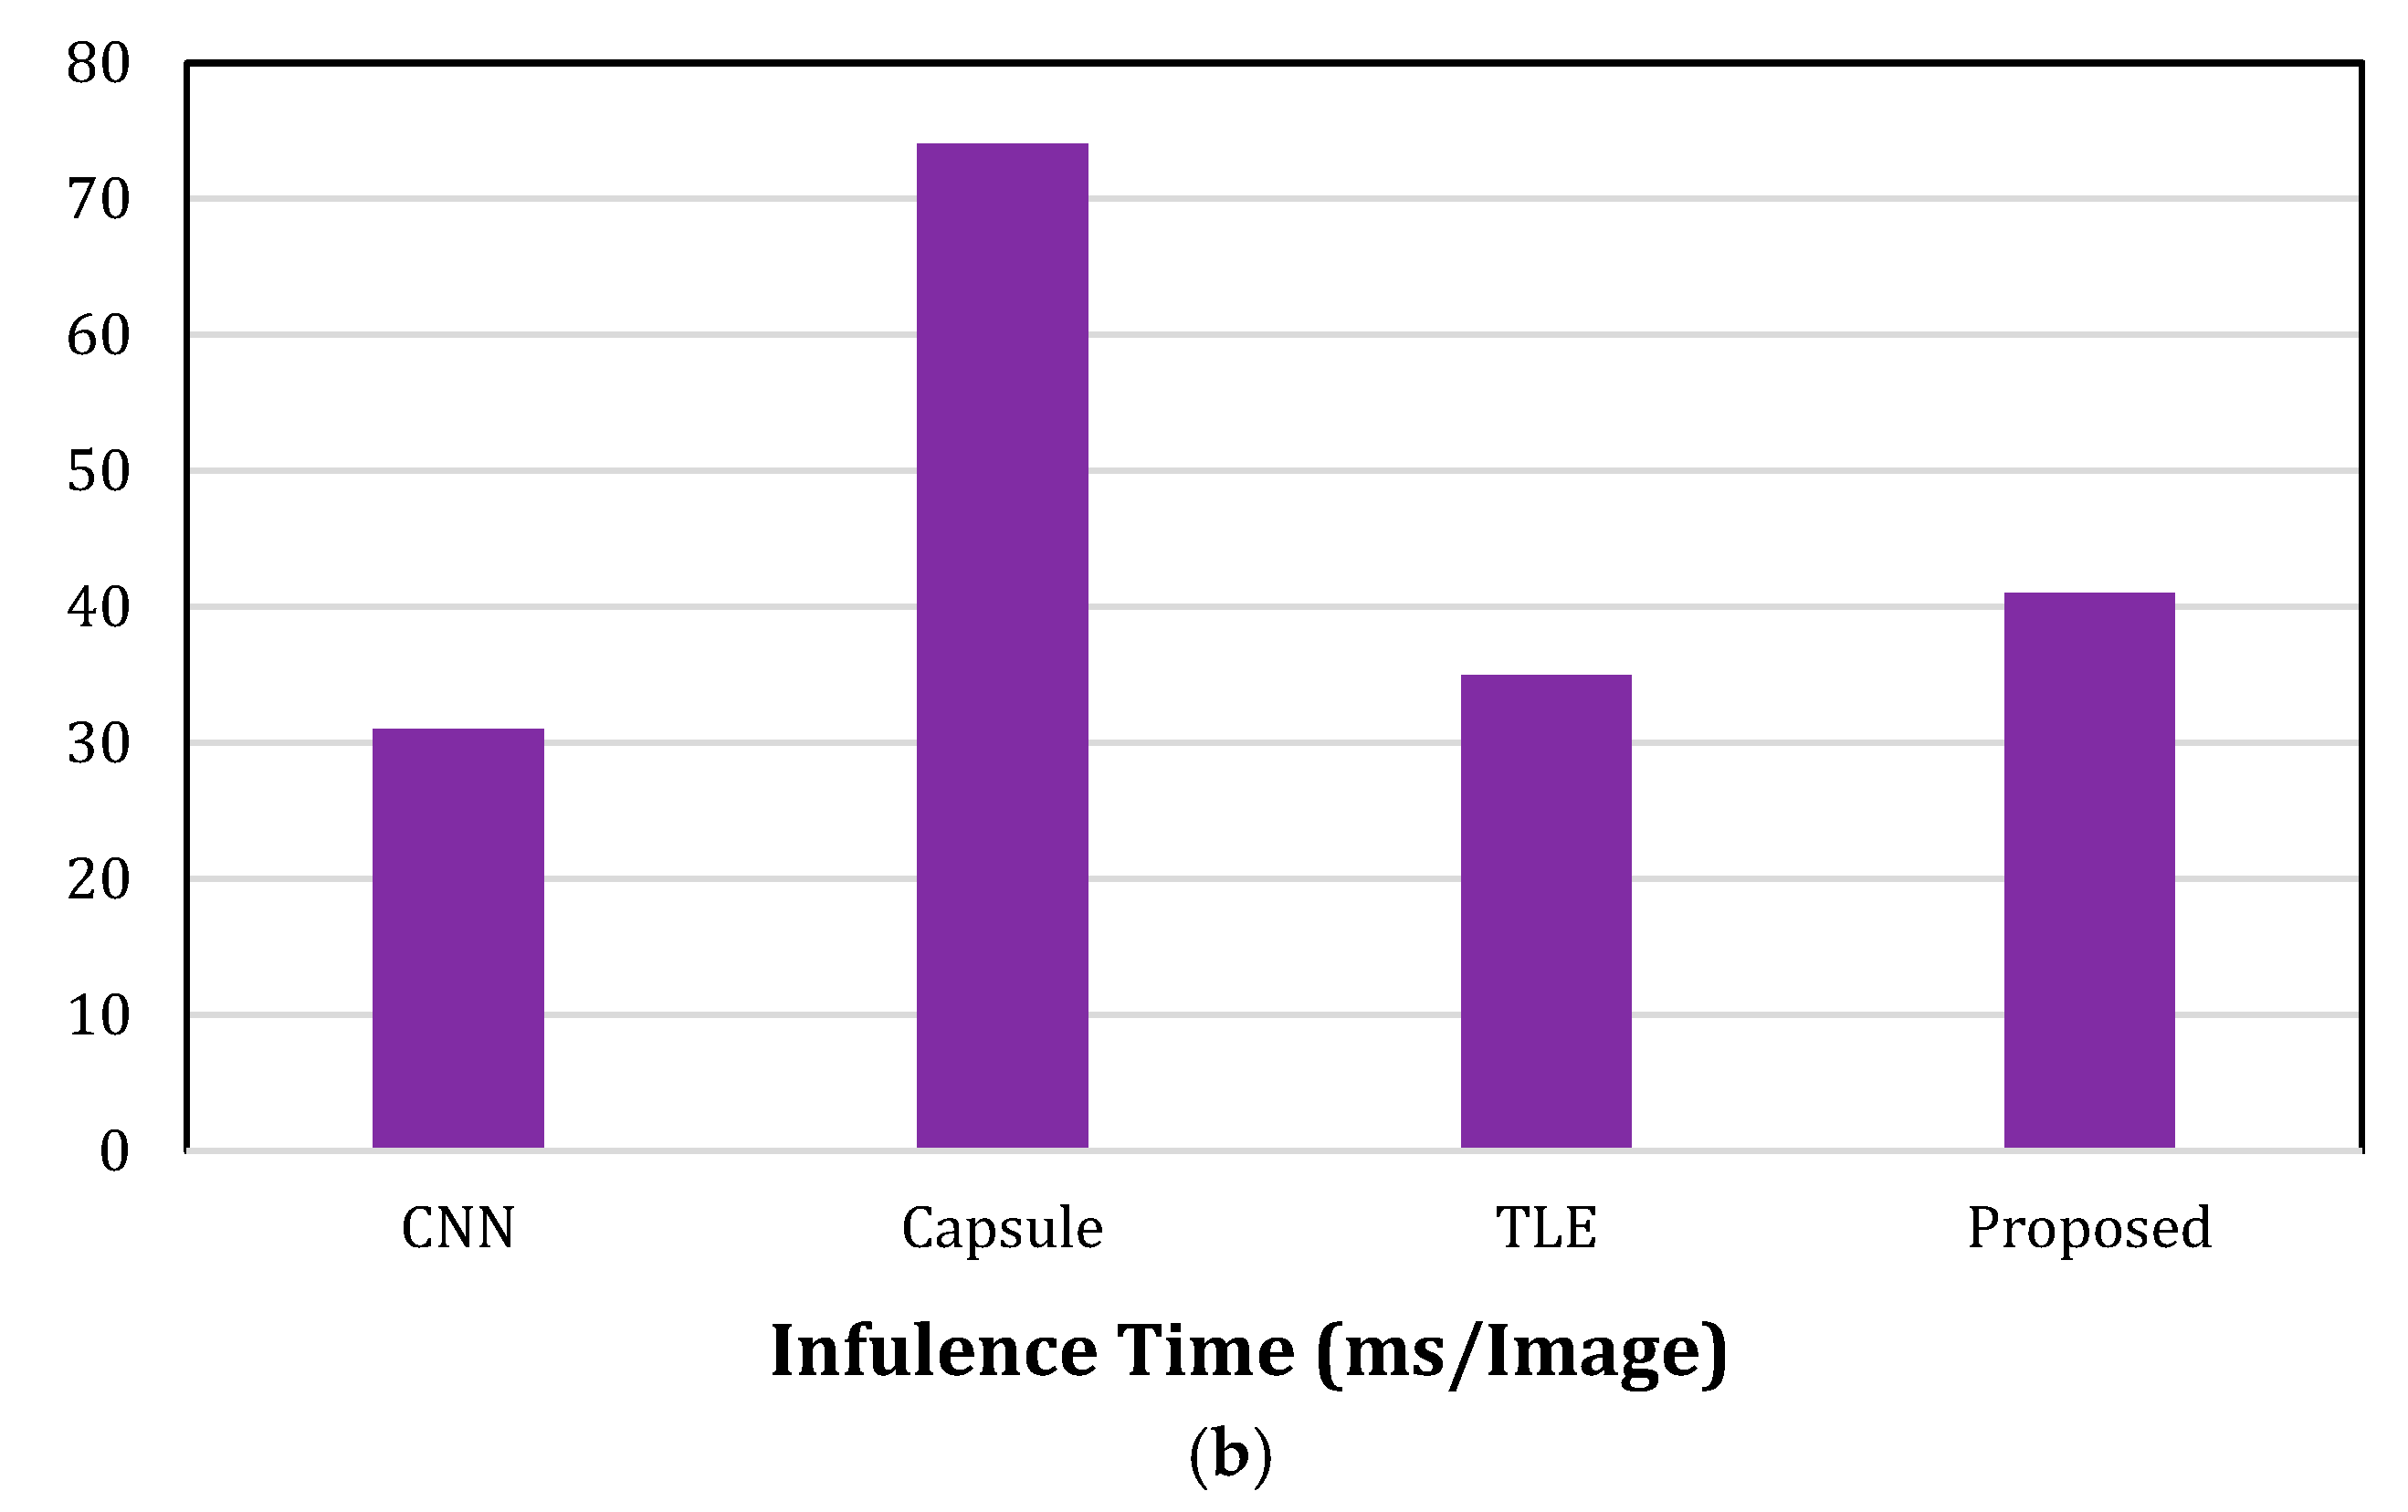
Table 3 summarizes computational metrics. The proposed model balances efficiency, with an inference time of 41 ms/image, suitable for operational use. Figure 12a,b compares training and inference times.
Table 3.
Computational efficiency comparison of different models.
Figure 12.
(a) Comparison of training time per epoch for different models; (b) Comparison of influence time per image for different models.
4.4. Ablation Study
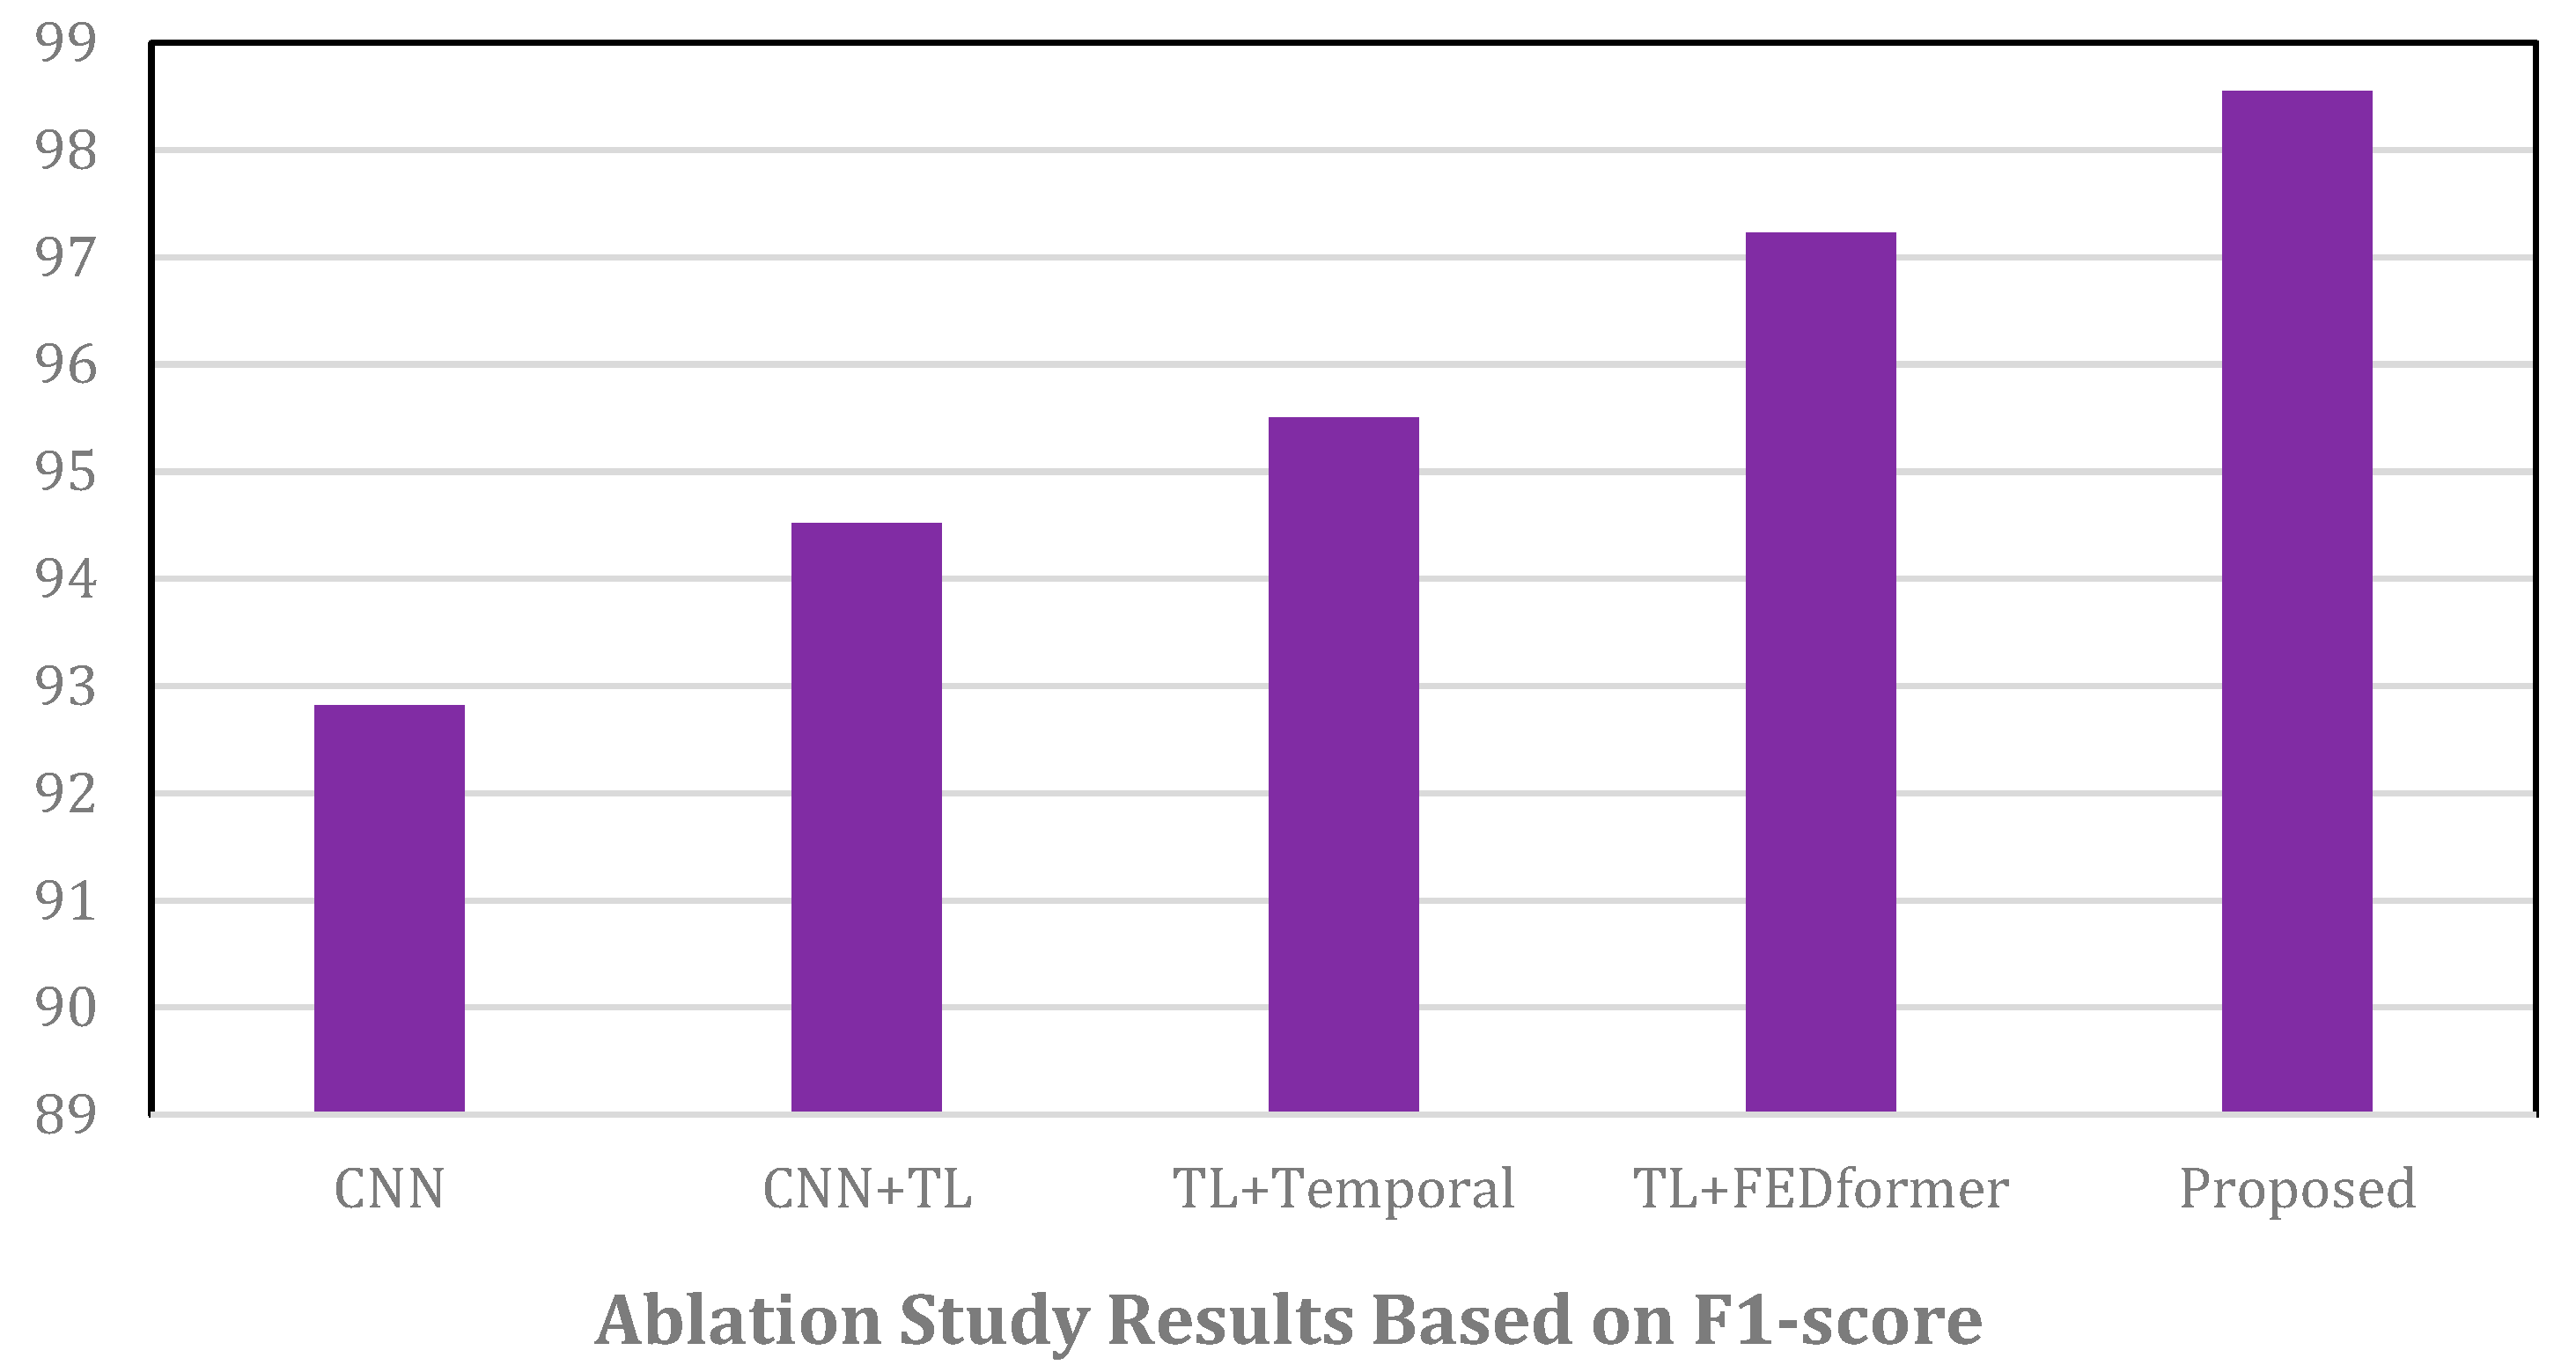
Table 4 shows ablation results. The full model outperforms variants, confirming contributions of transfer learning and FEDformer. Figure 13 visualizes F1-scores from ablation.
Table 4.
Ablation study results of different model configurations. The best results are highlighted in bold.
Figure 13.
Ablation Study Results Based on F1-score.
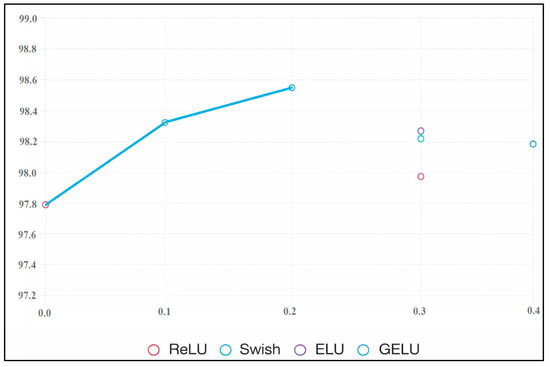
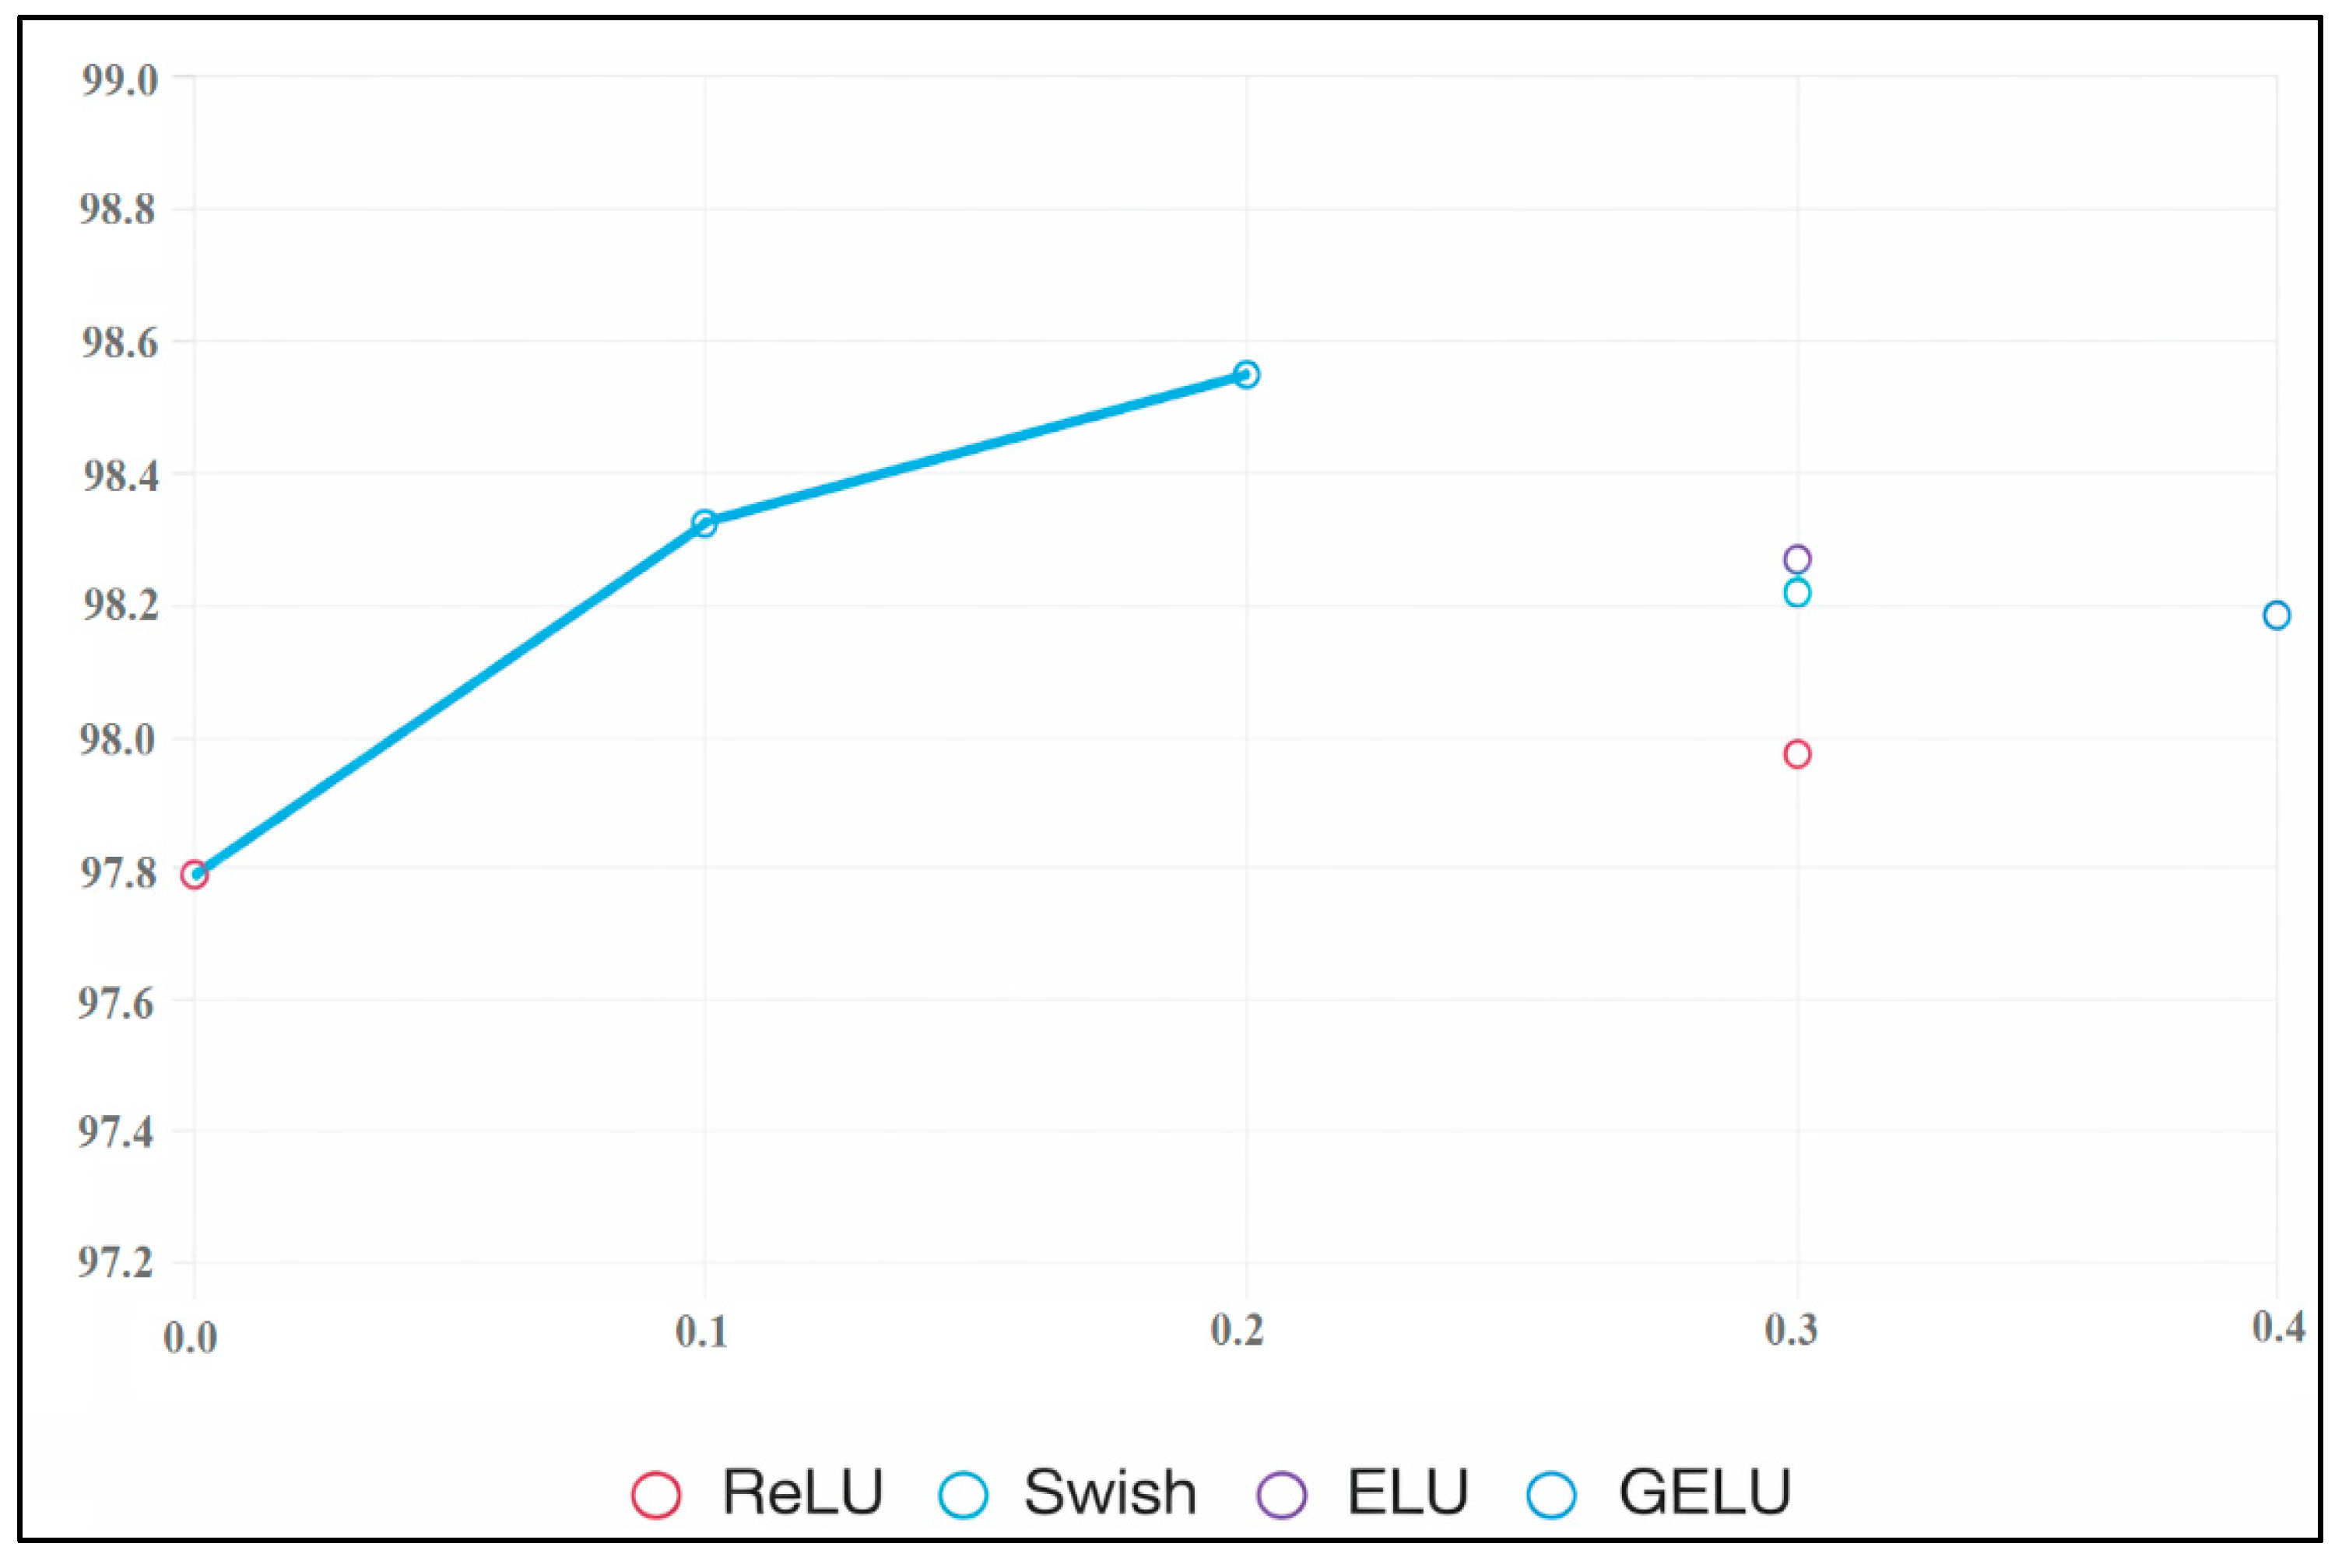
Table 5 details the impact of activation functions and dropout. GELU with 0.2 dropout yields the best results. Figure 14 combines the impacts.
Table 5.
Ablation Study on Activation Functions and Dropout in FEDformer.
Figure 14.
The combined impact of activation functions and dropout rates. The blue line shows the performance trend of the Swish activation function.
4.5. Sensitivity Analysis on Key Hyperparameters
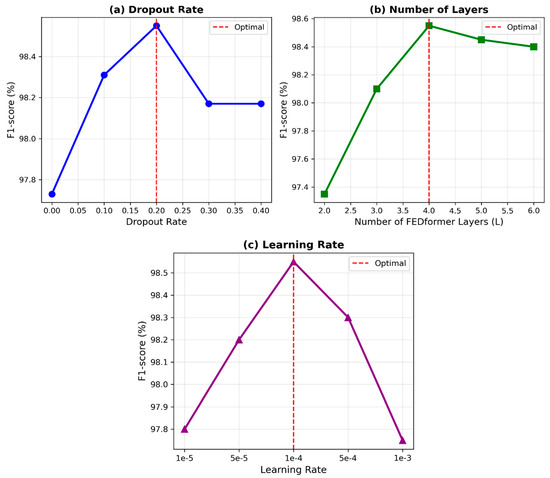
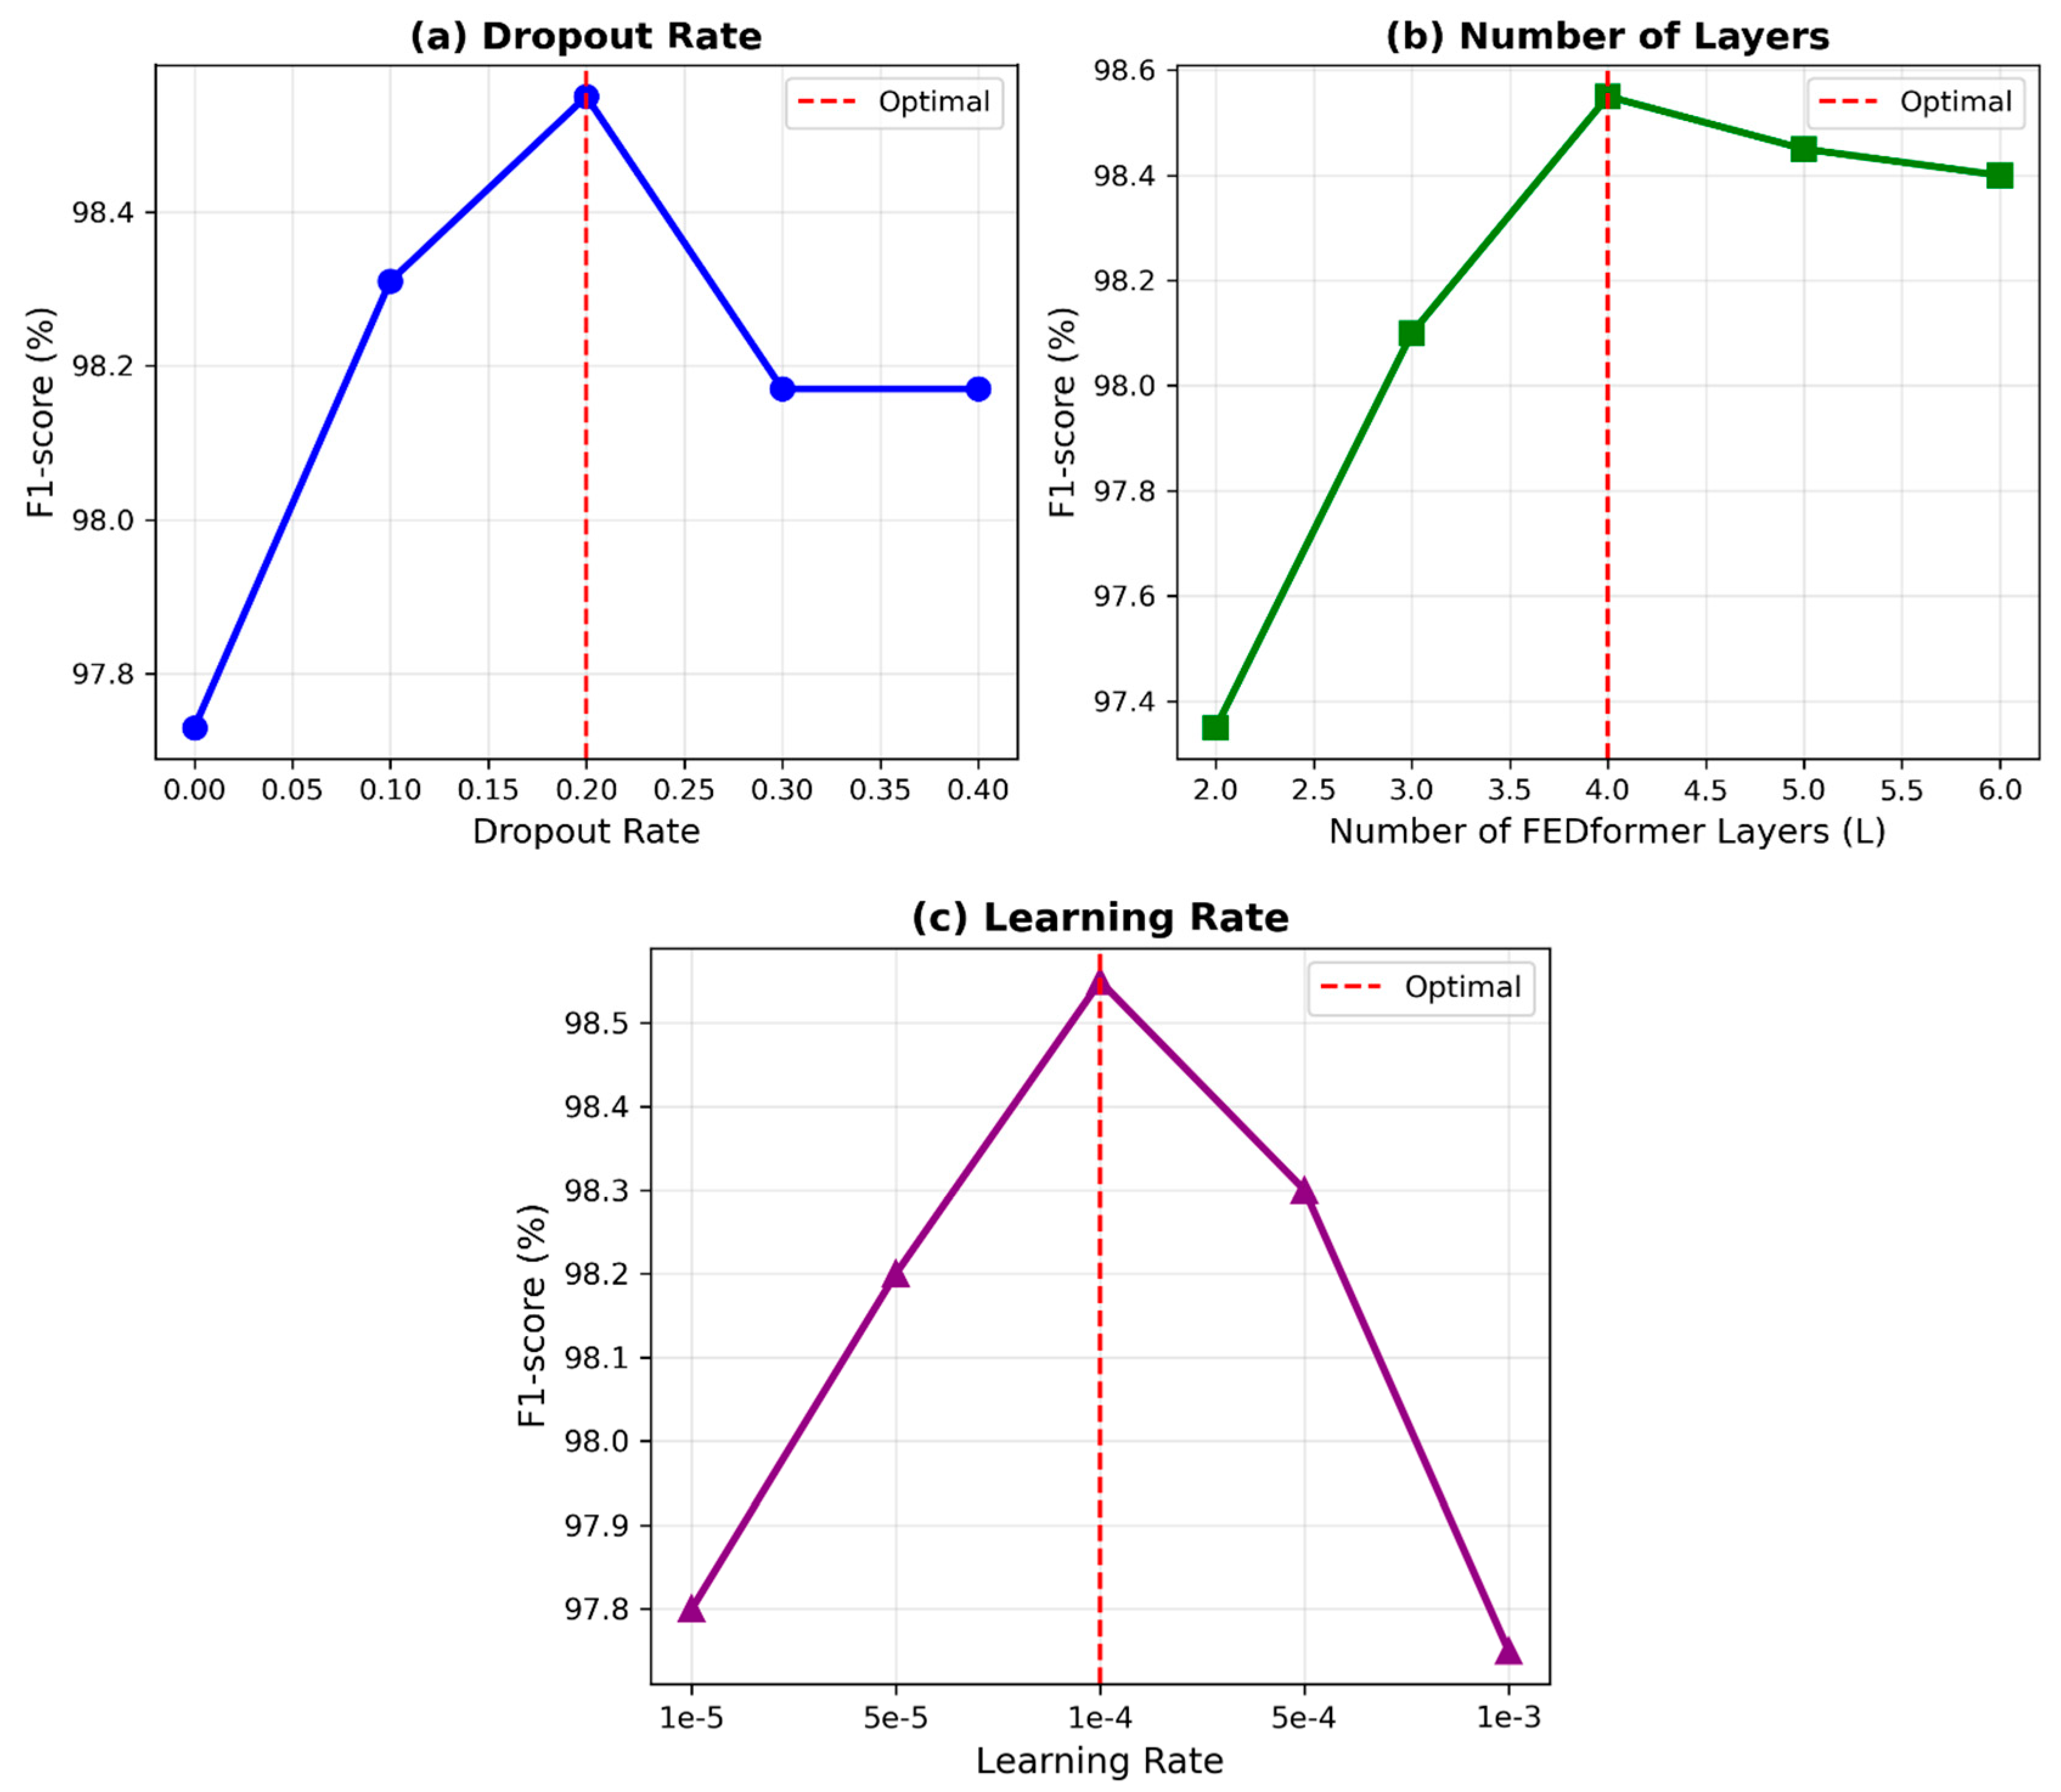
A comprehensive sensitivity analysis was conducted to evaluate the robustness of the proposed TLE-FEDformer framework to critical hyperparameters, including dropout rate (0.0–0.4 in increments of 0.1), number of FEDformer layers (L = 2–6 in increments of 1), learning rate (1 × 10⁻⁵ to 1 × 10⁻³ in logarithmic steps), and activation functions in the feed-forward networks (ReLU, Leaky ReLU, Swish, GELU). Experiments were performed by varying one or more parameters while fixing others at baseline values. Performance was assessed using F1-score and Intersection over Union (IoU) on the validation set after 100 epochs. Table 6 summarizes the individual effects of dropout rate, number of layers, and learning rate, highlighting the optimal configuration.
Table 6.
Sensitivity analysis results for individual hyperparameters. The values in bold are the best values.
Figure 15 illustrates the individual sensitivity trends against F1-score. Optimal performance is achieved at dropout = 0.2, L = 4, and LR = 1 × 10⁻⁴. Deviations result in measurable degradation: F1-score drops by 1.2% for L = 2 (insufficient capacity) and 0.8% for LR = 1 × 10⁻³ (training instability). Moderate dropout effectively mitigates overfitting while preserving features.
Figure 15.
Sensitivity analysis of individual hyperparameters on F1-score performance: (a) Dropout rate; (b) Number of FEDformer layers (L); (c) Learning rate. Optimal values are indicated by dashed lines.
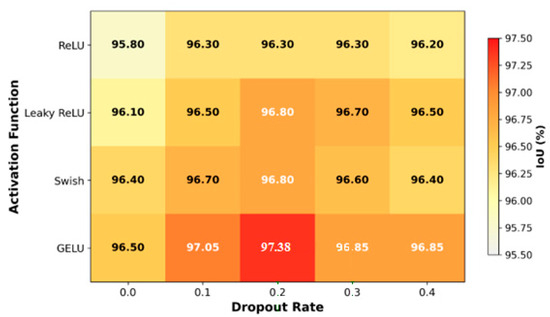
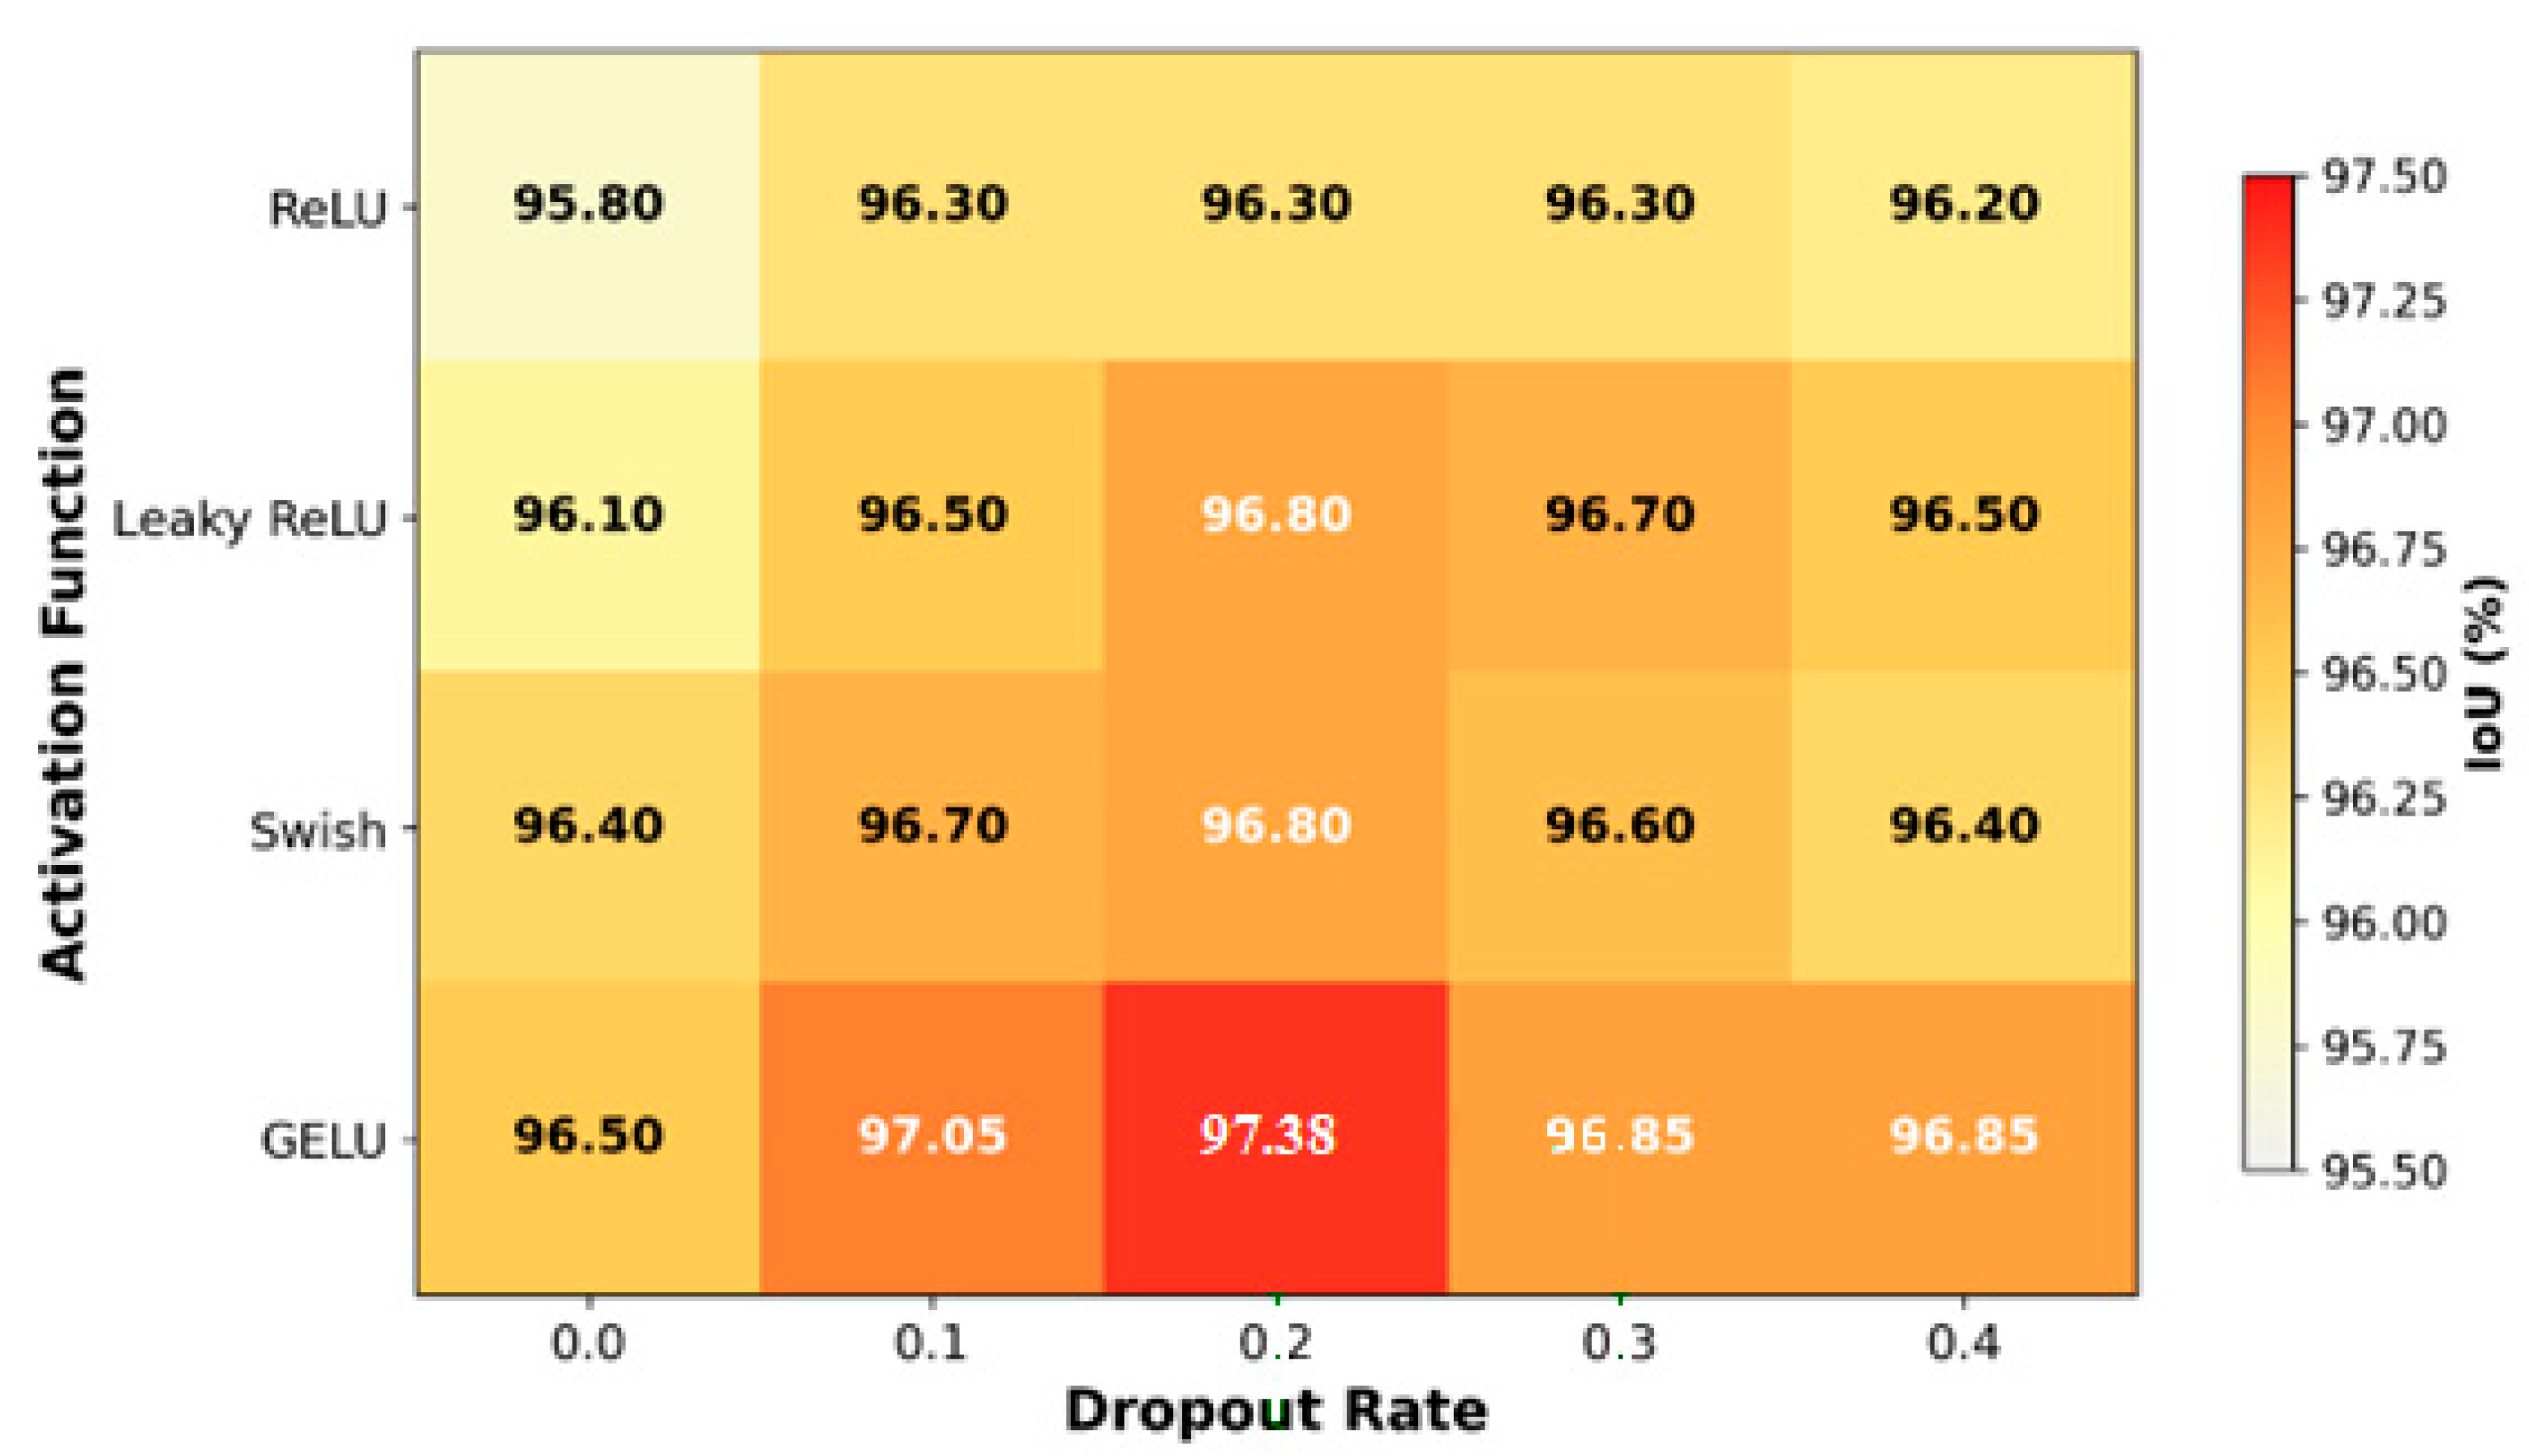
To examine combined effects, an additional analysis was performed on activation functions (ReLU, Leaky ReLU, Swish, GELU) and dropout rates. Figure 16 presents a heatmap of IoU across these combinations. GELU with dropout = 0.2 emerges as the optimal configuration, achieving the highest IoU (97.38%). This superiority stems from GELU’s smooth non-linearity and better gradient propagation in frequency-domain layers. Other activations show greater sensitivity to high dropout, with sharper declines. The heatmap confirms that moderate regularization with GELU provides the best balance for complex spatio-temporal flood patterns.
Figure 16.
Heatmap of Intersection over Union (IoU) performance across activation functions and dropout rates in the FEDformer module. The optimal combination (GELU with dropout = 0.2) is highlighted, demonstrating superior generalization.
Overall, the sensitivity analysis validates the selected hyperparameters (GELU activation, dropout = 0.2, L = 4, LR = 1 × 10⁻⁴) as robust and well-balanced, ensuring high accuracy, stability, and efficiency in multi-sensor flood mapping applications with limited labeled data.
4.6. Sensitivity Robustness Analysis Against Label Perturbation
To further address concerns regarding potential circular validation and labeling dependency, a robustness experiment was conducted by introducing controlled perturbations to the generated flood masks. Specifically, 5% and 10% random boundary perturbations were applied to the training labels to simulate moderate annotation uncertainty. The test set remained unchanged to ensure fair evaluation.
Table 7 summarizes the performance under perturbed labeling conditions. With 5% perturbation, the F1-score decreased slightly from 98.55% to 98.01%, and IoU decreased from 97.38% to 96.52%. Under the more severe 10% perturbation, the F1-score and IoU were reduced to 97.17% and 95.21%, respectively.
Table 7.
Robustness of TLE-FEDformer under label perturbation.
Despite the introduced noise, performance degradation remained limited (<2.2% IoU reduction), indicating that the proposed TLE-FEDformer does not merely replicate deterministic threshold-based masks. Instead, the model learns generalized spatial–spectral–temporal representations that remain stable under moderate labeling uncertainty. This experiment further supports the robustness and generalization capacity of the framework beyond strict multi-sensor intersection rules.
To analyze the influence of retained frequency components, cases k = 1, 2, and 3 are evaluated in the present study. Results showed that k = 2 achieved the highest IoU (97.38%), while k = 1 led to slight underfitting (IoU = 96.74%) and k = 3 introduced marginal noise (IoU = 97.05%). Therefore, k = 2 was selected for all reported experiments.
5. Discussion
The proposed TLE-FEDformer framework demonstrates a substantial advancement over existing flood inundation mapping approaches by effectively integrating multi-sensor data, frequency-domain temporal modeling, and transfer learning. On the 2019 Aq Qala flood event, the framework achieved an overall accuracy (OA) of 98.12%, an F1-score of 98.55%, and an IoU of 97.38%, clearly outperforming conventional deep learning baselines such as CNN-based models (IoU = 86.45%) and Capsule Networks (IoU = 96.11%). These performance gains reflect not only architectural improvements but also a more comprehensive representation of flood dynamics across space and time.
5.1. Comparison with Existing Literature
Most traditional flood mapping studies rely on spatial feature extraction using CNNs and are commonly limited to mono-temporal or bi-temporal image pairs. While effective for rapid mapping, such approaches are inherently constrained in capturing the temporal evolution of flood events, including onset, peak inundation, and recession phases. In contrast, the proposed framework explicitly models long-range temporal dependencies through frequency-domain decomposition, allowing it to capture both gradual trends and abrupt changes in flood extent. This capability is particularly relevant for flood processes, which are often non-stationary and influenced by complex hydrological forcing.
Recent Transformer-based approaches have attempted to address temporal modeling limitations. Yang et al. (2024) [21], for example, employed a decomposed attention mechanism for multi-source time-series flood mapping and reported strong classification performance. However, their model exhibited lower IoU values compared to TLE-FEDformer, particularly in heterogeneous land-cover settings. Similarly, Ge et al. [20] demonstrated the effectiveness of FEDformer-based architectures for time-series forecasting, yet their work focused primarily on prediction tasks and did not explicitly address multi-sensor remote-sensing fusion. The superior performance of TLE-FEDformer can be attributed to its tailored design, which jointly exploits transfer learning for robust spatial feature extraction, cross-modal SAR–optical fusion, and frequency-enhanced temporal modeling optimized for flood inundation dynamics.
SAR-only approaches remain popular due to their robustness under cloud-covered conditions. Studies summarized by Zhao et al. [11] highlight the effectiveness of SAR-based CNN and Transformer models in urban environments; however, such methods often struggle in vegetated floodplains and mixed land-cover areas. By integrating Sentinel-2 optical imagery with Sentinel-1 SAR data, the proposed framework mitigates these ambiguities and improves boundary delineation, resulting in an approximate 5% improvement in IoU over SAR-only Transformer-based approaches. Overall, the comparative analysis confirms that TLE-FEDformer consistently outperforms recent methods and demonstrates strong performance, particularly in challenging multi-temporal and multi-sensor flood mapping scenarios.
5.2. Uncertainties in Input Data and Model Parameters
Despite the strong performance achieved, several sources of uncertainty should be considered when interpreting the results. From a data perspective, multi-sensor flood mapping inherently involves uncertainties related to sensor characteristics, environmental conditions, and acquisition constraints. Optical imagery from Sentinel-2 is susceptible to cloud cover, atmospheric effects, and shadowing, which can result in missing or noisy observations during extreme flood events. Although Sentinel-1 SAR data mitigates cloud-related limitations, it introduces speckle noise and sensitivity to surface roughness, vegetation structure, and incidence angle variations. These factors may lead to misclassification in densely vegetated or topographically complex regions.
Temporal inconsistencies between SAR and optical acquisitions also contribute to uncertainty. Differences in revisit frequency and acquisition timing can produce temporal gaps, particularly during rapidly evolving flood events when peak inundation may occur between satellite overpasses. While the FEDformer module is designed to model irregular temporal patterns through frequency-domain decomposition, residual uncertainty may persist in areas with sparse temporal coverage. This effect is evident in the spatial uncertainty analysis, where lower standard deviation values (mean std ≈ 0.05) are observed in core flooded areas, while higher uncertainty (std ≈ 0.12) appears in transitional zones such as flood boundaries and vegetated floodplains.
Model-related uncertainties primarily arise from hyper-parameter selection and architectural design choices. Parameters such as learning rate, number of FEDformer layers, number of frequency modes, and fusion strategies directly influence performance and convergence behavior. Although the proposed framework demonstrates stable performance across experiments, a comprehensive sensitivity analysis would further quantify the influence of these parameters and enhance model interpretability. Additionally, transfer learning introduces potential bias toward the source domain, which may affect performance when applied to regions with distinct hydrological regimes or land-cover characteristics.
Although the ground truth masks were derived from conservative cross-sensor agreement to ensure high confidence, complete independence from input modalities cannot be strictly guaranteed. The robustness analysis presented in Section 4.6 demonstrates that the model remains stable under moderate label perturbation; however, future work should incorporate fully independent external reference datasets to further validate performance.
5.3. Limitations and Future Research Directions
Several limitations of the present study should be acknowledged. First, although the framework demonstrates strong performance and promising generalization, the primary evaluation is conducted on a limited number of flood events. This restricts the ability to fully assess performance across diverse climatic zones, terrain types, and flood mechanisms, such as flash floods versus riverine flooding. Expanding the experimental evaluation to larger and more heterogeneous regions would strengthen the robustness of the conclusions.
Second, the proposed framework assumes the availability of high-quality multi-sensor data. In near-real-time operational scenarios, data gaps caused by cloud contamination, delayed acquisitions, or sensor outages may reduce mapping accuracy. Additionally, while the inference time of approximately 41 ms per sample indicates computational efficiency, scaling the framework to ultra-high-resolution imagery or continental-scale applications could increase computational and memory demands.
Another limitation lies in the lack of explicit integration of physical hydrological variables, such as water depth, flow velocity, or precipitation intensity. The current framework focuses on flood extent mapping and does not directly incorporate hydrodynamic constraints, which could enhance physical interpretability and support more comprehensive flood risk assessment.
The operational applicability of the proposed framework is inherently linked to the revisit frequency of Sentinel-1 and Sentinel-2 satellites, which is typically 2–3 days depending on acquisition conditions. Consequently, the method is most suitable for flood events with multi-day persistence, where water inundation remains detectable during the satellite overpass window. Rapid flash floods with short-lived peak stages may not be fully captured due to temporal sampling limitations. This temporal constraint should be considered when applying the proposed approach in operational disaster response scenarios.
Future research should address these limitations by incorporating additional large-scale flood events from different geographic regions to further evaluate generalization capability. The integration of self-supervised or semi-supervised pretraining strategies could reduce reliance on labeled data and improve robustness in data-scarce environments. Coupling the proposed deep learning framework with hydrological or hydraulic models represents a promising direction for jointly estimating flood extent and depth. Furthermore, deploying the framework on cloud or edge-computing platforms could facilitate near-real-time flood monitoring. Extending the approach to multi-hazard scenarios, such as combined flood–landslide or flood–urban damage mapping, would further broaden its applicability in disaster management and decision-support systems.
6. Conclusions
Floods remain one of the most destructive natural hazards, intensified by climate change and rapid urbanization. This study introduced the Transfer Learning-Enhanced FEDformer (TLE-FEDformer), a novel end-to-end deep learning framework designed for accurate and temporally coherent flood inundation mapping. By synergistically integrating pre-trained Xception backbones for multi-sensor feature extraction from Sentinel-1 SAR and Sentinel-2 optical data, cross-modal fusion, and frequency-enhanced temporal modeling via FEDformer, the framework effectively captures complex flood dynamics, including onset, peak, duration, and recession phases.
Evaluated on the 2019 Aq Qala flood event in Iran, TLE-FEDformer gave a strong performance under short multi-temporal configurations, with an overall accuracy of 98.12%, F1-score of 98.55%, and IoU of 97.38%, significantly outperforming baselines such as CNNs (IoU = 86.45%), transfer learning alone (IoU = 92.52%), and Capsule Networks (IoU = 96.11%). Ablation studies confirmed the additive contributions of each component, while sensitivity analyses validated the robustness of the optimal configuration (GELU activation, dropout = 0.2, L = 4 layers, learning rate = 1 × 10⁻⁴). Computational efficiency was maintained with inference times of 41 ms per image, making the framework suitable for operational deployment.
These results underscore the value of frequency-domain Transformers combined with transfer learning for multi-sensor remote sensing applications. TLE-FEDformer advances operational flood monitoring by providing reliable, scalable, and temporally consistent mapping, with the potential to support early warning systems and damage assessment in flood-prone regions worldwide. Future extensions could include integration with hydrological models for depth estimation and adaptation to multi-hazard scenarios.
Author Contributions
Conceptualization: Pouya Ahmadi, M.J.V.Z., M.M., N.K., P.A. (Parya Ahmadi) and E.G.; Methodology, N.K.; Software and Validation, P.A. (Pouya Ahmadi) and P.A. (Parya Ahmadi); Formal analysis and investigation, P.A. (Pouya Ahmadi) and N.K.; Data Curation, P.A. (Pouya Ahmadi); writing—original draft preparation, P.A. (Pouya Ahmadi); writing—review and editing, M.J.V.Z., M.M., N.K., P.A. (Parya Ahmadi) and E.G.; Visualization, P.A. (Pouya Ahmadi); supervision, M.J.V.Z., M.M. and E.G.; funding acquisition, E.G. All authors have read and agreed to the published version of the manuscript.
Funding
For E. Ghaderpour: This research is funded by Space It Up, funded by the Italian Space Agency and the Ministry of University and Research—Contract No. 2024-5-E.0—CUP No. I53D24000060005. The open-access fee is covered by E. Ghaderpour from Progetti Piccoli di Ateneo 2025, Sapienza University of Rome, Italy. CUP: B83C25004290005.
Data Availability Statement
The code and data supporting the findings of this study are available from the authors upon reasonable request.
Acknowledgments
The authors thank the European Commission and European Space Agency for providing the Sentinel data utilized in this research. The authors sincerely thank the reviewers for their insightful and constructive comments. E. Ghaderpour acknowledges Space It Up, funded by the Italian Space Agency and the Ministry of University and Research—Contract No. 2024-5-E.0—CUP No. I53D24000060005.
Conflicts of Interest
The authors declare no conflicts of interest.
References
- United Nations Office for Disaster Risk Reduction (UNDRR). The Human Cost of Disasters: An Overview of the Last 20 Years (2000–2019); UNDRR: Geneva, Switzerland, 2020. [Google Scholar]
- Pörtner, H.-O.; Roberts, D.C.; Tignor, M.; Poloczanska, E.S.; Mintenbeck, K.; Alegría, A.; Craig, M.; Langsdorf, S.; Löschke, S.; Möller, V.; et al. (Eds.) Climate Change 2022: Impacts, Adaptation, and Vulnerability. Contribution of Working Group II to the Sixth Assessment Report of the Intergovernmental Panel on Climate Change; Cambridge University Press: Cambridge, UK; New York, NY, USA, 2022. [Google Scholar]
- Li, G.; Shao, W.; Su, X.; Li, Y.; Zhang, Y.; Song, T. Urban flood hazard assessment based on machine learning model. Water Resour. Manag. 2025, 39, 1953–1970. [Google Scholar] [CrossRef] [Scilit]
- Roohi, M.; Ghafouri, H.R.; Ashrafi, S.M. Advancing flood disaster management: Leveraging deep learning and remote sensing technologies. Acta Geophys. 2025, 73, 557–575. [Google Scholar] [CrossRef] [Scilit]
- Garg, S.; Dasgupta, A.; Motagh, M.; Martinis, S.; Selvakumaran, S. Unlocking the full potential of Sentinel-1 for flood detection in arid regions. Remote Sens. Environ. 2024, 315, 114417. [Google Scholar] [CrossRef] [Scilit]
- Haghshenas Haghighi, M. Large-scale mapping of flood using Sentinel-1 radar remote sensing. ISPRS Arch. 2022, XLIII-B3-2022, 1097–1102. [Google Scholar]
- Ahmadi, P.; Valadan Zoej, M.J.; Mokhtarzade, M.; Kardan Halvaie, N.; Ghaderpour, E. A capsule network framework for flood mapping integrating remote sensing fusion techniques. Environ. Res. Commun. 2025, 7, 065031. [Google Scholar] [CrossRef] [Scilit]
- Ghaderpour, E.; Mazzanti, P.; Scarascia Mugnozza, G.; Bozzano, F. Coherency and phase delay analyses between land cover and climate across Italy via the least-squares wavelet software. Int. J. Appl. Earth Obs. Geoinf. 2023, 118, 103241. [Google Scholar] [CrossRef] [Scilit]
- Pillai, L.G.; Dolly, D.R.J. Assessing Flood Mapping with Pre-and Post-Flood SAR Imagery: Advances, Challenges, and Performance Evaluation. In Proceedings of the 2025 International Conference on Data Science and Business Systems (ICDSBS), Chennai, India, 17 April 2025; IEEE: New York, NY, USA, 2025; pp. 1–6. [Google Scholar]
- Foroughnia, F.; Alfieri, S.M.; Menenti, M.; Lindenbergh, R. Evaluation of SAR and optical data for flood delineation using supervised and unsupervised classification. Remote Sens. 2022, 14, 3718. [Google Scholar] [CrossRef] [Scilit]
- Zhao, J.; Li, M.; Li, Y.; Matgen, P.; Chini, M. Urban flood mapping using satellite synthetic aperture radar data: A review of characteristics, approaches, and datasets. IEEE Geosci. Remote Sens. Mag. 2025, 13, 237–268. [Google Scholar] [CrossRef] [Scilit]
- Ghosh, B.; Garg, S.; Motagh, M. Automatic flood detection from sentinel-1 data using deep learning architectures. ISPRS Ann. Photogramm. Remote Sens. Spat. Inf. Sci. 2022, V-3-2022, 201–208. [Google Scholar] [CrossRef] [Scilit]
- Cao, J.; Shu, F.; Xu, H.; Wu, Q.; Niu, Y.; Zhao, J. A Novel Wetland Classification Method Combined CNN and SVM Using Multi-Source Remote Sensing Images. In Proceedings of the IGARSS 2024-2024 IEEE International Geoscience and Remote Sensing Symposium, Athens, Greece, 7–12 July 2024; IEEE: New York, NY, USA, 2024. [Google Scholar]
- Sibandze, P.; Kalumba, A.M.; Afuye, G.A.; Kganyago, M. Integrating remote sensing data and fully connected CNN for flood probability and risk assessment in the Port St Johns coastal town, South Africa. Remote Sens. Appl. Soc. Environ. 2025, 39, 101630. [Google Scholar] [CrossRef] [Scilit]
- Chang, W.; Yang, S.; Xi, X.; Wang, H.; Liu, Z.; Zhang, X.; Li, S.; Zhao, Y. Classification of seed maize using deep learning and transfer learning based on times series spectral feature reconstruction of remote sensing. Comput. Electron. Agric. 2025, 237, 110738. [Google Scholar] [CrossRef] [Scilit]
- Gholizade, M.; Soltanizadeh, H.; Rahmanimanesh, M.; Sana, S.S. A review of recent advances and strategies in transfer learning. Int. J. Syst. Assur. Eng. Manag. 2025, 16, 1123–1162. [Google Scholar] [CrossRef] [Scilit]
- Roy, S.K.; Jamali, A.; Chanussot, J.; Ghamisi, P.; Ghaderpour, E.; Shahabi, H. SimPoolFormer: A two-stream vision transformer for hyperspectral image classification. Remote Sens. Appl. Soc. Environ. 2025, 37, 101478. [Google Scholar] [CrossRef] [Scilit]
- Chamatidis, I.; Istrati, D.; Lagaros, N.D. Vision Transformer for Flood Detection Using Satellite Images from Sentinel-1 and Sentinel-2. Water 2024, 16, 1670. [Google Scholar] [CrossRef] [Scilit]
- Saluja, K.; Leong, W.Y.; Khaneja, T. Methods for Classifying Citrus Leaf Diseases through the Use of Ensemble Learning and Improvements in Transfer Learning. J. Artif. Intell. Technol. 2025, 5, 466–474. [Google Scholar] [CrossRef] [Scilit]
- Ge, L.; Huang, Q.; Zhu, F.; Chen, S. Advanced time series forecasting for commodities: Insights from the FEDformer model. Energy Econ. 2025, 147, 108513. [Google Scholar] [CrossRef] [Scilit]
- Yang, X.; Li, H.; Huang, X.; Feng, X. FEDAF: Frequency enhanced decomposed attention free transformer for long time series forecasting. Neural Comput. Appl. 2024, 36, 16271–16288. [Google Scholar] [CrossRef] [Scilit]
- Fan, Z.; Liang, R.; Hu, Y. A FEDformer-Based Hybrid Framework for Anomaly Detection and Risk Forecasting in Financial Time Series. arXiv 2025, arXiv:2511.12951. [Google Scholar] [CrossRef] [Scilit]
- Li, Y.; Liu, S.; Zhang, Y.; Liu, X.; Xia, M. A Ladder Water Level Prediction Model for the Yangtze River Based on Transfer Learning and Transformer. IEEE Trans. Geosci. Remote Sens. 2024, 62, 4211511. [Google Scholar] [CrossRef] [Scilit]
- Ghanavati, E.; Parsa Boromand, M.A.; Ahmadabadi, A. Spatial correlation analysis of vegetation changes with runoff height in Gorganrood Watershed. Quant. Geomorphol. Res. 2023, 12, 17–34. [Google Scholar]
- Yaghoobi, M.; Fathi, A.; Fazli, S.; Li, W.; Haghshenas, E.; Kuchak, V.S.; El-Askary, H. Impact of Land use dynamics on the water yields in the Gorgan river basin. Heliyon 2024, 10, e35674. [Google Scholar] [CrossRef] [Scilit] [PubMed]
- Golestan Regional Water Authority. Annual Report on Water Resources and Flood Management in Golestan Province; Golestan Regional Water Authority: Gorgan, Iran, 2023. [Google Scholar]
- Karami, J.; Ranjbari, S. Analysis of the 2019 flood in northern Iran. Nat. Hazards 2023, 117, 1957–1979. [Google Scholar]
- Farr, T.G.; Rosen, P.A.; Caro, E.; Crippen, R.; Duren, R.; Hensley, S.; Kobrick, M.; Paller, M.; Rodriguez, E.; Roth, L.; et al. The Shuttle Radar Topography Mission. Rev. Geophys. 2007, 45, RG2004. [Google Scholar] [CrossRef] [Scilit]
- Filipponi, F. Sentinel-1 GRD preprocessing workflow. Proceedings 2019, 18, 11. [Google Scholar] [CrossRef] [Scilit]
- Sebastianelli, A.; Buonaiuto, G.; Puca, S.; Bernardi, M.; Rossi, L.; Mascolo, L.; Picchiani, M. On the Use of Sentinel-1 Data for Flood Mapping in Urban Areas: The Role of Calibration and Validation Procedures. Remote Sens. 2022, 14, 934. [Google Scholar]
- Ranghetti, L.; Boschetti, M.; Nutini, F.; Busetto, L. Sen2Cor for Sentinel-2. Remote Sens. 2020, 12, 2789. [Google Scholar]
- Chollet, F. Xception: Deep Learning with Depthwise Separable Convolutions. In Proceedings of the IEEE Conference on Computer Vision and Pattern Recognition (CVPR), Honolulu, HI, USA, 21–26 July 2017; IEEE: New York, NY, USA, 2017; pp. 1251–1258. [Google Scholar]
- Zhou, T.; Ma, Z.; Wen, Q.; Wang, X.; Sun, L.; Jin, R. FEDformer: Frequency Enhanced Decomposed Transformer for Long-term Series Forecasting. In Proceedings of the International Conference on Machine Learning (ICML), Baltimore, MD, USA, 17–23 July 2022; PMLR: Cambridge, MA, USA, 2022; pp. 27268–27286. [Google Scholar]

Disclaimer/Publisher’s Note: The statements, opinions and data contained in all publications are solely those of the individual author(s) and contributor(s) and not of MDPI and/or the editor(s). MDPI and/or the editor(s) disclaim responsibility for any injury to people or property resulting from any ideas, methods, instructions or products referred to in the content. |
© 2026 by the authors. Licensee MDPI, Basel, Switzerland. This article is an open access article distributed under the terms and conditions of the Creative Commons Attribution (CC BY) license.