


Highlights
What are the main findings?
- Irrigated agriculture in the Djorf coastal zone expanded dramatically from 2005 to 2025, increasing four-fold, and was detected with high accuracy using GIS, remote sensing, and random forest classification.
- Groundwater levels in the Djorf aquifer declined significantly across almost all piezometric wells, with the sharpest drops occurring between 2015 and 2025, corresponding to rapid agricultural expansion in central and southern parts of the study area.
What are the implications of the main findings?
- The continued growth of irrigated cropland—despite regulatory restrictions—poses a critical threat to the sustainability of the Djorf aquifer.
- Immediate, evidence-based groundwater management interventions are needed to prevent further depletion in this vulnerable semi-arid coastal region.
Abstract
Assessing the impact of irrigated agriculture on Djorf groundwater is a fundamental key to the sustainable management of coastal freshwater resources. This study integrates Geographic Information Systems (GIS), remote sensing, and machine learning techniques to investigate the relationship between irrigated cropland in the coastal area and the water-level dynamics of the Djorf aquifer, located in the semi-arid region of southeastern Tunisia. A supervised classification using a Random Forest Model (RFM) and ground-truth GPS data was applied to detect irrigated areas in the coastal zone of Djorf. The model showed good performance, with an overall accuracy of 0.99. Moreover, the kappa values varied from 0.72 to 0.94 from 2005 to 2025. The Djorf aquifer experienced an expansion of irrigated agriculture, with an increase in area from approximately 400 ha in 2005 to 500 ha in 2015 and 1600 ha in 2025. This expansion of irrigated agriculture led to a reduction in groundwater level by 1.5 m from 2005 to 2015 and by 5 m from 2015 to 2025, as indicated by the Tajerjemet piezometric well in the southern part of the Djorf area. In the northern part, the groundwater level remained unchanged from 2005 to 2015 but decreased by 3 m from 2015 to 2025, as indicated by the Garaat Tyour piezometric well. In the center of the zone, the groundwater level decreased by 1.5 m from 2005 to 2015 and by about 9 m from 2015 to 2025, as recorded by the Henchir Arrassa piezometric well. The significant drop in groundwater levels over the last decade, from 2015 to 2025, is attributed to the substantial expansion of irrigated agriculture. The irrigated agricultural area continues to expand despite the Tunisian law classifying the Djorf zone as a restricted area for water well drilling, aimed at minimizing the degradation of groundwater in the Djorf aquifer. Alarmingly, the aquifer has resumed a rapid decrease since 2015, and urgent action is needed to prevent further degradation.
1. Introduction
Water management sustainability has become a key fundamental task, especially in arid and semi-arid zones that suffer from scarcity in water resources and are under noteworthy pressure. Irrigated crops present approximately 70% of global water consumers, and thus the agriculture sector is the largest contributor. In these arid and semi-arid environments, agricultural production has become based on irrigation, but it is uncontrolled. This amplification of water use has been directed to ecological inequalities, particularly groundwater overexploitation [1].
Many studies have focused on the effects of irrigated agriculture areas’ expansion on groundwater in several zones around the world, such as Central Asia, Egypt, Argentina and Portugal. Research has emphasized the environmental consequences, including the decline in aquifer water levels and aquifer degradation of water resources [2,3,4]. Moreover, several studies have examined the temporal evolution of irrigated areas. For example, Ahoton et al. [5] found that the irrigated agriculture area increased noticeably in the Ouémé Basin, reaching 1883 km2 in 2022 after being 755 km2 in 2014. In addition, Assaoui [6] noticed that the irrigated areas increased from 2200 ha to 20,000 ha between 1973 and 2005. Irrigated agriculture mapping using earth observations has perceived important developments. These techniques are based on different machine learning models, spectral bands, and remote sensing data combination to accurately detect and map irrigated areas. For instance, in an irrigated zone in Australia, 97.6% of classification accuracy was achieved by the application of the shortwave infrared transformed reflectance (STR) technique, while the thermal method reached 93.9% [7]. The deep convolutional neural networks (DCNN) algorithm applied on Sentinel-2 Level 1C data has shown highly accurate classification of irrigated areas, with 0.88 and 0.91 of kappa coefficients [8,9]. The random forest was used with Sentinel-1 imagery, producing irrigation maps with good accuracy in the Gumara and Bilate watersheds in Ethiopia, with rates of classification of 87% and 88%, respectively [10]. Furthermore, the role played by the spectral indices in identifying irrigated areas is essential. For example, to separate the irrigated and rainfed agriculture, the Normalized Difference Vegetation Index (NDVI) is broadly applied by analyzing the moisture content and the density of vegetation. To enhance the classification, machine learning algorithms such as time series forests (TSF) and support vector machine (SVM) have been used to analyze spectral indices time series [11,12]. These techniques can detect irrigated agriculture, examine their temporal variation [5,6], and correlate these findings with water resources and soil quality investigations [13]. Ferreira et al. [2], have reported that an increase in irrigated area led to a stress in groundwater resources. Furthermore, Liberoff and Poca [3] have concluded that irrigated areas expansion has led to groundwater degradation due to a salinity increase.
On the other hand, in Tunisia, 26% of aquifers are overexploited by a rate of 146% [14]. Agriculture consumes approximately 80% of all water abstracted in the country, and 74% of its consumption comes from groundwater [15]. These pressures were amplified by the effects of climate change, especially through the increase in precipitation variability. The agricultural sector in Tunisia provides about 16% of the labor force and contributes 13% of GDP [16]. In addition, 25% of new jobs were provided by agriculture during the 9th Plan period (1997–2001) [17]. Government decentralization increased with the creation of Regional Agricultural Development Offices (CRDA) in 1989 and the local water user associations for irrigation management and rural water supply.
In this context, the Djorf Peninsula presents an appropriate case study as a part of the Djeffara basin of Medenine, which is in a semi-arid zone of Southeastern Tunisia. This area is characterized by a high potential of agricultural activities. Thus, this led to a noticeable increase in groundwater resources exploitation, which threatens the sustainability of the hydrological ecosystem [18,19]. This dynamic creates a vicious cycle: groundwater level decrease was accelerated by the expansion of irrigated areas, which need more water use to compensate for the deficit in rainfall. The weakness of the aforementioned studies in the Djorf Peninsula is that they did not employ the advantage of remote sensing data to emphasize the noticeable expansion of irrigated areas, as well as they did not clearly quantify the effects of this increase on groundwater level.
This study aims to assess the impacts of changes in irrigated area on groundwater resources in arid to semi-arid coastal aquifer Djorf by applying satellite data and machine learning. Thus, this study has two objectives: (1) to map and analyze the irrigated areas dynamic in the Djorf Peninsula during the years 2005, 2015, and 2025 and (2) to assess the impacts of spatio-temporal dynamics of irrigated areas in the Djorf Peninsula on groundwater resources.
2. Materials and Methods
2.1. Study Area
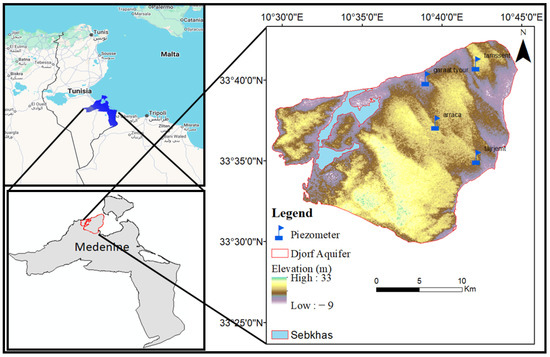
The research area encompasses the Djorf Peninsula, situated within the large coastal plain of Djeffara located in Southeastern Tunisia (Figure 1). The study area exhibits an arid to semi-arid climate shaped by hot, dry air masses originating from the desert. Precipitation is inconsistent and erratic annually. The region receives an average annual rainfall of 225 mm to under 100 mm [20]. Relative humidity ranges from 43% to 84%, while temperatures span from about 10 °C in winter to nearly 45 °C in summer [12]. Annual evaporation surpasses 1700 mm. Due to extended droughts and scarce surface water, the area exhibits an intermittent flow regime. As a result, groundwater constitutes the principal water supply for meeting diverse consumption demands [20]. The shallow aquifers like Djorf present the main water supply for agriculture activities due to the easy access for farmers to satisfy the agricultural need [21], while the deep confined aquifer (300 m depth) is mainly used for domestic and drinking use.
Figure 1.
The location of the study area (Djorf Peninsula).
The Djorf Peninsula occupied an area of around 314.6 km2. It is well known by the intensive agriculture activities, primarily growing olive trees, reed and leaf vegetables. The main irrigation technique between the 90s and 2000s was the flood and runoff technique, which is a wasteful and consuming water technique. After the 2000s, farmers started using economical irrigation techniques such as the drip irrigation technique (CRDA of Medenine 2017).
The structural context of the Djorf is predominated by faults with low discharge, arranged in a direction mainly NW–SE. These faults are exposed and steep. Villafranchian formations rest on the top of Mio–Pliocene. The Quaternary cover is composed basically of red silts having the age of Holocene–Pleistocene, in addition to fine silts and late-Pleistocene conglomerates overlaid by gypsum crusts [22]. Regional stratigraphy is generally characterized by Villafranchian crusts overlying a thick Mio–Pliocene sequence. Villafranchian deposits include salmon-colored limestone crusts [23], calcareous crusts, and silt nodules. These formations shape the landscape into a distinctive pattern of alternating elevated and lower plateaus separated by depressions such as sebkhas, garats, and bahiras. The Mio–Pliocene series represents the marine infill of the Jeffara basin, with its thickness increasing toward the northeast and reaching several hundred meters. Outcrops of these deposits typically appear at the base of cliffs surrounding the depressions. The series contains various facies, including red clays—sometimes silty and rich in gypsum crystals—forming the upper levels of the sequence, fine yellow sands, and conglomerates or sandstones. The coastal shallow aquifer is logged in Mio–Plio Quaternary deposits, which is formed by alternative deposition of conglomerates, gypsum, limestone, sands and clay [21,22]. Soils in the research area are characterized by sandy, silty, and clay deposits. The infiltration coefficient average of about 4% is considered as a factor of groundwater recharge. So, the fraction of water infiltrated is near 0.3 mm3/year [21].
2.2. Data
A combination of two types of datasets has been used in this study, earth observations and field data.
2.2.1. Earth Observations
Earth observations consist of using Landsat data, which is a program of the United States Geological Survey (USGS) National Land Imaging (NLI) Program, which has provided a continuous, reliable, and comparable source of Earth observation data since 1974. Landsat is a series of earth observations satellites operated jointly by National Aeronautics and Space Administration (NASA) and USGS, capturing multispectral images of the Earth’s surface at a spatial resolution of 30. These Landsat images have become indispensable for numerous applications across diverse fields such as agriculture, urban planning, environment and forestry. Landsat imagery represents the group of satellite images captured by the Landsat program. This study used Landsat 5 TM images for the year 2005 and Landsat 8 OLI data for the years 2015 and 2025; both data have 30 m spatial resolution (Table 1). For the purpose of classification validation, images were taken from Sentinel-2 Level 1C with a spatial resolution 10 m of the years 2015 and 2025 (Table 1). To safeguard distinction between irrigated and rainfed agricultural areas, images were collected in summer (June, July and August), a basic irrigation period in the southeastern part of Tunisia. A composite of June, July and August was generated based on the median to improve the accuracy of classification and diminish seasonal variability (Table 1).
Table 1.
Characteristics of satellite images.
2.2.2. Field Data
This study used ground truth data of Djorf groundwater level for the years 2005, 2015 and 2025. This data was collected from the Regional Authority of Agricultural Development (CRDA), Water Resources Department of Medenine (Table 2). Furthermore, irrigated crops were previously collected using GPS by the Department of Statistics in the same Authority. Moreover, this study focuses basically on extraction and mapping the dynamic of irrigated areas. Two classes were distinguished, irrigated areas and others (including bare, urban, grass, forest, rainfed), and 120 samples for each year were collected for each of these two classes (Table 2).
Table 2.
Ground-truth data.
2.3. Method
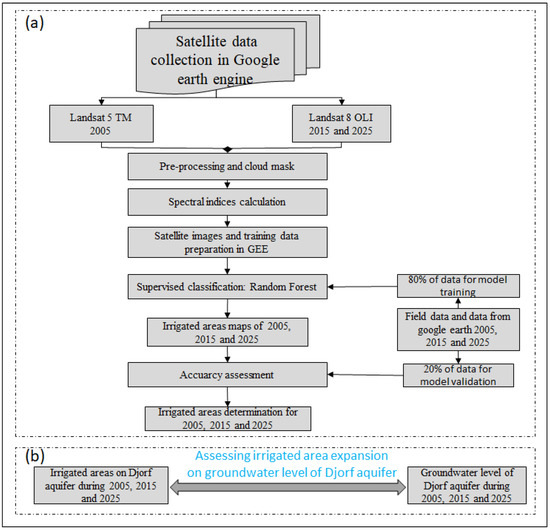
The implemented methodology (Figure 2) is intended to detect, map, and assess irrigated areas for the years 2005, 2015 and 2025 by classifying satellite images from Landsat thematic mapper 5 (TM5) and Landsat and operational land imager 8 (OLI8), in combination with groundwater level collected from water wells on the field (Figure 1). This method enriches the understanding of the interaction between agriculture irrigation and groundwater level. The global approach is organized into two main parts: irrigated area mapping and analyzing and assessing the impacts of irrigated areas changes on groundwater level.
Figure 2.
The conceptual framework of this study: (a) Irrigated areas dynamic mapping, (b) Assessing the impact of irrigated area expansion on groundwater level.
Irrigation Area Monitoring
Utilized imagery are generated as Surface Reflectance products Collection 2 by Landsat. These images were corrected atmospherically on the cloud platform Google Earth Engine (GEE) to guarantee radiometric consistency. For Landsat 8, the LaSRC method was used [24], and for Landsat 5, the LEDAPS technique was applied [25]. Data were cleaned by masking pixels by Cloud using GEE functions designed to different sensors; for Landsat 8, cloudMaskL457 was applied and maskL8sr was used, based on assuring the quality of pixel (pixel_qa) band [26]. During recent decades, cloud computing platforms have been widely used in the processing of satellite imageries and calculating indices. GEE is one of these powerful platforms. It compromises a wide range of satellite images and offers robust image processing tools, geospatial analysis at large-scale and visualization [27,28]. Focusing on soil moisture, vegetation density, and indicators of crop health to improve irrigated areas mapping, four spectral indices were computed based on Landsat imageries applying GEE environment. Images from Sentinel-2 Level 1C were handled in the same environment. The atmospheric correction of Surface Reflectance in Sentinel-2 data is processed applying the Sen2Cor algorithm established by ESA. Classification was done using the random forest algorithm in GEE. The last process was calculating the irrigated agriculture areas and cartographic layout using GIS. GIS softwares, e.g., ArcGIS version 10.8, are applied in analysis, visualization and management of spatial data. The machine learning was applied to irrigated areas by using random forest algorithm to map the areas. Random forest builds numerous decision trees by training each tree on a random subset of the training data and features, which means using a random selection of factors and training data. The two most crucial input parameters for this classifier are the size of the training samples, which is 120 points for each class in this study, and the number of trees generated, which is 200 trees in this case [29]. To improve the classification accuracy, four spectral indices were computed using GEE platform after being clipped by applying Djorf geographical boundaries. These indices were chosen to extract basic biophysical characteristics, including crop health, soil moisture, and vegetation density. The Normalized Difference Vegetation Index (NDVI) [30] is one of the utilized indices in this study. The NDVI calculates the density of vegetation by using the two spectral bands, the red (RED) and near-infrared (NIR); it is computed as shown in Equation (1) (Table 3).
Table 3.
Used spectral indices.
Broadly applied in earth observations, NDVI allows researchers to distinguish zones with no or under stress vegetation and vegetated zones with high-density. Additionally, it is used for the planning of agricultural mechanization [31]. To enhance the estimation of the vegetation density, the Soil-Adjusted Vegetation Index (SAVI) [32] is used. The SAVI reduces noise and effects caused by the reflectance of bare soil, moisture, and roughness [33]. The effectiveness of the SAVI has been validated across different areas, including the Plain of Jeffara in Libya, where it demonstrated high performance with a correlation coefficient (R2) of 0.88 [34]. Furthermore, recent studies revealed that utilizing a negative soil-adjustment factor can improve the accuracy of this index in areas of dense vegetation, providing more precise Leaf Area Index (LAI) estimations [35]. This adjustment enhances SAVI’s utility for monitoring vegetation health and density in environments with highly variable soil and vegetation cover. The index is computed using Equation (2) (Table 3). In addition, two indices were used to assess vegetation and soil water content: the Normalized Difference Water Index (NDWI) and Moisture Stress Index (MSI). According to Rock et al. [36], MSI employs the shortwave infrared (SWIR1) and the near-infrared (NIR) bands (Table 3; Equation (3)) to recognize parts where crops are under water stress. Gao [37] defined the NDWI based on the NIR and SWIR1 bands (Table 3; Equation (4)) to identify water existence or evaluate water in leaves, presenting a crucial indicator for crops’ water content monitoring. NDWI and MSI improve crop management by providing real-time visions into sustainable agricultural performance and food security [38]. According to Lee et al. [39], they used 50 training samples and could evaluate the machine learning model used in the study by reaching an accuracy of 90%, and based on Basheer et al. [29], every classification class should have a minimum of 50 training samples. The collected 120 samples for each year and each class as described in Table 2, which were split into training samples (100) while 20 points were used for validation. The kappa (Kc) and overall accuracy (OAc) coefficients were used as performance metrics to evaluate the effectiveness of the applied algorithm for extraction and mapping irrigated agriculture dynamics. The OAc is the ratio of samples that are classified correctly to the total samples. It is calculated by the following formula:
where OAc: overall accuracy coefficient.
The kappa coefficient determines the agreement between the actual and predicted classifications, correcting for occurred by chance agreement. It is computed using this formula:
where Kc: kappa coefficient.
3. Results
3.1. Classification Performance
The consistently high overall accuracy (0.99) and kappa values (0.72–0.94) reveal the quality seal for the classification (Table 4). This indicates that we can be over 99% confident that the dramatic irrigated areas expansion mapped in this study is real, not an artifact of a poor model. This high performance of irrigated area classification was confirmed and validated by applying the same model using high resolution data from Sentinel-2 (10 m). The findings indicated almost the same high values of overall accuracy of 0.99, and the kappa varies between 0.82 and 0.89 (Table 4). This level of transformation is a profound anthropogenic signal on the landscape.
Table 4.
Accuracy assessment of irrigated areas classification.
The accuracy coefficients of Landsat 8 (0.998) and Sentinel-2 (0.995) in 2015 were comparable (Table 4). In 2025, both datasets achieved an accuracy coefficient of 0.997 (Table 4), demonstrating that the inclusion of Sentinel-2 imagery from August and September did not yield a statistically significant improvement or decline in overall accuracy.
3.2. Irrigated Area Dynamics
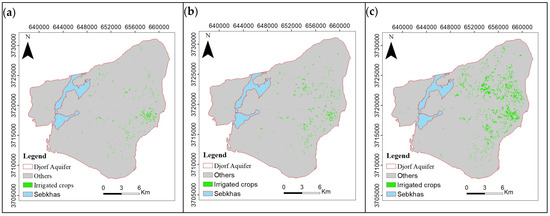
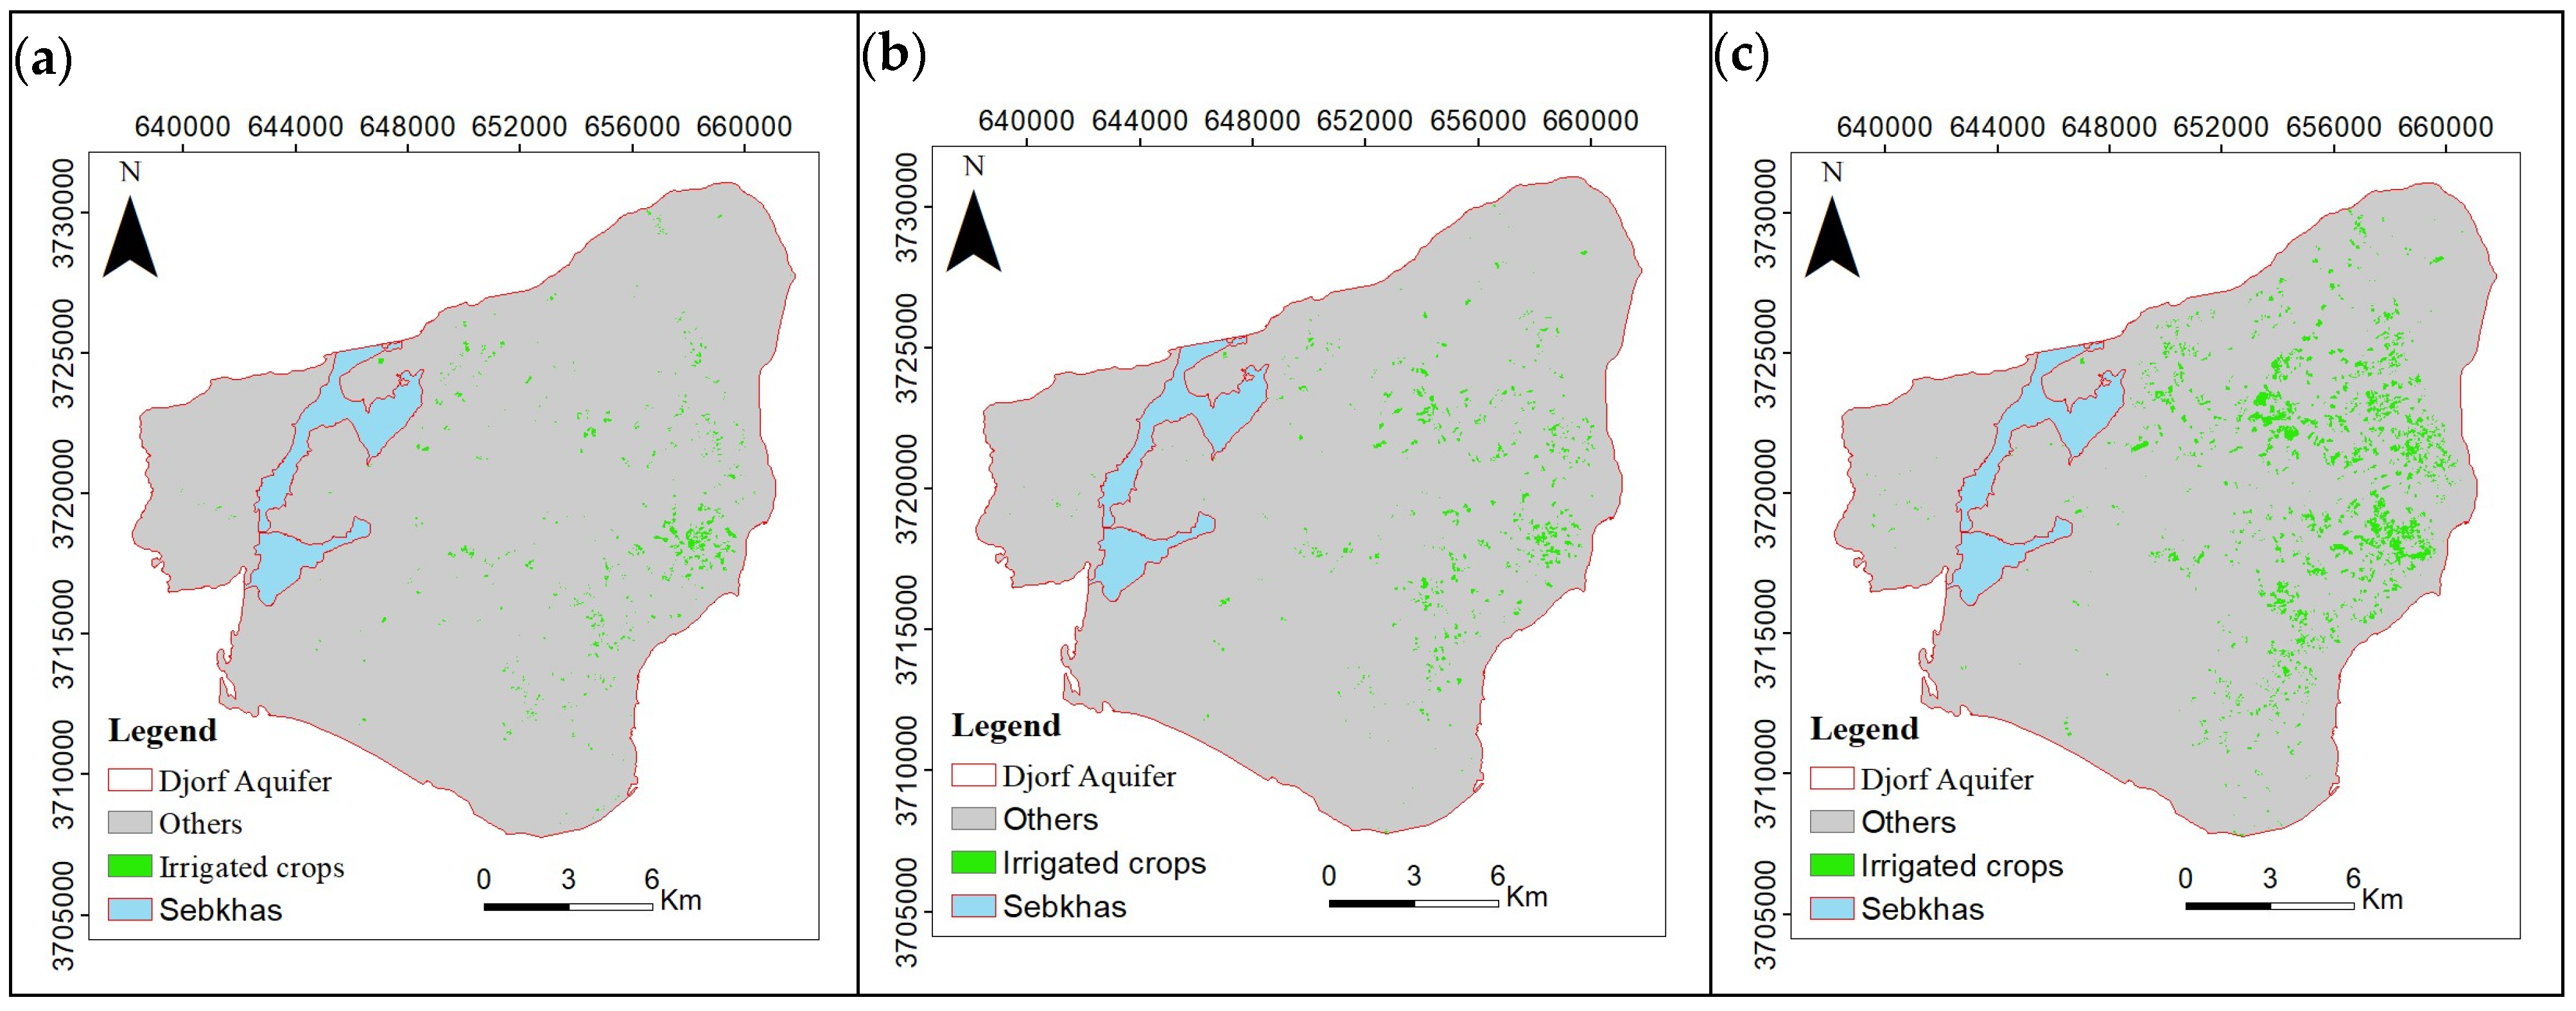
Globally, the generated maps of irrigated areas based on Landsat imageries showed for the year 2005 an intensive irrigated cropland activity in Tajerjemt, located in the southeastern part of the Peninsula (Figure 3a). Similarly, for the year 2015, the map showed that the most dominated area by irrigated agriculture is Tajerjemt, and it started to expand to different parts of the study area, especially the northwestern part of the study area (Figure 3b). During 2025, the irrigated areas dramatically increased and expanded to the north of the Djorf area (Figure 3c).
Figure 3.
Irrigated areas dynamic mapping using Landsat data during (a) 2005, (b) 2015 and (c) 2025.
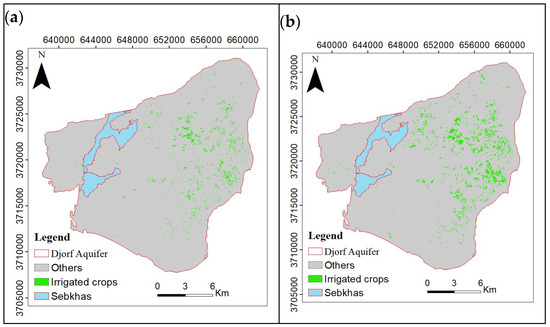
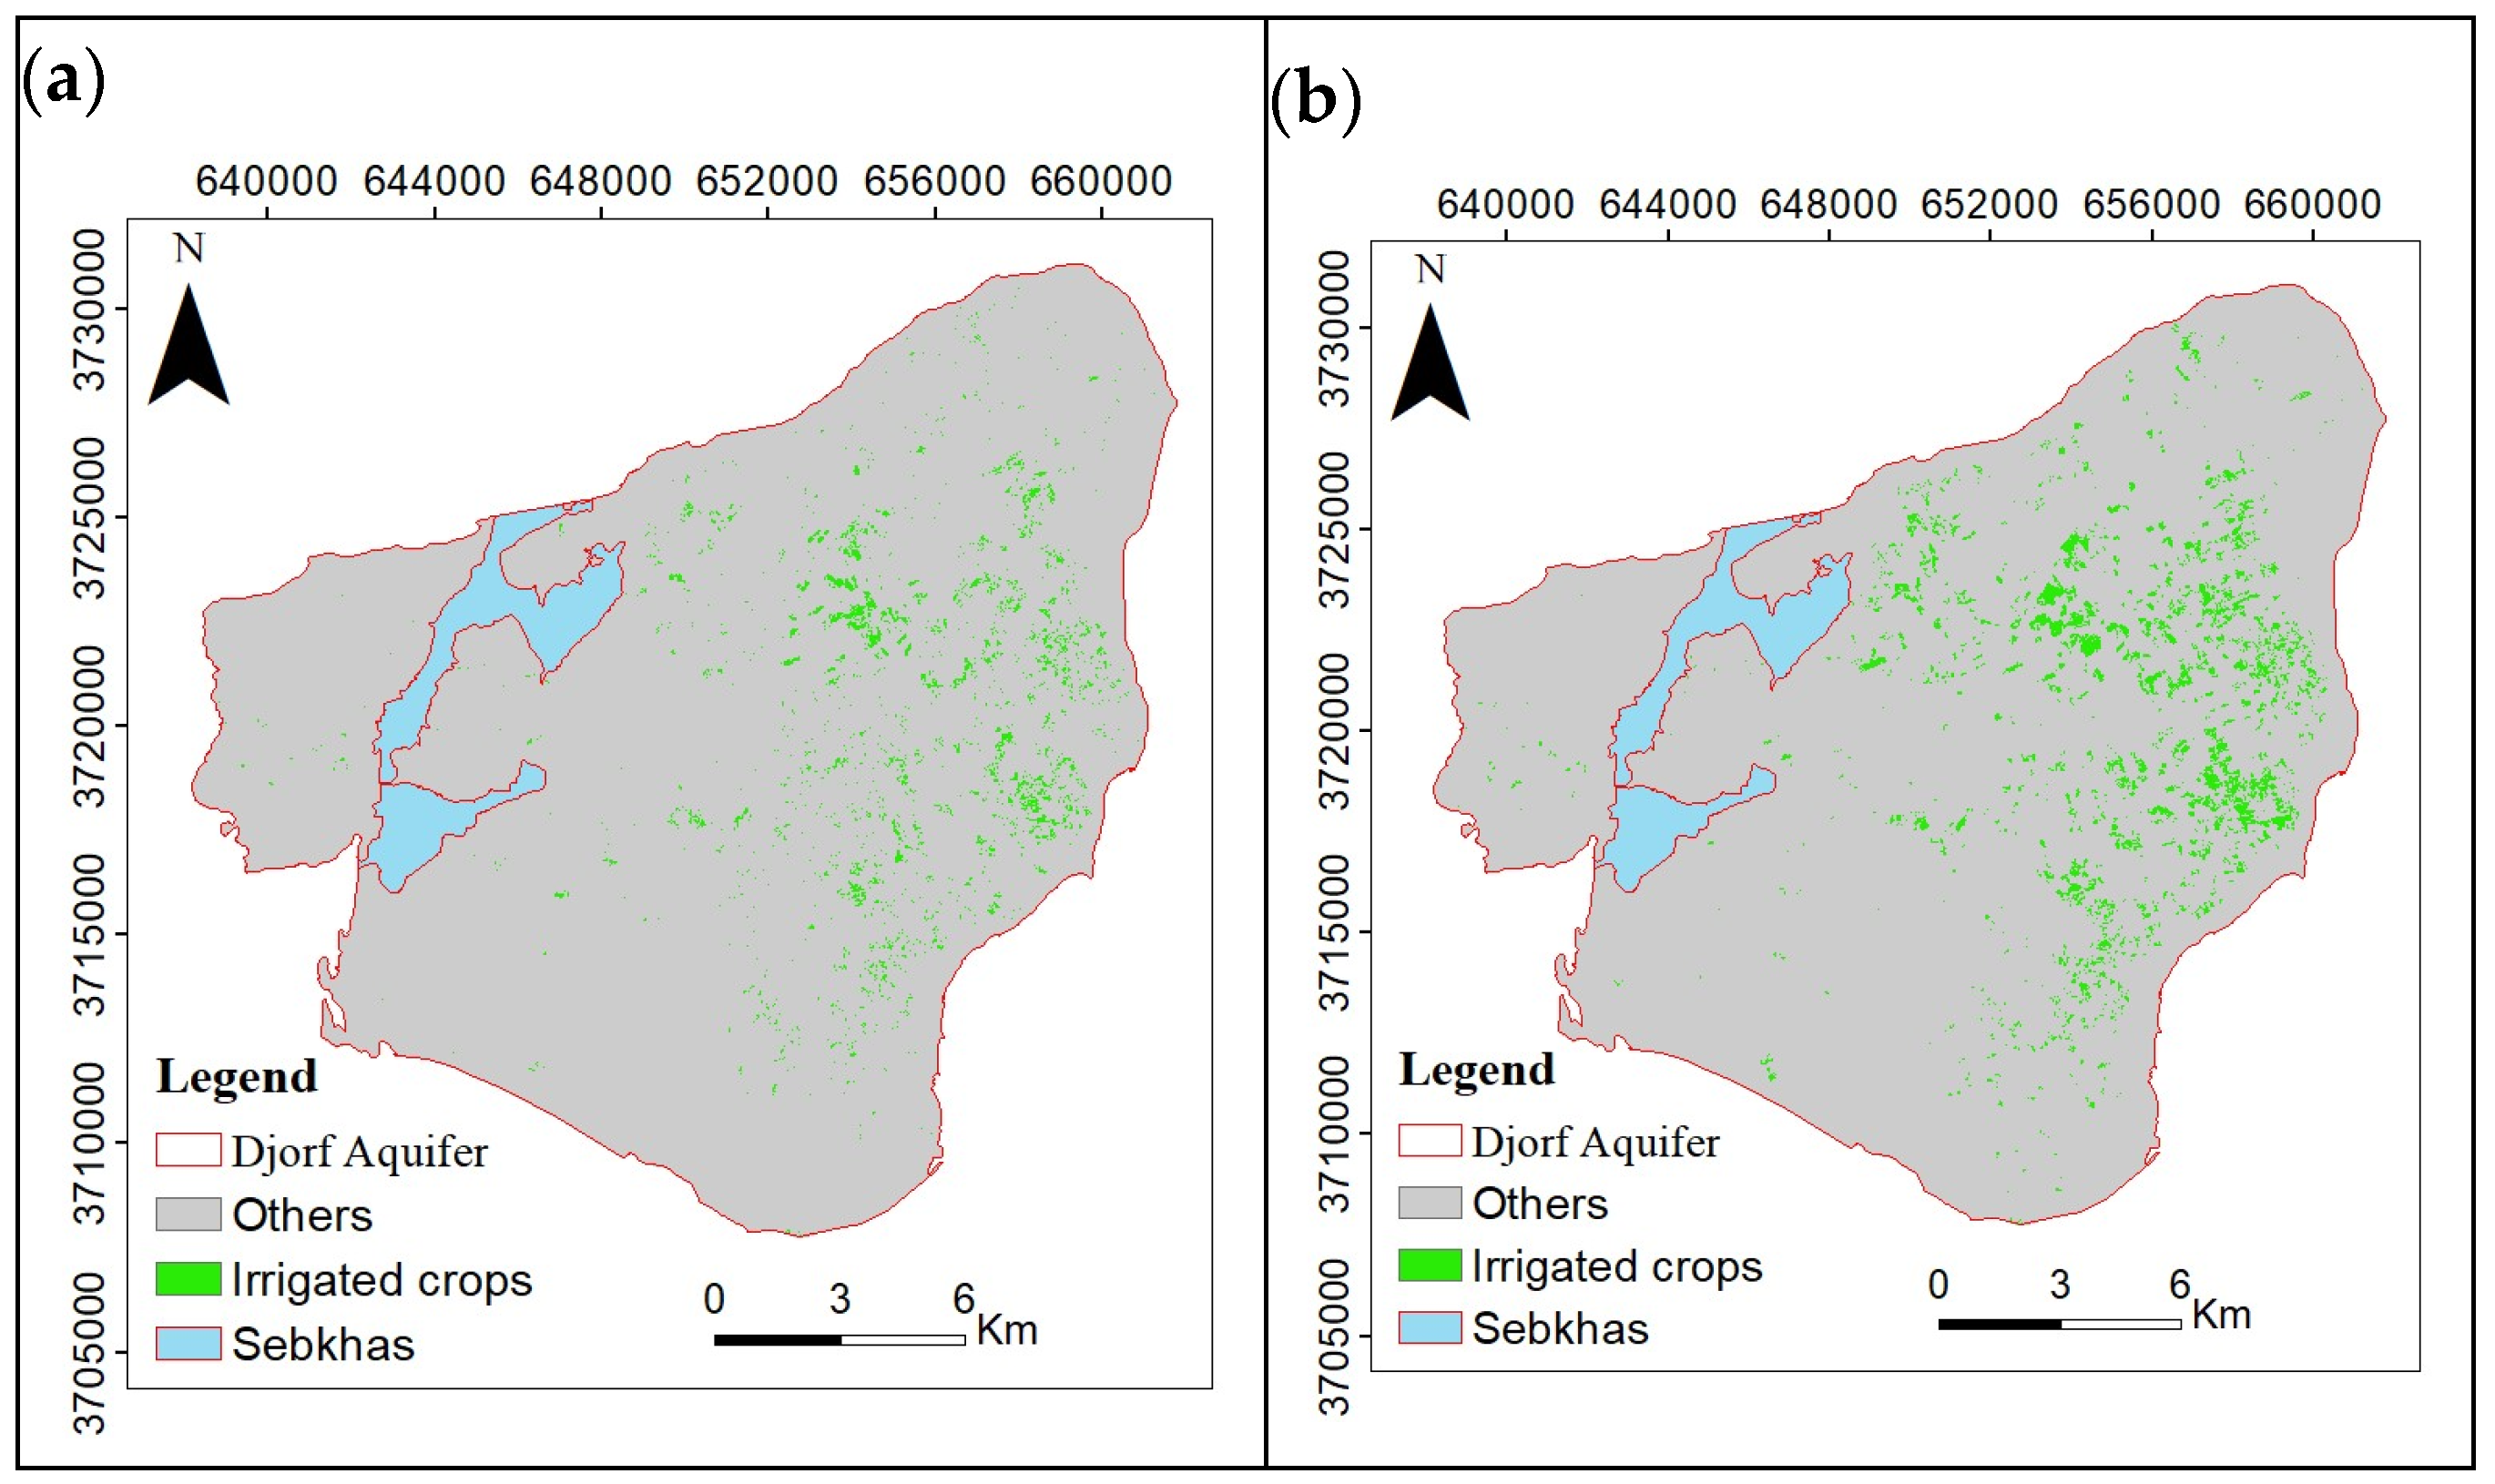
To validate the maps generated based on Landsat imageries, the same random forest algorithm was used to extract irrigated areas based on high spatial resolution satellite data from Sentinel-2 (10 m). The same findings were shown by the maps produced based on Sentinel-2 imageries for the two available years, 2015 and 2025 (Figure 4). A difference is shown for the map of 2015 from Sentinel-2 (Figure 4a) which indicates almost the same pattern, but the irrigated area is slightly higher than the map 2015 generated based on Landsat, and this is probably due to the availability of Sentinel-2 imageries for the year 2015, which is available without gaps after August (August and September). The map of 2025 generated based on Sentinel-2 (Figure 4b) showed very high similarity with the map 2025 produced using Landsat.
Figure 4.
Irrigated areas dynamic mapping using Sentinel-2 data during (a) 2015 and (b) 2025.
Table 5 confirmed the expansion of irrigated areas shown in Figure 3 and Figure 4. The map generated using Sentinel-2 indicated more irrigated area than Landsat in 2015 (268.8 ha), while it showed less irrigated areas in 2025 (−80 ha) (Table 5). This difference is probably due to the availability of Sentinel-2 in 2015, which was available without gaps in August and September, while for Landsat 8 it was available for June, July and August. For 2025, the irrigated area extracted based on the two-satellite data was similar (Table 5).
Table 5.
Irrigated area estimated using Landsat and Sentinel-2.
3.3. Impacts of Irrigated Area Expansion on Groundwater Level
The irrigated area increased by 100 ha from 2005 to 2015 (Table 6), and it showed an expansion almost three times from 494 ha in 2015 to 1600 ha in 2025 (1102 ha), and the total increase from 2005 to 2025 is 1197 ha (Table 6).
Table 6.
Total irrigated area and changes during 2005, 2015 and 2025.
This increase in irrigated agriculture required additional water for irrigation. Moreover, the irrigation is totally based on extraction of the groundwater from the shallow aquifer of Djorf. In this part of the study, the groundwater-level data of the three years 2005, 2015 and 2025 is analyzed in parallel with analyzing the expansion of irrigated areas.
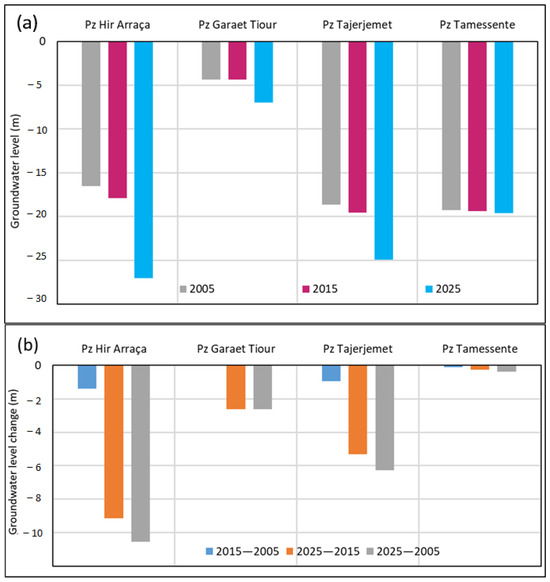
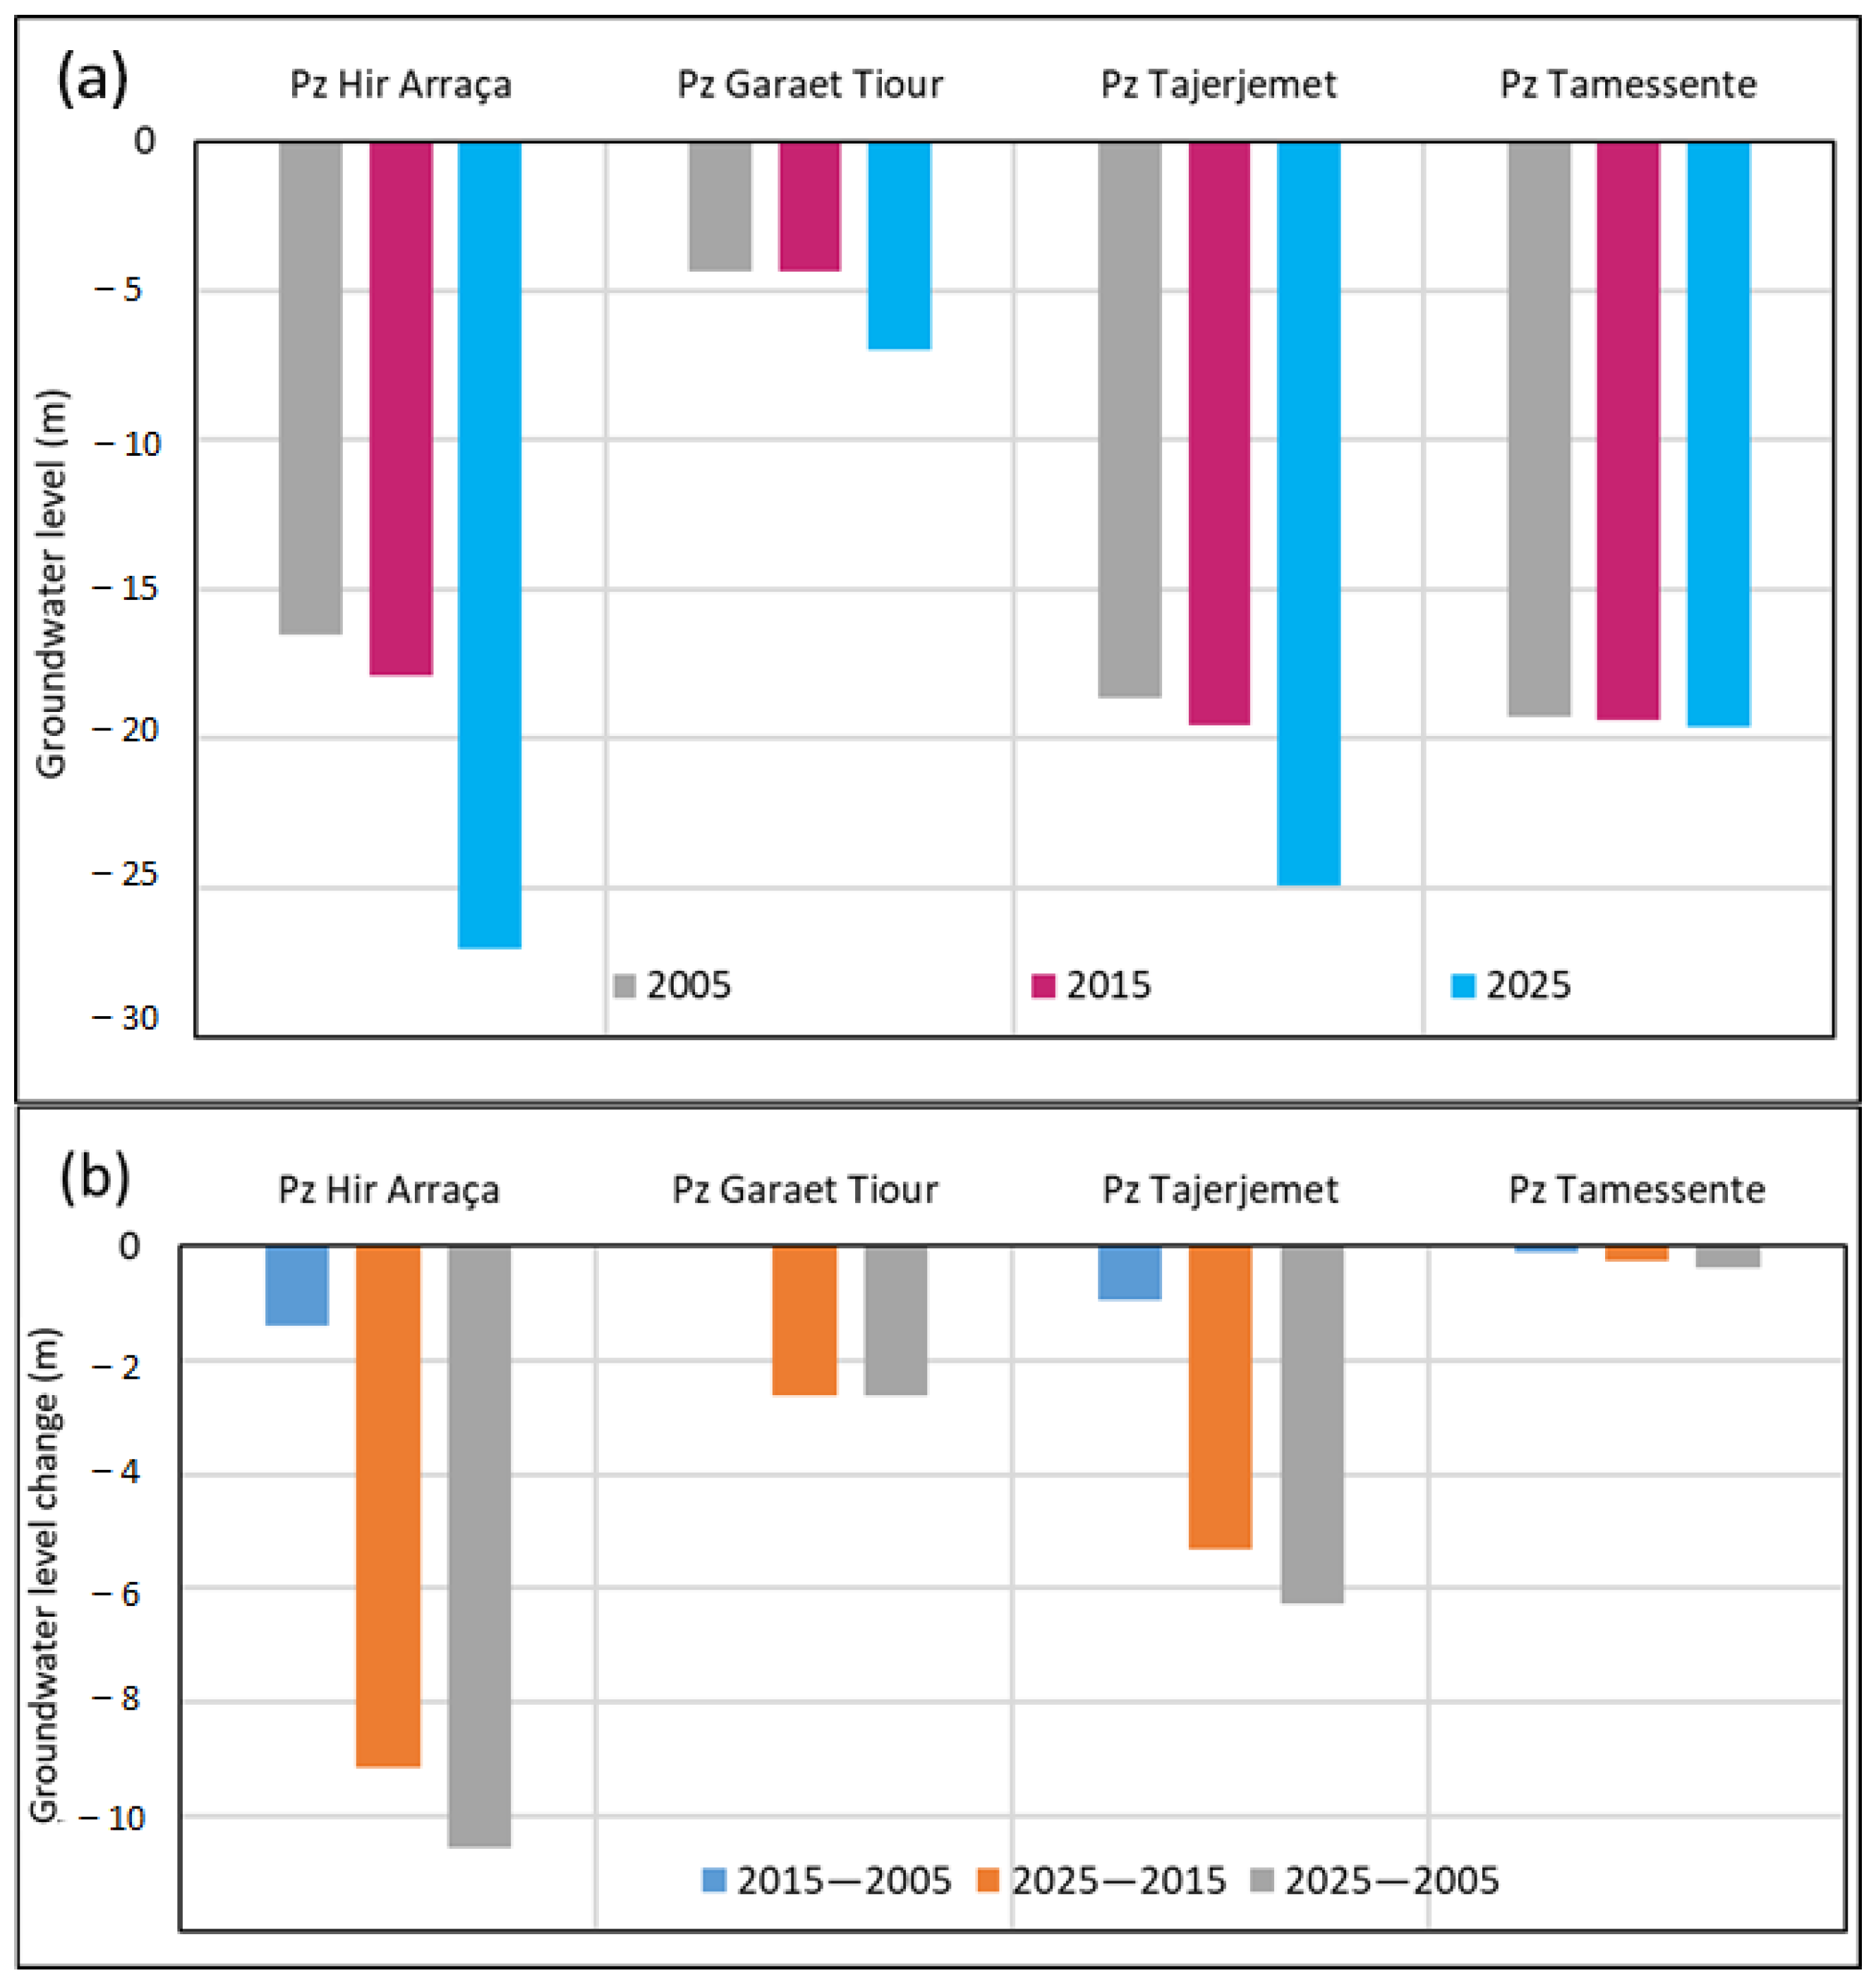
The analysis of groundwater level recorded in the four existing piezometers in the study area (Figure 5a) revealed that the lowest water level was recorded in Hir Arraça piezometer, at about −17 m, −18 m and −27 m in 2005, 2015 and 2025, respectively. This was followed by Tajerjemet piezometers, which showed −18 m in 2005, −19 m in 2015 and −25 m in 2025. Then, Tamessente changed from −4 m in 2005 and 2015 to −7 m in 2025. Finally, Garaat Tiour piezometer indicated −19 m during the three years.
Figure 5.
Groundwater level recorded by four piezometric wells in Djorf aquifer during 2005, 2015 and 2025. (a) Actual water level and (b) the changes in water level.
Figure 5b indicates a distinct and critical change in the system’s behavior between the periods 2005–2015 and 2015–2025.
The period 2005–2015 represents the “Stress” phase: irrigated areas increased by about 100 ha (Table 3). The aquifer responded with a moderate (Figure 5b), slightly linear decrease (0 to −1.5 m). This suggests the groundwater system was under stress but was somehow able to deliver water by tapping into some natural storage and recharge, covering the full impact.
The years 2015–2025 represent the “Depletion” phase: irrigated area almost tripled (Table 3) to reach 1600 ha in 2025 after 500 ha in 2015 (the change is about 1100 ha). The aquifer response was severe and non-linear. Drops accelerated dramatically to −3 m and to −11 m (Figure 5b). This is the hallmark of aquifer mining—where pumping far exceeds the natural recharge rate, leading to rapid, unsustainable drawdown. The system passed a tipping point.
3.4. Spatial Heterogeneity vs. System’s Response
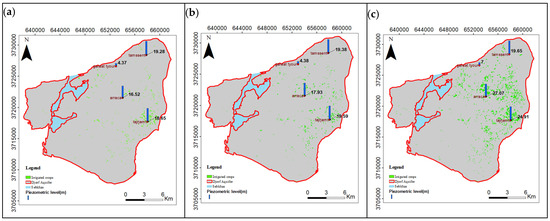
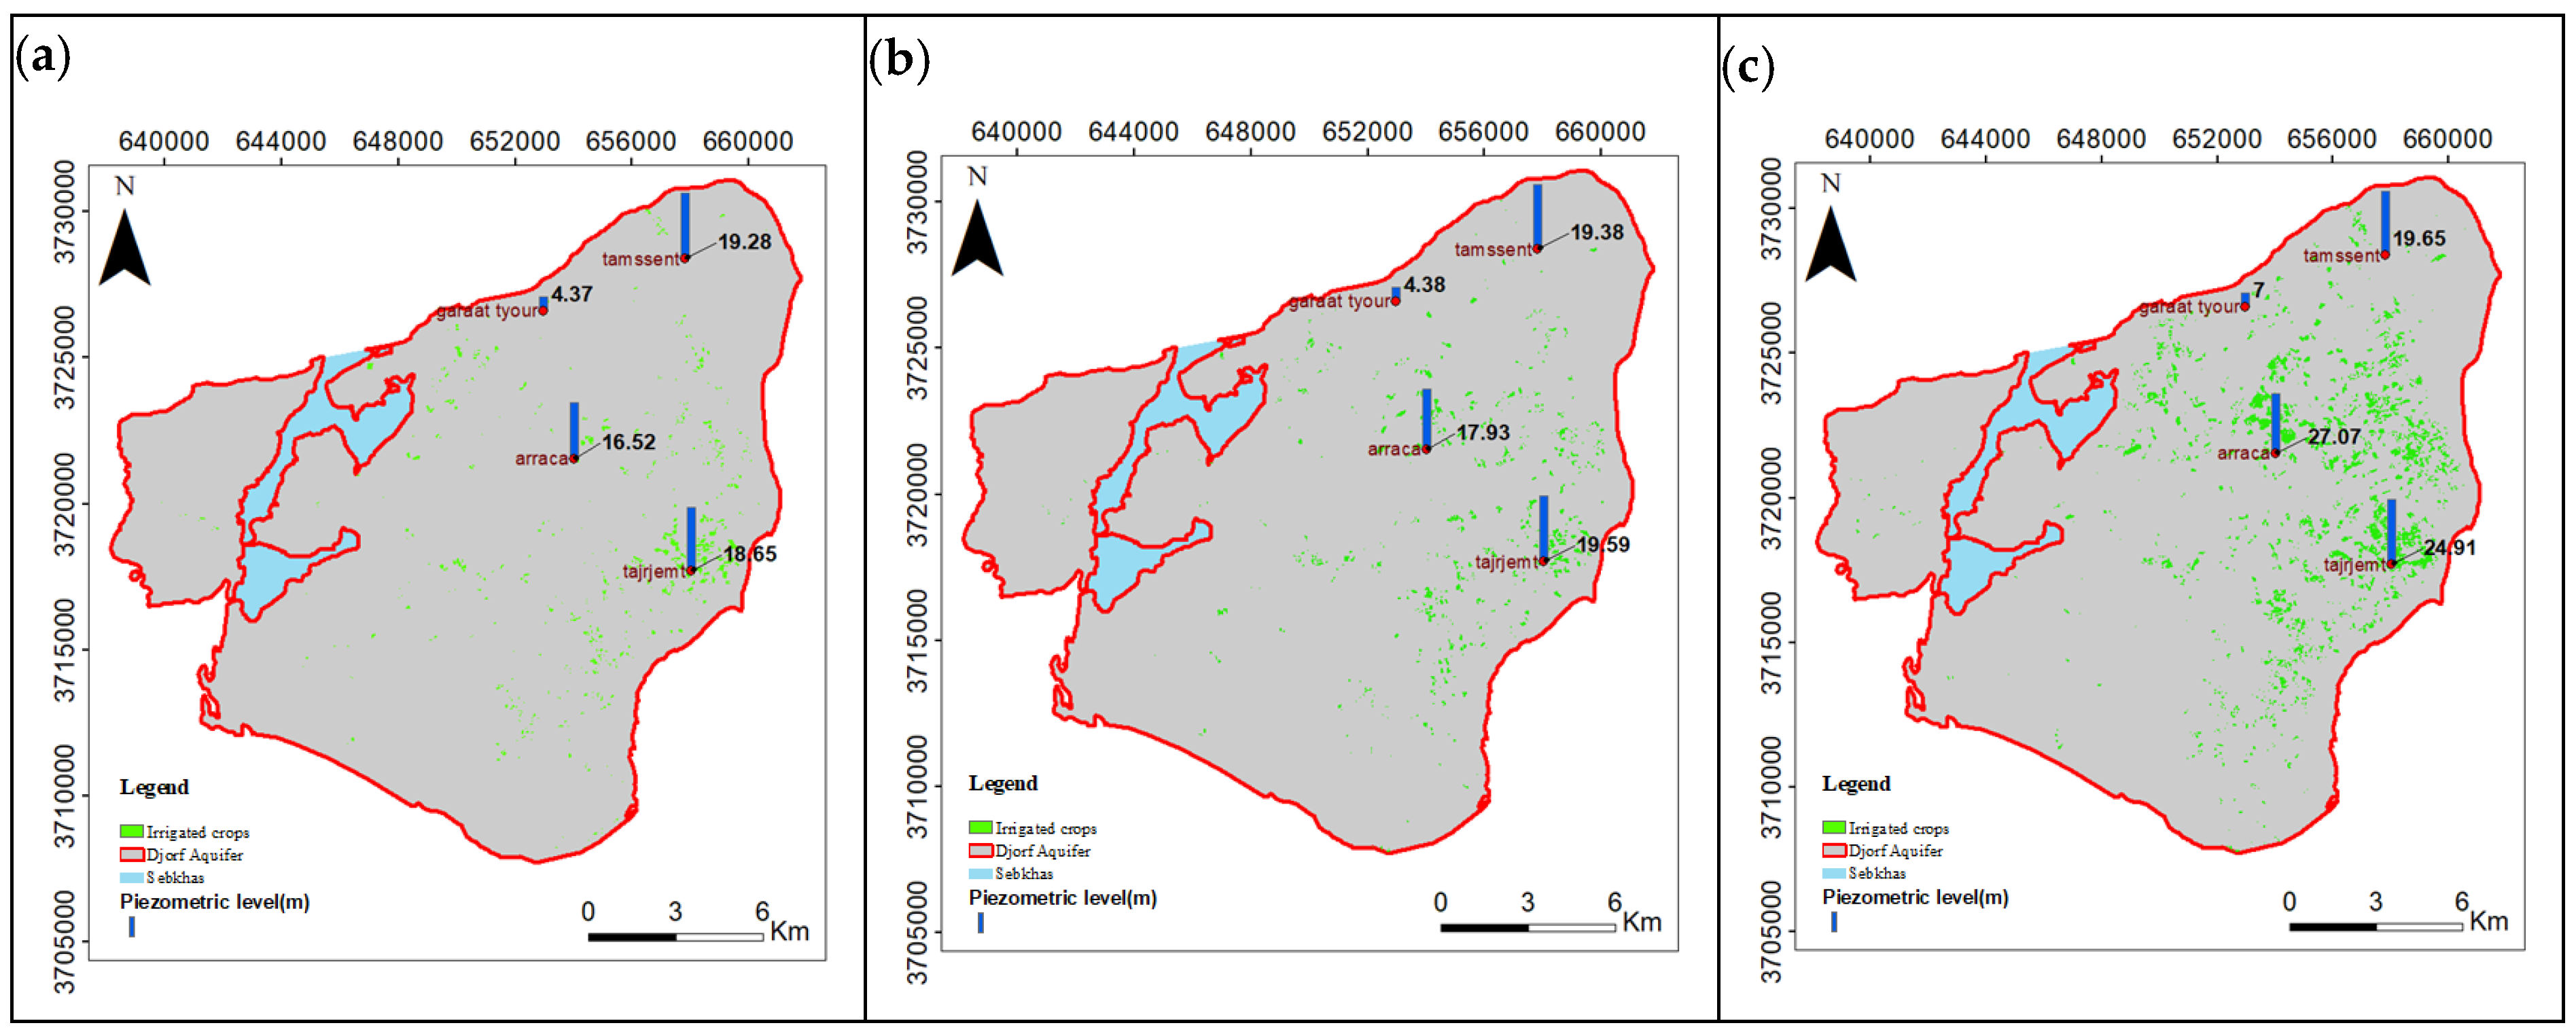
The differing rates of decline across the four piezometers (Figure 6) are not contradictory; they provide a sophisticated understanding of the aquifer’s condition. Henchir Arrassa (Center) (Figure 6a–c): The catastrophic 11 m drop indicates this zone is the epicenter of the crisis. It is the area of most intense new groundwater pumping and/or the part of the aquifer with the lowest natural replenishment (recharge) or storage capacity. A classic “cone of depression” is forming here. Garaat Tyour (North-west) (Figure 6a–c): The stable then declining pattern (−3 m after 2015) suggests this area was initially buffered—perhaps by distance from major pumping, better recharge, or different geology. However, by 2015–2025, the regional aquifer decline finally overwhelmed this local buffer. Tajerjemet (South) (Figure 6a–c): The steady, accelerating decline (−1 m, then −5.5 m) represents an intermediate, more direct response to increasing regional pumping stress. Tamassent (North) (Figure 6a–c): The stability of the aquifer system (0 m) indicates the lowest impact of irrigation, which is probably due to high salinity in groundwater since it presents the downstream and is threatened by saltwater intrusion. Besides, the quality of the soil maybe not be suitable for agriculture activity. This spatial pattern is a powerful warning; the impacts of over-exploitation are not uniform. The most vulnerable areas (the center and the south) will face water scarcity and well failures first, but the entire system is connected and under threat.
Figure 6.
Spatial distribution of groundwater level and irrigated crops dynamic in the study area during (a) 2005, (b) 2015 and (c) 2025.
4. Discussion
4.1. Accuracy Assessment
The overall accuracy (0.99) and kappa values (0.72–0.94) are consistent with and even exceed many similar studies [40,41]. Studies mapping irrigated areas using machine learning algorithms such as random forest with good-ground truth data commonly report accuracies above 85–90% [29]. Different studies applying a diversity of methodologies in semi-arid regions of Ethiopia and India found an OA of 0.88–0.94 [10,42]. This study’s results (0.99) are at the upper end of this range, indicating a very robust model. The performance of the random forest model in this study achieved higher accuracy than the classification done by Sarvia et al. [43]. The exceptionally high accuracy achieved in this study was mainly due to the noticeable spectral contrast induced by irrigation, and this is the specificity of an arid region and the choice of the driest season in the study area, which led to a good performance of satellite detection [44,45]. This can be also attributed to the collected ground truth, which is considered the gold standard for training data. Additionally, it benefited from the combination with spectral indices, which enhances the extraction of irrigated areas [46].
4.2. Irrigated Area Mapping
The documented expansion of irrigated area found in this study, especially in the southern part of Tunisia, was also reported by Rodríguez-Caballero et al. [47] from 1996 to 2011. While Sarvia et al. [43] does not agree with the outcomes of this study, they showed that irrigated agriculture in the governorate of Medenine is almost negligible (about 1 km2) in 2022. On another hand, the increase in irrigated areas was reported by Mekki et al. [48] in 2020, mainly in the oases system in Kebili.
4.3. Groundwater Decline and Spatial Variability
This study’s findings revealed that the center of the aquifer showed a severe decline in groundwater level (Henchir Arrassa, −11 m), and this finding is confirmed by [19]. This decrease is mainly due to the heaviest concentration of new irrigated area noticed in the central zone. The northern area showed a low decline in groundwater level (Garaat Tyour); this negligible decrease is essentially due to the low expansion of irrigated area, and also there is a probability of sea water intrusion [19], which minimizes the rapid decline of groundwater. To the south and northeastern part of the aquifer, the expansion of irrigated areas led to an important decline in groundwater level. These outcomes align with the findings reported by Kharroubi et al. [49]. The intensive pumping of groundwater for irrigation was also confirmed by Trabelsi et al. [18] in the Djeffara plain aquifer in the southeastern part of Tunisia. This study results are methodologically sound and align with global patterns of aquifer depletion, such as Famiglietti [50], in the global groundwater crisis.
5. Conclusions
This study documented the highly accurate irrigated areas detection, with an overall accuracy 0.99 and a kappa coefficient ranging from 0.72 to 0.94. This data reveals a massive irrigated agricultural expansion, which increased from 400 ha in 2005 to 500 ha in 2015, and the dramatic expansion of these irrigated areas was detected from 2025, which was about 1600 ha. This expansion in irrigated agriculture has led to a decline in water table level. The spatial patterns confirm that is a hydrogeological crisis, not a localized issue. The outcomes of this study led to several critical conclusions: the current agricultural expansion is basically unsustainable. Thus, this has immediate threats of leading to near-future well failure. Then, farmers will need to drill deeper, at greater cost, or their wells will run dry. Consequently, there will be a decrease in water quality, especially due to saltwater intrusion and the concentration of pollutants. At the end, the ecosystem will collapse and parts of the aquifer could become economically or physically unusable within the next decade.
Sustainable water-resource management requires enhanced hydrogeological models that integrate climatic, hydrological, and socio-economic data. This holistic approach improves an understanding of water dynamics, including interactions between groundwater and vegetation, as well as human-induced impacts, such as irrigation, on the water cycle. Moreover, advanced modeling also strengthens projections of climate change effects and agricultural intensification on water availability. However, persistent gaps in data continuity and systematic collection hinder comprehensive analyses, limiting the ability to develop and implement robust, forecast-based adaptation strategies. Furthermore, strengthening monitoring and enforcement mechanisms, including the use of remote sensing to track irrigated land expansion, is essential.
Based on the outcomes of this study and in order to improve water resources sustainability, it is recommended to promote efficient irrigation practices, such as drip irrigation and deficit irrigation. Furthermore, policies should encourage the use of non-conventional water resources and support farmers through technical assistance and incentives to reduce groundwater dependency. These measures are critical to ensuring the long-term sustainability of coastal aquifers in Tunisia.
Author Contributions
Conceptualization, A.B.; methodology, A.B.; software, A.B.; validation, A.B.; formal analysis, A.B.; investigation, A.B., N.B., M.A., A.H. and M.O.; data curation, A.B., N.B., M.A., A.H. and M.O.; writing—original draft preparation, A.B., N.B., M.A., A.H. and M.O.; writing—review and editing, A.B., N.B., M.A., A.H. and M.O.; visualization, A.B. All authors have read and agreed to the published version of the manuscript.
Funding
This research received no external funding.
Data Availability Statement
The original contributions presented in this study are included in the article. Further inquiries can be directed to the corresponding author.
Acknowledgments
Authors would like to thank the field agents of the Regional Authority for Agricultural Development in Medenine (CRDA), especially the Water Resources Department (DRE) and the Department of Statistics, for their technical support in the collection of field verification data.
Conflicts of Interest
The authors declare no conflicts of interest.
References
- Sakellariou, S.; Spiliotopoulos, M.; Alpanakis, N.; Faraslis, I.; Sidiropoulos, P.; Tziatzios, G.A.; Karoutsos, G.; Dalezios, N.R.; Dercas, N. Spatiotemporal Drought Assessment Based on Gridded Standardized Precipitation Index (SPI) in Vulnerable Agroecosystems. Sustainability 2024, 16, 1240. [Google Scholar] [CrossRef] [Scilit]
- Ferreira, D.; Simões, M.; Pessoa, M.; Reboredo, F.; Almeida, A.; Lidon, F. Impacts of Irrigated Cultures (Paddy-Rice) in Groundwater Quality in Tejo Alluvial River Basin, Portugal. In Advances in Geoethics and Groundwater Management: Theory and Practice for a Sustainable Development; Springer: Cham, Switzerland, 2021; pp. 263–266. [Google Scholar]
- Liberoff, A.L.; Poca, M. Groundwater-surface water interactions in a semi-arid irrigated agricultural valley: A hydrometric and tracer-aided approach. Sci. Total Environ. 2023, 903, 166625. [Google Scholar] [CrossRef] [Scilit]
- Makhlouf, A.; Sharaan, M.; El-Rawy, M.; Kanae, S.; Ibrahim, M.G. Investigating the effects of surface water recharge on groundwater quality using hydrochemistry and ANFIS model: A case study Minia Governorate, Egypt. J. Environ. Manag. 2024, 362, 121269. [Google Scholar] [CrossRef] [Scilit]
- Ahoton, D.H.; Bacharou, T.; Bossa, A.Y.; Sintondji, L.O.; Bonkoungou, B.; Alofa, V.M. Dynamics of Irrigated Land Expansion in the Ouémé River Basin Using Field and Remote Sensing Data in the Google Earth Engine. Land 2024, 13, 1926. [Google Scholar] [CrossRef] [Scilit]
- Assaoui, N. Use of Remote Sensing and GIS to Study the Evolution of Irrigated Areas and Their Impact on Groundwater in a Semi-Arid Region (Morocco). In Selected Studies in Geotechnics, Geo-Informatics and Remote Sensing; Springer: Cham, Switzerland, 2023; pp. 75–79. [Google Scholar]
- Abuzar, M.; Sheffield, K.; McAllister, A. Feasibility of Using SWIR-Transformed Reflectance (STR) in Place of Surface Temperature (Ts) for the Mapping of Irrigated Landcover. Land 2024, 13, 633. [Google Scholar] [CrossRef] [Scilit]
- Li, W.; Sun, Y.; Zhou, Y.; Gong, L.; Li, Y.; Xin, Q. Mapping Irrigated Croplands from Sentinel-2 Images Using Deep Convolutional Neural Networks. Remote Sens. 2023, 15, 4071. [Google Scholar] [CrossRef] [Scilit]
- Li, Q.; Ouyang, W.; Zhu, J.; Lin, C.; He, M. Discharge dynamics of agricultural diffuse pollution under different rainfall patterns in the middle Yangtze river. J. Environ. Manag. 2023, 347, 119116. [Google Scholar] [CrossRef] [Scilit]
- Yimer, A.K.; Haile, A.T.; Hatiye, S.D.; Ragettli, S.; Taye, M.T. Comparative evaluation of the accuracy of mapping irrigated areas using sentinel 1 images in the Bilate and Gumara watersheds, Ethiopia. Cogent Eng. 2024, 11, 2357728. [Google Scholar] [CrossRef] [Scilit]
- El-bouhalı, A.; Amyay, M.; El Ouazanı Ech-chahdı, K. Detection of irrigated crops using Landsat 8 images: A methodology based on fieldwork and spectral reflectance analysis. Int. J. Eng. Geosci. 2025, 10, 1–13. [Google Scholar] [CrossRef] [Scilit]
- Saquella, S.; Pampanoni, V.; Ferrari, A.; Laneve, G. Detection of Irrigated and Rainfed Crops with Machine Learning Multivariate Time-Series Object-Based Classification Using Sentinel-2 Imagery. In IGARSS 2023 IEEE International Geoscience and Remote Sensing Symposium; IEEE: Piscataway, NJ, USA, 2023. [Google Scholar]
- Tomaz, A.; Martins, I.; Catarino, A.; Mourinha, C.; Dôres, J.; Fabião, M.; Boteta, L.; Coutinho, J.; Patanita, M.; Palma, P. Insights into the Spatial and Temporal Variability of Soil Attributes in Irrigated Farm Fields and Correlations with Management Practices: A Multivariate Statistical Approach. Water 2022, 14, 3216. [Google Scholar] [CrossRef] [Scilit]
- Mekki, I.; Ghazouani, W.; Closas, A.; Molle, F. Perceptions of groundwater degradation and mitigation responses in the Haouaria region in Tunisia. Groundw. Sustain. Dev. 2017, 5, 101–110. [Google Scholar] [CrossRef] [Scilit]
- Elloumi, M. La Gouvernance des Eaux Souterraines en Tunisie; Report No. 6, ‘Groundwater Governance in the Arab World’; IWMI Project Publication: Cairo, Egypt, 2016. [Google Scholar]
- Chebbi, H.E. Agriculture and economic growth in Tunisia. China Agric. Econ. Rev. 2010, 2, 63–78. [Google Scholar] [CrossRef] [Scilit]
- World Bank. Tunisia Agricultural Policy Review; The World Bank: Washington, DC, USA, 2006. [Google Scholar]
- Trabelsi, R.; Abid, K.; Zouari, K.; Yahyaoui, H. Groundwater salinization processes in shallow coastal aquifer of Djeffara plain of Medenine, Southeastern Tunisia. Environ. Earth Sci. 2011, 66, 641–653. [Google Scholar] [CrossRef] [Scilit]
- Agoubi, B.; Kharroubi, A.; Abida, H. Saltwater intrusion modelling in Jorf coastal aquifer, South-eastern Tunisia: Geochemical, geoelectrical and geostatistical application. Hydrol. Process. 2012, 27, 1191–1199. [Google Scholar] [CrossRef] [Scilit]
- Zouari, K.; Trabelsi, R.; Chkir, N. Using geochemical indicators to investigate groundwater mixing and residence time in the aquifer system of Djeffara of Medenine (southeastern Tunisia). Hydrogeol. J. 2010, 19, 209–219. [Google Scholar] [CrossRef] [Scilit]
- Ayed, B.; Khlif, N.; Bouri, S. Groundwater potential recharge assessment in arid regions using GIS tool: Case of the Medenine shallow aquifer (Southeastern Tunisia). Appl. Geomat. 2022, 14, 475–490. [Google Scholar] [CrossRef] [Scilit]
- Bouaziz, S.; Jedoui, Y.; Barrier, É.; Angelier, J. Néotectonique affectant les dépôts marins tyrrhéniens du littoral sud-est tunisien: Implications pour les variations du niveau marin. Comptes Rendus Geosci. 2003, 335, 247–254. [Google Scholar] [CrossRef] [Scilit]
- Jedoui, Y.; Davaud, E.; Ben Ismaïl, H.; Reyss, J.-L. Analyse sédimentologique des dépôts marins pléistocènes du Sud-Est tunisien: Mise en évidence de deux périodes de haut niveau marin pendant le sous-stade isotopique marin 5e (Eémien, Tyrrhénien). Bull. Soc. Géol 2002, 173, 255–264. [Google Scholar] [CrossRef] [Scilit]
- Vermote, E.F.; Roger, J.-C.; Franch, B.; Skakun, S. LaSRC (Land Surface Reflectance Code): Overview, application and validation using MODIS, VIIRS, LANDSAT and Sentinel 2 data’s. In IGARSS 2018 IEEE International Geoscience and Remote Sensing Symposium; IEEE: Piscataway, NJ, USA, 2018; pp. 8173–8176. [Google Scholar]
- Schmidt, G.; Jenkerson, C.; Masek, J.; Vermote, E.; Gao, F. Landsat Ecosystem Disturbance Adaptive Processing System (LEDAPS) Algorithm Description; 2013-1057; U.S. Geological Survey: Reston, VA, USA, 2013; p. 27. [Google Scholar]
- Yang, X.; Xiao, X.; Qin, Y.; Wang, J.; Neal, K. Mapping forest in the southern Great Plains with ALOS-2 PALSAR-2 and Landsat 7/8 data. Int. J. Appl. Earth Obs. Geoinf. 2021, 104, 102578. [Google Scholar] [CrossRef] [Scilit]
- Gorelick, N.; Hancher, M.; Dixon, M.; Ilyushchenko, S.; Thau, D.; Moore, R. Google Earth Engine: Planetary-scale geospatial analysis for everyone. Remote Sens. Environ. 2017, 202, 18–27. [Google Scholar] [CrossRef] [Scilit]
- Sangeetham, R.S.N. A Review on Google Earth Engine: An Open Access Cloud Analysis Platform for Planetary Scale Satellite Data. In E3S Web of Conferences; EDP Sciences: Les Ulis, France, 2024; p. 591. [Google Scholar] [CrossRef] [Scilit]
- Basheer, S.; Wang, X.; Farooque, A.A.; Nawaz, R.A.; Liu, K.; Adekanmbi, T.; Liu, S. Comparison of Land Use Land Cover Classifiers Using Different Satellite Imagery and Machine Learning Techniques. Remote Sens. 2022, 14, 4978. [Google Scholar] [CrossRef] [Scilit]
- Rouse, J.; Haas, R.; Schell, J.; Deering, D. Monitoring Vegetation Systems in the Great Plains with ERTS. In Proceedings of the Earth Resources Technology Satellite Symposium; NASA: Washington, DC, USA, 1973; Volume 1, pp. 309–317. [Google Scholar]
- Lykhovyd, P.; Vozhehova, R.; Hranovska, L.; Bidnyna, I. The link between the normalized difference vegetation index in major crops and meteorological factors. Agrology 2024, 7, 39–45. [Google Scholar] [CrossRef] [Scilit]
- Huete, A.R. A soil-adjusted vegetation index (SAVI). Remote Sens. Environ. 1988, 25, 295–309. [Google Scholar] [CrossRef] [Scilit]
- Novando, G.; Arif, D. Comparison of soil adjusted vegetation index (SAVI) and modified soil adjusted vegetation index (MSAVI) methods to view vegetation density in Padang city using landsat 8 image. Int. Remote Sens. Appl. J. 2023, 2, 31–36. [Google Scholar] [CrossRef] [Scilit]
- Ali, A.S.; Hallett, S.H.; Brewer, T.R. Using vegetation indices for the estimation and production ofvegetation cover maps inthe Jeffara Plain, Libya. IOSR J. Environ. Sci. Toxicol. Food Technol. (IOSR-JESTFT) 2018, 12, 23–28. [Google Scholar]
- Zhen, Z.; Chen, S.; Yin, T.; Chavanon, E.; Lauret, N.; Guilleux, J.; Henke, M.; Qin, W.; Cao, L.; Li, J.; et al. Using the Negative Soil Adjustment Factor of Soil Adjusted Vegetation Index (SAVI) to Resist Saturation Effects and Estimate Leaf Area Index (LAI) in Dense Vegetation Areas. Sensors 2021, 21, 2115. [Google Scholar] [CrossRef] [Scilit]
- Rock, B.; Vogelmann, J.; Vogelmann, A.; Hoshizaki, T.; Williams, D. Remote Detection of Forest Damage. BioScience 1986, 36, 439–445. [Google Scholar] [CrossRef] [Scilit]
- Gao, B.-c. NDWI—A normalized difference water index for remote sensing of vegetation liquid water from space. Remote Sens. Environ. 1996, 58, 257–266. [Google Scholar] [CrossRef] [Scilit]
- Zhao, H.; Di, L.; Sun, Z.; Hao, P.; Yu, E.; Zhang, C.; Lin, L. Impacts of Soil Moisture on Crop Health: A Remote Sensing Perspective. In 2021 9th International Conference on Agro-Geoinformatics (Agro-Geoinformatics); IEEE: Piscataway, NJ, USA, 2021; pp. 1–4. [Google Scholar]
- Lee, H.; Lee, C.; Woo, H.; Choi, S.-E. Optimal Training Sample Sizes for U-Net-Based Tree Species Classification with Sentinel-2 Imagery. Forests 2025, 16, 1718. [Google Scholar] [CrossRef] [Scilit]
- Mohammed, M.; Birhanu, B.; Abegaz, F. Multi-spectral remote sensing for current irrigated area mapping of the Rift Valley Lakes Basin in Ethiopia. AQUA—Water Infrastruct. Ecosyst. Soc. 2023, 72, 2396–2407. [Google Scholar] [CrossRef] [Scilit]
- Benkesmia, Y.; Bentekhici, N. Monitoring the dynamics of irrigated parcels and impacts on phreatic water quality in the Mostaganem Plateau (northwestern Algeria): An integrated analysis using remote sensing and field data for 2010 and 2020. Env. Monit Assess 2025, 197, 898. [Google Scholar] [CrossRef] [Scilit]
- Mishra, V.K.; Awasthi, M.K.; Kumar, L.; Sharma, S.K. Integrating Remote Sensing and GIS for Irrigated Area Mapping in the Betwa River Basin, India. J. Sci. Res. Rep. 2025, 31, 709–721. [Google Scholar] [CrossRef] [Scilit]
- Sarvia, F.; Farren, K.; Khatteli, A.; Chiozza, F.; Maki, A.; Cherif, I.; Mushtaq, F.; Jalal, R.; Henry, M. Mapping Land Cover in Tunisia. In the Context of the Soil Land and Water Digital Information System Initiative; Food and Agriculture Organization of the United Nations: Rome, Italy, 2024. [Google Scholar]
- Zhu, W.; Dönmez, E.; Storm, H.; Heckelei, T.; Siebert, S. Large-scale irrigation area mapping: Status and challenges. Agric. Water Manag. 2026, 323, 110037. [Google Scholar] [CrossRef] [Scilit]
- Tian, F.; Wu, B.; Zeng, H.; Zhang, M.; Zhu, W.; Yan, N.; Lu, Y.; Li, Y. GMIE: A global maximum irrigation extent and central pivot irrigation system dataset derived via irrigation performance during drought stress and deep learning methods. Earth Syst. Sci. Data 2025, 17, 855–880. [Google Scholar] [CrossRef] [Scilit]
- López-Pérez, E.; Sanchis-Ibor, C.; Jiménez-Bello, M.Á.; Pulido-Velazquez, M. Mapping of irrigated vineyard areas through the use of machine learning techniques and remote sensing. Agric. Water Manag. 2024, 302, 108988. [Google Scholar] [CrossRef] [Scilit]
- Rodríguez-Caballero, E.; Cantón, Y.; Moussa, M.; Solé-Benet, A. Irrigated land expansion since 1985 in Southern Tunisia. J. Afr. Earth Sci. 2017, 129, 146–152. [Google Scholar] [CrossRef] [Scilit]
- Mekki, I.; Ferchichi, I.; Taouajouti, N.; Zairi, A. Oasis extension trajectories in Kebili territory, southern Tunisia: Drivers of development and actors’ discourse. New Medit 2022, 21, 85–101. [Google Scholar] [CrossRef] [Scilit]
- Kharroubi, A.; Farhat, S.; Agoubi, B.; Lakhbir, Z. Assessment of water qualities and evidence of seawater intrusion in a deep confined aquifer: Case of the coastal Djeffara aquifer (Southern Tunisia). J. Water Supply Res. Technol.-Aqua 2014, 63, 76–84. [Google Scholar] [CrossRef] [Scilit]
- Famiglietti, J.S. The global groundwater crisis. Nat. Clim. Change 2014, 4, 945–948. [Google Scholar] [CrossRef] [Scilit]

Disclaimer/Publisher’s Note: The statements, opinions and data contained in all publications are solely those of the individual author(s) and contributor(s) and not of MDPI and/or the editor(s). MDPI and/or the editor(s) disclaim responsibility for any injury to people or property resulting from any ideas, methods, instructions or products referred to in the content. |
© 2026 by the authors. Licensee MDPI, Basel, Switzerland. This article is an open access article distributed under the terms and conditions of the Creative Commons Attribution (CC BY) license.