Highlights
What are the main findings?
- This study provides a systematic comparison of coal mine methane emission datasets derived from S5P/TROPOMI and GF-5B/AHSI. The results show that, despite localized discrepancies, emission estimates at both grid and facility scales are broadly consistent across the two satellite platforms.
- This research further highlights that coal mine ventilation shafts are often situated far from the main mining infrastructure, underscoring that methane-emission inventories for the coal sector must account for all spatially distributed emission sources rather than relying solely on mine-boundary footprints.
What are the implications of the main findings?
- This study demonstrates that the integrated use of multi-scale satellite remote sensing data, each offering complementary observational strengths, can substantially enhance future research and monitoring of coal-mine methane emissions.
- The findings also underscore the importance of comprehensive and accurate source location information for producing reliable emission accounting.
Abstract
Coal mining is a major source of methane emissions globally, and monitoring these emissions has become a sustained area of interest in both scientific research and policy-making. Coal mine methane emissions typically manifest as discrete point sources, such as individual mines or ventilation shafts, and spatially concentrated area sources, such as mining clusters. In recent years, satellite remote sensing technology has become a key tool for monitoring and assessing methane emissions from coal mines. Notable progress has been made in quantifying emissions through point-source inversion using high-resolution satellite data, such as GF-5B/AHSI, and in estimating regional-scale area-source emissions using wide-swath instruments, such as S5P/TROPOMI. However, there remains a lack of systematic comparison between inversion results derived from these two types of satellite data with differing spatial resolutions. This study comprehensively analyzes the strengths and limitations of the GF-5B/AHSI and S5P/TROPOMI sensors for quantifying methane emissions. It conducts a spatiotemporal comparative analysis of point-source and area-source methane emission datasets from the coal-mining regions of Shanxi Province. The research aims to clarify the intrinsic relationship between remote-sensing data at different observational scales and to systematically evaluate how prior information on emission-source locations influences emission quantification results. The comparative analysis between TROPOMI grid-level emissions and GF-5B/AHSI point-source emissions indicates that TROPOMI-gridded emission data, owing to its longer time series, can more effectively characterize the annual-average methane emission levels in mining areas. Meanwhile, high-resolution observations from GF-5B/AHSI show distinct advantages in detecting small-scale plumes and attributing emissions to specific facilities. Although the regional-average emissions derived from TROPOMI are significantly higher than point-source emission rate estimates, their data ranges overlap within their uncertainty intervals, demonstrating substantial consistency between the monitoring results of the two methods. Furthermore, the study reveals that when key emission facilities, such as ventilation shafts, are located far from the core operational areas of mines, relying solely on point-source observations may not fully capture the spatial distribution pattern of methane emissions at the mine scale.
1. Introduction
Methane (CH4) is the second largest anthropogenic greenhouse gas after carbon dioxide (CO2) and plays a crucial role in global warming [1]. It has a global warming potential of 84 and is 28 times greater than CO2 over 20-year and 100-year time scales, respectively [2] and contributes approximately 17 % to the total radiative forcing of greenhouse gases [3]. Concurrently, atmospheric methane concentrations have continued to rise over the past decade and are now nearly three times higher than pre-industrial levels [4,5,6]. However, all of the reasons for this increase are not yet fully understood [6,7,8]. This persistent upward trend underscores the urgency of efforts to reduce methane emissions. Given its strong warming effect, rapid growth rate, and relatively short atmospheric lifetime (9.1 ± 0.9 years) [9,10,11], reducing methane emissions is a critical strategy for addressing global climate change on a decadal scale [12]. Furthermore, as a precursor to tropospheric ozone (O3), methane mitigation strategies provide co-benefits for air quality by synergistically controlling pollutants [13,14,15].
Methane is emitted from a wide range of natural and anthropogenic sources [16]. Anthropogenic activities account for roughly 60 % of global methane emissions, dominated by agriculture (e.g., livestock farming and rice cultivation), fossil fuel extraction (coal and oil/gas), and waste management (such as landfills) [16,17]. The Intergovernmental Panel on Climate Change (IPCC) identifies both challenges and substantial opportunities in methane mitigation and emphasizes that emission reductions in the energy sector offer significant potential, cost-effectiveness, and rapid results [12,18]. Fugitive methane emissions from energy activities mainly stem from industrial infrastructure, including oil and gas fields and mines, gathering stations, compressor stations, storage tanks, pipelines, processing plants, and flares [19]. Previous research has largely focused on methane emissions from the oil and gas sectors [20,21], with limited attention given to coal mine methane (CMM). However, recent studies indicate that in countries with substantial coal production, actual CMM emissions may have surpassed those from the oil and gas industry, emerging as a more substantial contributor [22]. CMM is estimated to account for about 12 % of global annual anthropogenic methane emissions and is projected to grow markedly in the coming years [23,24]. CMM primarily originates from mining activities, including gas released through ventilation and drainage systems during underground mining, as well as adsorbed or free-phase methane emitted due to coal-seam disturbance in surface mining operations [25]. These processes give rise to multiple point or area sources of methane emissions from coal mines. Methane emissions occur throughout the entire lifecycle of coal mining, including pre-drainage or ventilation activities conducted to prevent explosions in underground mines, the actual mining phases operations (both underground and open-pit), and post-mining processes such as coal processing, storage, and transportation. Notably, emissions from ventilation shafts in underground coal mines typically exhibit significant, continuous, and stable characteristics, and such emissions have been successfully detected and quantified by various satellite instruments [26,27]. In contrast, methane emissions from closed/abandoned mines tend to be intermittent, and research based on satellite remote sensing in this area remains relatively limited [28]. The intensity of CMM emissions is closely linked to various production stages, characterized by strong locality, significant concentration variability, and complex emission sources. Due to a lack of systematic ground-based measurement data, current quantification of CMM emissions remains subject to considerable uncertainty [29].
The conventional bottom-up approach has been instrumental in informing methane mitigation policy development and in providing ground-truth validation data for satellite-based observation techniques. Historical assessments of CMM emissions have predominantly relied on this methodology [24,30,31,32,33]. Representative inventories, such as the Global Fuel Exploitation Inventory (GFEI) [34], the Emissions Databases for Global Atmospheric Research (EDGAR) [35], and the Global Coal Mine Tracker (GCMT) dataset, have furnished valuable temporally and spatially resolved methane emission datasets. However, the construction of bottom-up emission inventories relies on activity data and emission factors for individual source processes, rendering them susceptible to the omission of fugitive emission sources [36,37,38]. Furthermore, significant discrepancies exist between bottom-up estimates and measurement-based results at both national and facility levels, and notable inconsistencies are frequently observed across different inventories [39,40]. These issues collectively reveal the considerable uncertainties inherent in traditional bottom-up estimation methods [16,23]. In comparison, top-down methodologies facilitate the monitoring and quantification of methane emissions across multiple spatiotemporal scales, incorporating techniques such as satellite remote sensing [41], airborne [42], in situ towers [43], and surface observation [44]. Recent advances in remote sensing have enabled satellite observations to provide systematic, quasi-global monitoring of methane emissions at increasingly high spatial and temporal resolution. This capability supports the quantification of individual emission sources and their attribution to specific facilities, thereby offering critical top-down constraints for evaluating bottom-up inventories and reducing their associated uncertainties. As a result, top-down approaches are increasingly important for independently verifying inventory estimates, calibrating reported emissions, and assessing the effectiveness of mitigation measures [41,45].
Satellite-based quantification of methane emissions utilizes inversion models to infer emission fluxes from atmospheric methane concentration data and has been widely applied to methane monitoring at multiple scales [46]. Among spaceborne sensors capable of area flux mapping, the European TROPOspheric Monitoring Instrument (TROPOMI) satellite instrument [47] has become one of the key data sources for regional-scale methane monitoring, owing to its high spectral resolution and daily global revisit capability. It has been successfully applied to detect CMM emissions and estimate annual mean emissions in regions such as Shanxi Province [48]. However, for spatially dispersed emission sources such as open-pit coal mines, the TROPOMI observational signal becomes blurred due to the mixing and dilution of contributions from multiple sources within individual pixels. This effect makes it difficult to reliably isolate and attribute emissions from individual dispersed sources, leading to substantially increased uncertainties in the corresponding emission estimates [46]. When numerous dispersed, low-emission sources, such as underground coal mines, are aggregated into larger pixels, TROPOMI-based results integrate these emissions, yielding substantial total emission estimates [49,50]. Schuit et al. [38] reported that a single TROPOMI detection signal, composed of combined emissions from 10 landfills and fossil fuel extraction facilities, highlights its strength in quantifying aggregate regional emissions. This phenomenon is particularly pronounced in monitoring methane emissions from underground coal mines, where numerous dispersed industrial sites or ventilation shafts often accumulate to form a detectable signal at the pixel scale. However, the coarse spatial resolution of TROPOMI limits its application in attributing emission contributions, identifying methane hotspots [40,51,52], or detecting the strongest point sources [53,54]. At present, it is primarily suitable for methane emission studies at global or regional scales [55,56]. High-resolution remote sensing data offer novel insights into facility-level methane emissions. China’s Gaofen-5B (GF-5B) satellite, equipped with the Advanced Hyperspectral Imager (AHSI) [57], can simultaneously capture full-range spectral information from the visible to the shortwave infrared for both atmospheric and terrestrial observations. In recent years, it has proven effective not only in detecting and quantifying methane plumes from coal mines but also in enabling source attribution at the facility level. For example, He et al. [58], Han et al. [26], and Kang et al. [59,60] utilized GF-5B/AHSI observation data from 2021 to 2023 to capture CMM plumes over Shanxi Province, employing the integrated mass enhancement (IME) method or improved techniques to estimate point-source emission rates. Although this sensor’s high spatial resolution enables facility-scale emission quantification, it comes at the cost of lower revisit frequency, spectral resolution, and measurement precision. Consequently, it often struggles to maintain long-term continuous monitoring over large areas. Extrapolating annual emissions from limited emission data may introduce errors, making direct comparisons with bottom-up annual emission inventories potentially problematic. Furthermore, inaccuracies in prior spatial distribution information of emission sources can impact point-source emission estimates. Given the distinct characteristics and complementary nature of satellite observations at different scales in identifying and quantifying methane emissions, and considering that numerous point sources collectively shape regional emission budgets, investigating the relationship between regional and point-source emissions within the coal industry is crucial for accurately characterizing CMM emission dynamics.
As one of China’s principal coal production bases, Shanxi Province leads the nation in both coal output and the number of operational coal mines. Building on recent studies using S5P/TROPOMI and GF-5B/AHSI observations, which identify Shanxi as a globally significant hotspot of CMM emissions, the region provides an ideal testbed for comparative analyses of regional versus point-source emissions. In this study, multi-scale CMM emissions in Shanxi derived from TROPOMI and GF-5B/AHSI are jointly analyzed to assess the consistency and discrepancies between grid-resolved, TROPOMI-based emissions and high-resolution, facility-scale point-source estimates. This framework is used to elucidate the spatiotemporal correlations and divergences between facility-level and grid-level CMM emissions, thereby yielding a more comprehensive characterization of CMM emission patterns. The results are expected to provide a scientific basis for supporting the green transformation of Shanxi’s coal industry and for designing targeted, region-specific methane mitigation strategies.
2. Materials and Methods
The TROPOMI onboard the European Sentinel-5 Precursor (S5-P) satellite is a landmark mission for global methane monitoring [61,62]. It is a push-broom imaging spectrometer with a local equatorial overpass time of approximately 13:30. TROPOMI achieves daily global coverage with a sampling resolution of 7 × 7 km2 since its launch in October 2017 (enhanced to 5.5 × 7 km2 since August 2019). This capability provides a unique perspective for long-term methane monitoring, while its high resolution significantly improves monitoring precision. Space-based remote sensing of atmospheric methane column concentrations typically utilizes solar backscatter signals in the shortwave infrared (SWIR, ~1600–2500 nm) spectrum, where methane exhibits two characteristic absorption bands: a weaker band near 1700 nm and a stronger band near 2300 nm. The instrument utilizes the physics-based RemoTeC [62,63] algorithm to retrieve the column-averaged dry-air methane mole fractions (XCH4) by leveraging absorption features in the oxygen-A band (760 nm) and the SWIR region (around 2300 nm), enabling effective monitoring of global XCH4 hotspots. Its spectral resolution is approximately 0.25 nm. TROPOMI XCH4 has been validated against the Greenhouse gases Observing SATellite (GOSAT) with differences on average of ( −13.6 ± 19.6 ppb) [55]. TROPOMI’s detection threshold for regional emissions is on the order of thousands of kilograms per hour (kg/h). The initial TROPOMI methane emission data for this study were sourced from the Shanxi Province gridded dataset (covering the period from May 2018 to July 2022, at a spatial resolution of 5 km × 5 km) produced by Hu et al. [48] using a simplified mass balance approach [64] based on TROPOMI XCH4 observations and fitting coefficients derived from high-frequency eddy-covariance flux observations. Coal mining in Shanxi Province is predominantly underground, with open-pit mines accounting for only a small fraction. Accordingly, this study focuses specifically on underground coal mines within Shanxi Province, comprising a total of 616 sites. The geographic coordinates of these mines were primarily obtained through manual visual interpretation of high-resolution remote sensing imagery, including, but not limited to, images from the Google Earth platform. To extend the temporal coverage of emission data, this study applies the same mass balance equation, combined with a non-biased noise-filtering method, to quantify daily, grid-level CMM emissions in Shanxi Province from January 2023 to December 2024.
The Advanced Hyperspectral Imager (AHSI) onboard the Gaofen-5B satellite (GF-5B/AHSI) [57], launched in September 2021, provides 330 characteristic spectral channels spanning from 400 to 2500 nanometers. It achieves spectral resolutions of 5 nm in the visible and near-infrared (VNIR) regions and 10 nm in the shortwave infrared (SWIR) region. With an overpass time around 13:30 local time, the instrument covers a swath width of 60 km and provides a spatial resolution of 30 m. Given the pronounced absorption characteristics of methane around 2300 nm, along with the sensitivity and high signal-to-noise ratio of the GF-5B/AHSI sensor within the 2100–2450 nm spectral range to methane concentration variations, this instrument enables the detection and attribution of methane emissions to specific facilities, thereby effectively complementing regional imaging satellites. GF-5B/AHSI typically has a detection limit for point-source methane plumes of several hundred to 1000 kilograms per hour (kg/h). High-resolution remote sensing observations provide critical information for locating and quantifying CMM emissions [65]. Table 1 summarizes the parameter differences between TROPOMI and GF-5B/AHSI. Multiple studies based on GF-5B/AHSI data have revealed CMM emission characteristics in Shanxi Province. However, the GF-5B/AHSI sensor has an observation interval of 16 days. Due to its relatively long revisit cycle, the effective sampling frequency for point-source emissions is limited, resulting in pronounced temporal gaps and intermittency in the time series of identified and quantified plume emission rates. To systematically consolidate and compare existing research findings and clarify CMM emission patterns in Shanxi, this study compiled three GF-5B/AHSI-based CMM emission datasets from the region. These datasets differ in their observation periods, the total number of detected methane plumes, the identified emission sources, and the estimated emission ranges, as detailed in Table 2.

Table 1.
Main parameters of GF-5B/AHSI and S5P/TROPOMI.
Table 2.
Summary of GF-5B/AHSI-based point-source datasets.
In this study, the coordinates of 616 underground coal mines obtained through visual interpretation, together with the locations of methane plumes identified in the studies of He et al. [58], Han et al. [26], and Kang et al. [59,60], were used as spatial references. Based on this information, these discrete mine and plume coordinates were spatially matched with the gridded TROPOMI emission data at a resolution of 0.05° × 0.05°. Grid cell identification and matching were performed using a nearest-neighbor approach, whereby each coal mine or plume location was assigned to the corresponding TROPOMI emission grid cell containing its geographic position, and the emission value of that grid cell was extracted. Ultimately, only those TROPOMI grid cells containing at least one known coal mine or plume location were retained. Meanwhile, all remaining grid cells were masked and excluded, thereby implementing a spatially selective masking scheme.
3. Results
3.1. Statistical Distribution of Coal Mine Methane Emission Rates Based on GF-5B/AHSI and TROPOMI
The three methane point-source emission datasets derived from GF-5B/AHSI observations provide critical data support for formulating targeted emission mitigation strategies. These studies, respectively, reveal characteristic CMM emission patterns in Shanxi Province: He et al. [58] demonstrated significant differences in emission flux rates from the same source through multiple repeated observations, with extreme values differing substantially. The specific emission patterns at individual points remain unclear, suggesting that single overpass observations are insufficient for accurately characterizing the overall or averaged emission scenario for any point source. Consequently, more time-series detection experiments are required to assess comprehensive emission rates. The study specifically highlighted the impacts of wind speed and the IME method on uncertainties in point-source emission estimates. Han et al. [26] identified a significant heavy-tailed distribution characteristic of CMM emission sources in Shanxi. They quantified that approximately the top 20% of high-emitting coal mines contribute to half of the region’s total methane emissions. By integrating plume fluxes from 82 emission sources, they estimated 1.2 million tons of methane annually (95% confidence interval: +0.24/−0.20 million tons). Compared with measurement-based estimates, bottom-up emission inventories tend to overestimate emissions in Shanxi Province. Kang et al. [59,60] reported asymmetric methane plume emission rates across Shanxi’s coal industry, with significant variations in average emission rates among different source types. They further observed that emission rates fluctuate both temporally and across different emission sources.
Given that the three existing point-source emission datasets differ in observation periods, sources of coal mine location information, numbers of identified methane plumes, and emission magnitudes, a statistical analysis was conducted to clarify the distributional characteristics of coal mine methane emission rates in Shanxi Province. The statistical distribution of all methane plume emission rates identified and quantified using GF-5B/AHSI point-source satellite data is shown in Figure 1. Table 3 presents the emission statistical indicators for three point-source emission datasets. The results indicate that CMM emission rates in Shanxi Province are generally high, with a mean value of 2010 kg/h and a maximum reaching 19,290 kg/h. The distribution exhibits pronounced right skewness and clear non-normality, with a typical heavy-tailed pattern, consistent with the findings of Han et al. [26] and Kang et al. [59,60]. Most methane plumes are concentrated in the low-to-moderate emission range of 0 to 5000 kg/h, reflecting the dominance of low- and medium-intensity sources in the region. The median emission rate (1300.60 kg/h) is lower than the mean, further indicating the presence of a small number of extremely high-emitting “super emitters”. Although these sources account for only a limited fraction of the total, they contribute disproportionately to the regional total emissions, highlighting the dominant role of key facilities in point-source emissions. From the perspective of distribution shape, the peak of the kernel density estimation curve is located at approximately 939 kg/h, and its overlap with the theoretical normal distribution is only 0.56, providing direct evidence of a substantial deviation from the normality assumption. Collectively, these statistical characteristics indicate that coal mine methane emissions in the study area are jointly governed by numerous low to moderate-intensity sources and a small number of high-intensity super emitters, with the latter playing a decisive role in the regional emission budget.
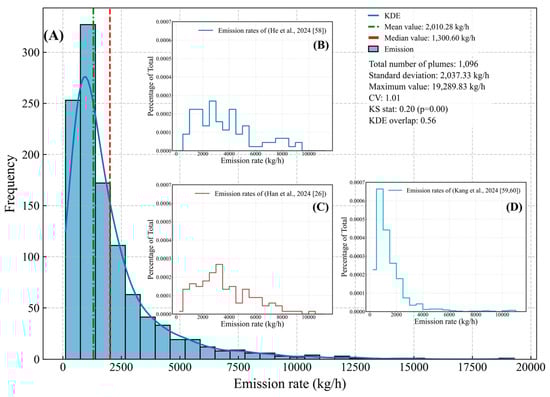
Figure 1.
(A) Aggregate distribution of the three point-source datasets; (B–D) Probability density distributions for the three point-source datasets.
Table 3.
Statistical indicators of emission distribution for the GF-5B/AHSI point-source emission datasets.
Simultaneously, we conducted a systematic comparison of the three GF-5B/AHSI point-source emission datasets. Because the dataset of He et al. [58] does not include emission time information and because no plume locations are exactly collocated in latitude and longitude among the three datasets, we adopted a hierarchical matching strategy. For comparisons involving the dataset of He et al. [58], we performed spatial matching only, using a distance threshold of 200 m and selecting the nearest plume as the match. For plume records from Han et al. [26] and Kang et al. [59,60], temporal matching was further applied in addition to spatial matching. As illustrated in Figure 2, the 26 plume records satisfy the spatial matching criterion between the datasets of He et al. [58] and Han et al. [26]. Among these, 17 plumes exhibit higher emission rates in the dataset of Han et al. [26], while only 14 plume records overlap in their uncertainty ranges for emission rate estimates. In the comparison between He et al. [58] and Kang et al. [59,60], 10 plume records meet the spatial matching requirement. Among these, six plumes have higher emission rates estimated by He et al. [58], and six plume records exhibit overlapping uncertainty intervals. For the datasets of Han et al. and Kang et al. [59,60], only two plumes satisfy both spatial and temporal matching criteria. For these two plumes, both the emission rates and the associated uncertainty ranges in the dataset of Han et al. are higher than those reported by Kang et al. [59,60], and there is no overlap between their emission rate estimates or uncertainty ranges. When comparing all three datasets simultaneously, only three plume records that satisfy spatial matching can be identified across all datasets.
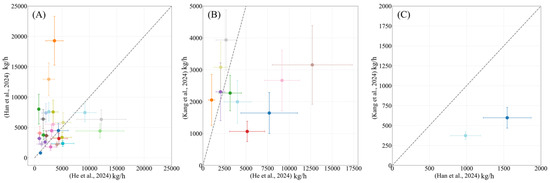
Figure 2.
(A–C) Spatiotemporal comparisons between each pair of three point-source datasets. Scatter points in different colors represent plumes [26,58].
These results demonstrate that the accuracy of prior emission source location information and differences in specific estimation methodologies strongly influence the detection capability of methane plumes and the estimation of emission rates. Although He et al. [58], Han et al. [26], and Kang et al. [59,60] all employ matched filtering to retrieve methane concentration enhancements and use the IME method to estimate plume emission rates, small differences in plume identification and quantification procedures can substantially affect the final emission estimates. For example, He et al. [58] performed spectral calibration of the center wavelength and full width at half maximum prior to matched filtering. They implemented automated plume extraction using a flood-fill algorithm, which distinguishes their approach from those used in other studies. Considering the inherently intermittent and complex nature of methane emissions from the coal industry, GF-5B/AHSI, with its long revisit cycle and consequently low effective annual sampling frequency, provides only short time-series data for point-source emissions. This imposes certain limitations on assessing the long-term emission levels of super emitters and on statistically estimating annual-average emissions from coal mines. In contrast, TROPOMI achieves daily global coverage, making it more suitable than high-resolution satellite data for studying the temporal dynamics of emissions at monthly and daily scales.
The statistical distribution of long-term daily coal mine methane emissions across multiple grid cells, estimated from TROPOMI observations, is presented in Figure 3. TROPOMI-gridded emissions are primarily concentrated within the range of 0 to 20,000 kg/h, with a mean value of 9856 kg/h and a maximum reaching 83,930 kg/h. All major statistical indicators are substantially higher than those derived from the GF-5B/AHSI point-source emission rates. Overall, TROPOMI-gridded emissions exhibit a pronounced right skewness (1.80) and heavy-tailed characteristics (excess kurtosis = 4.11), indicating a significant departure from a normal distribution. The peak of the kernel density estimation curve is approximately 1429 kg/h, and its overlap with the theoretical normal distribution is only 0.61, visually demonstrating the marked discrepancy between the empirical distribution and the normality assumption. Similar to the distribution pattern observed for GF-5B/AHSI point-source emissions, TROPOMI-gridded data reveal that coal mine methane emissions in the study area are jointly dominated by a large number of low- to moderate-intensity sources and a small number of high-intensity super emitters. It is noteworthy that, compared with the point-source emission rate dataset, the skewness and kurtosis values of TROPOMI-gridded emissions are relatively lower. This indicates that when observations cover a broader temporal span and a larger number of emission sources, the extreme influence of exceptionally high values on the overall distribution tends to be attenuated. Nevertheless, the fundamental characteristic that a limited number of high-intensity sources dominate the total emissions remains robust. This finding further underscores the critical importance of accurately identifying and quantifying a small number of super emitters for improving the precision of regional emission inventories. Finally, the systematic differences in the number of detected emission sources and their quantified intensities derived from satellite data with different spatial resolutions clarify their respective application domains. Owing to its high spatial resolution, GF-5B/AHSI is more suitable for the detailed identification of coal mine methane point sources, emission rate retrieval, and facility-level attribution. In contrast, benefiting from its high temporal resolution and wide spatial coverage, TROPOMI is more appropriate for analyzing spatiotemporal dynamics, characterizing overall emission patterns, and conducting statistical assessments of regional annual mean methane emissions.
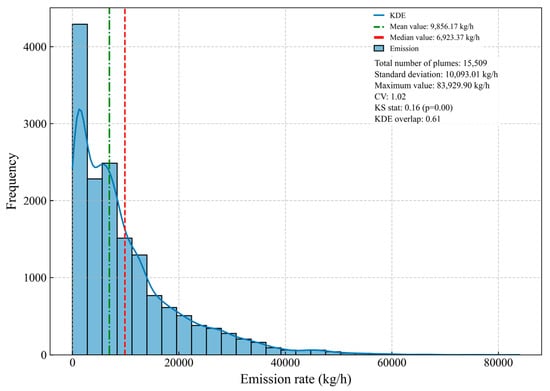
Figure 3.
Distribution of CMM emissions based on TROPOMI.
3.2. Comparative Analysis of Spatial Distributions from TROPOMI and GF-5B/AHSI Emission Inversions in Shanxi Province
Inaccuracies or omissions in prior emission source locations pose significant challenges for the inversion and attribution of CMM emissions. This study conducted a multi-scale visualization analysis of the spatial distribution characteristics of CMM emissions in Shanxi Province by integrating three point-source emission datasets, TROPOMI-based gridded CMM emissions, and TROPOMI XCH4 concentration distributions (Figure 4 and Figure 5). The results reveal that CMM plumes in Shanxi exhibit a pronounced spatially clustered pattern. These high-density plume areas closely correspond to regions of elevated TROPOMI XCH4. This spatial agreement provides preliminary evidence of comparability between point-source and area-source emissions in spatial representation. In four major coal-producing regions (the specific spatial distribution is shown in Figure 5F), namely Yangquan, Lüliang, Changzhi, and Jincheng, all three point-source datasets detected distinct methane plumes and enabled emission rate quantification. While different point-source datasets demonstrated consistency in identifying key emission regions such as the Qinshui Basin, notable discrepancies remained in the overall spatial extent, number, and intensity of plumes, particularly regarding the detection of methane signals in northern Shanxi. The central locations of methane plumes align with surface facilities such as coal mines, suggesting that plume positioning is closely tied to mine coordinates. This indicates variations in the detected emission source locations across studies, where different location information and estimation methodologies significantly affect plume detection and the accurate quantification of mine-level methane emissions.
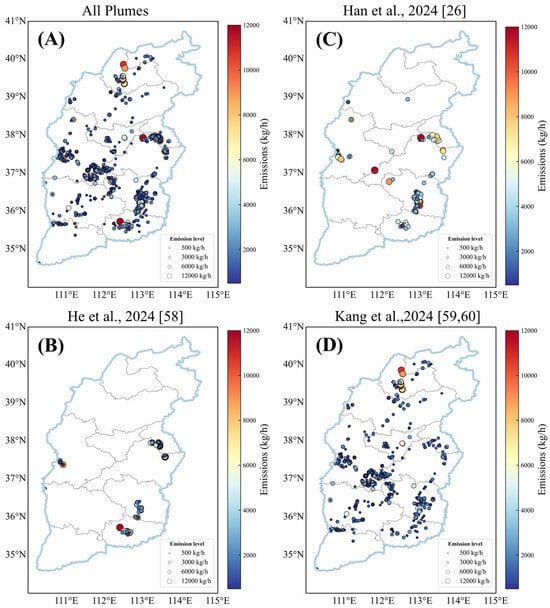
Figure 4.
(A–D) Spatial distribution and emission intensity of CMM plumes in Shanxi Province based on GF-5B/AHSI.
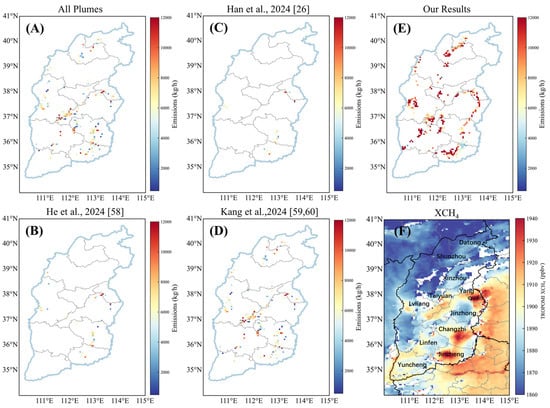
Figure 5.
(A–D) TROPOMI-gridded emissions masked based on plume location coordinates from the complete plume dataset and the datasets of He et al. [58], Han et al. [26], and Kang et al. [59,60], respectively; (E) TROPOMI-gridded emissions masked based on location information of 616 underground coal mines obtained by our research team; (F) Mean TROPOMI XCH4 observations over Shanxi Province and surrounding areas from May 2018 to December 2024.
This study first utilized the plume location information from three GF-5B/AHSI-based point-source emission datasets to spatially mask the TROPOMI-gridded emission dataset, respectively. Based on this, a systematic comparison of the distribution characteristics between point-source and area-source emissions was conducted. The results show that under the same prior emission source locations, there are differences in CMM emission intensities derived from TROPOMI and GF-5B/AHSI. TROPOMI-gridded emissions are significantly higher than point-source emissions; however, some of the high-emission areas identified by the two approaches are consistent, though not entirely the same. Subsequently, the three point-source emission datasets were, respectively, compared with the emission results masked using the coal mine location information obtained by our research team. A preliminary comparison between point-source emissions and TROPOMI-gridded data revealed spatial consistency in major coal-producing regions. However, systematic differences were identified in overall spatial distribution patterns, emission magnitude scales, and spatial arrangements of high-value zones. TROPOMI-based quantification covered broader CMM emissions and showed substantial differences in emission intensity magnitudes compared to point-source results, with distinct spatial patterns in high-value zones. These differences highlight discrepancies in methane emission quantification arising from divergent observational scales.
The statistical results indicate that the matching success rates range from 39.1% to 48.4%. Paired-samples t-tests consistently show that, across all three datasets, the mean TROPOMI-gridded emissions are systematically higher than the corresponding point-source estimates. More importantly, the 95% confidence intervals of all paired differences, calculated based on the t distribution, do not include zero. To gain a deeper understanding of these commonalities and differences, the following section will conduct a systematic comparative analysis of distribution characteristics, intensity variations, and the interrelationships between point-source and grid-level emissions from a spatiotemporal perspective, aiming to clarify the comparability and synergistic potential of multi-scale datasets.
3.3. Comprehensive Comparison Between TROPOMI-Gridded Emissions and GF-5B/AHSI Point-Source Emissions
Satellite repeat observation data play a critical role in annual methane emission accounting [66]. Given the inherently intermittent and complex nature of methane emissions from the coal industry, longer-term measurements are necessary to realistically reflect emission levels from coal mines [43]. Estimating annual emissions based solely on single-day or limited daily data may introduce biases due to inadequate temporal representation. TROPOMI offers a distinct advantage with its high observational frequency, enabling the retrieval of daily, grid-level CMM emissions and offering high reliability in characterizing seasonal variation trends and annual-average emission patterns [47,48,67]. In contrast, GF-5B/AHSI exhibits lower detection frequency for point-source emissions but enables accurate attribution to specific surface facilities. Therefore, to understand how TROPOMI gridded emissions represent facility-level emissions and to systematically evaluate their spatiotemporal relationship with GF-5B/AHSI point-source emissions, this study compared individual point-source emissions with TROPOMI time-series emissions from their corresponding grids. The results show that at some locations where methane plumes were identified, TROPOMI-gridded emissions failed to provide quantifiable results. Moreover, when point-source emissions were arranged in ascending order, the corresponding mean grid emissions did not exhibit a consistent increasing trend. This phenomenon may be attributed to temporal discrepancies in the satellite observational data, or to inaccuracies or omissions in the coal mine locations used for emission estimation. It reveals that relying solely on a single satellite dataset is insufficient to characterize methane emissions from coal mines, as a single emission value or missing data fails to capture the emission features adequately. These findings also underscore the importance of accurate and comprehensive prior spatial information on emission sources for reliable quantification of methane emissions.
As shown in Figure 6, specific analysis of individual plumes and grid emissions revealed that mean TROPOMI-gridded emissions were generally higher than plume emissions and provided longer emission time series. However, the limited number of valid observations for individual plumes makes direct extrapolation of such short-term point-source measurements to annual regional levels scientifically unsound for comparison with emission inventories based on long-term average activity data. The emission rates and uncertainty intervals from the three point-source datasets overlap with or fall entirely within the uncertainty range of TROPOMI-based emission estimates, indicating that point-source emissions and gridded emissions are reasonably comparable within an acceptable margin of error. Specifically, He et al. [58] detected 45 methane plumes within the valid emission grids of TROPOMI, 38 of which overlap the grid emission uncertainty intervals. In the Han et al. [26] dataset, 66 methane plumes were located within valid TROPOMI emission grids, and 60 of these point-source emission rates overlapped the grid emission uncertainty ranges. In the Kang et al. [59,60] dataset, 338 methane plumes were located within valid TROPOMI emission grids, with 261 point-source emission rates overlapping the grid emission uncertainty intervals. The statistical overlap between point-source and TROPOMI-grid emissions demonstrates their comparability. Although TROPOMI failed to quantify emissions at some plume locations, potentially due to cloud cover or omissions in prior coal mine location data, TROPOMI-gridded emissions generally provided more valid observations overall. This indicates that TROPOMI time-series emissions partially capture single-plume emissions and can effectively represent annual-average source emissions. Furthermore, this study reveals the synergistic potential of different satellite platforms and emission inversion methodologies for comprehensive analysis.
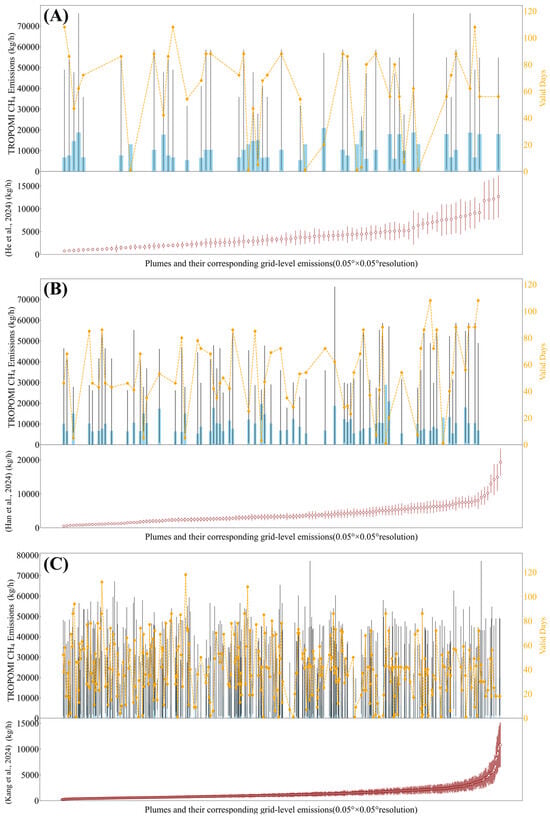
Figure 6.
Comparative analysis of CMM emissions in Shanxi Province based on TROPOMI and GF 5B/AHSI. (A–C) display the point-source emission results reported by He et al. [58], Han et al. [26], and Kang et al. [59,60], respectively, each compared with the TROPOMI-based time series gridded emissions within the corresponding grid cells. The upper and lower subplots share a common x-axis. The lower subplot displays plume indices arranged in ascending order, while the upper subplot shows the corresponding TROPOMI grid-level emissions for each plume. In the upper subplots, the bars represent the mean emissions derived from the TROPOMI time series, with error bars indicating the maximum and minimum values of the series. The yellow dots denote the number of days with valid emissions within the respective grid cells. The lower subplots display the point-source emission estimates from He et al. [58], Han et al. [26], and Kang et al. [59,60], along with their associated error ranges. Here, the error bars for Kang et al. [59,60] indicate the range of variation in emission rates (i.e., the maximum and minimum values). In contrast, the error bars for the other two datasets represent the respective uncertainty ranges of their estimates.
A total of 45 methane plumes from the point-source dataset of He et al. were successfully matched with TROPOMI-gridded emissions, corresponding to a matching rate of 48.4%. As shown in Table 4, the paired point-source emission rate in the dataset of He et al. is 4065 ± 2612 kg/h. In contrast, the corresponding TROPOMI-gridded emission is 11,583 ± 4736 kg/h, which is substantially higher than the point-source estimates. The paired difference, defined as the TROPOMI-gridded emission minus the plume-based emission rate of He et al. [58], is 7518 ± 4625 kg/h. The 95% confidence interval based on the t distribution is [6113, 8923] kg/h, which does not include zero, indicating that the difference is both statistically significant and of substantial practical magnitude.
Table 4.
Statistical indicators for spatial matching between TROPOMI-gridded emissions and point-source emissions by He et al. [58].
A total of 66 methane plumes from the dataset of Han et al. [26] were successfully spatially matched with TROPOMI-gridded emissions, corresponding to a matching rate of 47.8%. As shown in Table 5, the mean emission rate of the effectively paired plumes in the dataset of Han et al. [26] is 3725 ± 2004 kg/h. In contrast, the corresponding TROPOMI-gridded emission is 10,223 ± 4433 kg/h, which is substantially higher than the estimates reported by Han et al. [26]. The paired difference, defined as the TROPOMI-gridded emission minus the plume-based emission rate of Han et al. [26], is 6497 ± 4720 kg/h. The 95% confidence interval based on the t distribution is [5328, 7666] kg/h, indicating a statistically significant and practically meaningful difference.
Table 5.
Statistical indicators for spatial matching between TROPOMI-gridded emissions and point-source emissions by Han et al. [26].
A total of 300 and 338 methane plumes from the dataset of Kang et al. [59,60] were successfully spatially matched with TROPOMI-gridded emissions, corresponding to a matching rate of 39.1%. As shown in Table 6, the mean emission rate of the effectively paired plumes in the dataset of Kang et al. [59,60] is 1381 ± 1233 kg/h. In contrast, the corresponding TROPOMI-gridded emission is 11,954 ± 5456 kg/h, which is substantially higher than the estimates reported by Kang et al. [59,60]. The paired difference, defined as the TROPOMI-gridded emission minus the plume-based emission rate of Kang et al. [59,60], is 10,573 ± 5491 kg/h. The 95% confidence interval based on the t distribution is [9985, 11,161] kg/h.
Table 6.
Statistical indicators for spatial matching between TROPOMI-gridded emissions and point-source emissions by Kang et al. [59,60].
The statistical results indicate that the matching success rates range from 39.1% to 48.4%. Paired-samples t-tests consistently show that, across all three datasets, the mean TROPOMI-gridded emissions are systematically higher than the corresponding point-source estimates. More importantly, the 95% confidence intervals of all paired differences, calculated based on the t distribution, do not include zero.
We conducted separate statistical analyses for the non-overlapping methane emission estimates derived from TROPOMI and the datasets of He et al. [58], Han et al. [26], and Kang et al. [59,60]. Specifically, for the cases in which the uncertainty intervals of TROPOMI-gridded emissions and the estimates of Kang et al. [59,60] did not overlap, the TROPOMI values were consistently higher than the corresponding plume-based emission rates. The TROPOMI-gridded emissions ranged from 2139 to 41,703 kg/h, whereas the plume emission rates reported by Kang et al. [59,60] ranged from 258 to 3627 kg/h. For the non-overlapping cases between TROPOMI and the dataset of He et al. [58], the TROPOMI-gridded emissions were also uniformly higher than the plume-based estimates of He et al. [58], with TROPOMI values ranging from 13,074 to 19,616 kg/h and plume emission rates ranging from 1563 to 6371 kg/h. Similarly, in the non-overlapping cases between TROPOMI and the dataset of Han et al. [26], the TROPOMI-gridded emissions consistently exceeded the corresponding plume-based estimates. In this comparison, TROPOMI emissions ranged from 13,074 to 28,805 kg/h, whereas the plume emission rates reported by Han et al. [26] ranged from 749 to 6384 kg/h. Taken together, across all three comparative analyses, the non-overlapping cases systematically exhibit substantially higher emission estimates from TROPOMI than from the corresponding GF-5B/AHSI-based point-source datasets, indicating a consistent positive bias in gridded emissions relative to plume-based estimates under non-overlapping conditions.
To systematically evaluate spatiotemporal correlations and differences in CMM emissions across scales, this study compares and analyzes point-source emissions with corresponding TROPOMI grid-level emissions at identical observation times. Due to the spatial resolution limitations (5.5 × 7 km2) of the TROPOMI, multiple geographically proximate coal mine emission sources may fall within the same grid cell. In such cases, the TROPOMI-based gridded emissions are statistically aggregated into a single emission value, representing the cumulative emissions from multiple sources within the grid cell. Therefore, when conducting a spatiotemporal comparison between GF-5B/AHSI point-source emissions and TROPOMI-gridded data, if multiple methane plumes are located within the same TROPOMI grid cell, the emission rates of all plumes located within that cell at the same observation time are integrated. This total is then compared with the corresponding TROPOMI-gridded emission value (Figure 7). The results show that, across three common observation dates (17 October 2021, 4 May 2022, 15 June 2022), the plume rates estimated by Han et al. [26] for 10 coal mine plumes exhibit spatiotemporal overlap with emissions from seven TROPOMI grids. In cases where the point-source emission estimates from Han et al. [26] exceed the TROPOMI-gridded emissions, the point-source emission rates are extremely high, indicating “super-emitter” behavior. In contrast, in low-emission scenarios, the difference between the two is small, with the TROPOMI-based emission estimate falling within the error range of the point-source emission estimate. For methane plumes estimated by Kang et al. [59,60] and TROPOMI-gridded emissions, there were five common observation dates (17 October 2021, 9 November 2021, 23 November 2021, 4 May 2022, 15 June 2022), covering 18 coal mine emission sources and 16 TROPOMI emission grids. Notably, in 87.5% of cases, TROPOMI-gridded emissions exceed the estimates by Kang et al. [59,60]. In scenarios where the point-source emission estimates from Kang et al. [59,60] exceed TROPOMI-gridded emissions, the TROPOMI-derived emission values are relatively low. CMM emissions exhibit strong spatiotemporal variability, and their estimates are influenced by factors such as wind speed, topography, and geological conditions. The higher TROPOMI-gridded emissions compared to plume rates are primarily due to cumulative TROPOMI-gridded emissions, whereas GF-5B/AHSI-based observations quantify the emission intensity of individual point sources within the grid. Thus, the former reflects regional integrated emission levels, whereas the latter captures localized peak signals. The phenomenon of point-source emission rates exceeding TROPOMI-gridded emissions can be attributed to TROPOMI’s limitations in detecting methane hotspots or identifying the strongest point-source emissions. Strong emission signals within a grid may be diluted, revealing differences in the capture of CMM emission characteristics across observational scales. The limited number of common observation dates between TROPOMI and GF-5B/AHSI coal mine emission data highlights the lack of scientific rigor in extrapolating sparse emission data into annual averages and comparing them with annual emission inventories such as EDGAR. Future studies could simultaneously consider point-source emissions from coal mines with similar production levels and emission factors, and then align them with the temporal function of S5P/TROPOMI to derive annual emission ranges.
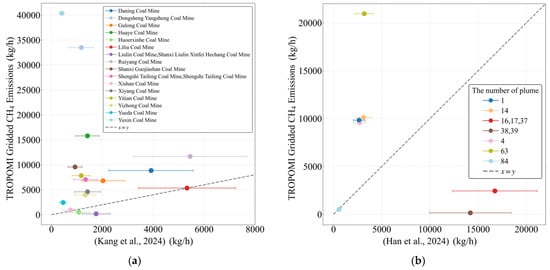
Figure 7.
Spatiotemporal comparison between methane point-source emissions and TROPOMI-gridded emissions: (a) Spatiotemporal matching of emissions from Han et al. [26] with TROPOMI-based grid emissions; (b) Spatiotemporal matching of emissions from Kang et al. [59,60] with TROPOMI-based grid emissions.
It should be noted that CMM emissions are influenced by multiple factors, including mining activities, ventilation scheduling, and meteorological conditions, and exhibit significant spatiotemporal heterogeneity and intermittent emission characteristics, with intensity potentially varying substantially on a daily scale. As shown in Figure 7, due to inherent differences between GF-5B/AHSI and TROPOMI in overpass time, spatial resolution, and spectral resolution, their abilities to capture signals from the same emission source differ, resulting in a relatively limited number of comparable data points that meet strict spatiotemporal matching criteria. Consequently, it is challenging to systematically reveal the instantaneous spatiotemporal differences between point-source and area-source emissions.
3.4. Assessment and Comparison of the Capture Capabilities of TROPOMI and GF-5B/AHSI for Emissions from Ventilation Shafts
Coal mine ventilation shafts represent significant sources of methane emissions, contributing substantially to the total regional methane budget [66]. Previous studies have identified direct spatial correspondences between certain methane plumes and these ventilation shafts [26]. Spatially, while most ventilation shafts are located within the industrial premises of coal mines, some may be situated away from the main industrial area due to safety requirements and ventilation design considerations. Moreover, a single coal mine may sometimes be equipped with multiple ventilation shafts. Current research on point-source emissions has predominantly focused on sources that are clearly identifiable and located within or near the industrial site, with limited attention given to ventilation shafts situated outside the industrial premises. Such omissions or positional inaccuracies in source identification, resulting from incomplete prior location information, have become non-negligible sources of error in point-source quantification. This also provides a critical basis for refining future emission inventories and improving point-source quantification methods. Compared to the identification and quantification of individual emission sources, gridded emission analysis based on TROPOMI XCH4 can cover emission information over a broader area, including industrial sites, ventilation shafts, and other potential emission sources. Although there are cases where the main mining facility and its ventilation shafts fall into different emission grids, aggregating emissions across multiple grids offers a more comprehensive representation of the actual regional emission levels, thereby enhancing the representativeness of annual mean emission estimates.
Using high-resolution remote sensing imagery, including Google Earth data, we performed visual interpretation to characterize the spatial distribution of coal mine ventilation shafts in Shanxi Province. A total of 60 clearly identifiable ventilation shafts were recognized. Among them, 28 shafts are located within well-defined industrial complexes, whereas 32 shafts are situated at locations distant from industrial facilities, accounting for more than half of the total. This statistical evidence confirms that remote ventilation shafts represent a common configuration in coal mining infrastructure in Shanxi Province rather than isolated cases. To further elucidate the relationship between point-source emissions and gridded emissions, four representative coal mines and their associated ventilation shafts were selected for detailed case analysis. All four shafts are located away from the main operational areas of the mines, although their distances from the corresponding mining facilities vary. These cases encompass multiple observational scenarios. Some are simultaneously covered by three point-source emission datasets and TROPOMI-gridded emissions, as shown in Figure 8. Others are detected only by point-source observations and exhibit pronounced methane plumes, as illustrated in Figure 9. In contrast, some cases are captured exclusively by TROPOMI-gridded emission products, because their emission signals are too weak to be effectively quantified by point-source observations, as shown in Figure 10 and Figure 11.
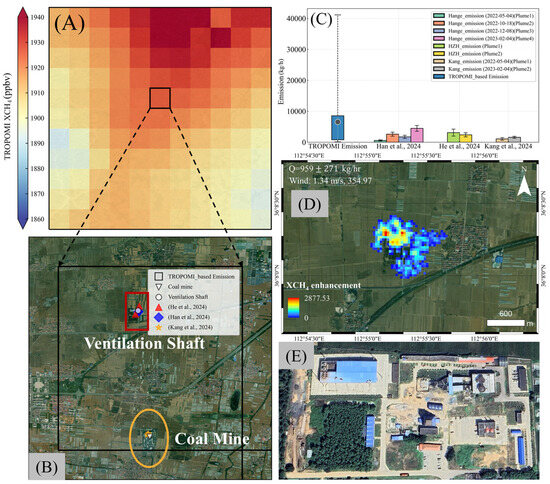
Figure 8.
Case study 1 on point-source and gridded emissions for coal mines or ventilation shafts [26,58,59,60]. (A) Mean TROPOMI XCH4 observations from May 2018 to December 2024; (B) Spatial locations of the coal mine and ventilation shaft within the 5 km × 5 km emission grid; (C) Point-source and area-wide emissions within the 5 km × 5 km grid, with the box plot displaying the distribution of the minimum values, 25th, 50th, 75th, and the maximum values along with the mean values for the mine grid from May 2018 to December 2024. The lower whiskers, box bottom, box top, and upper whiskers correspond to the minimum values, 25th, 75th, and the maximum values, respectively. The mean is represented by dot; (D) Plume near the ventilation shaft based on GF-5B/AHSI; (E) Detailed schematic of the ventilation shaft.
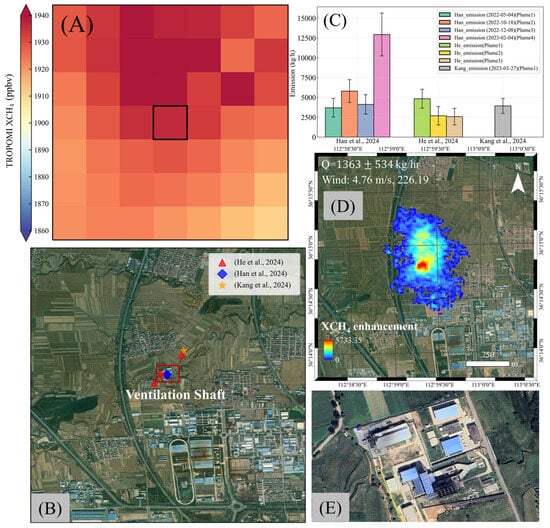
Figure 9.
Case study 2 on point-source and gridded emissions for coal mines or ventilation shafts [26,58,59,60]. (A) Mean TROPOMI XCH4 observations from May 2018 to December 2024; (B) Spatial locations of the ventilation shaft; (C) Point-source emissions near the ventilation shaft; (D) Plume near the ventilation shaft based on GF-5B/AHSI; (E) Detailed schematic of the ventilation shaft.
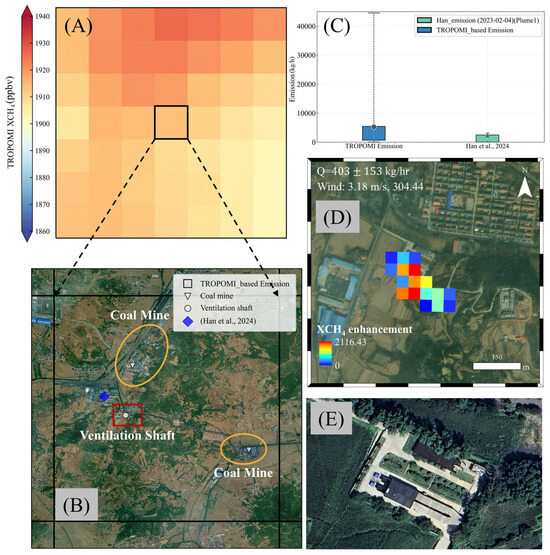
Figure 10.
Case study 3 on point-source and gridded emissions for coal mines or ventilation shafts [26]. (A) Mean TROPOMI XCH4 observations from May 2018 to December 2024; (B) Spatial locations of the coal mine and ventilation shaft within the 5 km × 5 km emission grid; (C) Point-source and area-wide emissions within the 5 km × 5 km grid, with the box plot displaying the distribution of the minimum values, 25th, 50th, 75th, and the maximum values along with the mean values for the mine grid from May 2018 to December 2024. The lower whiskers, box bottom, box top, and upper whiskers correspond to the minimum values, 25th, 75th, and the maximum values, respectively. The mean is represented by dot; (D) Plume near the ventilation shaft based on GF-5B/AHSI; (E) Detailed schematic of the ventilation shaft.
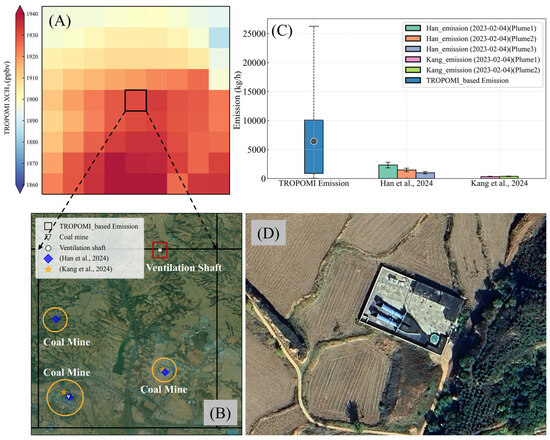
Figure 11.
Case study 4 on point-source and gridded emissions for coal mines or ventilation shafts [26,59,60]. (A) Mean TROPOMI XCH4 observations from May 2018 to December 2024; (B) Spatial locations of the coal mine and ventilation shaft within the 5 km × 5 km emission grid; (C) Point-source and area-wide emissions within the 5 km × 5 km grid, with the box plot displaying the distribution of the minimum values, 25th, 50th, 75th, and the maximum values along with the mean values for the mine grid from May 2018 to December 2024. The lower whiskers, box bottom, box top, and upper whiskers correspond to the minimum values, 25th, 75th, and the maximum values, respectively. The mean is represented by dot; (D) Detailed schematic of the ventilation shaft.
As shown in Figure 8, the mine and the ventilation shaft are spatially separated by a distance of 3.82 km, yet both are located within the same TROPOMI emission grid. The corresponding TROPOMI emission estimates are substantially higher than those derived from individual plume-based point-source measurements, directly demonstrating that neglecting dispersed emission sources may lead to underestimation of total emissions at the mine or regional scale. The mean TROPOMI-gridded emission is 6548 kg/h, with a standard error of 1041 kg/h. The associated 95% confidence interval ranges from 4508 to 8589 kg/h, and the relative standard error is 15.9%. Nonetheless, the uncertainty ranges of point-source estimates overlap with the TROPOMI time-series emissions range. With all point-source uncertainty intervals fully included within the TROPOMI range, the two approaches show a degree of statistical agreement when uncertainties are considered. These results indicate that the average TROPOMI-based emission estimate exhibits reasonable statistical reliability, although moderate uncertainty remains. Anomalously high methane concentrations are observed north of the mine and its ventilation shaft. However, because additional independent emission sources are present in this area, it is difficult to isolate the contribution of the target mine and shaft to the northern anomaly. As shown in Figure 9, all three GF-5B/AHSI point-source datasets identify pronounced methane plumes in the vicinity of the ventilation shaft, further demonstrating the substantial contribution of isolated shafts to methane emissions. This highlights the unique capability of point-source observations to resolve precise facility locations and instantaneous emission intensities. Similarly, elevated methane concentrations are also present north of this shaft, and future studies may employ high-resolution meteorological data and atmospheric transport models to conduct detailed transport analyses. As illustrated in Figure 10 and Figure 11, methane signals near the ventilation shaft are relatively weak and difficult to distinguish from background noise. This finding reveals that point-source observations have limited capability to detect weak emission sources and provide discontinuous temporal coverage. In Figure 10, the mean TROPOMI-gridded emission is 5263 kg/h with a standard error of 997 kg/h, while in Figure 11, the mean value is 6406 kg/h with a standard error of 918 kg/h. These results indicate that coal mine methane emissions exhibit temporal variability and that limited observations are insufficient to represent long-term emission levels.
Comparative analyses show that average methane emissions derived from TROPOMI are substantially higher than plume-based emission rates estimated from GF-5B/AHSI observations in the vicinity of coal mines or ventilation shafts. Within the corresponding emission grids, TROPOMI simultaneously captures emissions from both mining operations and remote ventilation shafts, thereby facilitating a more comprehensive characterization of coal mine methane emission patterns and a more accurate assessment of regional totals. In contrast, the three GF-5B/AHSI point-source datasets primarily detect methane plumes near mines or shafts and are limited in quantifying weak emission sources. Moreover, TROPOMI provides longer emission time series, highlighting certain limitations of point-source estimates in characterizing emission persistence and intermittency. Nevertheless, the uncertainty ranges of point-source emission estimates partially overlap with those derived from TROPOMI time series, indicating a degree of statistical consistency between the two approaches when uncertainties are taken into account. Each method thus captures distinct dimensions of the emission problem. It should be noted that the point-source emission datasets used in this study were derived from previous investigations. Consequently, it is not feasible to quantify emissions from omitted ventilation shafts using fully consistent methodologies, and systematic biases arising from different estimation approaches cannot be precisely assessed. Although exact quantitative bias values cannot currently be determined, this analysis clearly demonstrates the importance of incorporating dispersed facilities, such as remote ventilation shafts, into prior emission inventories. Such integration is essential for improving regional methane accounting and for developing effective mitigation strategies in future studies.
4. Conclusions
Based on high-resolution point-source emission data derived from GF-5B/AHSI and long-term time series gridded emission data from S5P/TROPOMI, this study presents the first comprehensive spatiotemporal comparison of consistency, discrepancies, and underlying mechanisms between coal mine methane point-source emissions and areal emissions. In addition, the characteristics of coal mine methane emissions in Shanxi Province were systematically investigated. The main conclusions are summarized as follows:
(1) Both point-source and gridded emission datasets consistently reveal a pronounced heavy-tailed distribution of coal mine methane emissions in Shanxi Province, indicating that regional emissions are dominated by a large number of low to moderate intensity sources. Meanwhile, a small number of extremely high-intensity super emitters contribute disproportionately to total emissions. This structural feature is confirmed by both high-resolution point-source observations and high-temporal-resolution gridded observations, demonstrating the highly uneven nature of the emission intensity distribution.
(2) Different point-source datasets and the gridded dataset exhibit strong spatial consistency in identifying major emission hotspots, such as the Qinshui Basin. However, substantial discrepancies remain in the quantitative estimation of total emissions and emission intensities. Moreover, the spatial distributions of high emission regions identified by the two approaches are not fully coincident, particularly in northern Shanxi Province. This highlights the critical importance of accurate and comprehensive prior information on emission source locations, including detailed geospatial inventories of coal mine facilities, for improving the accuracy of satellite-based methane retrievals. It also demonstrates that establishing a more complete emission source inventory is fundamental to enhancing the reliability of satellite-derived estimates.
(3) Owing to the pronounced intermittency and variability of coal mine methane emissions, instantaneous satellite observations at overpass times cannot adequately represent long-term emission levels. Although both TROPOMI and GF-5B/AHSI provide snapshot observations, the long-term mean of TROPOMI-gridded emissions is more suitable for characterizing regional average emissions than point-source estimates derived from limited sampling frequencies.
(4) TROPOMI-gridded emissions are systematically higher than GF-5B/AHSI point-source retrievals, primarily because coal mines in Shanxi Province exhibit clustered spatial distributions, and individual TROPOMI grid cells may encompass multiple emission sources. Consequently, TROPOMI retrievals represent the integrated effect of cumulative emissions within a grid cell, whereas point-source inversions target individual facilities and reflect localized peak signals. This fundamental difference in spatial aggregation explains the observed discrepancies. As a result, although TROPOMI-gridded emissions have limited capability for precise source attribution, they capture a broader range of emission sources. In contrast, point-source approaches may overlook distributed or multi-facility emission sources, leading to incomplete representations of total coal mine emissions. From a methodological perspective, the TROPOMI-gridded emissions in this study were derived using mass-balance equations to estimate daily, grid-scale methane emissions, based on continuity equations describing atmospheric mass conservation. This approach integrates wind speed and direction, atmospheric transport and dispersion, and in situ processes affecting fugitive methane emissions, does not rely on prior emission inventories, and reduces subjectivity associated with background subtraction. By contrast, GF-5B/AHSI point-source estimates are mainly based on the Integrated Mass Enhancement method, which links total plume mass enhancement to emission rates through parameterization of wind-driven plume dispersion. Although this method can achieve high accuracy for isolated plumes under ideal conditions, it is highly sensitive to plume segmentation and background selection.
(5) The complementary strengths and applicable scenarios of GF-5B/AHSI point-source and TROPOMI-gridded emissions are clearly demonstrated, with TROPOMI exhibiting particular advantages in characterizing regional annual mean emissions. The variability range of long-term TROPOMI emissions generally covers, or partially overlaps with, the uncertainty intervals of point-source estimates. This indicates that, despite limitations in spatial resolution and reduced sensitivity to small-scale plumes, TROPOMI effectively reflects aggregate emissions at the coal mine cluster or regional scale and provides reliable information on annual mean methane emissions. Accordingly, TROPOMI is more suitable for monitoring cumulative regional emissions and large-scale persistent signals, whereas isolated, transient, or spatially limited point sources may not be effectively captured. In contrast, GF-5B/AHSI-based point-source observations offer clear advantages in detecting small- to medium-scale plumes, but are constrained by limited revisit frequency and sampling density. Direct extrapolation of short-term point-source measurements to annual emission estimates may therefore introduce substantial uncertainty. Consequently, particular caution is required when comparing point-source estimates with bottom-up emission inventories. GF-5B/AHSI and TROPOMI exhibit strong complementarity in observational capability: the former enables precise identification and quantification of individual sources through high spatial resolution, while the latter provides broad coverage and moderate resolution for characterizing regional emission backgrounds and temporal dynamics.
(6) Coal mine ventilation shafts exhibit distinctive spatial distribution patterns and exert a substantial influence on methane emission accounting. Case studies demonstrate that some key emission facilities, such as ventilation shafts, may be located far from primary industrial areas, and that multiple shafts may correspond to a single mine, resulting in complex attribution relationships. Neglecting such remotely located sources in emission inventories or satellite analyses may lead to significant underestimation and spatial bias, ultimately compromising the accuracy of regional emission assessments. This finding provides important guidance for improving emission source inventories and optimizing satellite monitoring strategies.
In summary, focusing on underground coal mines in Shanxi Province, this study conducted a systematic comparison of methane emission datasets at different spatial resolutions. The results not only enhance understanding of the spatial heterogeneity and statistical characteristics of regional coal mine methane emissions, but also clarify the complementary roles and appropriate applications of high-resolution point-source monitoring and moderate-resolution gridded observations. The findings provide critical evidence and analytical frameworks for integrating multi-source remote sensing data to improve the accuracy, reliability, and practical utility of methane emission accounting. Nevertheless, caution is required when extrapolating these conclusions to other coal-mining regions. In areas with few point sources, complex emission structures, or highly heterogeneous spatial distributions, similar scale-based comparisons may entail substantial uncertainty. Furthermore, regional differences in geological settings, mining technologies, and climatic conditions may significantly influence methane release intensity and spatiotemporal patterns, thereby affecting the comparability of different remote sensing datasets. We therefore recommend that adaptive evaluations be conducted when applying the proposed comparative framework to other regions, with particular attention to the completeness of prior source information, meteorological and topographic influences, and, where possible, validation using ground-based observations, to enhance robustness and avoid overgeneralization.
5. Discussion
By comparing the spatiotemporal distributions of high-resolution point-source emissions derived from GF-5B/AHSI with medium-resolution gridded emissions from TROPOMI, this study demonstrates the complementary value and applicability of satellite observations at different spatial scales for characterizing coal mine methane emissions. However, several limitations remain with respect to data availability, uncertainty attribution, and emission validation. First, inherent differences between the two satellite sensors in observation time, spatial resolution, spectral resolution, and revisit frequency, combined with the highly intermittent nature of coal mine methane emissions, substantially limit the number of coincident observations that can be matched under strict spatiotemporal constraints. As a result, comparisons based on a limited number of matched samples may introduce uncertainty in the representation of regional emission characteristics. In addition, plume emission rate estimates are strongly influenced by wind speed, wind direction, and topographic conditions. The point-source emission datasets adopted in this analysis from previous studies lack key meteorological parameters, such as wind speed and direction, which constrain further investigation of atmospheric transport, dispersion processes, and associated inversion uncertainties. Second, with respect to source attribution, TROPOMI-gridded emissions represent spatially aggregated regional signals and cannot be unambiguously attributed to specific facilities within individual pixels. Although prior coal mine location information was used for spatial matching, uncertainties in source attribution persist in regions with dense infrastructure or mixed emission sources, where non-coal-related emissions may coexist. Third, in terms of emission validation, this study primarily relies on intercomparisons among multiple satellite datasets to characterize coal mine methane emissions in Shanxi Province, owing to the limited availability of extensive, long-term in situ measurements across the study area. The absence of independent ground-based or airborne observations as reference data for quantitative calibration constitutes a major limitation of the current evaluation framework.
In view of these limitations, coordinated multi-platform observations are essential for resolving individual plume emissions and systematically characterizing methane emissions in complex mining regions. Future research should focus on establishing a more comprehensive, multi-tiered observational and analytical framework. Given the complementary nature of satellite observations at different spatial and temporal scales, a key priority is the development of multi-source data fusion and cross-validation frameworks that integrate high-temporal-resolution observations, such as those from TROPOMI, with high-spatial-resolution measurements from sensors such as GF-5B/AHSI and PRISMA, in combination with mobile ground-based or airborne surveys. Such an integrated observation system would substantially improve the accuracy and reliability of emission quantification. In parallel, more detailed and systematically validated prior emission inventories should be established by comprehensively verifying the geographic locations and attributes of critical facilities, including ventilation shafts and drainage stations, and by refining source information both within and beyond industrial complexes. This effort is essential for enhancing source attribution and emission apportionment in satellite-based analyses. To further quantify uncertainties, future studies should incorporate atmospheric transport modeling by coupling high-resolution meteorological reanalysis data with dispersion models, such as WRF-Chem and LPDM, to simulate methane transport under varying meteorological conditions. This approach would enable quantitative assessment and correction of the influences of meteorology, inversion algorithms, and topography on emission estimates. Finally, a dynamic assessment framework based on a “regional screening and targeted quantification” strategy should be established. Under this paradigm, high-frequency observations from instruments such as TROPOMI would first be used to identify emission hotspots and temporal variability, thereby guiding targeted acquisitions by high-resolution sensors such as GF-5B/AHSI. This coordinated approach would facilitate systematic tracking and precise attribution of super-emitting sources over time.
Author Contributions
Conceptualization, K.Q.; formal analysis, Z.Y. and J.L.; data curation, J.Y., H.S., L.S. and D.Y.; writing—original draft, Z.Y. and W.L.; writing—review and editing, Z.Y. and K.Q. All authors have read and agreed to the published version of the manuscript.
Funding
This study was supported by the National Key Research and Development Program of China (2024YFB3910201) and Shanxi Science and Technology Cooperation and Exchange Special Project (ID: 20230404110106).
Data Availability Statement
The TROPOMI Level 2 Methane Total Column products are available at https://search.earthdata.nasa.gov/search/granules (accessed on 16 September 2025). The initial data on methane emissions from Shanxi coal mines for 2018–2022, based on TROPOMI, were obtained from Hu et al. [48], while the three point-source emission datasets based on GF-5B/AHSI were acquired from He et al. [58], Han et al. [26], and Kang et al. [59,60], respectively.
Acknowledgments
We are deeply indebted to Ge Han of Wuhan University and Zhonghua He of the Zhejiang Climate Centre for their invaluable contribution to this research. They generously provided the locations and emission rates of coal mine methane plumes in Shanxi Province, which were derived from GF-5B/AHSI satellite data. This support was instrumental in facilitating the successful execution of our study.
Conflicts of Interest
Authors Hao Sun, Lailiang Shi and Dewei Yin were employed by the company Shanxi Geophysical and Geochemical Exploration Institute Co., Ltd. The remaining authors declare that the research was conducted in the absence of any commercial or financial relationships that could be construed as a potential conflict of interest.
References
- Chen, Z.; Jacob, D.J.; Nesser, H.; Sulprizio, M.P.; Lorente, A.; Varon, D.J.; Lu, X.; Shen, L.; Qu, Z.; Penn, E.; et al. Methane Emissions from China: A High-Resolution Inversion of TROPOMI Satellite Observations. Atmos. Chem. Phys. 2022, 22, 10809–10826. [Google Scholar] [CrossRef]
- Peng, S.; Piao, S.; Bousquet, P.; Ciais, P.; Li, B.; Lin, X.; Tao, S.; Wang, Z.; Zhang, Y.; Zhou, F. Inventory of Anthropogenic Methane Emissions in Mainland China from 1980 to 2010. Atmos. Chem. Phys. 2016, 16, 14545–14562. [Google Scholar] [CrossRef]
- Saunois, M.; Martinez, A.; Poulter, B.; Zhang, Z.; Raymond, P.A.; Regnier, P.; Canadell, J.G.; Jackson, R.B.; Patra, P.K.; Bousquet, P.; et al. Global Methane Budget 2000–2020. Earth Syst. Sci. Data 2025, 17, 1873–1958. [Google Scholar] [CrossRef]
- Shen, L.; Jacob, D.J.; Gautam, R.; Omara, M.; Scarpelli, T.R.; Lorente, A.; Zavala-Araiza, D.; Lu, X.; Chen, Z.; Lin, J. National Quantifications of Methane Emissions from Fuel Exploitation Using High Resolution Inversions of Satellite Observations. Nat. Commun. 2023, 14, 4948. [Google Scholar] [CrossRef] [PubMed]
- Liu, G.; Shen, L.; Ciais, P.; Lin, X.; Hauglustaine, D.; Lan, X.; Turner, A.J.; Xi, Y.; Zhu, Y.; Peng, S. Trends in the Seasonal Amplitude of Atmospheric Methane. Nature 2025, 641, 660–665. [Google Scholar] [CrossRef]
- Mitchell, L.; Brook, E.; Lee, J.E.; Buizert, C.; Sowers, T. Constraints on the Late Holocene Anthropogenic Contribution to the Atmospheric Methane Budget. Science 2013, 342, 964–966. [Google Scholar] [CrossRef]
- Kirschke, S.; Bousquet, P.; Ciais, P.; Saunois, M.; Canadell, J.G.; Dlugokencky, E.J.; Bergamaschi, P.; Bergmann, D.; Blake, D.R.; Bruhwiler, L.; et al. Three Decades of Global Methane Sources and Sinks. Nat. Geosci. 2013, 6, 813–823. [Google Scholar] [CrossRef]
- Nisbet, E.G.; Dlugokencky, E.J.; Manning, M.R.; Lowry, D.; Fisher, R.E.; France, J.L.; Michel, S.E.; Miller, J.B.; White, J.W.C.; Vaughn, B.; et al. Rising Atmospheric Methane: 2007–2014 Growth and Isotopic Shift. Glob. Biogeochem. Cycles 2016, 30, 1356–1370. [Google Scholar] [CrossRef]
- Shoemaker, J.K.; Schrag, D.P.; Molina, M.J.; Ramanathan, V. What Role for Short-Lived Climate Pollutants in Mitigation Policy? Science 2013, 342, 1323–1324. [Google Scholar] [CrossRef]
- Dlugokencky, E.J.; Nisbet, E.G.; Fisher, R.; Lowry, D. Global Atmospheric Methane: Budget, Changes and Dangers. Philos. Trans. R. Soc. A Math. Phys. Eng. Sci. 2011, 369, 2058–2072. [Google Scholar] [CrossRef]
- Prather, M.J.; Holmes, C.D.; Hsu, J. Reactive Greenhouse Gas Scenarios: Systematic Exploration of Uncertainties and the Role of Atmospheric Chemistry. Geophys. Res. Lett. 2012, 39, 2012GL051440. [Google Scholar] [CrossRef]
- Nisbet, E.G.; Fisher, R.E.; Lowry, D.; France, J.L.; Allen, G.; Bakkaloglu, S.; Broderick, T.J.; Cain, M.; Coleman, M.; Fernandez, J.; et al. Methane Mitigation: Methods to Reduce Emissions, on the Path to the Paris Agreement. Rev. Geophys. 2020, 58, e2019RG000675. [Google Scholar] [CrossRef]
- West, J.J.; Fiore, A.M.; Horowitz, L.W.; Mauzerall, D.L. Global Health Benefits of Mitigating Ozone Pollution with Methane Emission Controls. Proc. Natl. Acad. Sci. USA 2006, 103, 3988–3993. [Google Scholar] [CrossRef] [PubMed]
- Abernethy, S.; O’Connor, F.M.; Jones, C.D.; Jackson, R.B. Methane Removal and the Proportional Reductions in Surface Temperature and Ozone. Philos. Trans. R. Soc. A Math. Phys. Eng. Sci. 2021, 379, 20210104. [Google Scholar] [CrossRef]
- Shindell, D.; Kuylenstierna, J.C.I.; Vignati, E.; Van Dingenen, R.; Amann, M.; Klimont, Z.; Anenberg, S.C.; Muller, N.; Janssens-Maenhout, G.; Raes, F.; et al. Simultaneously Mitigating Near-Term Climate Change and Improving Human Health and Food Security. Science 2012, 335, 183–189. [Google Scholar] [CrossRef]
- Saunois, M.; Stavert, A.R.; Poulter, B.; Bousquet, P.; Canadell, J.G.; Jackson, R.B.; Raymond, P.A.; Dlugokencky, E.J.; Houweling, S.; Patra, P.K.; et al. The Global Methane Budget 2000–2017. Earth Syst. Sci. Data 2020, 12, 1561–1623. [Google Scholar] [CrossRef]
- Schwietzke, S.; Sherwood, O.A.; Bruhwiler, L.M.P.; Miller, J.B.; Etiope, G.; Dlugokencky, E.J.; Michel, S.E.; Arling, V.A.; Vaughn, B.H.; White, J.W.C.; et al. Upward Revision of Global Fossil Fuel Methane Emissions Based on Isotope Database. Nature 2016, 538, 88–91. [Google Scholar] [CrossRef]
- Lin, J.; Khanna, N.; Liu, X.; Teng, F.; Wang, X. China’s Non-CO2 Greenhouse Gas Emissions: Future Trajectories and Mitigation Options and Potential. Sci. Rep. 2019, 9, 16095. [Google Scholar] [CrossRef]
- Lyon, D.R.; Alvarez, R.A.; Zavala-Araiza, D.; Brandt, A.R.; Jackson, R.B.; Hamburg, S.P. Aerial Surveys of Elevated Hydrocarbon Emissions from Oil and Gas Production Sites. Environ. Sci. Technol. 2016, 50, 4877–4886. [Google Scholar] [CrossRef]
- Lauvaux, T.; Giron, C.; Mazzolini, M.; d’Aspremont, A.; Duren, R.; Cusworth, D.; Shindell, D.; Ciais, P. Global Assessment of Oil and Gas Methane Ultra-Emitters. Science 2022, 375, 557–561. [Google Scholar] [CrossRef]
- Alvarez, R.A.; Zavala-Araiza, D.; Lyon, D.R.; Allen, D.T.; Barkley, Z.R.; Brandt, A.R.; Davis, K.J.; Herndon, S.C.; Jacob, D.J.; Karion, A.; et al. Assessment of Methane Emissions from the U.S. Oil and Gas Supply Chain. Science 2018, 361, 186–188. [Google Scholar] [CrossRef] [PubMed]
- Trenchev, P.; Dimitrova, M.; Avetisyan, D. Huge CH4, NO2 and CO Emissions from Coal Mines in the Kuznetsk Basin (Russia) Detected by Sentinel-5P. Remote Sens. 2023, 15, 1590. [Google Scholar] [CrossRef]
- Gao, J.; Guan, C.; Zhang, B.; Li, K. Decreasing Methane Emissions from China’s Coal Mining with Rebounded Coal Production. Environ. Res. Lett. 2021, 16, 124037. [Google Scholar] [CrossRef]
- Miller, S.M.; Michalak, A.M.; Detmers, R.G.; Hasekamp, O.P.; Bruhwiler, L.M.P.; Schwietzke, S. China’s Coal Mine Methane Regulations Have Not Curbed Growing Emissions. Nat. Commun. 2019, 10, 303. [Google Scholar] [CrossRef]
- Neininger, B.G.; Kelly, B.F.J.; Hacker, J.M.; Lu, X.; Schwietzke, S. Coal Seam Gas Industry Methane Emissions in the Surat Basin, Australia: Comparing Airborne Measurements with Inventories. Philos. Trans. R. Soc. A Math. Phys. Eng. Sci. 2021, 379, 20200458. [Google Scholar] [CrossRef]
- Han, G.; Pei, Z.; Shi, T.; Mao, H.; Li, S.; Mao, F.; Ma, X.; Zhang, X.; Gong, W. Unveiling Unprecedented Methane Hotspots in China’s Leading Coal Production Hub: A Satellite Mapping Revelation. Geophys. Res. Lett. 2024, 51, e2024GL109065. [Google Scholar] [CrossRef]
- Karacan, C.Ö.; Irakulis-Loitxate, I.; Field, R.A.; Warwick, P.D. Temporal and Spatial Comparison of Coal Mine Ventilation Methane Emissions and Mitigation Quantified Using PRISMA Satellite Data and On-Site Measurements. Sci. Total Environ. 2025, 975, 179268. [Google Scholar] [CrossRef]
- Kholod, N.; Evans, M.; Pilcher, R.C.; Roshchanka, V.; Ruiz, F.; Coté, M.; Collings, R. Global Methane Emissions from Coal Mining to Continue Growing Even with Declining Coal Production. J. Clean. Prod. 2020, 256, 120489. [Google Scholar] [CrossRef]
- Peng, S.; Giron, C.; Liu, G.; d’Aspremont, A.; Benoit, A.; Lauvaux, T.; Lin, X.; De Almeida Rodrigues, H.; Saunois, M.; Ciais, P. High-Resolution Assessment of Coal Mining Methane Emissions by Satellite in Shanxi, China. iScience 2023, 26, 108375. [Google Scholar] [CrossRef]
- Maasakkers, J.D.; Jacob, D.J.; Sulprizio, M.P.; Turner, A.J.; Weitz, M.; Wirth, T.; Hight, C.; DeFigueiredo, M.; Desai, M.; Schmeltz, R.; et al. Gridded National Inventory of U.S. Methane Emissions. Environ. Sci. Technol. 2016, 50, 13123–13133. [Google Scholar] [CrossRef]
- Schwietzke, S.; Griffin, W.M.; Matthews, H.S.; Bruhwiler, L.M.P. Global Bottom-Up Fossil Fuel Fugitive Methane and Ethane Emissions Inventory for Atmospheric Modeling. ACS Sustain. Chem. Eng. 2014, 2, 1992–2001. [Google Scholar] [CrossRef]
- Sheng, J.; Song, S.; Zhang, Y.; Prinn, R.G.; Janssens-Maenhout, G. Bottom-Up Estimates of Coal Mine Methane Emissions in China: A Gridded Inventory, Emission Factors, and Trends. Environ. Sci. Technol. Lett. 2019, 6, 473–478. [Google Scholar] [CrossRef]
- Gao, J.; Guan, C.; Zhang, B. China’s CH4 Emissions from Coal Mining: A Review of Current Bottom-up Inventories. Sci. Total Environ. 2020, 725, 138295. [Google Scholar] [CrossRef] [PubMed]
- Scarpelli, T.R.; Jacob, D.J.; Grossman, S.; Lu, X.; Qu, Z.; Sulprizio, M.P.; Zhang, Y.; Reuland, F.; Gordon, D.; Worden, J.R. Updated Global Fuel Exploitation Inventory (GFEI) for Methane Emissions from the Oil, Gas, and Coal Sectors: Evaluation with Inversions of Atmospheric Methane Observations. Atmos. Chem. Phys. 2022, 22, 3235–3249. [Google Scholar] [CrossRef]
- Crippa, M.; Guizzardi, D.; Pagani, F.; Schiavina, M.; Melchiorri, M.; Pisoni, E.; Graziosi, F.; Muntean, M.; Maes, J.; Dijkstra, L.; et al. Insights into the Spatial Distribution of Global, National, and Subnational Greenhouse Gas Emissions in the Emissions Database for Global Atmospheric Research (EDGAR v8.0). Earth System Sci. Data 2024, 16, 2811–2830. [Google Scholar] [CrossRef]
- Ju, Y.; Sun, Y.; Sa, Z.; Pan, J.; Wang, J.; Hou, Q.; Li, Q.; Yan, Z.; Liu, J. A New Approach to Estimate Fugitive Methane Emissions from Coal Mining in China. Sci. Total Environ. 2016, 543, 514–523. [Google Scholar] [CrossRef]
- Plant, G.; Kort, E.A.; Brandt, A.R.; Chen, Y.; Fordice, G.; Gorchov Negron, A.M.; Schwietzke, S.; Smith, M.; Zavala-Araiza, D. Inefficient and Unlit Natural Gas Flares Both Emit Large Quantities of Methane. Science 2022, 377, 1566–1571. [Google Scholar] [CrossRef]
- Schuit, B.J.; Maasakkers, J.D.; Bijl, P.; Mahapatra, G.; Van Den Berg, A.-W.; Pandey, S.; Lorente, A.; Borsdorff, T.; Houweling, S.; Varon, D.J.; et al. Automated Detection and Monitoring of Methane Super-Emitters Using Satellite Data. Atmos. Chem. Phys. 2023, 23, 9071–9098. [Google Scholar] [CrossRef]
- Shen, L.; Gautam, R.; Omara, M.; Zavala-Araiza, D.; Maasakkers, J.D.; Scarpelli, T.R.; Lorente, A.; Lyon, D.; Sheng, J.; Varon, D.J.; et al. Satellite Quantification of Oil and Natural Gas Methane Emissions in the US and Canada Including Contributions from Individual Basins. Atmos. Chem. Phys. 2022, 22, 11203–11215. [Google Scholar] [CrossRef]
- Zhang, Y.; Gautam, R.; Pandey, S.; Omara, M.; Maasakkers, J.D.; Sadavarte, P.; Lyon, D.; Nesser, H.; Sulprizio, M.P.; Varon, D.J.; et al. Quantifying Methane Emissions from the Largest Oil-Producing Basin in the United States from Space. Sci. Adv. 2020, 6, eaaz5120. [Google Scholar] [CrossRef]
- Jacob, D.J.; Turner, A.J.; Maasakkers, J.D.; Sheng, J.; Sun, K.; Liu, X.; Chance, K.; Aben, I.; McKeever, J.; Frankenberg, C. Satellite Observations of Atmospheric Methane and Their Value for Quantifying Methane Emissions. Atmos. Chem. Phys. 2016, 16, 14371–14396. [Google Scholar] [CrossRef]
- Borchardt, J.; Harris, S.J.; Hacker, J.M.; Lunt, M.; Krautwurst, S.; Bai, M.; Bösch, H.; Bovensmann, H.; Burrows, J.P.; Chakravarty, S.; et al. Insights into Elevated Methane Emissions from an Australian Open-Cut Coal Mine Using Two Independent Airborne Techniques. Environ. Sci. Technol. Lett. 2025, 12, 397–404. [Google Scholar] [CrossRef]
- Qin, K.; Hu, W.; He, Q.; Lu, F.; Cohen, J.B. Individual Coal Mine Methane Emissions Constrained by Eddy Covariance Measurements: Low Bias and Missing Sources. Atmos. Chem. Phys. 2024, 24, 3009–3028. [Google Scholar] [CrossRef]
- Lu, F.; Qin, K.; Cohen, J.B.; He, Q.; Tiwari, P.; Hu, W.; Ye, C.; Shan, Y.; Xu, Q.; Wang, S.; et al. Surface-Observation-Constrained High-Frequency Coal Mine Methane Emissions in Shanxi, China, Reveal More Emissions than Inventories, Consistent with Satellite Inversion. Atmos. Chem. Phys. 2025, 25, 5837–5856. [Google Scholar] [CrossRef]
- Houweling, S.; Bergamaschi, P.; Chevallier, F.; Heimann, M.; Kaminski, T.; Krol, M.; Michalak, A.M.; Patra, P. Global Inverse Modeling of CH4 Sources and Sinks: An Overview of Methods. Atmos. Chem. Phys. 2017, 17, 235–256. [Google Scholar] [CrossRef]
- Chauhan, A.; Raval, S. Satellite-Derived Approaches for Coal Mine Methane Estimation: A Review. Remote Sens. 2025, 17, 3652. [Google Scholar] [CrossRef]
- Sadavarte, P.; Pandey, S.; Maasakkers, J.D.; Lorente, A.; Borsdorff, T.; Denier Van Der Gon, H.; Houweling, S.; Aben, I. Methane Emissions from Superemitting Coal Mines in Australia Quantified Using TROPOMI Satellite Observations. Environ. Sci. Technol. 2021, 55, 16573–16580. [Google Scholar] [CrossRef]
- Hu, W.; Qin, K.; Lu, F.; Li, D.; Cohen, J.B. Merging TROPOMI and Eddy Covariance Observations to Quantify 5-Years of Daily CH4 Emissions over Coal-Mine Dominated Region. Int. J. Coal Sci. Technol. 2024, 11, 56. [Google Scholar] [CrossRef]
- Buchwitz, M.; Schneising, O.; Reuter, M.; Heymann, J.; Krautwurst, S.; Bovensmann, H.; Burrows, J.P.; Boesch, H.; Parker, R.J.; Somkuti, P.; et al. Satellite-Derived Methane Hotspot Emission Estimates Using a Fast Data-Driven Method. Atmos. Chem. Phys. 2017, 17, 5751–5774. [Google Scholar] [CrossRef]
- Turner, A.J.; Jacob, D.J.; Wecht, K.J.; Maasakkers, J.D.; Lundgren, E.; Andrews, A.E.; Biraud, S.C.; Boesch, H.; Bowman, K.W.; Deutscher, N.M.; et al. Estimating Global and North American Methane Emissions with High Spatial Resolution Using GOSAT Satellite Data. Atmos. Chem. Phys. 2015, 15, 7049–7069. [Google Scholar] [CrossRef]
- De Gouw, J.A.; Veefkind, J.P.; Roosenbrand, E.; Dix, B.; Lin, J.C.; Landgraf, J.; Levelt, P.F. Daily Satellite Observations of Methane from Oil and Gas Production Regions in the United States. Sci. Rep. 2020, 10, 1379. [Google Scholar] [CrossRef] [PubMed]
- Cusworth, D.H.; Jacob, D.J.; Sheng, J.-X.; Benmergui, J.; Turner, A.J.; Brandman, J.; White, L.; Randles, C.A. Detecting High-Emitting Methane Sources in Oil/Gas Fields Using Satellite Observations. Atmos. Chem. Phys. 2018, 18, 16885–16896. [Google Scholar] [CrossRef]
- Varon, D.J.; McKeever, J.; Jervis, D.; Maasakkers, J.D.; Pandey, S.; Houweling, S.; Aben, I.; Scarpelli, T.; Jacob, D.J. Satellite Discovery of Anomalously Large Methane Point Sources from Oil/Gas Production. Geophys. Res. Lett. 2019, 46, 13507–13516. [Google Scholar] [CrossRef]
- Pandey, S.; Gautam, R.; Houweling, S.; Van Der Gon, H.D.; Sadavarte, P.; Borsdorff, T.; Hasekamp, O.; Landgraf, J.; Tol, P.; Van Kempen, T.; et al. Satellite Observations Reveal Extreme Methane Leakage from a Natural Gas Well Blowout. Proc. Natl. Acad. Sci. USA 2019, 116, 26376–26381. [Google Scholar] [CrossRef]
- Hu, H.; Landgraf, J.; Detmers, R.; Borsdorff, T.; Aan De Brugh, J.; Aben, I.; Butz, A.; Hasekamp, O. Toward Global Mapping of Methane with TROPOMI: First Results and Intersatellite Comparison to GOSAT. Geophys. Res. Lett. 2018, 45, 3682–3689. [Google Scholar] [CrossRef]
- Tu, Q.; Hase, F.; Qin, K.; Cohen, J.B.; Khosrawi, F.; Zou, X.; Schneider, M.; Lu, F. Quantifying CH4 Emissions from Coal Mine Aggregation Areas in Shanxi, China, Using TROPOMI Observations and the Wind-Assigned Anomaly Method. Atmos. Chem. Phys. 2024, 24, 4875–4894. [Google Scholar] [CrossRef]
- Liu, Y.-N.; Zhang, J.; Zhang, Y.; Sun, W.-W.; Jiao, L.-L.; Sun, D.-X.; Hu, X.-N.; Ye, X.; Li, Y.-D.; Liu, S.-F.; et al. The Advanced Hyperspectral Imager: Aboard China’s GaoFen-5 Satellite. IEEE Geosci. Remote Sens. Mag. 2019, 7, 23–32. [Google Scholar] [CrossRef]
- He, Z.; Gao, L.; Liang, M.; Zeng, Z.-C. A Survey of Methane Point Source Emissions from Coal Mines in Shanxi Province of China Using AHSI on Board Gaofen-5B. Atmos. Meas. Tech. 2024, 17, 2937–2956. [Google Scholar] [CrossRef]
- Kang, H.; Qin, K.; Lu, F.; Hu, W.; Xu, Q.; Jason, B.C. Emission Characteristics of Methane Point Sources at Coal Mines in Shanxi Province Based on Gaofen-5 Satellite. J. China Coal Soc. 2024, 49, 3960–3968. [Google Scholar] [CrossRef]
- Kang, H. Detection and Quantification of Methane Plume Emissions in Shanxi Province’s Coal Industry Based on GF-5 Satellite. Master’s Thesis, China University of Mining and Technology, Xuzhou, China, 2024. [Google Scholar]
- TROPOMI on the ESA Sentinel-5 Precursor: A GMES Mission for Global Observations of the Atmospheric Composition for Climate, Air Quality and Ozone Layer Applications. Remote Sens. Environ. 2012, 120, 70–83. [CrossRef]
- Lorente, A.; Borsdorff, T.; Butz, A.; Hasekamp, O.; Aan De Brugh, J.; Schneider, A.; Wu, L.; Hase, F.; Kivi, R.; Wunch, D.; et al. Methane Retrieved from TROPOMI: Improvement of the Data Product and Validation of the First 2 Years of Measurements. Atmos. Meas. Tech. 2021, 14, 665–684. [Google Scholar] [CrossRef]
- Hu, H.; Hasekamp, O.; Butz, A.; Galli, A.; Landgraf, J.; Aan De Brugh, J.; Borsdorff, T.; Scheepmaker, R.; Aben, I. The Operational Methane Retrieval Algorithm for TROPOMI. Atmos. Meas. Tech. 2016, 9, 5423–5440. [Google Scholar] [CrossRef]
- Wang, S.; Cohen, J.B.; Guan, L.; Lu, L.; Tiwari, P.; Qin, K. Observationally Constrained Global NOx and CO Emissions Variability Reveals Sources Which Contribute Significantly to CO2 Emissions. npj Clim. Atmos. Sci. 2025, 8, 87. [Google Scholar] [CrossRef]
- Pandey, S.; Van Nistelrooij, M.; Maasakkers, J.D.; Sutar, P.; Houweling, S.; Varon, D.J.; Tol, P.; Gains, D.; Worden, J.; Aben, I. Daily Detection and Quantification of Methane Leaks Using Sentinel-3: A Tiered Satellite Observation Approach with Sentinel-2 and Sentinel-5p. Remote Sens. Environ. 2023, 296, 113716. [Google Scholar] [CrossRef]
- Varon, D.J.; Jacob, D.J.; Jervis, D.; McKeever, J. Quantifying Time-Averaged Methane Emissions from Individual Coal Mine Vents with GHGSat-D Satellite Observations. Environ. Sci. Technol. 2020, 54, 10246–10253. [Google Scholar] [CrossRef]
- Sibiya, S.S.; Mhangara, P.; Shikwambana, L. Seasonal and Trend Variation of Methane Concentration over Two Provinces of South Africa Using Sentinel-5p Data. Environ. Monit. Assess. 2024, 196, 713. [Google Scholar] [CrossRef] [PubMed]


Disclaimer/Publisher’s Note: The statements, opinions and data contained in all publications are solely those of the individual author(s) and contributor(s) and not of MDPI and/or the editor(s). MDPI and/or the editor(s) disclaim responsibility for any injury to people or property resulting from any ideas, methods, instructions or products referred to in the content. |
© 2026 by the authors. Licensee MDPI, Basel, Switzerland. This article is an open access article distributed under the terms and conditions of the Creative Commons Attribution (CC BY) license.