


Highlights
What are the main findings?
- DOM+nDSM fusion improved building extraction by combining height constraints with complementary texture and boundary information.
- ACM-PSPNet achieved 87.81% mean IoU and 79.78% mean Boundary F1, with substantially reduced under-segmentation.
What are the implications of the main findings?
- Height information provides strong structural constraints for distinguishing buildings from complex urban backgrounds.
- ACM-PSPNet is better suited to accuracy-oriented offline mapping than lightweight real-time inference.
Abstract
Building footprint extraction in high-density urban areas remains difficult because spectral confusion and shadows obscure building–background differences, while dense adjacency and complex boundaries hinder boundary recovery and adjacent-building separation. To address these issues, this study combines Digital Orthophoto Maps (DOM) and normalized Digital Surface Models (nDSM) and develops ACM-PSPNet for high-density built-up areas of Hong Kong. ACM-PSPNet extends the PSPNet baseline by integrating atrous spatial pyramid pooling and convolutional block attention for high-level contextual enhancement and feature recalibration, together with an MS-Fuse decoder for progressive multilevel spatial-detail recovery. The main experiments were independently repeated three times and evaluated on a spatially independent test set. In the input-source comparison, DOM+nDSM yielded a mean IoU of 84.94%, compared with 68.23% for DOM and 83.23% for nDSM alone. Using DOM+nDSM as the common input, the model comparison showed that ACM-PSPNet provided the highest performance among the eight evaluated models, with mean IoU, F1 Score, and Boundary F1 values of 87.81%, 93.13%, and 79.78%, respectively. In selected typical scenes, the under-segmentation proportion decreased from 35.7% for PSPNet to 5.0% for ACM-PSPNet. The results support ACM-PSPNet as an accuracy-oriented framework for dense urban building mapping, particularly where reliable boundary recovery and adjacent-building separation are required, although broader cross-city and cross-sensor validation remains necessary.
1. Introduction
Building footprints provide fundamental information on the spatial locations, planar geometries, and distribution patterns of artificial structures. They are widely used in urban base mapping, land monitoring, urban renewal, disaster assessment, and three-dimensional city modeling. Li et al. [1] systematically reviewed remote sensing-based building information extraction and showed that related research has expanded from building region identification to footprint generation, roof structure interpretation, height retrieval, type recognition, and change detection. Dabove et al. [2] further indicated that footprint completeness and positional accuracy directly affect the reliability of urban map updating, building change detection, and three-dimensional reconstruction. Papini et al. [3] developed a dataset containing building footprints and heights for Chinese cities, demonstrating that the joint description of horizontal extent and vertical structure provides a more complete basis for analyzing urban morphology and building stock. However, in urban areas with high building density, buildings are closely spaced and vary considerably in scale and roof material. The imagery is also frequently affected by shadows, vegetation, and spectral confusion with roads and impervious surfaces. Accurate boundary recovery and separation of adjacent buildings therefore remain challenging. Accordingly, this study combines DOM and nDSM and develops ACM-PSPNet to coordinate multiscale contextual aggregation, feature recalibration, and progressive spatial-detail recovery for improved boundary recovery and adjacent-building separation.
With the development of high-resolution remote sensing imagery and deep learning, building extraction has gradually shifted from manually designed features to data-driven methods. Existing semantic segmentation models can automatically learn building texture, shape, and contextual information. However, these models mainly optimize region classification and overlap accuracy. In densely built areas containing connected podiums, annexes, or narrow spaces between buildings, they may still merge multiple buildings into a continuous object, resulting in blurred boundaries and under-segmentation. Recent studies have therefore increasingly focused on the coordinated optimization of building body integrity, boundary localization, and adjacent-object separation.
To address the loss of edge information caused by downsampling, Guo et al. proposed CBR-Net [4], which progressively restores spatial details through coarse to fine boundary refinement. Zhou et al. developed BOMSC-Net [5] by combining multiscale context awareness with directional feature optimization to repair boundary interruptions caused by shadows and occlusion. Li et al. proposed HD-Net [6], which decouples building body and boundary features under deep supervision and then reorganizes them to coordinate body continuity and boundary accuracy. Cao et al. developed BEMRF-Net [7], which uses boundary aware self-attention and multiscale refinement fusion to strengthen responses in complex boundary regions. Han et al. proposed EUNet [8], which introduces an edge branch to enhance building edges in Gaofen-7 imagery. These studies demonstrate that explicit boundary modeling can improve footprint localization, although building body integrity and local fragmentation must still be balanced.
For multiscale refinement and object constraints, Sheng et al. proposed ME-FCN [9], which strengthens relationships among buildings of different scales through multiscale feature extraction and adaptive optimization. Zhu et al. developed AP-PointRend [10], which adjusts subdivision points and refinement iterations according to building scale to refine the boundaries of large and irregular buildings. Yuan et al. proposed FDENet [11], which uses a frequency guided dual encoder to preserve overall building shapes and high frequency edge information. Du et al. developed SCShaping [12], which directly generates regularized vector building contours through graph convolution. Ma et al. [13] used objects and boundaries generated by SAM as additional constraints, whereas Wu et al. [14] employed mutual information-constrained multitask learning to jointly optimize building regions and auxiliary structural information. These approaches further demonstrate that multiscale, frequency, object, and geometric constraints can improve building footprint quality.
Global relationship modeling and lightweight architectures have also been introduced into building extraction. Yuan et al. proposed LiteST-Net [15], which performs multilevel fusion between a lightweight Swin Transformer and convolutional features. OuYang and Li developed BuildNext-Net [16], which uses multiscale self-attention to extract semantic relationships across spatial regions. Wang et al. proposed SDSNet [17], which enhances building details through cross-layer feature interaction and filtering. Zhang et al. developed OCANet [18], which combines overcomplete convolutional attention with multibranch fusion to improve the extraction of small and densely distributed buildings. Yang et al. proposed CSA-Net [19], which introduces hierarchical context and global local interaction for complex backgrounds. Yilmaz and Kavzoglu developed DeepSwinLite [20], which maintains multiscale building representation while controlling the number of parameters and computational cost. These studies indicate that coordinated modeling of local details and global context is an important direction for building extraction in complex urban scenes.
Multi-source remote sensing data fusion provides another approach to reducing spectral confusion. DOM data describe roof color, texture, and local edges, although roads, car parks, and other impervious surfaces may exhibit similar spectral responses. DSM or nDSM data provide complementary information on building height relative to the ground and volumetric structure. Hosseinpour et al. proposed CMGFNet [21], which uses dual encoders to extract RGB and DSM features and applies cross-modal gating to control information transfer. Luo et al. developed a multimodal feature fusion network [22] that uses self-attention to facilitate interactions between high-resolution optical imagery and LiDAR features. Chen et al. proposed DFF-Net [23] and found that targeted feature-level depth fusion was more effective than directly appending depth information. Gao et al. developed MMRAD-Net [24] by combining DSM data, graph-based structural modeling, and multiscale residual attention. Wang et al. proposed LMFNet [25], which processes multispectral imagery and DSM data through a weight-sharing multibranch architecture and self-attention fusion. These studies show that elevation information provides stable geometric information, although fusion performance still depends on registration accuracy, modality selection, and coordination across scales.
In addition to network architecture, training data and regional differences affect the stability of building extraction. Zhu et al. proposed SKTrans [26], which uses self-supervised knowledge transfer for building mapping across cities and spatial scales. Luo et al. developed the WHU-Mix building dataset [27] and demonstrated that dataset diversity and annotation quality substantially affect cross-region generalization. Neupane et al. [28] applied fine tuning-based transfer learning to address label displacement in off-nadir imagery, showing the importance of high-quality target domain samples and label consistency for model adaptation. High accuracy within a single study area should therefore be evaluated cautiously in relation to cross-region differences, sensor characteristics, and annotation quality.
Despite these advances, three interconnected problems remain in building footprint extraction from areas with high building density. First, DOM data alone are vulnerable to shadows and spectral confusion with artificial surfaces, whereas nDSM data alone cannot fully describe roof textures and narrow spaces between buildings. Second, many methods mainly optimize regional overlap and do not directly constrain whether adjacent buildings remain independent. Third, boundary enhancement can help recover spaces between buildings but may also cause local over-segmentation. Recent building-extraction studies have improved boundary quality through explicit boundary refinement or body and boundary decomposition [4,6], while other approaches have introduced attention mechanisms or auxiliary edge information [7,8]. However, among the reviewed recent methods, the simultaneous coordination of multiscale contextual aggregation, attention-based feature recalibration, and progressive multilevel spatial-detail recovery remains relatively limited, particularly for reducing adjacent-building adhesion in high-density urban scenes. A coordinated framework is therefore needed to integrate optical texture and height geometry while balancing contextual representation, background suppression, boundary recovery, and adjacent-building separation.
To address these issues, this study focuses on a high-density built-up area in Hong Kong, China, integrates DOM texture information with nDSM height information, and develops ACM-PSPNet on the basis of PSPNet. The study aims to improve building body recognition, boundary recovery, and adjacent-building separation under complex urban backgrounds, to examine the effects of multi-source information fusion and multiscale feature enhancement on building footprint extraction, and to assess model applicability when height information is unavailable.
2. Materials and Methods
2.1. Study Area
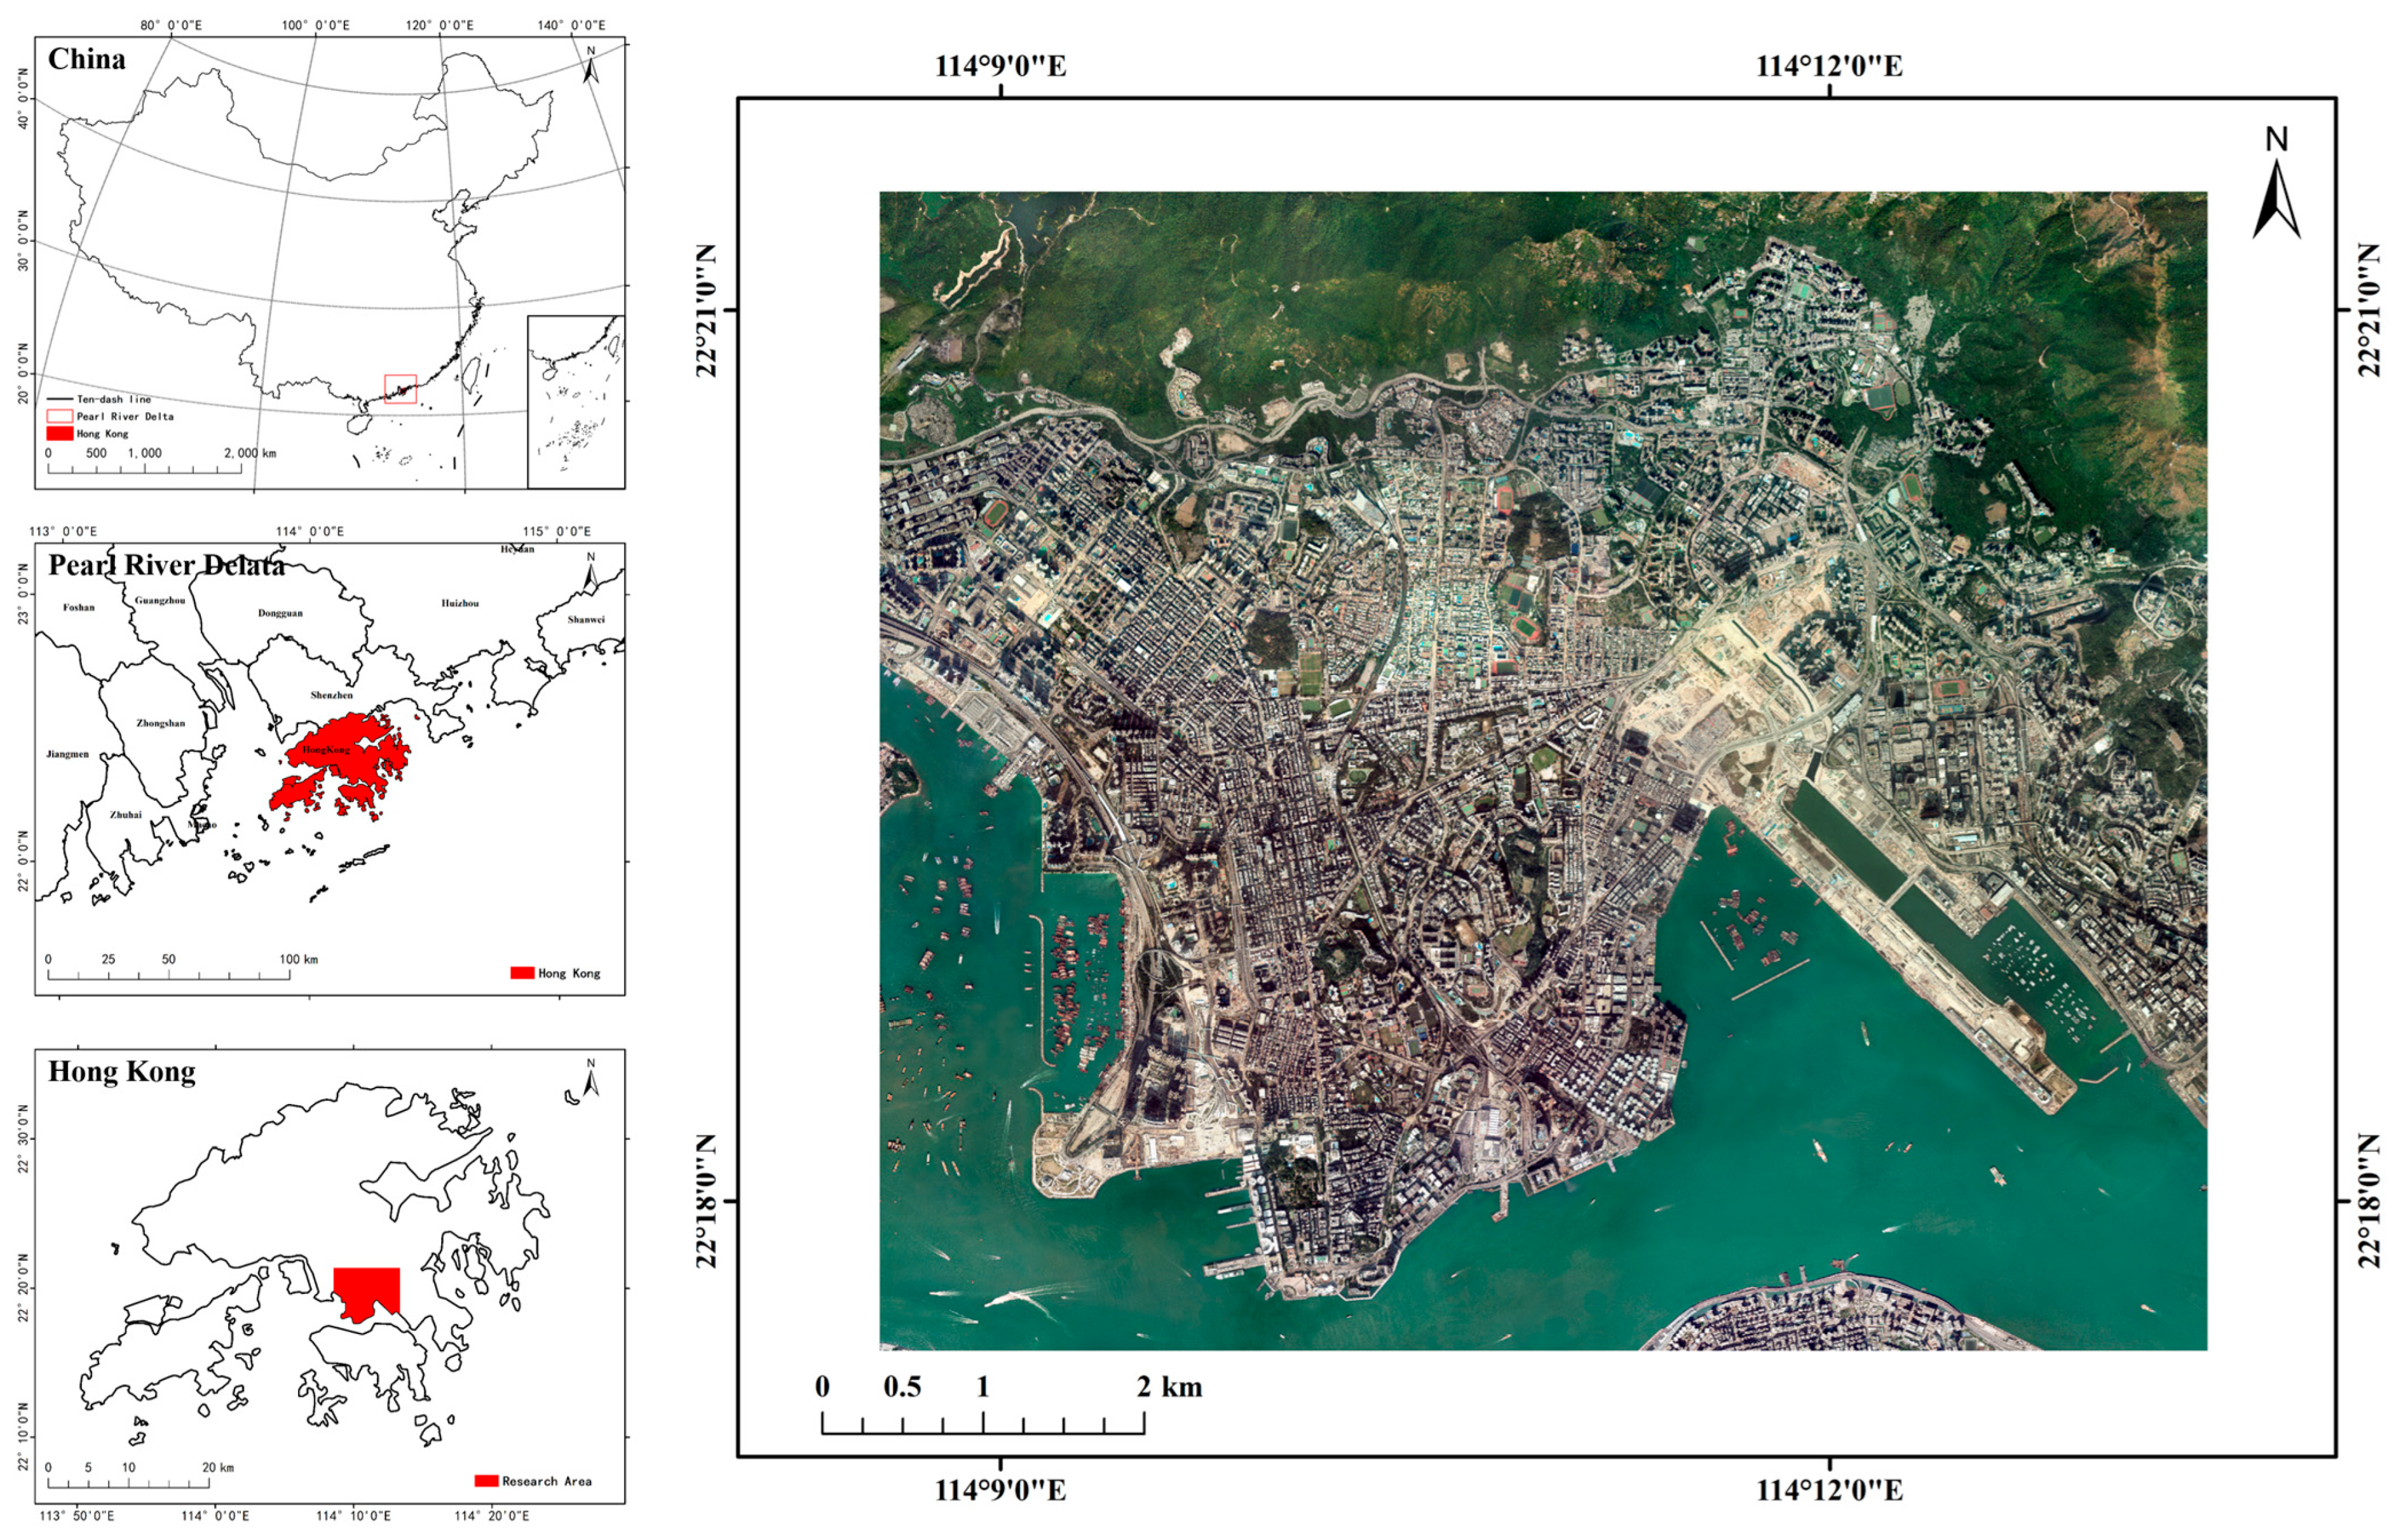
The model-development area is located in the core built-up area along the northern shore of Victoria Harbour in Kowloon, Hong Kong, China, extending approximately from 114°09′E to 114°12′E and from 22°18′N to 22°21′N. Influenced by mountainous terrain, the waterfront, and intensive urban development, the area is characterized by a compact spatial structure and high building density. A spatially separated area on Hong Kong Island was selected as the independent test region. The Kowloon area was used for model training and validation, whereas the Hong Kong Island area was used exclusively for final performance evaluation.
The model-development area contains waterfront high-rise commercial complexes, extensive high-rise residential developments, and mixed low- and mid-rise neighborhoods on sloping terrain. These areas differ considerably in building height, roof form, shadow occlusion, spacing between adjacent buildings, and background complexity. Complex spatial relationships, including connected podiums, attached annexes, and elevated corridors, are also widely present. The study area therefore provides representative experimental scenes for evaluating building body recognition, boundary recovery, and adjacent-building separation under different building scales and spatial configurations.
Figure 1.
Location map of the Kowloon model-development area.
2.2. Data Acquisition and Preprocessing
This study adopts Digital Orthophoto Map (DOM) and normalized Digital Surface Model (nDSM) as input datasets. The DOM is derived from Hong Kong’s True Digital Orthophoto (TDOP) with an original spatial resolution of 0.25 m. The nDSM is generated by subtracting the Digital Terrain Model (DTM) from the Digital Surface Model (DSM) derived from airborne LiDAR scanning data covering Hong Kong. After mosaicking, clipping and invalid value filtering, the DOM is resampled to a 0.5 m resolution. Spatial unification, co-registration and pixel grid alignment are performed on the DOM, nDSM and building labels.
Building outlines from OpenStreetMap (OSM) vector data are used as the initial reference for building labels. The co-registered DOM, nDSM, and OSM building vectors are loaded simultaneously in ArcGIS 10.8 for subsequent manual inspection and editing. Combined with roof textures and edges visible in the DOM and elevation variations captured by the nDSM, manual inspection and editing are implemented to rectify missing, offset or inaccurate building outlines. Upon completion of vector editing, the building vector layer is converted into a binary raster label consistent with the DOM and nDSM in spatial extent, resolution and pixel grid coordinates. Pixels corresponding to buildings are assigned a value of 1, while background pixels are assigned a value of 0. The original OSM vectors were not assumed to be perfectly contemporaneous with the DOM and nDSM, and potential temporal discrepancies were addressed during manual inspection and correction using the co-registered DOM and nDSM as references. No independent field-survey-based accuracy assessment or formal inter-annotator agreement analysis was available for the reference labels; therefore, residual uncertainty may remain in locally ambiguous building boundaries.
Following a standardized clipping workflow, the DOM, nDSM and binary labels are segmented into non-overlapping image tiles sized 256 × 256 pixels, yielding a total of 1800 sample groups. The Kowloon Model Development Zone contributes 1620 samples, which are randomly split into a training set and a validation set at an 8:1 ratio using a fixed random seed of 42, corresponding to 1440 and 180 samples, respectively. The spatially separated Hong Kong Island region provides an independent test set consisting of 180 samples, which is excluded from model training, hyperparameter tuning and weight selection. Identical dataset partitioning is applied across all input comparison experiments, model comparison experiments and ablation studies to mitigate the risk of overestimated accuracy induced by spatial autocorrelation. Table 1 summarizes the primary data sources and preprocessing workflow.
Table 1.
Multi-source data acquisition and preprocessing.
2.3. Multi-Source Data Fusion Strategy and Selection of the Baseline Network Architecture
2.3.1. Multi-Source Data Fusion Strategy
To analyze the effects of different data sources on building footprint extraction, three input configurations were constructed: DOM only, nDSM only, and DOM+nDSM fusion. The DOM consisted of red, green, and blue channels and mainly provided information on roof color, texture, and edges. The nDSM was a single channel dataset that mainly described building height relative to the local terrain and geometric structure. Previous studies have demonstrated the complementarity between optical imagery and DSM or LiDAR data for building extraction [21,22,25]. Therefore, the DOM and nDSM were concatenated at the input level to form a four-channel fusion input that integrated planar texture and vertical geometric information.
For the three input configurations, only the number of channels in the first network layer was adjusted, whereas the remaining network architecture, training parameters, and weight selection criteria were kept unchanged. All experiments used the training and validation sets from the model-development area in Kowloon and were finally evaluated on the spatially independent test set on Hong Kong Island to ensure comparability among the different input configurations.
2.3.2. Selection of the Baseline Network Architecture
Seven representative segmentation architectures were included in the comparative evaluation: DeepLabV3+ [29], SegNet [30], U-Net [31], PSPNet [32], CNN–Transformer, SegFormer [33], and EfficientSAM [34]. All models used the four-channel DOM+nDSM fusion input and the same dataset partition and training configuration. DeepLabV3+, SegNet, U-Net, and PSPNet respectively represented an encoder–decoder architecture based on atrous convolution, a pooling-index-based decoding architecture, a skip-connection architecture, and a pyramid contextual aggregation architecture. CNN–Transformer represented a hybrid architecture that combines local convolutional feature extraction with global contextual modeling using a Transformer branch. SegFormer and EfficientSAM further extended the comparison to a Transformer-based segmentation architecture and an efficient segmentation foundation model, respectively.
PSPNet was adopted as the base framework for ACM-PSPNet because its pyramid pooling structure provides explicit multiscale contextual aggregation and an appropriate architectural basis for further contextual enhancement, feature recalibration, and multiscale feature fusion in high-density urban scenes with substantial variations in building scale.
2.4. Construction of the ACM-PSPNet Model
2.4.1. Overall Model Architecture
To address dense building adjacency, shadow interference, complex boundaries, and substantial scale variations in high-density urban scenes, ACM-PSPNet was constructed using PSPNet [32] as the baseline framework by coordinating three complementary functions: multiscale contextual aggregation, attention-based feature recalibration, and progressive multilevel spatial-detail recovery. These functions are implemented by ASPP, CBAM, and the MS-Fuse decoder, respectively. ACM therefore refers to the integrated configuration of ASPP, CBAM, and MS-Fuse within PSPNet, rather than to a newly proposed basic network mechanism. Their coordinated configuration is intended to strengthen contextual representation and suppress confusing background responses while progressively recovering narrow gaps and local boundary details between adjacent buildings.
The model takes four-channel DOM+nDSM data as input. Hierarchical features are first extracted using a ResNet-50 backbone [35]. The high-level semantic features are subsequently enhanced by ASPP and CBAM, after which the MS-Fuse decoder progressively integrates high-level semantic features, middle-level structural features, and low-level detail features to restore spatial resolution and generate the building footprint prediction. The overall model architecture is shown in Figure 2.
Figure 2.
Architecture of ACM-PSPNet for building footprint extraction. Note: ACM-PSPNet consists of a ResNet-50 backbone, an ASPP multiscale context-enhancement module, a CBAM feature recalibration module, and an MS-Fuse multiscale fusion decoder.
Let the input image be denoted as
where the four channels correspond to the three visible-light channels of DOM and one height channel of nDSM.
The input data are fed into the ResNet-50 backbone network to extract multiscale features:
where , , , and represent feature maps output from different stages of the backbone network.
Subsequently, the high-level semantic feature is sequentially processed by the ASPP and CBAM modules to obtain the enhanced high-level feature. Finally, the enhanced high-level feature, middle-level features, and low-level features are fed into the MS-Fuse multiscale fusion decoder to progressively restore spatial resolution and output the building footprint prediction:
where denotes the final building footprint segmentation result.
2.4.2. ASPP Context-Enhancement Module
In high-density built-up areas, buildings exhibit substantial scale variations, and a single receptive field is insufficient to simultaneously represent small-scale building boundaries and large-scale building bodies. To enhance the multiscale contextual representation of high-level semantic features, ASPP [29] is applied after the output of the ResNet-50 backbone. The module consists of a 1 × 1 convolution branch, three 3 × 3 atrous convolution branches with dilation rates of 2, 4, and 6, and a global average pooling branch. Feature fusion is then performed through channel concatenation and a 1 × 1 convolution. The output channel number of ASPP is set to 256.
The output of ASPP can be expressed as
where denotes a 1 × 1 convolution mapping, denotes a 3 × 3 atrous convolution with dilation rate , GAP denotes global average pooling, Up denotes bilinear interpolation upsampling, denotes channel concatenation, and denotes the subsequent fusion mapping.
Dilation rates of [2, 4, 6] were adopted considering the 256 × 256 input patches and the relatively small high-level feature maps. Compared with the larger [6, 12, 18] configuration commonly used in DeepLab-based architectures, this compact configuration provides denser local- and intermediate-scale sampling and reduces sparse sampling and excessive boundary padding on limited feature maps, making it more suitable for capturing narrow gaps, local contours, and contextual relationships among densely distributed buildings.
2.4.3. CBAM Feature Recalibration Module
The high-level features enhanced by ASPP may still contain responses from background objects such as shadows, roads, and impervious surfaces. To strengthen building-related features and suppress background interference, CBAM [36] is applied after ASPP. CBAM sequentially recalibrates the features through channel attention and spatial attention. In this study, the reduction ratio of CBAM is set to 16.
Given an input feature , the channel attention module first generates channel weights and performs channel recalibration:
On this basis, the spatial attention module further generates spatial weights to obtain the final output feature:
where denotes element-wise multiplication.
Through channel and spatial recalibration, CBAM adjusts feature responses and emphasizes spatial regions associated with building bodies and boundaries.
2.4.4. MS-Fuse Multiscale Fusion Decoder
High-level semantic features provide strong category discrimination but gradually lose spatial details during encoding, whereas shallow features preserve richer spatial and boundary information but contain weaker semantic representations. Based on skip connections and multiscale feature fusion [31], a multiscale fusion decoding structure, denoted as MS-Fuse, is configured to progressively integrate high-level semantic features with middle-level structural features and low-level detail features. Such progressive fusion is intended to reduce cross-level feature differences while supplementing spatial details during decoding. Previous building-extraction studies have also shown the importance of combining semantic and boundary information for complex building contour recovery [6,7].
Let the high-level semantic feature, middle-level structural feature, and low-level detail feature be denoted as , , and , respectively. The two-stage fusion process of the MS-Fuse decoder is expressed as
where denotes the high-level feature mapping, denotes the middle-level feature mapping, denotes the fusion mapping, and denotes channel concatenation.
On this basis, the intermediate fused feature is upsampled to a higher spatial resolution and further fused with the low-level detail feature to supplement building edges, local corners, and spatial details in contact areas. This process can be expressed as
where denotes the upsampling operation, denotes the low-level feature mapping, and denotes the low-level fusion mapping.
Finally, the building footprint prediction is generated through the classification head:
where denotes the classification mapping function, and is the final segmentation result.
Through progressive feature fusion, high-level semantic information is retained for building-body discrimination, while middle- and low-level features supplement structural and local boundary details. This configuration provides a more complete feature representation for subsequent building footprint prediction in high-density urban scenes.
2.5. Loss Function and Evaluation Metrics
2.5.1. Loss Function
To mitigate the class imbalance between building and background pixels, a hybrid loss function combining BCEWithLogitsLoss and Dice Loss was adopted [37]. BCEWithLogitsLoss provides pixel-level classification supervision, whereas Dice Loss strengthens the overlap constraint between the predicted and reference building regions. The two loss terms are directly summed to form the total loss function, as shown in Table 2.
Table 2.
Formulas of the loss functions.
2.5.2. Accuracy Evaluation Metrics
To evaluate building footprint extraction performance, IoU, F1 Score, Recall, Accuracy, and Boundary F1 were used as the main evaluation metrics. IoU, F1 Score, Recall, and Accuracy quantify regional overlap, overall segmentation performance, building detection capability, and pixel-level classification accuracy, respectively [38]. Because this study additionally focuses on building boundary preservation and adjacent-building separation, Boundary F1 was used to evaluate boundary-matching quality [39].
The model output probability map was binarized using a fixed threshold of 0.5 to obtain the predicted building mask. TP, FP, TN, and FN denote true-positive, false-positive, true-negative, and false-negative pixels, respectively. The definitions of the evaluation metrics are provided in Table 3.
Table 3.
Accuracy evaluation metrics.
Boundary F1 was calculated from the spatial matching relationship between the predicted and ground-truth boundaries [39]. Boundary pixels were first extracted from the binary building masks using a morphological gradient. Specifically, the boundary of a binary mask was obtained through dilation and erosion operations:
where denotes the binary building mask, denotes the extracted boundary, and a 3 × 3 structuring element is used for the dilation and erosion operations.
A boundary-matching tolerance of 2 pixels () was used for the primary Boundary F1 evaluation. Given the spatial resolution of 0.5 m, this tolerance corresponds to 1.0 m on the ground. Let and denote the predicted and ground-truth boundaries, respectively, and let denote boundary dilation by τ pixels. A predicted boundary pixel was regarded as correctly matched when it fell within , and a ground-truth boundary pixel was regarded as matched when it fell within .
Based on this tolerance-based matching criterion, boundary precision , boundary recall , and Boundary F1 are defined as follows:
All models used the same binarization threshold, boundary extraction procedure, and boundary-matching tolerance to ensure comparability. To further assess the sensitivity of Boundary F1 to the matching tolerance, an additional robustness analysis was conducted using tolerance widths of 1, 2, 3, 4, and 5 pixels, and the corresponding results are reported in Section 3.2.
2.5.3. Error-Type Definition and Statistical Method
To characterize model failure modes in complex building areas, error types were determined from both pixel-level relationships and connected-component correspondence between the predicted masks and reference labels [40,41]. The predicted masks and reference labels were first binarized, and 8-neighborhood connected-component labeling was then applied to identify individual building objects. The resulting errors were classified into four categories: omission, commission, under-segmentation, and over-segmentation.
Omission refers to pixels for which GT = 1 and Pred = 0, whereas commission refers to pixels for which GT = 0 and Pred = 1. Under-segmentation occurs when one predicted connected component corresponds to two or more ground-truth building components, indicating that multiple adjacent buildings have been incorrectly merged. Over-segmentation occurs when one ground-truth building component corresponds to two or more predicted components, or when obvious holes or fragmented regions occur within a building. To avoid double counting, each error pixel was assigned to only one category.
The total error pixels consist of omission, commission, under-segmentation, and over-segmentation pixels:
The proportion of total error pixels is defined as
where denotes building-related pixels that are consistent between the prediction result and the reference label and are not assigned to under-segmentation or over-segmentation.
This statistical procedure focuses on building-related regions and excludes the large number of correctly classified background pixels from the denominator. This prevents the error proportions from being artificially diluted by the dominant background area.
2.6. Model Training Environment and Configuration
All experiments were conducted under the same hardware and software environment, as shown in Table 4. The input size of all models was set to 256 × 256 pixels. The DOM+nDSM input consisted of three DOM channels and one nDSM channel.
Table 4.
Training environment settings.
During training, the AdamW [42] optimizer was used with an initial learning rate of 0.0003 and a weight decay coefficient of 0.0001. The batch size was set to 8, and each model was trained for 150 epochs. A cosine annealing learning rate schedule [43] without warm restarts was adopted, with the minimum learning rate set to 0.000003, corresponding to 1% of the initial learning rate. No data augmentation was applied during training.
To account for run-to-run variability, each configuration in the input-data comparison, model comparison, and ablation experiments was independently trained three times using random seeds of 42, 0, and 2026. The same dataset partition, training parameters, and model-selection criterion were used for all three runs. For each run, the model with the highest validation-set IoU was saved for final evaluation.
The spatially independent Hong Kong Island test set was used exclusively for final performance evaluation and was not involved in model training, hyperparameter tuning, or model selection. Unless otherwise stated, the quantitative results of the repeated experiments are reported as the mean ± sample standard deviation across the three independent runs.
3. Results
Unless otherwise stated, all quantitative accuracy results were calculated on the spatially independent Hong Kong Island test set. The validation set was used only for model selection and optimal checkpoint saving and was not involved in the final accuracy statistics. For experiments with repeated runs, the reported values represent the mean ± sample standard deviation across three independent runs.
3.1. Comparison of Building Footprint Extraction Results Using Different Input Data
Using PSPNet as the fixed network architecture, the building footprint extraction performance of DOM, nDSM, and DOM+nDSM inputs was compared under the same dataset partition and training configuration. Each input configuration was independently trained three times, and the results are reported as the mean ± sample standard deviation in Table 5. Overall, DOM+nDSM provided the highest mean performance across all five evaluation metrics.
Table 5.
Comparison of building footprint extraction accuracy using different input data.
The mean IoU increased from 68.23% ± 0.30% for DOM alone to 83.23% ± 0.56% for nDSM alone and 84.94% ± 0.29% for DOM+nDSM, corresponding to improvements of 16.71 and 1.71 percentage points for the fused input relative to DOM and nDSM, respectively. The substantially higher IoU obtained with nDSM indicates that height information provides stronger structural constraints for distinguishing buildings from complex urban backgrounds than optical information alone. The contribution of DOM was more pronounced in the boundary-based evaluation: Boundary F1 increased from 62.91% ± 2.02% for nDSM alone to 66.47% ± 4.01% for DOM+nDSM, corresponding to an increase of 3.56 percentage points in the mean value. This result indicates that although the incremental improvement in regional overlap over nDSM alone was moderate, DOM provided complementary texture and visible-edge information that contributed to boundary matching and the separation of adjacent buildings. This pattern is consistent with previous multimodal building-extraction studies showing that optical and elevation information can provide complementary representations [21,25]. Therefore, DOM+nDSM was adopted as the standard input for the subsequent model comparison and ablation experiments.
3.2. Building Footprint Extraction Results of Different Models
To evaluate ACM-PSPNet against different segmentation architectures, comparative experiments were conducted using EfficientSAM [34], SegNet [30], DeepLabV3+ [29], SegFormer [33], U-Net [31], CNN–Transformer, PSPNet [32], and ACM-PSPNet under the same DOM+nDSM input, dataset partition, training configuration, and evaluation procedure. Each model was independently trained three times using the same training configuration. As shown in Table 6 and Figure 3, ACM-PSPNet provided the highest mean performance across all five metrics: IoU 87.81% ± 0.11%, F1 Score 93.13% ± 0.65%, Recall 93.82% ± 0.50%, Accuracy 95.51% ± 0.46%, and Boundary F1 79.78% ± 0.73%.
Table 6.
Comparison of building footprint extraction accuracy among different models.
Figure 3.
Comparison of building footprint extraction accuracy among different models. Error bars indicate ±1 standard deviation across three independent runs.
Compared with PSPNet, ACM-PSPNet increased the mean IoU, F1 Score, Recall, and Accuracy by 2.87, 0.94, 1.29, and 1.07 percentage points, respectively. The improvement was more pronounced for Boundary F1, which increased from 66.47% ± 4.01% for PSPNet to 79.78% ± 0.73% for ACM-PSPNet, corresponding to an increase of 13.31 percentage points in the mean value. Among the other comparison models, CNN–Transformer had the second-highest mean Boundary F1 of 78.19% ± 6.58%, 1.59 percentage points below ACM-PSPNet. These results show that the accuracy improvement of ACM-PSPNet is reflected in both regional segmentation metrics and boundary-matching performance.
To further assess the sensitivity of Boundary F1 to the matching tolerance, Boundary F1 was recalculated for all eight evaluated models using tolerance widths of one, two, three, four, and five pixels, corresponding to ground distances of 0.5, 1.0, 1.5, 2.0, and 2.5 m, respectively. The same prediction masks from the three independent runs were used without model retraining. Although the absolute Boundary F1 values generally increased as the tolerance was relaxed, ACM-PSPNet retained the highest mean Boundary F1 at every tested tolerance, with values of 75.47%, 79.78%, 85.26%, 89.45%, and 91.06%, respectively. These results indicate that the boundary-performance advantage of ACM-PSPNet was not dependent on the specific two-pixel tolerance adopted for the primary evaluation. The complete multi-model Boundary F1 results across all five matching tolerances are provided in Supplementary Table S2.
Model complexity and inference efficiency were further evaluated using the number of parameters, model size, FLOPs, single-image inference time, FPS, and inference memory usage, as summarized in Table 7. ACM-PSPNet contains 44.30 M parameters and has a model size of 169.35 MB, both lower than those of PSPNet and DeepLabV3+. However, ACM-PSPNet requires 238.62 G FLOPs, 83.62 ms per image, and 566.18 MB of inference memory, while its inference speed is 11.96 FPS.
Table 7.
Comparison of model complexity, inference efficiency, and extraction accuracy among different models.
Compared with the other models, ACM-PSPNet achieved the highest mean IoU and Boundary F1 but also exhibited the highest computational cost in terms of FLOPs, inference time, and inference memory usage. In contrast, SegFormer and EfficientSAM required substantially fewer parameters and FLOPs. These results indicate a clear trade-off between extraction accuracy and computational efficiency among the evaluated models.
3.3. Ablation Experiment of ACM-PSPNet Modules
To evaluate the contributions of ASPP [29], CBAM [36], and MS-Fuse to building footprint extraction, ablation experiments were conducted using PSPNet [32] as the baseline under the same DOM+nDSM input, dataset partition, and training configuration. Each configuration was independently trained three times. As shown in Table 8 and Figure 4, the baseline PSPNet achieved an IoU of 84.94% ± 0.29%, F1 Score of 92.19% ± 0.66%, Recall of 92.53% ± 0.93%, Accuracy of 94.44% ± 0.55%, and Boundary F1 of 66.47% ± 4.01%.
Table 8.
Ablation results of ACM-PSPNet under different module combinations.
Figure 4.
Accuracy comparison of different module configurations in the ablation experiments. Error bars indicate ±1 standard deviation across three independent runs.
When CBAM, ASPP, and MS-Fuse were individually incorporated into PSPNet, the mean IoU values increased to 85.80% ± 0.10%, 85.80% ± 0.16%, and 85.31% ± 0.03%, respectively. Correspondingly, Boundary F1 increased from 66.47% ± 4.01% for PSPNet to 73.99% ± 0.72%, 72.40% ± 1.58%, and 72.42% ± 0.95%, representing increases of 7.52, 5.93, and 5.95 percentage points in the mean value. Thus, all three individual configurations improved both mean IoU and Boundary F1 relative to the baseline, although the magnitude of improvement differed among the modules.
Combining CBAM and MS-Fuse further increased the mean IoU to 86.33% ± 0.20%, F1 Score to 93.31% ± 0.61%, Recall to 93.57% ± 0.11%, Accuracy to 95.18% ± 0.35%, and Boundary F1 to 76.75% ± 0.83%. The complete ACM-PSPNet configuration achieved the highest mean IoU, Recall, Accuracy, and Boundary F1, reaching 87.81% ± 0.11%, 93.82% ± 0.50%, 95.51% ± 0.46%, and 79.78% ± 0.73%, respectively.
The PSPNet + CBAM + MS-Fuse configuration produced the highest mean F1 Score of 93.31% ± 0.61%, slightly exceeding the 93.13% ± 0.65% obtained by ACM-PSPNet. However, adding ASPP to form the complete ACM-PSPNet configuration further increased the mean IoU from 86.33% to 87.81%, Recall from 93.57% to 93.82%, Accuracy from 95.18% to 95.51%, and Boundary F1 from 76.75% to 79.78%. Overall, the ablation results indicate that the performance improvement cannot be attributed to a single component. Instead, the complete ACM-PSPNet benefits from the complementary roles of multiscale contextual aggregation, attention-based feature recalibration, and progressive multilevel spatial-detail recovery provided by ASPP, CBAM, and MS-Fuse, respectively. Their coordinated configuration produces more consistent improvements across regional and boundary-based evaluation metrics, particularly in Boundary F1, although the magnitude of the contribution of each individual module varies among metrics.
3.4. Error Analysis of Building Footprint Extraction in Typical Scenes
To further analyze the error characteristics of different models in complex building areas, visual and quantitative analyses were conducted for four typical scenarios: low-rise buildings, mid-rise buildings, high-rise buildings, and super high-rise buildings. Figure 5 presents the spatial distributions of omission, commission, under-segmentation, and over-segmentation errors. Figure 5a compares SegNet, DeepLabV3+, U-Net, and PSPNet, whereas Figure 5b compares EfficientSAM, SegFormer, CNN–Transformer, and ACM-PSPNet. Figure 6 summarizes the Correct proportion and the four error types for all eight models.
Figure 5.
Comparison of building footprint extraction errors among different models in four typical building scenarios. Note: (a) Error comparison among SegNet, DeepLabV3+, U-Net, and PSPNet; (b) error comparison among EfficientSAM, SegFormer, CNN–Transformer, and ACM-PSPNet. The four rows represent low-rise, mid-rise, high-rise, and super high-rise building scenarios. For each scenario, nDSM, DOM, the reference label, and the error maps of the corresponding models are shown. White indicates correctly extracted building regions, black indicates background, green indicates omission (FN), orange indicates commission (FP), blue indicates under-segmentation (Under), and yellow indicates over-segmentation (Over).
Figure 6.
Comparison of correct extraction and error composition among different models in typical building scenarios. Note: Correct represents the proportion remaining after accounting for the four defined error types. Under, Over, FN, and FP denote under-segmentation, over-segmentation, omission, and commission errors, respectively. All proportions were calculated relative to the building-related evaluation pixels in the four typical scenes, excluding correctly classified background pixels from the denominator.
The visual comparison in Figure 5 shows clear differences among the models in densely distributed building areas. Under-segmentation is prominent for several comparison models, whereas ACM-PSPNet shows fewer large under-segmented regions and clearer separation between neighboring buildings. Local over-segmentation remains visible in some complex building groups.
Quantitative error statistics further demonstrate the differences among the models. ACM-PSPNet achieved the highest Correct proportion of 75.2% and the lowest total error proportion of 24.8%, followed by CNN–Transformer with a Correct proportion of 72.1%. Notably, ACM-PSPNet had the lowest Under proportion of 5.0%, which was 30.7 percentage points lower than that of PSPNet (35.7%). For practical urban mapping, this reduction means that fewer adjacent buildings are merged into a single footprint, thereby improving the separability of individual building units and the reliability of building boundary delineation in densely built areas. Its Over, FN, and FP proportions were 9.9%, 7.3%, and 2.5%, respectively.
4. Discussion
4.1. Role of Multi-Source Data Fusion in Building Extraction for High-Density Urban Scenes
Table 5 shows that nDSM provided a substantially greater contribution than DOM alone, increasing the mean IoU from 68.23% to 83.23%. The DOM+nDSM input further increased the mean IoU to 84.94%, corresponding to an additional improvement of 1.71 percentage points over nDSM alone. The improvement was more pronounced in the boundary-based evaluation, where the mean Boundary F1 increased from 62.91% ± 2.02% for nDSM alone to 66.47% ± 4.01% for DOM+nDSM, corresponding to an increase of 3.56 percentage points. Figure 7 further compares the three input configurations across low-rise, mid-rise, high-rise, and super high-rise building scenarios, with the ground-truth boundaries overlaid on the prediction results using cyan dashed lines.
Figure 7.
Comparison of building footprint extraction results using different input data in four typical building scenarios. Note: From top to bottom, the rows represent low-rise, mid-rise, high-rise, and super high-rise building scenarios. From left to right, the columns show DOM, nDSM, the reference label, and the extraction results obtained using DOM, nDSM, and DOM+nDSM inputs, respectively. The cyan dashed lines superimposed on the extraction results indicate the corresponding ground-truth building boundaries. White indicates correctly extracted building regions, black indicates background, blue indicates under-segmentation (Under), yellow indicates over-segmentation (Over), green indicates omission (FN), and orange indicates commission (FP).
The visual comparison in Figure 7 is consistent with the quantitative results. DOM-only predictions show larger deviations from the reference boundaries in areas affected by shadows, complex backgrounds, and narrow gaps between adjacent buildings. nDSM better preserves the main building bodies because height information provides a direct geometric distinction between buildings and surrounding ground-level surfaces, although some local contours and narrow gaps between buildings remain incomplete. Recent studies have similarly shown that jointly using optical imagery and DSM-derived height information enables the integration of spectral, geometric, and three dimensional structural characteristics, thereby improving building extraction in complex urban scenes [44,45].
The DOM+nDSM input generally produces boundaries that more closely follow the reference lines and improves the separation of neighboring buildings, indicating that optical texture and edge information complements the geometric constraints provided by nDSM. Although the 1.71 percentage point IoU improvement over nDSM alone is modest compared with the 15.00 percentage point improvement from DOM to nDSM, the mean Boundary F1 increased by 3.56 percentage points after DOM was combined with nDSM. This larger numerical improvement in the boundary-based metric indicates that the additional contribution of DOM is more evident in boundary matching than in building-region overlap. Therefore, height information remains the dominant contributor to building-body recognition in the present dataset, whereas DOM mainly provides complementary texture and boundary cues that support local contour recovery and adjacent-building separation.
From an application perspective, the value of nDSM should also be considered together with its availability and acquisition requirements. In this study, the nDSM was generated from existing DSM and DTM products derived from airborne LiDAR data rather than from an elevation-data acquisition campaign conducted specifically for this experiment. Therefore, where suitable DSM and DTM products are already available, the use of nDSM does not necessarily require additional dedicated elevation-data acquisition. Nevertheless, the availability, spatial resolution, update frequency, and accessibility of elevation products remain region dependent. Accordingly, DOM+nDSM fusion is most applicable where reliable elevation data are available, whereas DOM-only extraction remains an alternative when height information cannot be obtained.
4.2. Advantages, Applicability, and Limitations of ACM-PSPNet
The results in Table 6 and Figure 3 show that ACM-PSPNet achieved the highest mean IoU and Boundary F1 among the evaluated models. Compared with PSPNet, its Boundary F1 increased from 66.47% ± 4.01% to 79.78% ± 0.73%, corresponding to an improvement of 13.31 percentage points. The larger improvement in Boundary F1 than in the region-based metrics suggests that the main benefit of ACM-PSPNet is reflected in boundary matching and the separation of adjacent buildings.
The ablation results in Table 8 further clarify the different roles of the three components in boundary recovery and adjacent-building separation. CBAM increased the mean Boundary F1 from 66.47% for PSPNet to 73.99%, suggesting that channel and spatial feature recalibration helps suppress confusing background responses while emphasizing building-related regions and boundaries. ASPP increased the mean Boundary F1 to 72.40%. Its multiscale contextual aggregation provides complementary receptive fields for buildings of different scales and helps preserve contextual differences around narrow gaps and adjacent structures. MS-Fuse increased the mean Boundary F1 to 72.42% by progressively integrating high-level semantic information with middle- and low-level spatial features, thereby recovering edge, corner, and gap information weakened during encoding. The combined CBAM+MS-Fuse configuration further increased Boundary F1 to 76.75%, while the complete ACM-PSPNet reached 79.78%. These results indicate that contextual aggregation, feature recalibration, and multilevel spatial-detail recovery provide complementary contributions to boundary matching rather than acting as isolated improvements.
To further evaluate boundary-oriented performance against a boundary-aware building-extraction architecture, HD-Net [6] was additionally evaluated using the same DOM+nDSM input, dataset partition, training configuration, model-selection criterion, and three random seeds. As shown in Supplementary Table S1, HD-Net achieved mean IoU and Boundary F1 values of 83.68% ± 0.67% and 72.70% ± 0.38%, respectively, whereas ACM-PSPNet achieved 87.81% ± 0.11% and 79.78% ± 0.73%. The difference in mean Boundary F1 was 7.08 percentage points. This supplementary comparison provides additional evidence that the boundary-performance improvement of ACM-PSPNet is not limited to comparisons with the general-purpose segmentation architectures in the principal benchmark. However, HD-Net represents only one boundary-aware building-extraction architecture, and this result should therefore not be interpreted as demonstrating general superiority over all boundary-oriented methods.
Figure 8 further illustrates the differences between PSPNet and ACM-PSPNet in the three typical scenes. PSPNet shows relatively large under-segmented regions in the complex background and dense building-interaction scenes, where neighboring buildings are frequently merged. In the shadow-covered scene, boundary deviations and local omission or commission errors are also evident. In contrast, ACM-PSPNet shows fewer large under-segmented regions and clearer separation between adjacent buildings, particularly in the dense building-interaction scene, where more narrow gaps between neighboring buildings are preserved. This improvement is consistent with the decrease in the Under proportion from 35.7% for PSPNet to 5.0% for ACM-PSPNet. Nevertheless, local over-segmentation and omission errors remain visible, indicating that the improvement is mainly concentrated on reducing building adhesion rather than uniformly reducing all error types. Similar emphasis on boundary and contour quality has also been reported in recent high resolution building mapping and contour optimization studies [46,47].
Figure 8.
Comparison of building footprint predictions and error types between PSPNet and ACM-PSPNet in three typical urban scenes. Note: The three scenes represent a complex-background area, a dense building-interaction area, and a shadow-covered area. For each scene, DOM, nDSM, and the reference label are shown on the left. The PSPNet and ACM-PSPNet results are shown on the right, with the first row presenting the predicted building masks and the second row presenting the corresponding error-type maps. White indicates correctly extracted building regions, black indicates background, blue indicates under-segmentation (Under), yellow indicates over-segmentation (Over), green indicates omission (FN), and orange indicates commission (FP).
Image quality is another factor that may affect model applicability. The shadow-covered scene in Figure 8 provides limited qualitative evidence under locally degraded optical conditions. Although ACM-PSPNet shows clearer adjacent-building separation than PSPNet in this scene, remaining boundary deviations and local errors indicate that strong shadows can still weaken useful optical texture and boundary cues. More generally, haze, shadow, and insufficient illumination can degrade the visual information available from optical imagery. Recent image restoration studies have specifically addressed haze in remote sensing imagery [48], shadow degradation [49], and low-light image enhancement [50], highlighting the importance of input image quality for downstream image interpretation. Because nDSM provides complementary geometric height information that does not depend on visible light texture, the DOM+nDSM input may retain useful structural constraints when optical appearance is partially degraded, although this benefit still depends on the quality and spatial registration of the elevation data. The present study did not construct dedicated haze or low-light benchmarks or stratify extraction accuracy according to image quality levels. Therefore, the current results should not be interpreted as demonstrating quantitative robustness to these degradation types. Future work should evaluate building extraction under controlled haze, shadow, and low-light conditions and investigate degradation aware training or image restoration preprocessing for improving performance under poor optical imaging conditions.
In terms of computational efficiency, Table 7 shows that ACM-PSPNet requires 238.62 G FLOPs and 83.62 ms per image, with an inference speed of 11.96 FPS and an inference memory usage of 566.18 MB. These values are substantially higher than those of several comparison models, indicating that ACM-PSPNet is not a lightweight architecture despite its relatively moderate parameter count. This trade-off is particularly evident when compared with CNN–Transformer, which achieved a mean Boundary F1 of 78.19% with 28.59 G FLOPs and an inference speed of 33.75 FPS, whereas ACM-PSPNet achieved 79.78% Boundary F1 but required substantially more computation. Therefore, the practical choice of model should depend on application requirements. For urban base mapping, building information updating, and other offline tasks in which boundary fidelity and adjacent-building separation directly affect final mapping quality, the additional computational cost of ACM-PSPNet may be acceptable. In contrast, real-time, edge device, or large-area rapid-screening applications may benefit more from lighter architectures with lower computational requirements and inference latency. Previous studies have similarly highlighted the need to balance detailed contour recovery with computational efficiency in building extraction [51]. Future model optimization should therefore focus on reducing computational cost while preserving the boundary and adjacent-building separation performance of ACM-PSPNet.
Although the independent test set on Hong Kong Island reduces the risk of spatial leakage between model development and final evaluation, both the training and test data are still derived from the same city and from comparable data sources. Therefore, the current results mainly demonstrate spatial transfer within Hong Kong rather than generalization across different cities, sensors, or acquisition conditions. Transfer to other regions may be affected by differences in urban morphology and building style, including building scale, roof geometry, object spacing, and the prevalence of attached structures. Changes in sensor type may further introduce differences in spatial resolution, radiometric characteristics, viewing geometry, and the quality or registration accuracy of elevation products. Terrain conditions can also alter shadow patterns and occlusion and may affect the reliability of DSM- and DTM-derived height information. The use of nDSM reduces the influence of absolute terrain elevation by representing object height relative to the local ground, while the multiscale contextual aggregation, feature recalibration, and multilevel feature fusion in ACM-PSPNet may provide some capacity to accommodate moderate variations in scale and background appearance. Nevertheless, these characteristics should not be interpreted as demonstrated cross-city or cross-sensor generalization. Previous studies have shown that regional and data source differences can introduce domain shifts that affect the transferability of building-extraction models [52,53]. Further evaluation on geographically independent cities and heterogeneous remote sensing datasets is therefore required to assess broader model generalization.
4.3. Adaptability Analysis of the Model Under Conditions Without Height Information
To further evaluate the adaptability of ACM-PSPNet when height information is unavailable, supplementary experiments were conducted using the Hong Kong DOM-only data and the public WHU-Mix Raster dataset [27]. The HK-DOM experiment evaluates model performance using only optical imagery under the updated spatially independent test setting in Hong Kong, whereas WHU-Mix Raster provides an additional evaluation on a public RGB building dataset. Unlike the main experiments reported in Section 3.1, Section 3.2 and Section 3.3, these supplementary experiments were conducted using a fixed random seed of 42. Therefore, the results in Table 9 represent single-run performance rather than the mean of repeated experiments.
Table 9.
Accuracy comparison between PSPNet and ACM-PSPNet under conditions without height information.
As shown in Table 9, under the fixed seed 42 setting, ACM-PSPNet outperformed PSPNet on the HK-DOM dataset across all four metrics. IoU increased from 67.89% to 71.93%, F1 Score from 80.84% to 82.89%, Recall from 80.49% to 83.81%, and Accuracy from 85.46% to 87.01%, corresponding to improvements of 4.04, 2.05, 3.32, and 1.55 percentage points, respectively. These results indicate that ACM-PSPNet retains an advantage over PSPNet when only DOM imagery is available, although the improvement is smaller than that obtained with DOM+nDSM input.
Under the same seed 42 setting, ACM-PSPNet also outperformed PSPNet on the WHU-Mix Raster dataset across all four metrics. IoU increased from 67.65% to 78.30%, while F1 Score increased from 78.85% to 87.50%, corresponding to improvements of 10.65 and 8.65 percentage points, respectively. Recall and Accuracy also increased by 5.29 and 2.34 percentage points. These results provide supplementary evidence that ACM-PSPNet can maintain effective building-extraction performance when only RGB imagery is available.
It should be noted that the HK-DOM and WHU-Mix Raster experiments differ in data source, spatial resolution, regional characteristics, and annotation style. The HK-DOM imagery used in this study was standardized to a spatial resolution of 0.5 m, whereas WHU-Mix Raster integrates multi-source imagery with native spatial resolutions ranging from approximately 0.09 to 2.5 m [27]. Differences in spatial resolution, imaging conditions, and regional characteristics can affect model performance and transferability [28]. In addition, differences in texture, imaging style, and semantic distributions across regions and data sources can introduce domain shifts and further affect cross-region model generalization [52,53]. Therefore, the results in Table 9 should be regarded as supplementary adaptability tests under conditions without height information rather than as direct absolute accuracy comparisons with the main DOM+nDSM experiments. Because these supplementary experiments were conducted only with seed 42, they do not quantify run-to-run variability, and further repeated and cross-region experiments are required to evaluate the stability of this adaptability.
5. Conclusions
This study addresses spectral confusion, shadow interference, dense building adjacency, and complex boundary recovery in high-density urban building footprint extraction. A DOM+nDSM multi-source input scheme was constructed, and ACM-PSPNet was developed on the basis of PSPNet by integrating ASPP, CBAM, and MS-Fuse. The main input comparison, model comparison, and ablation experiments were evaluated over three independent runs, while supplementary experiments under conditions without height information were conducted using a fixed random seed of 42. The main conclusions are as follows.
(1) DOM+nDSM fusion improved building footprint extraction in high-density urban scenes. Across three independent runs, the fused input achieved a mean IoU of 84.94%, compared with 68.23% for DOM alone and 83.23% for nDSM alone, corresponding to improvements of 16.71 and 1.71 percentage points, respectively. The substantially larger improvement from DOM to nDSM indicates that height information provides the dominant structural constraint in the present dataset. However, the mean Boundary F1 further increased from 62.91% for nDSM alone to 66.47% for DOM+nDSM, corresponding to an improvement of 3.56 percentage points. This indicates that the complementary contribution of DOM is more evident in boundary matching than in regional overlap, consistent with its role in providing additional texture and visible-edge information.
(2) ACM-PSPNet achieved the highest mean IoU and Boundary F1 among the eight evaluated models. Its mean IoU, F1 Score, Recall, Accuracy, and Boundary F1 reached 87.81%, 93.13%, 93.82%, 95.51%, and 79.78%, respectively. Compared with PSPNet, ACM-PSPNet improved mean IoU by 2.87 percentage points and Boundary F1 by 13.31 percentage points. The larger improvement in Boundary F1 indicates that the integrated configuration is particularly effective in improving boundary matching and adjacent-building separation.
(3) The ablation experiments showed that ASPP, CBAM, and MS-Fuse each improved mean IoU and Boundary F1 relative to the PSPNet baseline, while the complete ACM-PSPNet configuration achieved the highest mean IoU, Recall, Accuracy, and Boundary F1. Error analysis further showed that ACM-PSPNet achieved a Correct proportion of 75.2% and a total error proportion of 24.8% in the selected typical scenes. Its Under proportion decreased from 35.7% for PSPNet to 5.0%, whereas the Over, FN, and FP proportions were 9.9%, 7.3%, and 2.5%, respectively. These results show that the main improvement is concentrated on reducing building adhesion and improving adjacent-object separation, although local over-segmentation and omission remain.
(4) Supplementary single-run experiments using seed 42 showed that ACM-PSPNet retained an advantage over PSPNet when height information was unavailable. On HK-DOM, ACM-PSPNet improved IoU from 67.89% to 71.93% and increased all four evaluation metrics. On WHU-Mix Raster, IoU increased from 67.65% to 78.30% and F1 Score from 78.85% to 87.50%. These results provide supplementary evidence of model adaptability under RGB-only conditions, but they should not be interpreted as repeated-experiment or broad cross-region generalization results.
Overall, the DOM+nDSM input scheme and ACM-PSPNet improve regional extraction accuracy, boundary matching, and adjacent-building separation in high-density urban scenes. Because both the model development and independent test regions are located within Hong Kong and use comparable data sources, the present results mainly demonstrate within-city spatial transfer rather than broad cross-city or cross-sensor generalization. However, the current method still has relatively high computational requirements, and residual over-segmentation and omission remain in locally complex areas. Future work should focus on repeated cross-region and multi-sensor evaluation, explicit boundary and object-level constraints, and model lightweighting to improve generalization, contour continuity, and large-scale mapping efficiency. By improving boundary fidelity and adjacent-building separation, the proposed framework can provide a more reliable spatial basis for accuracy-oriented urban base mapping, building information updating, and urban renewal monitoring in densely built environments.
Supplementary Materials
The following supporting information can be downloaded at https://www.mdpi.com/article/10.3390/rs18172971/s1, Table S1: Comparison between ACM-PSPNet and HD-Net under the unified experimental protocol; Table S2: Multi-model Boundary F1 sensitivity analysis under different boundary-matching tolerances.
Author Contributions
Conceptualization, Y.Q. and Z.G.; methodology, Y.Q. and Z.G.; software, Y.Q. and J.S.; validation, Y.Q., E.S., R.T., W.Y. and H.N.; formal analysis, Y.Q. and Z.G.; investigation, Y.Q., J.S., R.T. and W.Y.; resources, J.S.; data curation, Y.Q., E.S., R.T., W.Y. and H.N.; writing—original draft preparation, Y.Q. and Z.G.; writing—review and editing, Y.Q., Z.G. and Z.Z.; visualization, Y.Q. and H.N.; supervision, Z.G. and Z.Z.; project administration, Z.G. and Z.Z.; funding acquisition, Z.G. and Z.Z. All authors have read and agreed to the published version of the manuscript.
Funding
This research was funded by the National Natural Science Foundation of China, grant number 42171292 and 42376228; the China Scholarship Council, grant number 202304180028; and the Special Fund for Asian Regional Cooperation of the Ministry of Foreign Affairs of the People’s Republic of China, grant number WJ1326009.
Data Availability Statement
The raw Hong Kong DOM, DSM, and DTM data used to construct the HK DOM+nDSM dataset are publicly available from the Common Spatial Data Infrastructure (CSDI) Portal of Hong Kong at https://portal.csdi.gov.hk/csdi-webpage/ (accessed on 28 May 2026). The processed HK DOM+nDSM dataset generated in this study, including DOM image patches, nDSM patches, building labels, and the corresponding Train/Val/Test data structure, has been deposited in Zenodo and is publicly available at https://doi.org/10.5281/zenodo.20430544. The WHU-Mix Raster dataset used in the supplementary experiment is publicly available at https://gpcv.whu.edu.cn/data/whu-mix(raster)/whu_mix%20(raster).html (accessed on 28 May 2026). Users should comply with the terms and conditions of the original data providers when reusing the data.
Acknowledgments
During the preparation of this manuscript/study, the authors used Doubao-Seed 2.0 for the purposes of English language polishing and manuscript linguistic revision. The authors have reviewed and edited the output and take full responsibility for the content of this publication.
Conflicts of Interest
The authors declare no conflicts of interest.
References
- Li, Q.; Mou, L.; Sun, Y.; Hua, Y.; Shi, Y.; Zhu, X.X. A Review of Building Extraction From Remote Sensing Imagery: Geometrical Structures and Semantic Attributes. IEEE Trans. Geosci. Remote Sens. 2024, 62, 4702315. [Google Scholar] [CrossRef] [Scilit]
- Dabove, P.; Daud, M.; Olivotto, L. Revolutionizing Urban Mapping: Deep Learning and Data Fusion Strategies for Accurate Building Footprint Segmentation. Sci. Rep. 2024, 14, 13510. [Google Scholar] [CrossRef] [Scilit]
- Papini, S.; Rao, S.X.; Egger, P.H. Evolving Cityscape: A Dataset for Building Footprints and Heights from Satellite Imagery in China. Sci. Data 2025, 12, 1678. [Google Scholar] [CrossRef] [Scilit]
- Guo, H.; Du, B.; Zhang, L.; Su, X. A Coarse-to-Fine Boundary Refinement Network for Building Footprint Extraction from Remote Sensing Imagery. ISPRS J. Photogramm. Remote Sens. 2022, 183, 240–252. [Google Scholar] [CrossRef] [Scilit]
- Zhou, Y.; Chen, Z.; Wang, B.; Li, S.; Liu, H.; Xu, D.; Ma, C. BOMSC-Net: Boundary Optimization and Multi-Scale Context Awareness Based Building Extraction From High-Resolution Remote Sensing Imagery. IEEE Trans. Geosci. Remote Sens. 2022, 60, 5618617. [Google Scholar] [CrossRef] [Scilit]
- Li, Y.; Hong, D.; Li, C.; Yao, J.; Chanussot, J. HD-Net: High-Resolution Decoupled Network for Building Footprint Extraction via Deeply Supervised Body and Boundary Decomposition. ISPRS J. Photogramm. Remote Sens. 2024, 209, 51–65. [Google Scholar] [CrossRef] [Scilit]
- Cao, S.; Feng, D.; Liu, S.; Xu, W.; Chen, H.; Xie, Y.; Zhang, H.; Pirasteh, S.; Zhu, J. BEMRF-Net: Boundary Enhancement and Multiscale Refinement Fusion for Building Extraction From Remote Sensing Imagery. IEEE J. Sel. Top. Appl. Earth Obs. Remote Sens. 2024, 17, 16342–16358. [Google Scholar] [CrossRef] [Scilit]
- Han, R.; Fan, X.; Liu, J. EUNet: Edge-UNet for Accurate Building Extraction and Edge Emphasis in Gaofen-7 Images. Remote Sens. 2024, 16, 2397. [Google Scholar] [CrossRef] [Scilit]
- Sheng, H.; Zhang, Y.; Zhang, W.; Wei, S.; Xu, M.; Muhammad, Y. ME-FCN: A Multi-Scale Feature-Enhanced Fully Convolutional Network for Building Footprint Extraction. Remote Sens. 2024, 16, 4305. [Google Scholar] [CrossRef] [Scilit]
- Zhu, B.; Yu, D.; Xiao, X.; Shen, J.; Cui, Z.; Su, Y.; Li, A.; Li, D. AP-PointRend: An Improved Network for Building Extraction via High-Resolution Remote Sensing Images. Remote Sens. 2025, 17, 1481. [Google Scholar] [CrossRef] [Scilit]
- Yuan, S.; Wang, Z.; Li, J.; Xu, N.; You, Z.; Huang, D.-S. FDENet: Frequency-Guided Dual-Encoder Network for Building Footprint Extraction From Remote Sensing Images. IEEE J. Sel. Top. Appl. Earth Obs. Remote Sens. 2025, 18, 22403–22420. [Google Scholar] [CrossRef] [Scilit]
- Du, Z.; Sui, H.; Zhou, Q.; Zhou, M.; Shi, W.; Wang, J.; Liu, J. Vectorized Building Extraction from High-Resolution Remote Sensing Images Using Spatial Cognitive Graph Convolution Model. ISPRS J. Photogramm. Remote Sens. 2024, 213, 53–71. [Google Scholar] [CrossRef] [Scilit]
- Ma, X.; Wu, Q.; Zhao, X.; Zhang, X.; Pun, M.-O.; Huang, B. SAM-Assisted Remote Sensing Imagery Semantic Segmentation With Object and Boundary Constraints. IEEE Trans. Geosci. Remote Sens. 2024, 62, 5636916. [Google Scholar] [CrossRef] [Scilit]
- Wu, Y.; Wang, Y.; Yang, H.; Zhang, P.; Wu, Y.; Wang, B. A Mutual Information Constrained Multitask Learning Method for Very High-Resolution Building Segmentation. IEEE J. Sel. Top. Appl. Earth Obs. Remote Sens. 2025, 18, 9230–9243. [Google Scholar] [CrossRef] [Scilit]
- Yuan, W.; Zhang, X.; Shi, J.; Wang, J. LiteST-Net: A Hybrid Model of Lite Swin Transformer and Convolution for Building Extraction from Remote Sensing Image. Remote Sens. 2023, 15, 1996. [Google Scholar] [CrossRef] [Scilit]
- OuYang, C.; Li, H. BuildNext-Net: A Network Based on Self-Attention and Equipped With an Efficient Decoder for Extracting Buildings From High-Resolution Remote Sensing Images. IEEE J. Sel. Top. Appl. Earth Obs. Remote Sens. 2025, 18, 16385–16402. [Google Scholar] [CrossRef] [Scilit]
- Wang, X.; Tian, M.; Zhang, Z.; He, K.; Wang, S.; Liu, Y.; Dong, Y. SDSNet: Building Extraction in High-Resolution Remote Sensing Images Using a Deep Convolutional Network with Cross-Layer Feature Information Interaction Filtering. Remote Sens. 2023, 16, 169. [Google Scholar] [CrossRef] [Scilit]
- Zhang, B.; Huang, J.; Wu, F.; Zhang, W. OCANet: An Overcomplete Convolutional Attention Network for Building Extraction From High-Resolution Remote Sensing Images. IEEE J. Sel. Top. Appl. Earth Obs. Remote Sens. 2024, 17, 18427–18443. [Google Scholar] [CrossRef] [Scilit]
- Yang, D.; Gao, X.; Yang, Y.; Jiang, M.; Guo, K.; Liu, B.; Li, S.; Yu, S. CSA-Net: Complex Scenarios Adaptive Network for Building Extraction for Remote Sensing Images. IEEE J. Sel. Top. Appl. Earth Obs. Remote Sens. 2024, 17, 938–953. [Google Scholar] [CrossRef] [Scilit]
- Yilmaz, E.O.; Kavzoglu, T. DeepSwinLite: A Swin Transformer-Based Light Deep Learning Model for Building Extraction Using VHR Aerial Imagery. Remote Sens. 2025, 17, 3146. [Google Scholar] [CrossRef] [Scilit]
- Hosseinpour, H.; Samadzadegan, F.; Javan, F.D. CMGFNet: A Deep Cross-Modal Gated Fusion Network for Building Extraction from Very High-Resolution Remote Sensing Images. ISPRS J. Photogramm. Remote Sens. 2022, 184, 96–115. [Google Scholar] [CrossRef] [Scilit]
- Luo, H.; Feng, X.; Du, B.; Zhang, Y. A Multimodal Feature Fusion Network for Building Extraction With Very High-Resolution Remote Sensing Image and LiDAR Data. IEEE Trans. Geosci. Remote Sens. 2024, 62, 5621819. [Google Scholar] [CrossRef] [Scilit]
- Chen, J.; Liu, B.; Yu, A.; Quan, Y.; Li, T.; Guo, W. Depth Feature Fusion Network for Building Extraction in Remote Sensing Images. IEEE J. Sel. Top. Appl. Earth Obs. Remote Sens. 2024, 17, 16577–16591. [Google Scholar] [CrossRef] [Scilit]
- Gao, Y.; Chai, H.; Lv, X. MMRAD-Net: A Multi-Scale Model for Precise Building Extraction from High-Resolution Remote Sensing Imagery with DSM Integration. Remote Sens. 2025, 17, 952. [Google Scholar] [CrossRef] [Scilit]
- Wang, T.; Chen, G.; Zhang, X.; Liu, C.; Wang, J.; Tan, X.; Zhou, W.; He, C. LMFNet: Lightweight Multimodal Fusion Network for High-Resolution Remote Sensing Image Segmentation. Pattern Recognit. 2025, 164, 111579. [Google Scholar] [CrossRef] [Scilit]
- Zhu, Q.; Li, Z.; Song, T.; Yao, L.; Guan, Q.; Zhang, L. Unrestricted Region and Scale: Deep Self-Supervised Building Mapping Framework across Different Cities from Five Continents. ISPRS J. Photogramm. Remote Sens. 2024, 209, 344–367. [Google Scholar] [CrossRef] [Scilit]
- Luo, M.; Ji, S.; Wei, S. A Diverse Large-Scale Building Dataset and a Novel Plug-and-Play Domain Generalization Method for Building Extraction. IEEE J. Sel. Top. Appl. Earth Obs. Remote Sens. 2023, 16, 4122–4138. [Google Scholar] [CrossRef] [Scilit]
- Neupane, B.; Aryal, J.; Rajabifard, A. Fine-Tuning-Based Transfer Learning for Building Extraction from Off-Nadir Remote Sensing Images. Remote Sens. 2025, 17, 1251. [Google Scholar] [CrossRef] [Scilit]
- Chen, L.-C.; Zhu, Y.; Papandreou, G.; Schroff, F.; Adam, H. Encoder-Decoder with Atrous Separable Convolution for Semantic Image Segmentation. In Computer Vision—ECCV 2018; Ferrari, V., Hebert, M., Sminchisescu, C., Weiss, Y., Eds.; Lecture Notes in Computer Science; Springer International Publishing: Cham, Switzerland, 2018; Volume 11211, pp. 833–851. [Google Scholar]
- Badrinarayanan, V.; Kendall, A.; Cipolla, R. SegNet: A Deep Convolutional Encoder-Decoder Architecture for Image Segmentation. IEEE Trans. Pattern Anal. Mach. Intell. 2017, 39, 2481–2495. [Google Scholar] [CrossRef] [Scilit] [PubMed]
- Ronneberger, O.; Fischer, P.; Brox, T. U-Net: Convolutional Networks for Biomedical Image Segmentation. In Medical Image Computing and Computer-Assisted Intervention—MICCAI 2015; Navab, N., Hornegger, J., Wells, W.M., Frangi, A.F., Eds.; Lecture Notes in Computer Science; Springer International Publishing: Cham, Switzerland, 2015; Volume 9351, pp. 234–241. [Google Scholar]
- Zhao, H.; Shi, J.; Qi, X.; Wang, X.; Jia, J. Pyramid Scene Parsing Network. In Proceedings of the 2017 IEEE Conference on Computer Vision and Pattern Recognition (CVPR), Honolulu, HI, USA, 21–26 July 2017; IEEE: New York, NY, USA, 2017; pp. 6230–6239. [Google Scholar]
- Xie, E.; Wang, W.; Yu, Z.; Anandkumar, A.; Alvarez, J.M.; Luo, P. SegFormer: Simple and Efficient Design for Semantic Segmentation with Transformers. In NIPS ‘21: Proceedings of the 35th International Conference on Neural Information Processing Systems; Curran Associates Inc.: Red Hook, NY, USA, 2021. [Google Scholar]
- Xiong, Y.; Varadarajan, B.; Wu, L.; Xiang, X.; Xiao, F.; Zhu, C.; Dai, X.; Wang, D.; Sun, F.; Iandola, F.; et al. EfficientSAM: Leveraged Masked Image Pretraining for Efficient Segment Anything. In Proceedings of the 2024 IEEE/CVF Conference on Computer Vision and Pattern Recognition (CVPR), Seattle, WA, USA, 16–22 June 2024; IEEE: New York, NY, USA, 2024; pp. 16111–16121. [Google Scholar]
- He, K.; Zhang, X.; Ren, S.; Sun, J. Deep Residual Learning for Image Recognition. In Proceedings of the 2016 IEEE Conference on Computer Vision and Pattern Recognition (CVPR), Las Vegas, NV, USA, 27–30 June 2016; IEEE: New York, NY, USA, 2016; pp. 770–778. [Google Scholar]
- Woo, S.; Park, J.; Lee, J.-Y.; Kweon, I.S. CBAM: Convolutional Block Attention Module. In Computer Vision—ECCV 2018; Ferrari, V., Hebert, M., Sminchisescu, C., Weiss, Y., Eds.; Lecture Notes in Computer Science; Springer International Publishing: Cham, Switzerland, 2018; Volume 11211, pp. 3–19. [Google Scholar]
- Ma, J.; Chen, J.; Ng, M.; Huang, R.; Li, Y.; Li, C.; Yang, X.; Martel, A.L. Loss Odyssey in Medical Image Segmentation. Med. Image Anal. 2021, 71, 102035. [Google Scholar] [CrossRef] [Scilit]
- Taha, A.A.; Hanbury, A. Metrics for Evaluating 3D Medical Image Segmentation: Analysis, Selection, and Tool. BMC Med. Imaging 2015, 15, 29. [Google Scholar] [CrossRef] [Scilit] [PubMed]
- Cheng, B.; Girshick, R.; Dollar, P.; Berg, A.C.; Kirillov, A. Boundary IoU: Improving Object-Centric Image Segmentation Evaluation. In Proceedings of the 2021 IEEE/CVF Conference on Computer Vision and Pattern Recognition (CVPR), Nashville, TN, USA, 20–25 June 2021; IEEE: New York, NY, USA, 2021; pp. 15329–15337. [Google Scholar]
- Nyandwi, E.; Gerke, M.; Achanccaray, P. Local Evaluation of Large-Scale Remote Sensing Machine Learning-Generated Building and Road Dataset: The Case of Rwanda. PFG–J. Photogramm. Remote Sens. Geoinf. Sci. 2024, 92, 705–722. [Google Scholar] [CrossRef] [Scilit]
- Li, Z.; Xin, Q.; Sun, Y.; Cao, M. A Deep Learning-Based Framework for Automated Extraction of Building Footprint Polygons from Very High-Resolution Aerial Imagery. Remote Sens. 2021, 13, 3630. [Google Scholar] [CrossRef] [Scilit]
- Loshchilov, I.; Hutter, F. Decoupled Weight Decay Regularization. arXiv 2019, arXiv:1711.05101. [Google Scholar]
- Loshchilov, I.; Hutter, F. SGDR: Stochastic Gradient Descent with Warm Restarts. arXiv 2017, arXiv:1608.03983. [Google Scholar]
- Yuan, X.; Tian, J.; Reinartz, P. A Self-Training Approach Using Benchmark Dataset and Stereo-DSM for Building Extraction. IEEE J. Sel. Top. Appl. Earth Obs. Remote Sens. 2024, 17, 11352–11364. [Google Scholar] [CrossRef] [Scilit]
- Farajelahi, B.; Arefi, H. Profile-Based Building Detection Using Convolutional Neural Network and High-Resolution Digital Surface Models. Remote Sens. 2025, 17, 2496. [Google Scholar] [CrossRef] [Scilit]
- Huang, X.; Zhang, Z.; Li, J. China’s First Sub-Meter Building Footprints Derived by Deep Learning. Remote Sens. Environ. 2024, 311, 114274. [Google Scholar] [CrossRef] [Scilit]
- Wang, S.; Guo, M.; Wang, D.; Cao, W.; Huang, Y.; Zhang, J. Optimisation of Building Contour Extraction in High-Resolution Remote Sensing Images: An Adaptive Cluster Segmentation Algorithm for Improving Deep Learning Models. Expert Syst. Appl. 2025, 280, 127562. [Google Scholar] [CrossRef] [Scilit]
- Chi, K.; Yuan, Y.; Wang, Q. Trinity-Net: Gradient-Guided Swin Transformer-Based Remote Sensing Image Dehazing and Beyond. IEEE Trans. Geosci. Remote Sens. 2023, 61, 4702914. [Google Scholar] [CrossRef] [Scilit]
- Chi, K.; Jing, W.; Li, J.; Li, Q.; Wang, Q. Cross-Modal Spherical Aggregation for Weakly Supervised Remote Sensing Shadow Removal. IEEE Trans. Multimed. 2026, 28, 813–824. [Google Scholar] [CrossRef] [Scilit]
- Chi, K.; Li, Q.; Chu, J.; Li, J.; Wang, Q. Deep Reinforcement Learning for Lunar Polar Low-Light Enhancement. IEEE Trans. Multimed. 2026, 28, 5203–5215. [Google Scholar] [CrossRef] [Scilit]
- He, J.; Cheng, Y.; Wang, W.; Ren, Z.; Zhang, C.; Zhang, W. A Lightweight Building Extraction Approach for Contour Recovery in Complex Urban Environments. Remote Sens. 2024, 16, 740. [Google Scholar] [CrossRef] [Scilit]
- Luo, M.; Zan, Y.; Khoshelham, K.; Ji, S. Domain Generalization for Semantic Segmentation of Remote Sensing Images via Vision Foundation Model Fine-Tuning. ISPRS J. Photogramm. Remote Sens. 2025, 230, 126–146. [Google Scholar] [CrossRef] [Scilit]
- Liu, Y.; Liu, Y.; Liu, K.; Huang, Y.; Tang, C.; Zhou, W.; Chen, Z.; Xiang, W.; Zhang, H. MASDG: Multiview Augmented Single-Source Domain Generalization Method for Robust Remote Sensing Building Extraction. IEEE Trans. Geosci. Remote Sens. 2025, 63, 4709915. [Google Scholar] [CrossRef] [Scilit]
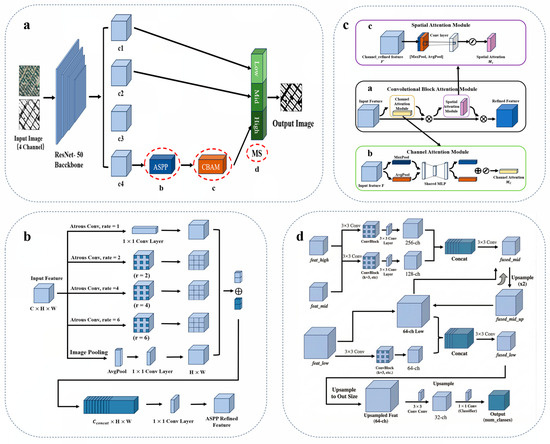
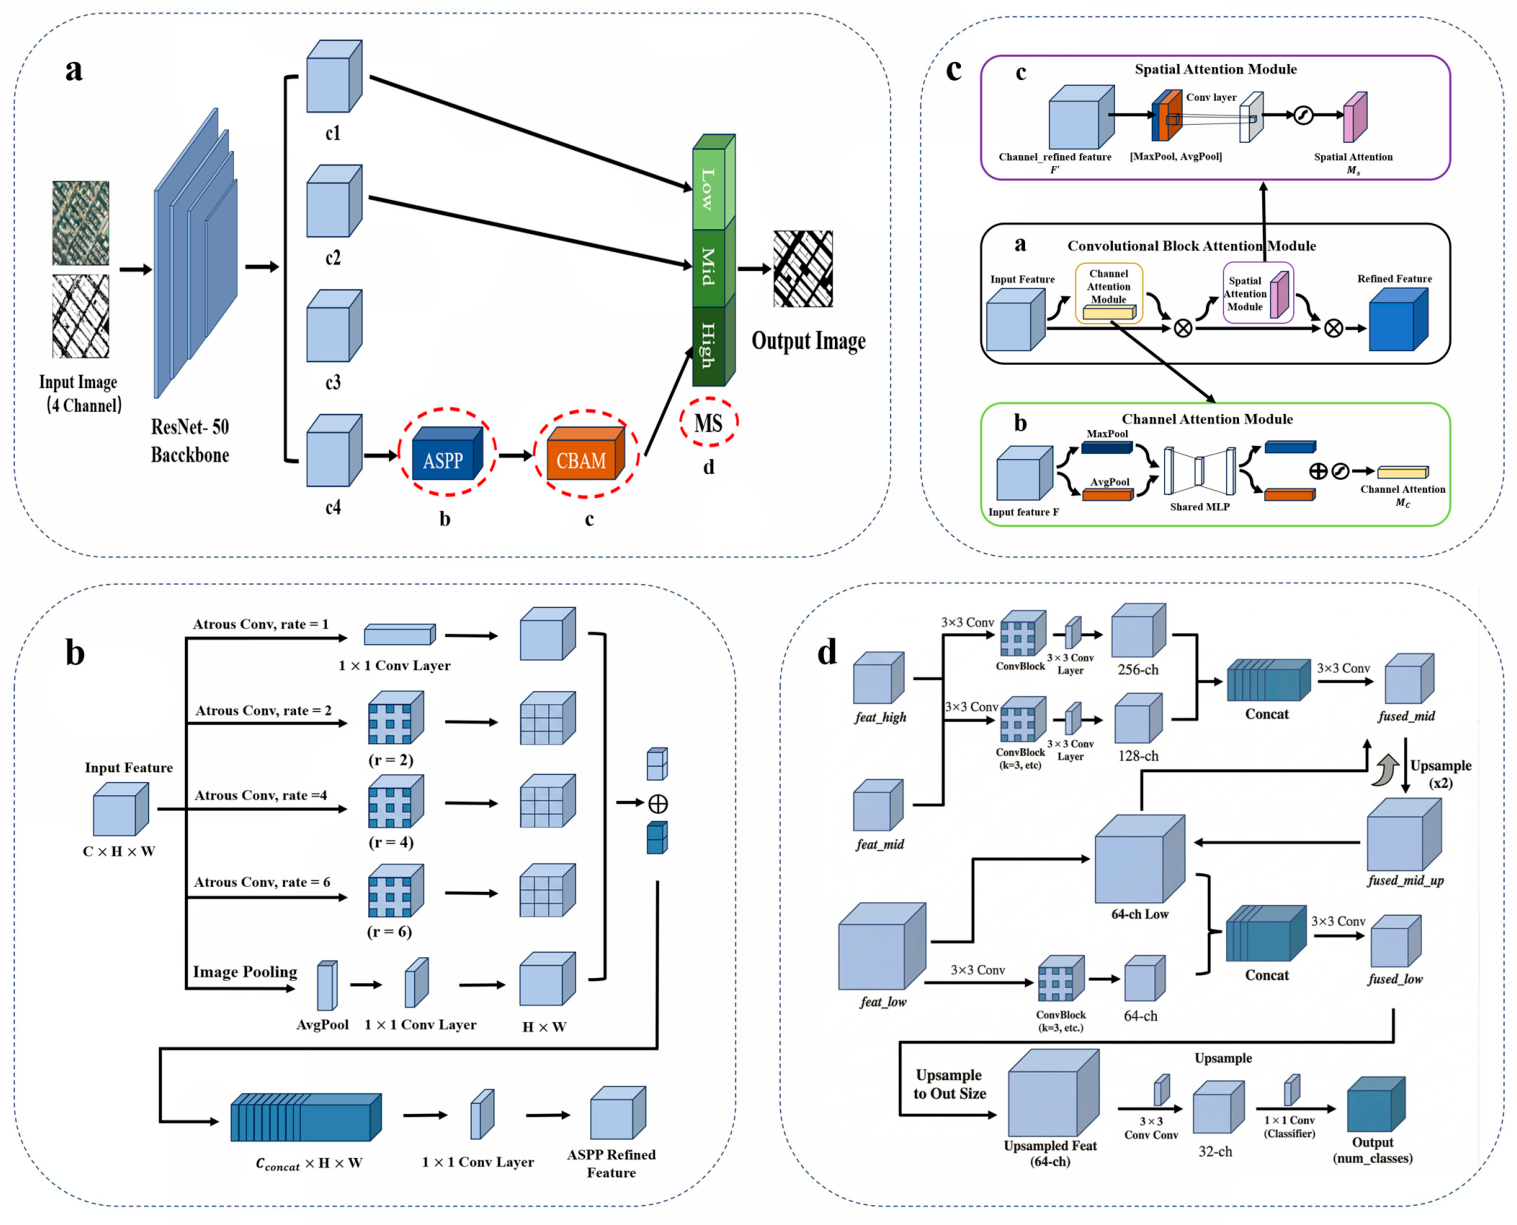
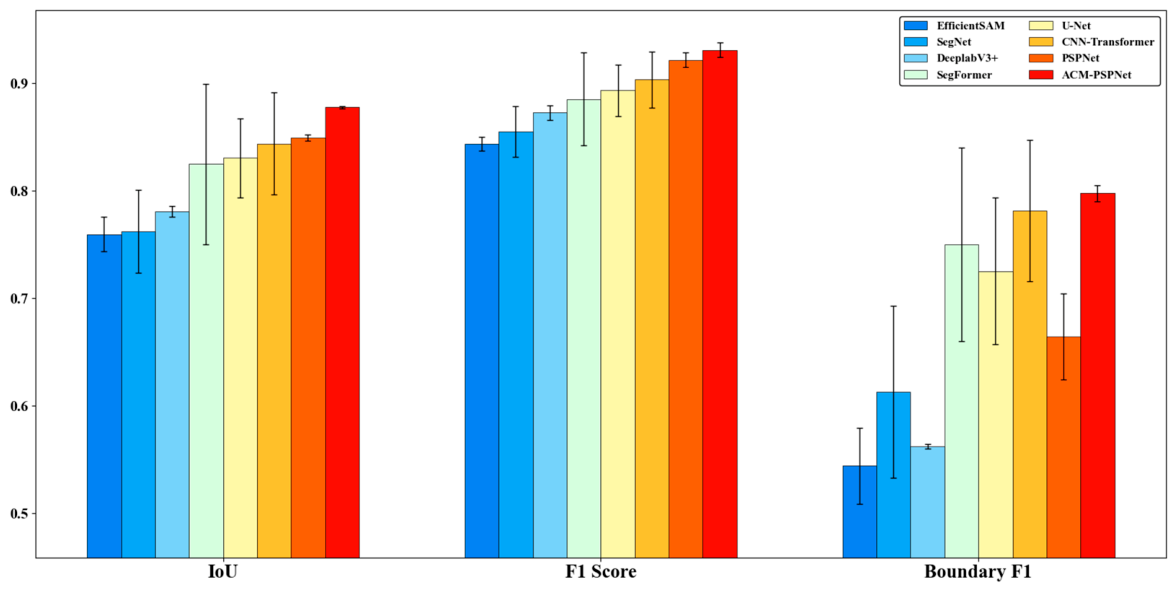
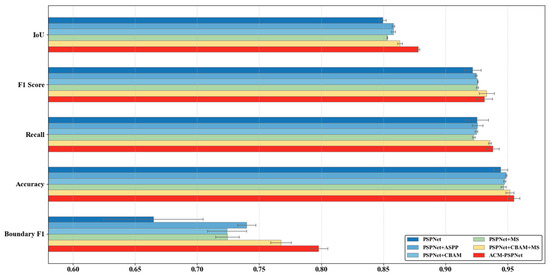
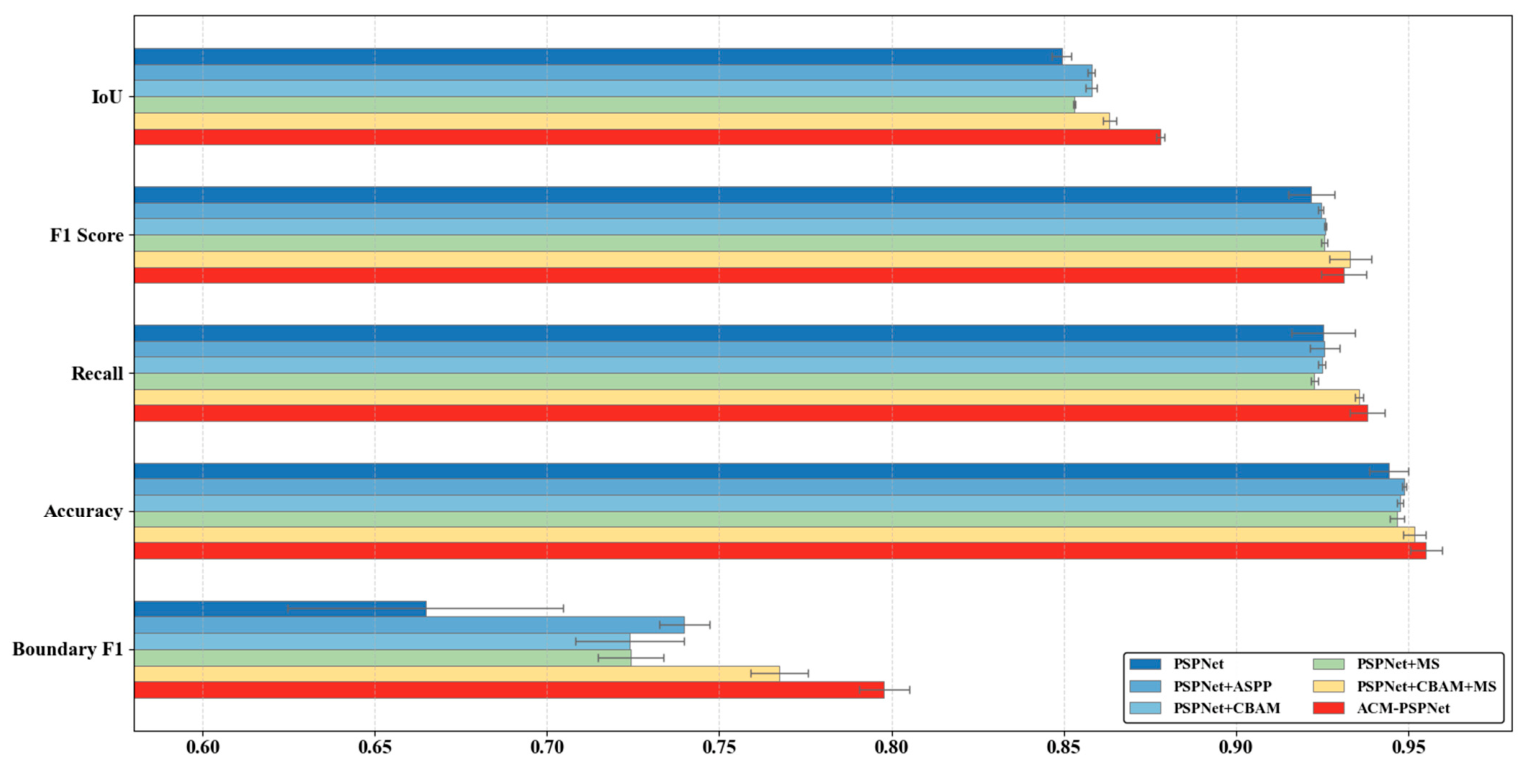
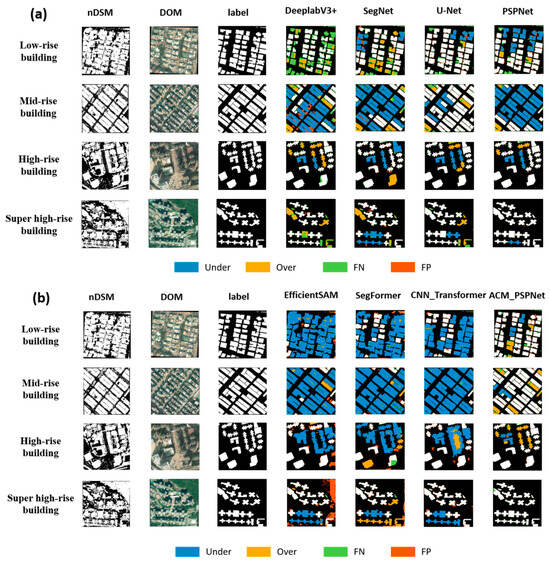
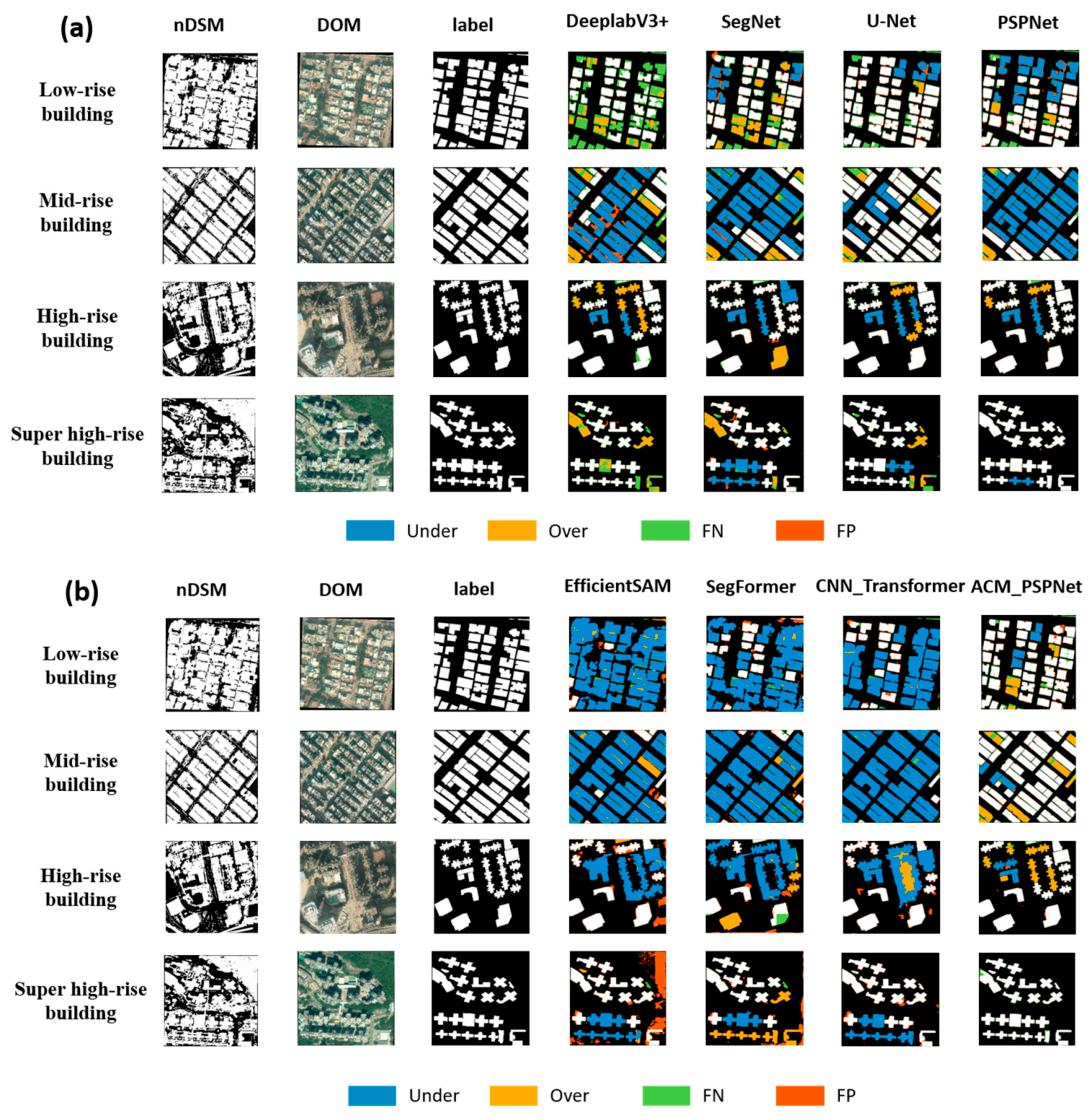
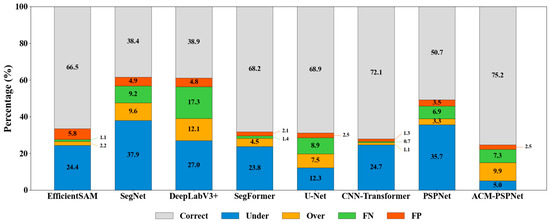
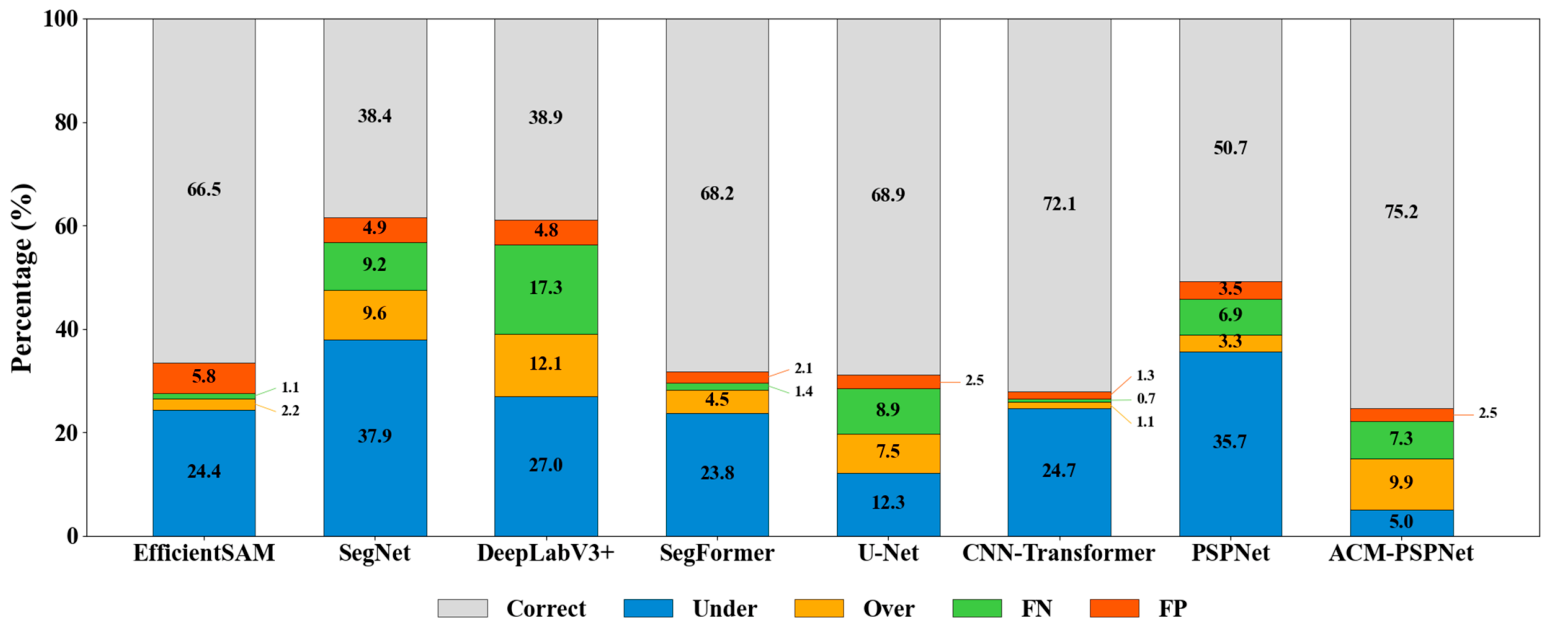
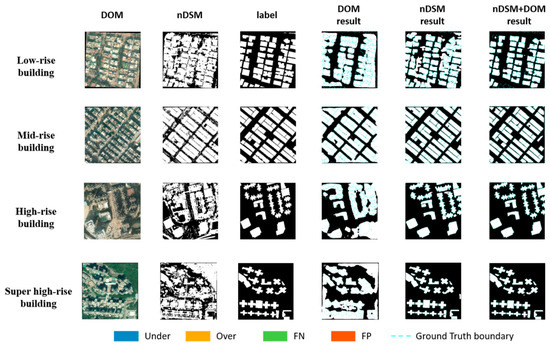
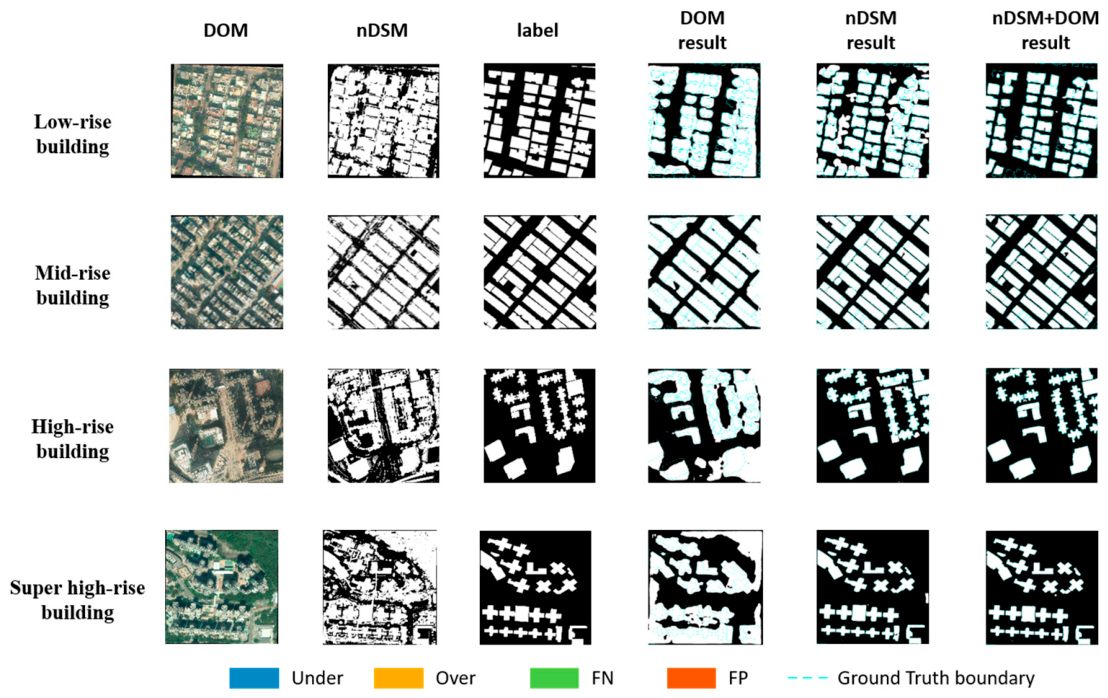
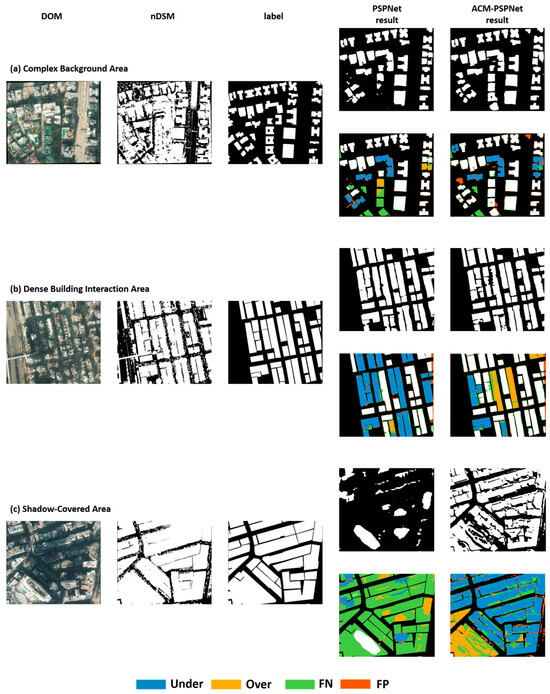
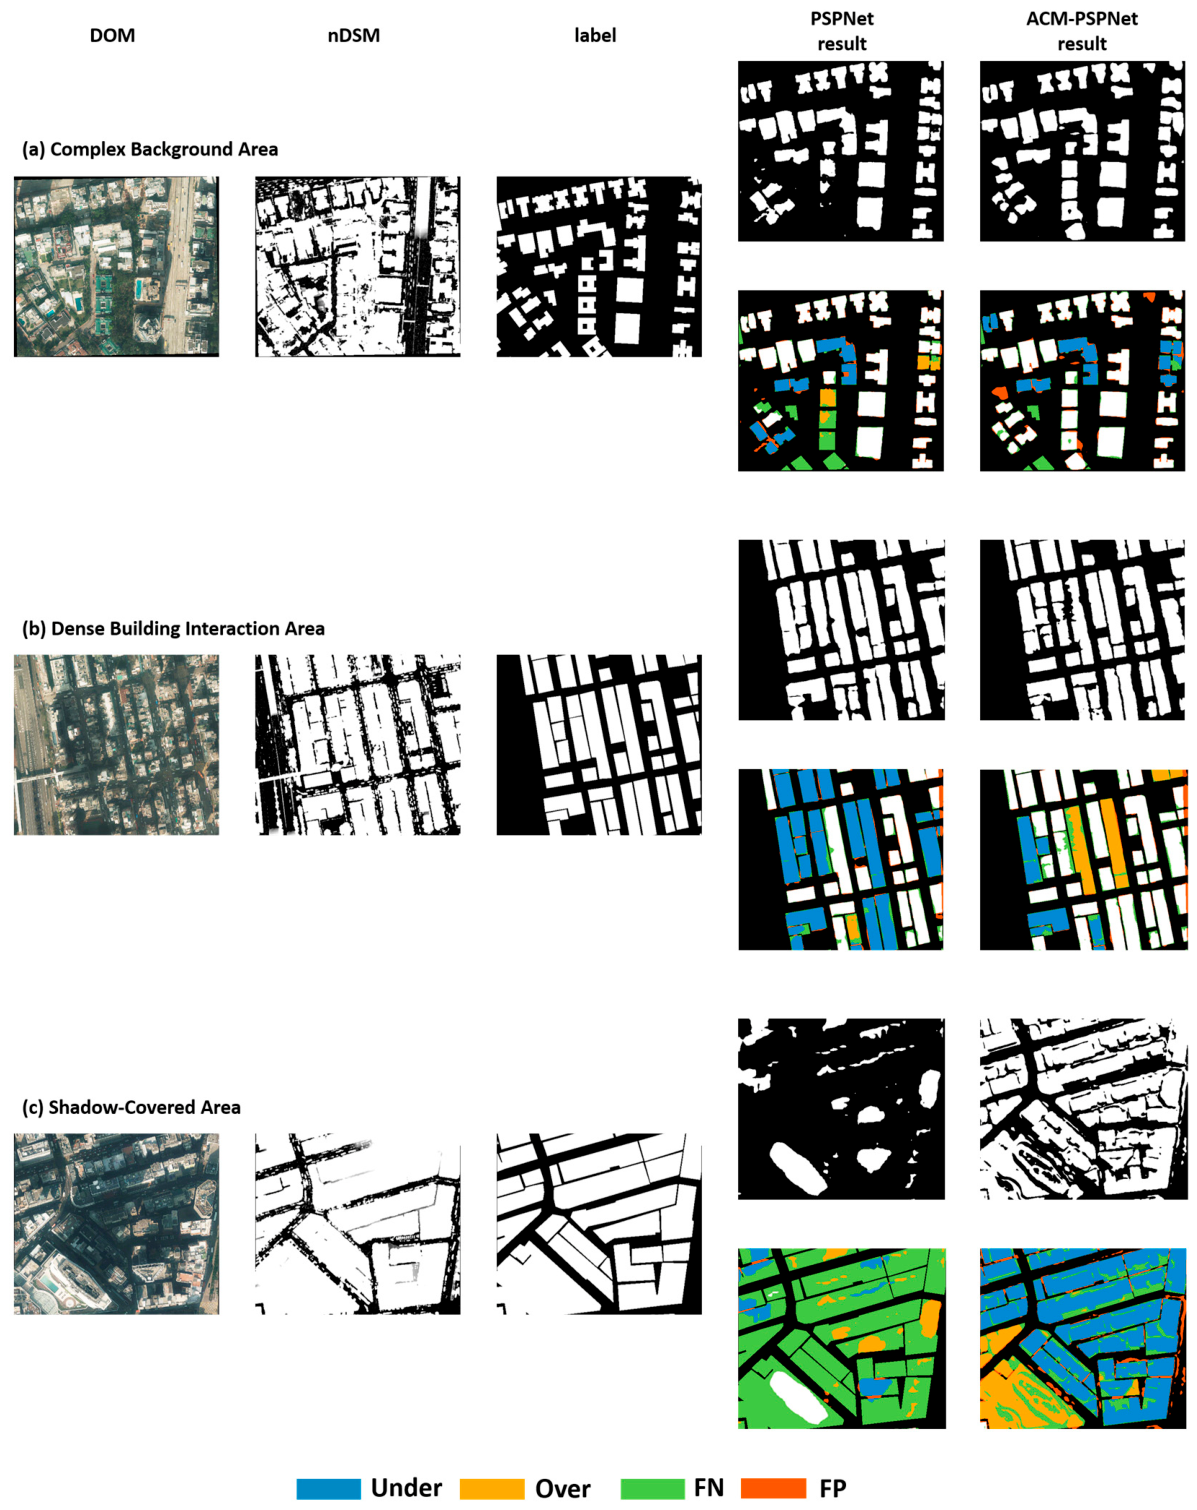

Disclaimer/Publisher’s Note: The statements, opinions and data contained in all publications are solely those of the individual author(s) and contributor(s) and not of MDPI and/or the editor(s). MDPI and/or the editor(s) disclaim responsibility for any injury to people or property resulting from any ideas, methods, instructions or products referred to in the content. |
© 2026 by the authors. Licensee MDPI, Basel, Switzerland. This article is an open access article distributed under the terms and conditions of the Creative Commons Attribution (CC BY) license.