Highlights
What are the main findings?
- High-resolution InSAR observations have finely characterized the spatial pattern of “overall stability and significant local deformation” in the Linfen-Yuncheng Basin, and revealed that groundwater exploitation is its main driving factor.
- Results show that there is a strong coupling relationship between the ground deformation process and groundwater exploitation dynamics, and there is a significant symbiotic development feature between subsidence and ground fissure, with a disaster chain effect.
What is the implication of the main finding?
- Quantitatively revealing the dynamic coupling law between ground deformation and groundwater exploitation in the Linfen-Yuncheng Basin, providing scientific basis for elucidating the full chain feedback mechanism of “groundwater exploitation-ground deformation-geological hazards”.
- The main finding provides direct decision-making basis for effectively addressing geological risks such as ground subsidence, optimizing water resource management plans, and evaluating the effectiveness of groundwater overexploitation control.
Abstract
The comprehensive, accurate, and rapid acquisition of large-scale surface deformation using Interferometric Synthetic Aperture Radar (InSAR) technology provides crucial information support for regional eco-geological safety assessments and the rational development and utilization of groundwater resources. The Linfen-Yuncheng Basin in Shanxi Province is one of China’s historically most frequented regions for geological hazards in plain areas, such as land subsidence and ground fissures. This study employed the coherent point targets based Small Baseline Subset (SBAS) time-series InSAR technique to interpret a dataset of 224 scenes of 5 m resolution RADARSAT-2 satellite SAR images acquired from January 2017 to May 2024. This enabled the acquisition of high-resolution spatiotemporal characteristics of surface deformation in the Linfen-Yuncheng Basin during the monitoring period. The results show that the area with a deformation rate exceeding 5 mm/a in the study area accounts for 12.3% of the total area, among which the subsidence area accounts for 11.1% and the uplift area accounts for 1.2%, indicating that the overall surface is relatively stable. There are four relatively significant local subsidence areas in the study area. The total area with a rate exceeding 30 mm/a is 41.12 km2, and the maximum cumulative subsidence is close to 810 mm. By combining high-resolution satellite images and field survey data, it is found that the causes of the four subsidence areas are all the extraction of groundwater for production, living, and agricultural irrigation. This conclusion is further confirmed by comparing the InSAR monitoring results with the groundwater level data of monitoring wells. In addition, on-site investigations reveal that there is a mutually promoting and spatially symbiotic relationship between land subsidence and ground fissures in the study area. The non-uniform subsidence areas monitored by InSAR show significant ground fissure activity characteristics. The InSAR monitoring results can be used to guide the identification and analysis of ground fissure disasters. This study also finds that due to the implementation of surface water supply projects, the demand for groundwater in the study area has been continuously decreasing. The problem of ground water over-extraction has been gradually alleviated, which in turn promotes the continuous recovery of the groundwater level and reduces the development intensity of land subsidence and ground fissures.
1. Introduction
With the surge in global water resource demand, overexploitation of groundwater has become a critical issue threatening ecological security and sustainable development. The Linfen-Yuncheng Basin in Shanxi, an important industrial and agricultural base in northern China, suffers from a shortage of surface water resources. The per capita water resource availability is extremely low, only one-seventh of the national average, which causes the region to be highly dependent on groundwater as the main water supply source [1,2,3]. The area of the groundwater over-exploitation zone in the Linfen-Yuncheng Basin reaches up to 4065 km2, among which the area of the severely overexploited zone is 725 km2. Groundwater over-exploitation not only directly leads to water-level decline, aquifer depletion, and water quality deterioration, but also exacerbates the risk of geological disasters through land surface deformation, posing a continuous threat to regional ecological security and social-economic development [4,5,6,7,8,9].
Traditional Differential InSAR(D-InSAR) technology faces numerous challenges in practical applications, such as spatiotemporal decorrelation, atmospheric delay interference, and topographic error effects. These problems greatly limit its monitoring accuracy and scope [10,11,12]. Time series InSAR technology can effectively overcome these limitations. Firstly, for the problem of spatiotemporal decoherence, stability analysis can be performed on multi-temporal SAR amplitude images and differential interferometric phases to extract high-quality coherent point targets as carriers for obtaining surface deformation information; Secondly, based on the relationship between topographic errors and interference on spatial vertical baselines, accurately estimate terrain residuals through solution space search and remove them; The atmospheric delay can be suppressed through spatiotemporal filtering, and the surface deformation information of coherent point targets can be accurately extracted [13,14]. By optimizing the spatial resolution of the SAR image set and reasonably adjusting the sampling period, time-series InSAR technology can more sensitively capture subtle changes in land surface deformation information in both temporal and spatial dimensions. In the time-series InSAR technology system, SBAS-InSAR and Permanent Scatterer InSAR (PS-InSAR) are two representative technical forms. SBAS-InSAR conducts time-series analysis of the interferometric phase based on the short spatiotemporal baseline criterion, significantly increasing the density of spatial coherent points for deformation monitoring, thus enabling a more comprehensive and detailed acquisition of land surface deformation information [15,16,17,18]; PS-InSAR focuses on extracting permanent scatterer targets with high stability of the interferometric phase and uses these targets to calculate high-precision time-series deformation information [19,20,21,22]. Time-series InSAR technology provides a methodological support for the acquisition and research of the spatiotemporal evolution characteristics of geological disasters such as land subsidence and ground fissures (i.e., linear cracks or openings that form on the Earth’s surface, caused by geological events like earthquakes, land subsidence, volcanic activity, or human activities such as mining) [23,24,25,26].
In previous years, some scholars conducted certain studies on the characteristics and development mechanisms of land surface deformation in the Linfen-Yuncheng Basin using InSAR technology. Zhao et al. (2015) monitored the small-scale ground fissure deformation in the Yuncheng Basin using the PS-InSAR method and discovered different spatial deformation gradients of ground fissures [27]; Yang et al. (2016) obtained the land surface deformation characteristics of the Linfen-Yuncheng Basin using ENVISAT ASAR images from 2009 to 2010 and found that the abnormal deformation in this region was mainly related to groundwater extraction [28]; Zhao et al. (2019) calculated and obtained the spatiotemporal deformation characteristics of the Linfen-Yuncheng Basin from 2007 to 2011 using ALOS/PALSAR satellite data and discussed the surface deformation mechanisms of large-scale Zhongtiao Mountain faults, medium-scale basin land subsidence, and small-scale ground fissures [29]; Zhang (2019) evaluated the land surface deformation in the Yuncheng Basin from 2013 to 2015 using the PS-InSAR technology and discussed the interactions between ground fissure activities, land subsidence, groundwater, precipitation, and surrounding faults [30].
Although the above-mentioned studies have revealed the development characteristics and causes of land surface deformation in the Linfen-Yuncheng Basin over a certain period, considering that the land surface deformation in this region is in a rapid-change process and is highly complex, further research is needed in terms of observation timeliness and wide-area refined monitoring. In addition, existing research results tend to focus more on analyzing the relationship between ground fissures and fault structures, without in-depth analysis of the driving factors of land subsidence and its relationship with ground fissures in combination with groundwater observation data. In this study, based on the advantages of high-resolution InSAR remote sensing technology, including full spatial coverage, long-term continuous observation, and high-precision monitoring, we used the Stanford Method for Persistent Scatterers (StaMPS) algorithm to process the 5 m resolution time-series SAR image set of RADARSAT-2 satellite from January 2017 to May 2025. For the first time, we obtained high-precision surface deformation fields and deformation evolution processes of key subsidence areas in the Linfen-Yuncheng Basin for over 8 years. Through cross validation with Leveling data, we ensured the reliability and accuracy of InSAR monitoring results. The obtained high-resolution deformation field clearly reveals the symbiotic relationship between ground subsidence and ground fissure disasters. Combined with field investigation data, the distribution pattern, correlation, and impact range of the disaster chain are further determined. Based on long-term continuous deformation observation data, this study evaluated the activity and evolution trend of ground subsidence and ground fissures, and quantitatively revealed the coupling mechanism between surface deformation process and groundwater exploitation dynamics by combining with groundwater exploitation data. By integrating field investigation results with regional groundwater management policy data, the main driving factors of surface deformation and disaster development in the study area were comprehensively analyzed. The research results not only deepen the understanding of the mutual feedback mechanism of “groundwater exploitation-surface deformation-geological hazards”, but also provide important research support for regional geological hazard prevention and control, rational exploitation of water resources, and evaluation of the effectiveness of over-exploitation area management.
2. Materials and Methods
2.1. Study Area
The Linfen-Yuncheng Basin is located in the southern part of Shanxi Province, in the middle reaches of the Yellow River and the lower reaches of the Fen River. It has an altitude ranging from 400 to 1000 m, with an average annual precipitation of about 600 mm, and a total area of 11,000 square kilometers. The basin has clear geographical boundaries. The Yellow River forms its western boundary, the Zhongtiao Mountains mark its southern boundary, it is separated from the Taiyuan Basin by the Hanxin Ridge in the north, and it is surrounded by the Taiyue Mountains and the Taihang Mountains in the east. The whole area is surrounded by mountains and rivers, and its geographical environment is relatively independent (Figure 1). Structurally, the Linfen-Yuncheng Basin is a typical faulted basin in the Fenwei Graben System, located in the southern part of the Shanxi Graben System. The Huoshan-Fushan Uplift Belt lies to its east, and it is connected to the Lüliang Mountain Uplift Belt in the west. The south-eastern boundary is the major fault in front of the Zhongtiao Mountains, which extends in a north-northeast direction. The basin is further divided into eight secondary structural units from north to south, including the Huozhou Platform, Linfen Depression, Ta’er Mountain Subsidence-Uplift, Houma Depression, Jiwang Mountain Subsidence-Uplift, Hejin Depression, Emei Platform, and Yuncheng Depression [31,32,33]. The Linfen-Yuncheng Basin has complex and diverse landforms. The Emei Platform serves as the boundary in the north, and the Zhongtiao Mountains act as a natural barrier in the south, forming a long and narrow basin from north to south [34]. Land subsidence and ground fissure disasters in the study area have been occurring continuously since the 1950s. With the intensification of groundwater extraction activities, these disasters have been developing at an accelerated pace. There are more than 200 ground fissures in total, and the areas with concentrated development of ground fissures are mainly distributed in counties and districts such as Xia County, Jiang County, Xinjiang County, and Yaodu District [35,36,37,38].
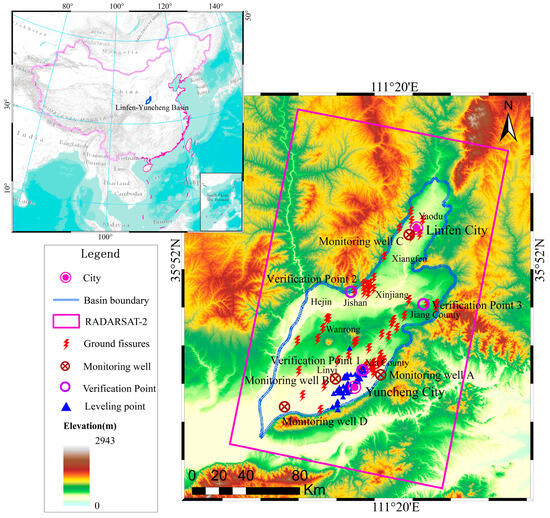
Figure 1.
Geographical location and data information used in the research area.
2.2. Dataset
RADARSAT-2 satellite is launched and operated by MDA Corporation. At the end of 2014, the company optimized the satellite imaging process on the basis of the original interferometric wide mode, and then launched the Extra Fine (XF) imaging mode with a resolution of 5 m and a swath width of 125 km, providing a rich source of high-quality data for InSAR monitoring. To study the refined spatiotemporal characteristics of long-term surface deformation in the Linfen-Yuncheng Basin, this study used a time-series SAR dataset of 224 images (112 images/scene) composed of two standard map sheets from January 2017 to May 2025 in this mode. The orbital direction is descending, and the relevant satellite image parameters are shown in Table 1.

Table 1.
Parameters of RADARSAT-2 data.
2.3. Time Series InSAR Data Processing
2.3.1. SDFP-StaMPS
StaMPS is a highly applicable algorithm that employs a spatiotemporal coherence strategy to extract Slowly Decorrelating Filtered Pixels (SDFPs) and conduct phase analysis, enabling it to adapt to the identification and monitoring of surface deformation information under complex topographic conditions [39,40,41,42]. The algorithm utilizes N + 1 SAR images covering the study area, comprehensively considering factors such as temporal baseline, spatial baseline, and Doppler centroid to select one image as the master image, and generates M interferograms. After removing the flat-earth phase and topographic phase, the phase of the i-th pixel in the k-th differential interferometric pair can be expressed as:
where is the deformation phase in the radar’s viewing direction; represents the residual terrain phase error introduced for external DEM errors; stands for atmospheric delay error; is phase error caused by inaccurate satellite orbit; refers to the other noise phases, such as thermal noise, body scattering variation errors, and errors introduced in data processing. The amplitude difference dispersion index can be used to preliminarily select SDFPs with good coherence quality [43,44], and then use spatiotemporal correlation coefficients to screen the initial pixel targets. The spatiotemporal correlation coefficient is defined as follows:
wherein, is the estimation of residual topographic phase; can be used to measure pixel phase stability and serve as a reference for the refinement of SDFPs. After completing the DEM error estimation, the corrected interferometric phase is obtained:
In the equation, represents the residual error caused by inaccurate estimation of . Since spatially correlated DEM errors between adjacent SDFPs exhibit minimal variations, the impact of this term on the unwrapping error can be neglected. Subsequently, phase unwrapping is performed. Leveraging the differences in spatiotemporal spectral characteristics among atmospheric, orbital, and deformation signals, spatiotemporal filtering is applied to the unwrapped phase. This enables effective separation of deformation signals from noise, achieving the goal of deformation feature extraction [45,46,47].
The nonlinear deformation phase can be used to obtain the nonlinear deformation of each SDFP at different time periods. By combining the obtained nonlinear deformation with the linear deformation rate, the total deformation of each SDFP point at different time periods can be obtained.
2.3.2. Processing Flow
In this study, the key processing of the time-series SAR image set includes the following steps: (1) Calculating the spatiotemporal baseline of the SAR image set, considering the acquisition season of the SAR image, selecting the image on 23 November 2020 as the master image, and registering the remaining images with it to ensure that the distance and azimuth registration errors of all images are better than one tenth of a pixel. (2) Establish the mapping relationship between SAR image coordinate system and geographic coordinate system using Copernicus DEM (COP-DEM) with a resolution of 30 m, convert DEM to radar coordinate system, and remove terrain phase. (3) A connected small baseline network was used to generate interferometric combinations. Based on the spatiotemporal baseline characteristics of SAR images used in this study, the spatiotemporal baseline thresholds were set to 90 days and 300 m, resulting in a total of 253 interferometric pairs. The configuration of the generated small baseline network is shown in Figure 2. To suppress speckle noise, improve the intuitiveness of SAR images, and maximize the resolution of the images, a multi-look ratio of 1 (distance direction): 2 (azimuth direction) is used to generate small baseline interferograms. (4) StaMPS Version 4.1b was used to perform phase analysis on the differential interferometric pairs. After small area testing, the amplitude difference dispersion index initial selection point threshold was set to 0.6, and the initial SDFP points were subjected to spatiotemporal filtering to remove spatial uncorrelated look angle errors while refining the initial selection points, resulting in approximately 28 million SDFPs. (5) Based on the spatiotemporal characteristics of surface deformation in the study area, time and spatial domain filtering windows were set to 90 days and 200 m, respectively, to eliminate atmospheric interference phases and ultimately obtain complete surface deformation information in the study area. Prior to spatiotemporal filtering, the TRAIN atmospheric processing package was applied to model the elevation-dependent phase in the unwrapped interferograms to remove topography-related atmospheric delays.
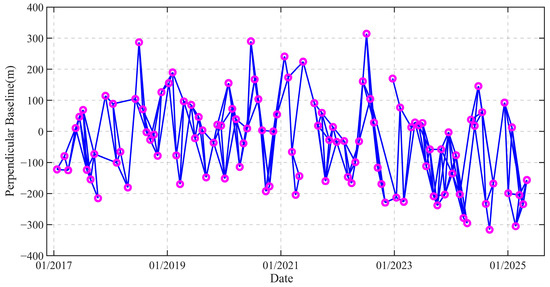
Figure 2.
Small baseline interferometric network configuration. (pink represents SAR images, blue represents interferometric pairs).
3. Results
3.1. Precision Validation
This study collected a total of 43 s-class Leveling observation data from Yanhu District, Yuncheng City from 2017 to 2024. The measurement accuracy of field data meets the monitoring standards of ±1.0 mm for accidental mean square error per kilometer and ±2.0 mm for total mean square error per kilometer of Leveling measurement. The observation accuracy is higher than InSAR. Therefore, field data is used as the ground deformation true value to verify the InSAR monitoring results. Using a search radius of 50 m, InSAR coherent point targets near each leveling marker point were searched for observation value comparison. A total of 37 pairs of Leveling-InSAR points with the same name were found, and the comparison results are shown in Table 2. The maximum point deformation difference between the two is 5.53 mm/a, the minimum is 0.11 mm/a.
Table 2.
Leveling-InSAR observations.
To quantitatively verify the accuracy of InSAR monitoring results in this study, we first conducted a least squares regression analysis from a mathematical analysis perspective, using the following linear regression model:
Among them, x represents InSAR observation values; y represents the leveling observation value; and α and β are unknown parameters that define the offset and linear trend. The analysis results are shown in Figure 3, and the linear deviation between the two is about 15%, with R2 reaching 0.9, indicating a high consistency between leveling and InSAR.
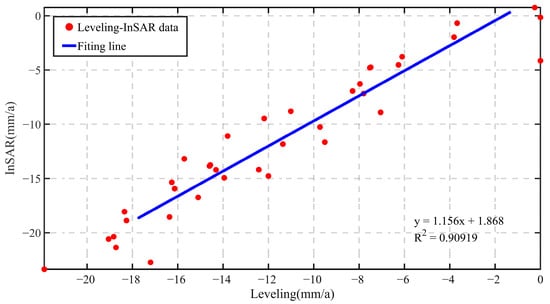
Figure 3.
Comparison between Leveling measurement and InSAR observation.
To further analyze the statistical error of InSAR measurement, the unbiased estimation of the error between Leveling and InSAR is used as the indicator to test the accuracy of InSAR measurement. The formula for calculating the mean square error is:
where represents the number of verification points; is the sum of squared differences between all leveling and InSAR points; and are the leveling and InSAR observation values, respectively. The analysis shows that is ±2.1 mm/a, further confirming the reliability of InSAR interpretation results in this study.
3.2. Overall Surface Deformation Characteristics
Through the processing of InSAR interpretation and accuracy assessment, the InSAR surface deformation rate of the study area from January 2017 to May 2025 was obtained as shown in Figure 4. In the figure, negative values indicate land subsidence, and positive values indicate surface uplift. Given that directly distinguishing between subsidence and uplift through positive and negative values may be affected by InSAR solution and calibration errors, a value of zero is not used to distinguish the sign of surface deformation in the figure. As can be seen from the figure, during the monitoring period, the entire surface of counties such as Yongji, Linyi, Wanrong, Hejin, Wenxi, Yaodu, and Hongtong in the Linfen-Yuncheng Basin was relatively stable. The total area of land subsidence regions with rates exceeding (including) 5 mm/a in the entire region was 1221.19 km2, accounting for approximately 11.1% of the total area. There are four main significant subsidence zones: the Yanhu-Xiaxian Subsidence Zone (A), the Jishan-Xinjiang Subsidence Zone (B), the Houma-Quwo-Jiangxian Subsidence Zone (C), and the Xiangfen Subsidence Zone (D). In terms of the spatial coverage of the subsidence zones, Subsidence Zone A has the largest extent, with an area exceeding (including) 5 mm/a reaching 851.71 km2; Zones B, C, and D are 82.69 km2, 36.67 km2, and 99.48 km2, respectively. The combined area of these four subsidence zones with rates exceeding (including) 5 mm/a accounts for 87.66% of the total area exceeding (including) 5 mm/a in the study area. The area of severe subsidence regions exceeding 30 mm/a totals 41.12 km2, all located within the above four subsidence zones. In terms of land subsidence rate values, the maximum subsidence is located in Dongyan Village, Beidong Town, Quwo County, within Zone C, reaching 97.1 mm/a; followed by Dongnandong Village, Beizhang Town, Xinjiang County, in Zone B, at 81.2 mm/a; the maximum subsidence rate in Zone A is near Shangxinzhuang Village, Nandali Town, Xiaxian County, at approximately 54 mm/a; and in Zone D, Chideng Village, Dadeng Town, Xiangfen County, is about 40 mm/a.
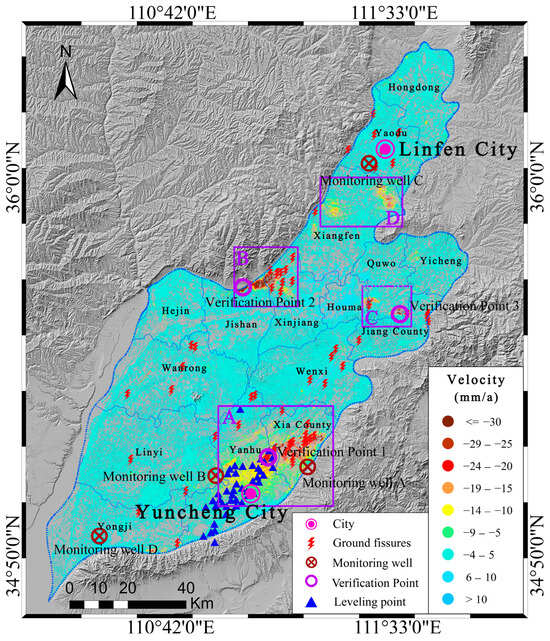
Figure 4.
Surface deformation rate map of research area.
3.3. Analysis of Spatiotemporal Characteristics of Major Subsidence Areas
To identify the causes of the main subsidence areas and grasp their subsidence development trends, a detailed analysis is conducted on the spatial distribution characteristics and temporal evolution process of the four subsidence areas mentioned above. The subsidence zone A extends northeast from Anyi Street in Yanhu District to Nandali Town in Xia County. Figure 5a shows the spatiotemporal characteristics of land subsidence development in this area. It can be seen that subsidence zone A develops in a combination of strip and funnel shapes, with significant non-uniform characteristics; Figure 5b shows that during the monitoring period, the overall subsidence in the area showed a linear development. There were signs of temporary subsidence slowdown in 2021, but it returned to pre-2021 levels after 2022. The cumulative subsidence at the three points reached 290 mm, 265 mm, and 320 mm, respectively. In the first half of 2025, the three points showed a slight slowing trend compared to 2024, with a year-on-year decrease of 10 mm in subsidence. Figure 5c1–c3 show high-resolution optical satellite images of the selected three subsidence feature points (P1–P3), with P1 located in Wuchao Village, Taocun Town; Point P2 is located in Xialiu Village, Yaofeng Town; the P3 point is located in Guoli Village, Yuwang Town. It can be seen that the main land features in the subsidence area are farmland and rural residential areas. It is speculated that the subsidence in this area is mainly caused by agricultural irrigation and the use of groundwater for residents’ daily life.
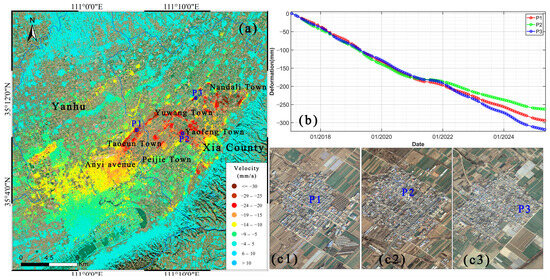
Figure 5.
(a) is the distribution of subsidence areas in Yanhu-Xia County; (b) is the time series deformation curve of P1–P3 points; (c1–c3) are optical satellite images near the P1–P3 points.
Subsidence zone B extends eastward from Xiaojiazhuang Village, Xishe Town, Jishan County to Beizhang Village, Beizhang Town. As shown in Figure 6a, this subsidence area is divided into two sub-subsidence areas. Point P4 in sub-subsidence area one is located at Shanxi Yangmei Fengxi Quanji Energy Co., Ltd. The deformation sequence of this point can be roughly divided into three stages. From 2017 to 2020, it was in a period of rapid subsidence, with a subsidence rate exceeding 110 mm/a. From 2021 to the first half of 2024, it was in a period of weakened subsidence, and the rate dropped to 35 mm/a. In the second half of 2024, there were signs of a slight rebound, with a rebound amount of about 10 mm. Points P5 and P6 are located in Liujiazhuang Village, Xishe Town and Lijiazhuang Village, Beizhang Town in sub-subsidence area two, respectively. The deformation development processes of these two points are quite similar to that of P4. The land subsidence developed linearly and rapidly from 2017 to 2020, with rates of 62 mm/a and 100 mm/a, respectively. After 2021, the subsidence rates gradually decreased to 22 mm/a and 15 mm/a, respectively, and the subsidence basically disappeared in 2025. It is speculated that in addition to being related to agricultural irrigation and domestic groundwater extraction by residents, the land subsidence in this area may also be related to groundwater extraction for factory production. Based on the development trends of the characteristic points, it is expected that the surface of this area will stabilize in the second half of 2025.
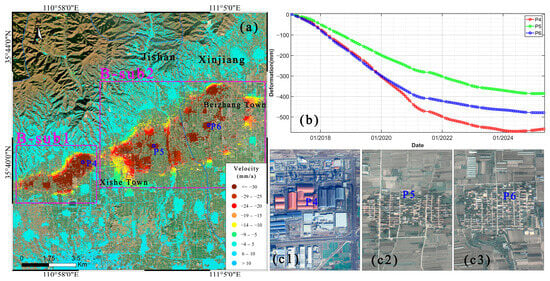
Figure 6.
(a) is the distribution of subsidence areas in Jishan-Xinjiang; (b) is the time series deformation curve of P4–P6 points.; (c1–c3) are optical satellite images near the P4–P6 points.
The spatial influence range of subsidence zone C is relatively small, but it also contains two sub-subsidence areas. One is located at the junction of Fengcheng Town in Houma County and Lechang Town in Quwo County; the other is at the junction of Beidong Town in Quwo County and Nanfan Town in Jiang County. Point P7 is located in Xihan Village, Fengcheng Town, which belongs to the first sub-subsidence area. Combined with Figure 7c, it can be seen that the subsidence here can be roughly divided into two stages. From 2017 to 2020, linear subsidence was the main development mode, with a rate of about 57 mm/a. After 2021, linear subsidence still dominated overall, but the rate decreased significantly compared with the previous stage, dropping to about 18 mm/a. Points P8 and P9 are located in Xiyan Village, Beidong Town and Jiyu Village, Nanfan Town, respectively. Although they belong to the same subsidence area, it can be seen from the deformation sequence curve that their development processes are quite different. The deformation process of point P8 can be divided into three stages (from 2017 to 2019, from 2019 to 2020, and after 2021). All three stages are mainly characterized by a linear trend, showing a development process of first accelerating and then slowing down. The rates in the three stages are 48 mm/a, 128 mm/a, and 52 mm/a, respectively. The deformation process of point P9 can be generally divided into two stages: a slow subsidence stage from 2017 to 2021 and an accelerated subsidence stage after 2022. The subsidence rate in the previous stage was 14 mm/a, and it reached 58 mm/a in the latter stage. It is speculated that the subsidence in this area is mainly caused by groundwater extraction for agricultural irrigation and domestic use by residents. All three characteristic points showed a slowing-down trend in the first half of 2025, and the land subsidence may further weaken in the second half of 2025.
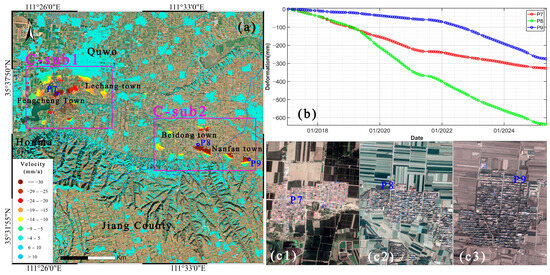
Figure 7.
(a) is the distribution of subsidence areas in Houma-Quqo-Jiang County; (b) is the time series deformation curve of P7–P9 points; (c1–c3) are optical satellite images near the P7–P9 points.
The subsidence zone D can be spatially divided into three sub subsidence zones, located in Fencheng Town (D_sub1), Gucheng Town (D_sub2), and Dadeng Town (D_sub3). The spatial impact of the three sub subsidence zones is not significant, and the maximum cumulative subsidence is less than 250 mm, with a lower severity than the first three (Figure 8). Among them, point P10 is located in a factory in Beigaoyi Village, Fencheng Town. The subsidence area was in a rapid subsidence stage from 2018 to 2021, with a rate of nearly 35 mm/a. After 2021, it was in a fluctuating deformation stage, mainly dominated by subsidence, and the subsidence rate decreased to within 10 mm/a during this stage; P11 point is located in the west of Guancun Village, Gucheng Town. The cumulative subsidence in this area is less than 150 mm, and the development of ground subsidence is expected to stop by 2025; The P12 point is located in Chideng Village, Dadeng Town, and the area exhibits a development characteristic of linear deformation and wave deformation superposition, with winter subsidence slowing down and summer subsidence accelerating. It is speculated that the subsidence in this area is mainly caused by agricultural irrigation and the use of groundwater by residents. It is expected that land subsidence will further slow down in the second half of 2025.
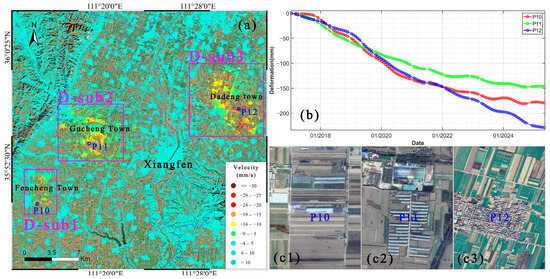
Figure 8.
(a) is the distribution of subsidence areas in Xiangfen County; (b) is the time series deformation curve of P10–P12 points; (c1–c3) are optical satellite images near the P10–P12 points.
4. Discussion
4.1. Analysis of the Relationship Between Surface Deformation and Ground Water Level Changes
The fluctuation of groundwater levels is the primary factor triggering surface deformation in plain areas. The spatiotemporal characteristics of subsidence zones and high-resolution optical satellite imagery indicate that surface deformation in the study area is closely related to groundwater extraction. To further validate this hypothesis, this study collected water level observation data from four groundwater monitoring wells from 2018 to 2024, with specific point distributions shown in monitoring wells A-D in Figure 1. InSAR shows subsidence near monitoring wells A and B, located within subsidence zone A. There is a slight uplift in InSAR monitoring results near the other two locations, located in Yongji County of Yuncheng City and Yaodu District of Linfen City. To analyze the relationship between surface deformation and groundwater level changes, each well was taken as the center. Considering the spatial continuity of groundwater level, a search radius of 200 m was set to extract the surface deformation of all coherent point targets within this range and calculate the mean. The obtained surface deformation time series was compared with groundwater level data, as shown in Figure 9. Monitoring Well A in Yaofeng Town, Xia County, Yuncheng City, demonstrated seasonal fluctuations in groundwater levels. Prior to May 2020, the water level experienced fluctuating declines reaching an 8 m drop, followed by rapid recovery after July 2021, with an 18 m increase by December 2024 compared to July 2021. InSAR temporal deformation curves revealed dominant subsidence (35 mm/year) before 2021, which significantly slowed down afterward, with a 10 mm rebound in 2022 and subsequent stabilization. Monitoring well B is located in Chuhou Town, Linyi County, Yuncheng City. The groundwater level at this point has shown a continuous downward trend, dropping from 94.2 m in January 2018 to 100.2 m in December 2024. It is not difficult to see that there were three significant periods of gradual water level decline in January 2018, January 2021, and January 2023. From the InSAR temporal deformation curve, it can be seen that the settlement at this point continues to develop, which is similar to the groundwater change curve. The deformation curve also has three obvious periods of gradual development, but lags behind the groundwater change curve in time. Monitoring Well C in Yaomiao Town, Yao Du District, Linfen City, exhibited gradual water level recovery (6 m cumulative increase) with pronounced seasonal variations (spring-summer decline, autumn-winter recovery). InSAR detected a 20 mm surface rebound, showing significant seasonal deformation consistent with groundwater fluctuations. Monitoring Well D in Chengbei Subdistrict, Yongji City (county-level city), Yuncheng City, demonstrated similar trends to Well C, with water levels rising from 28.4 m in January 2018 to 21.9 m in December 2024. InSAR observations aligned with groundwater trends, showing seasonal recovery with approximately 30 mm cumulative rebound.
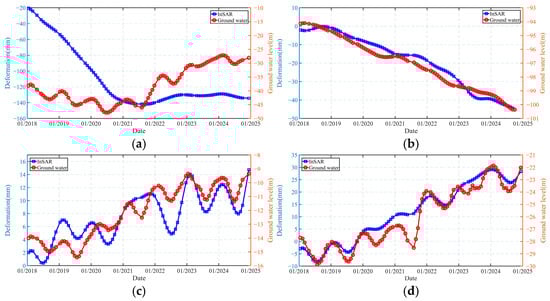
Figure 9.
InSAR and groundwater level comparison: (a) monitoring well A; (b) monitoring well B; (c) monitoring well C; (d) monitoring well D.
To quantitatively evaluate the strength of the correlation between the two, this study used Pearson correlation coefficient to calculate the correlation between the observation data of four groundwater monitoring wells and the corresponding surface deformation data at different locations. Considering the possible temporal lag effect between groundwater dynamics and surface deformation response, the groundwater level curve was slid and shifted with a step size of 24 days (i.e., SAR image sampling interval) during the analysis process, and its correlation coefficient with the surface deformation sequence was calculated sequentially. The maximum correlation coefficient obtained during the sliding process is used as the basis for determining the degree of correlation between the two, and based on this, the lag time of surface deformation relative to changes in groundwater level is determined. Quantitative correlation analysis shows that the maximum Pearson correlation coefficients between groundwater levels and surface deformation at the four monitoring points are 0.76, 0.96, 0.79, and 0.95, respectively, confirming a significant correlation between the two. In response to the Non-monotonic trend of “first decreasing and then increasing” in the data of the first monitoring well, in order to avoid the possibility of underestimating the correlation caused by this, this study adopted a strategy of calculating in stages and then taking the average. In terms of temporal lag, except for the response lag of the second monitoring well, which is up to 6 steps (120–168 days), the deformation lag of all other well positions is within 1 step (less than 24 days). The longer lag of the second monitoring well is mainly related to the depth of groundwater level, and an increase in depth will prolong the time for water pressure to be transmitted to the surface, thereby enhancing the lag effect and weakening the synchronization with surface deformation.
4.2. Analysis of the Relationship Between Surface Deformation and Ground Fissure Activity
By comparing the groundwater level data from the aforementioned four monitoring wells with the InSAR monitoring results, we observe a good trend consistency between the two datasets. This indicates that the primary cause of ground subsidence within the study area is indeed associated with groundwater extraction. As groundwater levels rebound, the land surface first exhibits a gradual deceleration of subsidence, followed by a slight uplift before reaching a stable state. According to field investigations (Figure 10), the Linfen-Yuncheng Basin has been actively implementing measures to address over-exploitation of groundwater and regulate illegal water extraction in recent years. These efforts include constructing Yellow River water diversion projects to replace groundwater extraction for domestic, industrial, and agricultural water needs, resulting in a significant reduction in total groundwater extraction and effective containment of ground subsidence. However, field surveys also revealed that some rural households and farmland areas still maintain numerous self-dug wells, primarily extracting unconfined aquifer water (within 40 m depth). Therefore, continued monitoring of surface deformation trends remains critical to ensure sustainable groundwater management.
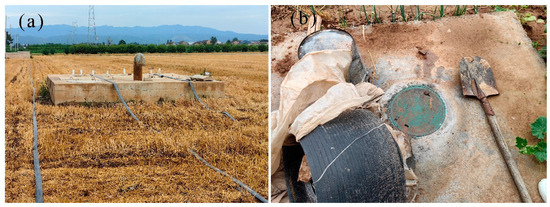
Figure 10.
(a) Yellow River irrigation facilities; (b) farmers’ self-use wells.
The ground fissures in the Linfen-Yuncheng Basin are characterized by early development, wide distribution, and high potential for damage. They are controlled by fault structures and induced by groundwater extraction [48,49,50,51,52,53]. By overlaying the historical spatial distribution of ground fissures with the InSAR monitoring results (Figure 11), it can be seen that there was basically no land subsidence at the sporadically developed historical ground fissure locations during the monitoring period. In contrast, the intensively developed historical ground fissure areas were concentrated in subsidence zones A and B. From this, it can be inferred that surface deformation in the study area is accompanied by ground fissures, and new ground fissures are likely to form at locations with non-uniform surface subsidence. To confirm this, this study selected three typical points with differential subsidence for field investigations.
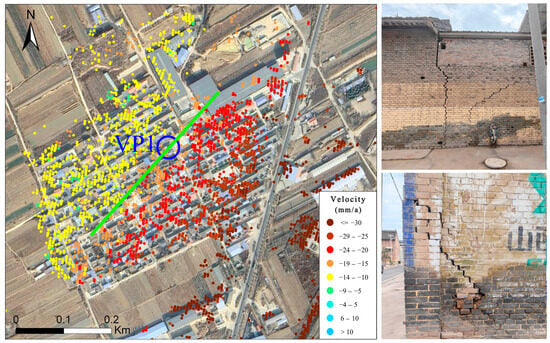
Figure 11.
Field verification of typical fissure development at VP1.
The investigation results are shown in Figure 11, Figure 12 and Figure 13. Verification Point (VP) 1 is located in Banpo Village, Yanhu District, Yuncheng City. The differentially subsided area interpreted by InSAR (green line) develops at an angle of approximately 45° north-by-east. The subsidence difference between the two sides of this area at a distance of about 100 m apart is approximately 10 mm/a. Field investigations revealed a significantly developed medium-sized ground fissure near VP1. This newly formed ground fissure has been listed as a potential geological hazard site by the local government. Its overall trend is 50° north-by-east, which is highly consistent with the InSAR monitoring results. Tensile cracks with a “wider-top and narrower-bottom” shape and “eight-shaped” oblique cracks are common on the surfaces of nearby houses. Some severely damaged houses have been evacuated.
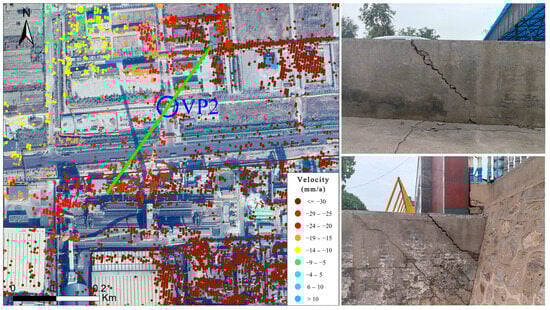
Figure 12.
Field verification of typical fissure development at VP2.
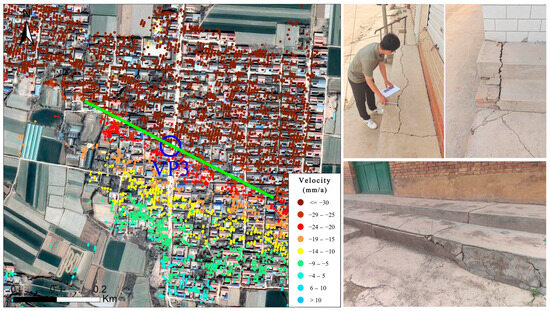
Figure 13.
Field verification of typical fissure development at VP3.
VP2 is located at Lu’an Fengxi Quanji Energy Co., Ltd. in Jishan County, Yuncheng City. The differentially subsided area interpreted by InSAR (green line) develops at an angle of approximately 40° north-by-east. The subsidence difference between the two sides of this area at a distance of about 100 m apart is approximately 8 mm/a. Field investigations found multiple inverted “eight-shaped” oblique cracks on the steps in front of the company’s gate, and the enclosure wall was severely damaged, indicating obvious ground fissure development characteristics.
VP3 is located in Dongyan Village, Quwo County, Yuncheng City. Different from the previous two points, the differentially subsided area here develops at an angle of 60° north-by-west. The subsidence difference between the two sides of this area at a distance of about 100 m apart is approximately 13 mm/a. Field investigations showed that the steps in front of many rural houses had continuous fractures longer than 10 m. Most of the surface cracks were oriented east–west. There were also signs of large-scale renovation of houses in this village in recent years.
Through field investigations, it was found that areas with significant differential subsidence detected by InSAR showed signs of building damage, including obvious fractures and damages. This indicates that there is a mutually reinforcing and spatially symbiotic relationship between ground subsidence and ground fissures in the study area. By analyzing the non-uniform settlement characteristics of InSAR monitoring results, it can guide the rapid and accurate identification of ground fissure disasters and reduce their threat to human life and property.
4.3. Analysis of the Relationship Between Surface Deformation and Fault Distribution
The Linfen-Yuncheng Basin is located in the southern segment of the Fenwei Fault Zone, and its structural pattern is controlled by multiple active faults. This spatial configuration necessitates the consideration of both groundwater extraction and tectonic fault activity as potential contributors to ground deformation. The overlay of the main fault zones on the deformation rate map (Figure 14) reveals that the Luoyunshan Piedmont Fault, the Emei Terrance Margin Fault, and the Dayang Fault intersect localized subsidence zones B, C, and D, respectively. However, the correlation is not significant when considering the fault orientations and the spatial morphology of the subsidence zones. While no major fault transects the subsidence zone A, its spatial orientation is consistent with the Linyi Fault, suggesting a potential influence from smaller, local faults associated with it. Future work will involve a detailed investigation of this area.
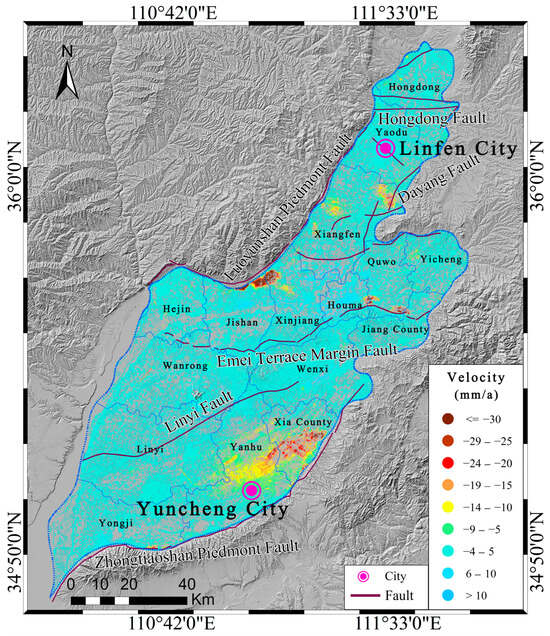
Figure 14.
Overlay of fault distribution and deformation rate.
5. Conclusions
This study used the RADARSAT-2 satellite 5 m resolution SAR image set from January 2017 to May 2025, and employed SDFP-StaMPS InSAR method to obtain detailed spatiotemporal information on long-term surface deformation in the Linfen-Yuncheng Basin, Shanxi Province. The InSAR monitoring results were compared and evaluated for accuracy and system offset correction using 43 s-order Leveling measurement data obtained during the same period, verifying the reliability of surface deformation information calculation. The research results indicate that the high-resolution long-term InSAR surface deformation monitoring method can efficiently and accurately obtain the dynamic evolution process of surface deformation in plain areas, and finely characterize the spatial distribution characteristics of deformation. During the monitoring period, the subsidence area exceeding 5 mm/a in the research area accounted for 11.1% of the total area, and there were four significant settlement areas, accounting for 87.7% of the total settlement area. Based on high-resolution optical satellite images and field investigations, it was found that the land features in the subsidence area mainly include farmland, rural residential areas, and factories, with no mining or large-scale construction activities. The main driving factor for land subsidence is the excessive exploitation of groundwater. We compared and analyzed the InSAR monitoring results with groundwater level data from four monitoring wells, and found a good correlation between the two. The surface deformation observed by InSAR is a comprehensive reflection of the water level status of all underground aquifers, and is particularly sensitive to changes in shallow groundwater in the study area. In terms of the correlation analysis between surface deformation and ground fissure activity, we found through field investigations that there are significant signs of ground fissure activity in typical non-uniform subsidence areas in the study area. Compared with ground subsidence, the local non-uniform deformation characteristics of ground fissures are more destructive to buildings. However, there is a symbiotic relationship between ground fissures and ground subsidence in the study area. By analyzing the non-uniform characteristics of ground subsidence, the spatial location of ground fissure development can be extracted, providing support for ground fissure disaster prevention and control. This indicates that the refined InSAR monitoring results have good application effects in identifying and monitoring ground fissures in plain areas. In terms of the development trend of ground subsidence in the research area, combined with InSAR monitoring results and field investigations, it was found that with the implementation of projects such as using Yellow River water instead of groundwater for agricultural irrigation and residential water security in the Linfen-Yuncheng Basin, the local excessive dependence on groundwater has been greatly reduced, and the demand for groundwater has been reduced. Therefore, ground subsidence has gradually eased. However, field investigations also found that some villages in the monitoring area still have some unauthorized drilling and pumping of groundwater for irrigating fruit trees, vegetables, and meeting household needs. The development of surface deformation is still complex. In the future, we will combine model decomposition to carry out trend prediction and continue to track the development characteristics of surface deformation in the research area.
Author Contributions
Conceptualization, Y.W. and L.C.; methodology Y.W., T.J. and Y.X.; software, Y.W. and Y.L.; validation, Y.W. and L.C.; formal analysis, Y.W. and Z.J.; investigation, Y.W. and L.C.; writing—original draft preparation, Y.W.; writing—review and editing, L.C., T.J., Y.X., Y.L. and Z.J.; funding acquisition, L.C. All authors have read and agreed to the published version of the manuscript.
Funding
This research was funded by Key Research and Development Fund of the Chinese Academy of Sciences (grant number E2H2010402).
Data Availability Statement
The data presented in this study are available on request from the corresponding author due to non-disclosure agreement.
Acknowledgments
The authors would like to thank ESA for providing the Copernicus DEM data and the authors of StaMPS for providing the free InSAR processing algorithms.
Conflicts of Interest
The authors declare no conflicts of interest.
References
- Li, H.L.; Li, D.M.; Li, Y.; Chen, Y.Q.; Chen, H.; Gao, Y.F.; Wei, K.Y. Segmentation Characteristics of Vertical Deformation of Main Faults in Shanxi Fault Depression Zone. Earthq. Res. China 2023, 39, 821–831. [Google Scholar] [CrossRef]
- Li, J.M. Division and Comprehensive Management Analysis of Groundwater Overexploitation Areas in Yuncheng City. Ground Water 2009, 31, 64–66. [Google Scholar] [CrossRef]
- Chen, S.X. Current Situation and Protection Measures of Groundwater Overexploitation in Linfen City. Shanxi Hydrotech. 2008, 2, 49–50. [Google Scholar] [CrossRef]
- Pan, Y.Z.; Gao, J.X.; He, P.; Nie, Y.H.; Li, D.Q. Assessment on Water Eco-Environment in Mid-Eastern China. Res. Environ. Sci. 2005, 18, 54–59. [Google Scholar] [CrossRef]
- Yang, H.F.; Meng, R.F.; Bao, X.L.; Cao, W.G.; Li, Z.Y.; Xu, B.Y. Assessment of Water Level Threshold for Groundwater Restoration and Over-exploitation Remediation the Beijing-Tianjin-Hebei Plain. J. Groundw. Sci. Eng. 2022, 10, 113–127. [Google Scholar] [CrossRef]
- Chai, Z.; UMUT, H.; Gou, X.H.; Luo, S.Z. Environmental Problems Caused by Excessive Exploitation of Groundwater at Chaiwopu Source in Xinjiang. Res. Soil Water Conserv. 2008, 15, 132–135. [Google Scholar]
- Wang, Y.Q.; Wang, Z.F.; Cheng, W.C. A Review on Land Subsidence Caused by Groundwater Withdrawal in Xi’an, China. Bull. Eng. Geol. Environ. 2018, 78, 2851–2863. [Google Scholar] [CrossRef]
- Wang, X.; Sun, L. Discussion on Geological Hazards Caused by Exploitation of Deep Groundwater in North China. In Engineering Geology for Society and Territory; Springer International Publishing: Cham, Germany, 2015. [Google Scholar] [CrossRef]
- Sharnagat, N.; Nema, A.K.; Mishra, P.K.; Patidar, N.; Kumar, R.; Suryawanshi, A.; Radha, L. State-of-the-Art Status of Google Earth Engine (GEE) Application in Land and Water Resource Management: A Scientometric Analysis. J. Geovis. Spat. Anal. 2025, 9, 16. [Google Scholar] [CrossRef]
- Gupta, S.; Sajith, V. Surface Displacement Studies Using Differential SAR Interferometry: An Overview. Int. Soc. Opt. Photonics 2006, 6412, 110–121. [Google Scholar] [CrossRef]
- Yao, G.Q.; Mu, J.Q. D-InSAR Technique for Land Subsidence Monitoring. Earth Sci. Front. 2008, 15, 239–243. [Google Scholar] [CrossRef]
- Thapa, S.; Chatterjee, R.; Kumar, D.; Singh, K.; Sengar, V. Advanced Subsidence Monitoring Using Persistent Scatterer Interferometry for Jharia Coal Field, Dhanbad, India. Proc. SPIE 2018, 10426, 105–110. [Google Scholar] [CrossRef]
- Ferretti, A.; Prati, C.; Rocca, F. Permanent Scatterers in SAR Interferometry. IEEE Trans. Geosci. Remote Sens. 2001, 39, 8–20. [Google Scholar] [CrossRef]
- Minh, D.H.T.; Hanssen, R.; Rocca, F. Radar Interferometry: 20 Years of Development in Time Series Techniques and Future Perspectives. Remote Sens. 2020, 12, 1364. [Google Scholar] [CrossRef]
- Tizzani, P.; Berardino, P.; Casu, F.; Euillades, P.; Manzo, M.; Ricciardi, G.P.; Zeni, G.; Lanari, R. Surface Deformation of Long Valley Caldera and Mono Basin, California, Investigated with the SBAS-InSAR Approach. Remote Sens. Environ. 2007, 108, 277–289. [Google Scholar] [CrossRef]
- Xu, B.; Feng, G.; Li, Z.; Wang, Q.; Xie, R. Coastal Subsidence Monitoring Associated with Land Reclamation Using the Point Target Based SBAS-InSAR Method: A Case Study of Shenzhen, China. Remote Sens. 2016, 8, 652. [Google Scholar] [CrossRef]
- Zhou, L.; Guo, J.; Hu, J.; Li, J.; Xu, Y.; Pan, Y.; Shi, M. Wuhan Surface Subsidence Analysis in 2015-2016 Based on Sentinel-1A Data by SBAS-InSAR. Remote Sens. 2017, 9, 982. [Google Scholar] [CrossRef]
- He, Y.; Li, X.; Yang, J.; Liu, Y.; Yang, G.; Hu, M.; Chen, S.; Yao, H.; Wang, L.; Xiong, X. Urban Land Subsidence Monitoring and Risk Assessment Using the Point Target Based SBAS-InSAR Method: A Case Study of Changsha City. Remote Sens. Lett. 2024, 15, 12. [Google Scholar] [CrossRef]
- Greif, V.; Vlcko, J. Monitoring of Post-failure Landslide Deformation by the PS-InSAR Technique at Lubietova in Central Slovakia. Environ. Earth Sci. 2012, 66, 1585–1595. [Google Scholar] [CrossRef]
- Sun, H.; Zhang, Q.; Zhao, C.Y.; Yang, C.S.; Sun, Q.; Chen, W. Monitoring Land Subsidence in the Southern Part of the Lower Liaohe Plain, China with a Multi-track PS-InSAR Technique. Remote Sens. Environ. 2017, 188, 73–84. [Google Scholar] [CrossRef]
- Li, F.; Liu, G.; Gong, H.; Chen, B.; Zhou, C. Assessing Land Subsidence-Inducing Factors in the Shandong Province, China, by Using PS-InSAR Measurements. Remote Sens. 2022, 14, 2875. [Google Scholar] [CrossRef]
- Zhang, M.; Pan, J.; Ma, P.F.; Lin, H. Identification and Analysis on Surface Deformation in the Urban Area of Nanchang Based on PS-InSAR Method. Remote Sens. 2025, 17, 157. [Google Scholar] [CrossRef]
- Hu, B.; Wang, H.S.; Sun, Y.L.; Hou, J.G.; Liang, J. Long-Term Land Subsidence Monitoring of Beijing (China) Using the Small Baseline Subset (SBAS) Technique. Remote Sens. 2014, 6, 3648–3661. [Google Scholar] [CrossRef]
- Yang, C.S.; Zhang, Q.; Zhang, C.Y.; Ji, L.Y. Small Baseline Subset InSAR Technology Used in Datong Basin Ground Subsidence, Fissure and Fault Zone Monitoring. Geomat. Inf. Sci. Wuhan Univ. 2014, 39, 945–950. [Google Scholar] [CrossRef]
- Zhao, C.Y. Deformation Monitoring of Ground Fissure with SAR Interferometry in Qingxu, Shanxi Province. J. Eng. Geology. 2011, 19, 70–75. [Google Scholar] [CrossRef]
- Qu, F.; Zhang, Q.; Lu, Z.; Zhao, C.Y.; Zhang, J. Land Subsidence and Ground Fissures in Xi’an, China 2005-2012 Revealed by Multi-band InSAR Time-Series Analysis. Remote Sens. Environ. 2014, 155, 366–376. [Google Scholar] [CrossRef]
- Zhao, C.Y.; Zhang, Q.; Yang, C.S.; Zhang, J.; Zhu, W.; Qu, F.; Liu, Y. Different Scale Land Subsidence and Ground Fissure Monitoring with Multiple InSAR Techniques over Fenwei Basin, China. PIAHS 2015, 372, 305–309. [Google Scholar] [CrossRef]
- Yang, C.S.; Zhang, Q.; Xu, Q.; Zhao, C.Y.; Peng, J.B.; Ji, L.Y. Complex Deformation Monitoring over the Linfen–Yuncheng Basin (China) with Time Series InSAR Technology. Remote Sens. 2016, 8, 284. [Google Scholar] [CrossRef]
- Zhao, C.Y.; Liu, C.; Zhang, Q.; Lu, Z.; Yang, C.S. Deformation of Linfen–Yuncheng Basin (China) and Its Mechanisms Revealed by Π-RATE InSAR Technique. Remote Sens. Environ. 2018, 218, 221–230. [Google Scholar] [CrossRef]
- Zhang, F. InSAR Monitoring and Mechanism Analysis of Ground Fissure Activity in Yuncheng Basin. Master’s Thesis, Chang’an University, Chang’an, China, 2019. [Google Scholar]
- Si, Q.H.; Zeng, W.; Liu, X.; Hu, S.H.; Zhang, C.; Wang, J.Y.; Huang, Z.F.; He, P. Enrichment Elements and Reservoir Conditions of Helium Gas in Linfen Yuncheng Basin. Northwestern Geol. 2023, 56, 129–141. [Google Scholar] [CrossRef]
- He, M.H. New Structural Pattern and Seismic Activity in Linfen Basin. Earthq. Res. Shanxi. 1988, 4, 9–14. [Google Scholar]
- Jin, G. Research on the Cenozoic Sedimentary Tectonic Evolution in Yuncheng Basin. Shanxi Province. Master’s Thesis, Chang’an University, Chang’an, China, 2020. [Google Scholar]
- Cao, J.L. Oil and Gas Resources Status Investigation in the Linfen-Yuncheng Basin. Ground Water 2016, 2, 211–212. [Google Scholar] [CrossRef]
- Ma, L.L.; He, X.Q. The Current Situation of Ground Subsidence and Fault Prevention in Shanxi Province. Shanxi Archit. 2013, 12, 76–77. [Google Scholar]
- Peng, J.B.; Sun, X.H.; Lu, Q.Z.; Meng, L.; Wang, F. Characteristics and Mechanisms for Origin of Earth Fissures in Fenwei Basin. China Eng. Geol. 2019, 266, 105445. [Google Scholar] [CrossRef]
- Shi, S.S. Correlation Analysis of Groundwater Exploitation and Land Subsidence in Yuncheng Basin. Shanxi Archit. 2017, 23, 69–71. [Google Scholar] [CrossRef]
- Xu, J.S.; Zhuang, H.D.; Tang, D.Q.; Li, Z.C. Characteristic and Mechanism Analysis of Ground Fissures in Yuncheng Basin. J. Geol. Hazards Environ. Preserv. 2010, 2, 97–100. [Google Scholar] [CrossRef]
- Hooper, A.; Zebker, H.; Segall, P.; Kampes, B. A New Method for Measuring Deformation on Volcanoes and Other Natural Terrains Using InSAR Persistent Scatterers. Geophys. Res. Lett. 2004, 23, L23611. [Google Scholar] [CrossRef]
- Sousa, J.; Hooper, A.; Hanssen, R.; Bastos, L.; Ruiz, A. Persistent Scatterer InSAR: A Comparison of Methodologies Based on a Model of Temporal Deformation Vs. Spatial Correlation Selection Criteria. Remote Sens. Environ. 2011, 115, 2652–2663. [Google Scholar] [CrossRef]
- Lu, P.; Han, J.; Hao, T.; Li, R.; Qiao, G. Seasonal Deformation of Permafrost in Wudaoliang Basin in Qinghai-Tibet Plateau Revealed by StaMPS-InSAR. Mar. Geod. 2019, 43, 248–268. [Google Scholar] [CrossRef]
- Hooper, A. Persistent Scatterer Interferometric Synthetic Aperture Radar for Crustal Deformation Analysis, with Application to Volcán Alcedo, Galápagos. J. Geophys. Res. Solid Earth. 2007, 112, B07407. [Google Scholar] [CrossRef]
- Zhou, C.; Gan, L.; Cao, Y.; Wang, Y.; Segoni, S.; Shi, X.; Motagh, M.; Singh, R. Landslide Susceptibility Assessment of the Wanzhou District: Merging Landslide Susceptibility Modelling (LSM) with InSAR-derived Ground Deformation Map. Int. J. Appl. Earth Obs. Geoinf. 2025, 136, 104365. [Google Scholar] [CrossRef]
- Vadivel, S.K.P.; Kim, D.J.; Jung, K. Monitoring the Vertical Land Motion of Tide Gauges and Its Impact on Relative Sea Level Changes in Korean Peninsula Using Sequential SBAS-InSAR Time-Series Analysis. Remote Sens. 2021, 13, 18. [Google Scholar] [CrossRef]
- Ferretti, A.; Prati, C. Nonlinear Subsidence Rate Estimation Using Permanent Scatterers in Differential SAR Interferometry. IEEE Trans. Geosci. Remote Sens. 2000, 38, 2202–2212. [Google Scholar] [CrossRef]
- Wu, H.A.; Zhang, Y.H.; Chen, X.Y.; Lu, Z.; Du, J.; Sun, Z.H.; Sun, G.T. Ground Deformation Monitoring Using Small Baseline DInSAR Technique: A Case Study in Taiyuan City from 2003 to 2009. Chin. J. Geophys. 2011, 54, 673–680. [Google Scholar] [CrossRef]
- Wang, X.Y.; Zhang, Q.; Zhao, C.Y.; Qu, F.F.; Zhang, J.Q. A Novel Method of Generating Deformation Time-Series Using Interferometric Synthetic Aperture Radar and Its Application in Mexico City. Remote Sens. 2018, 10, 1741. [Google Scholar] [CrossRef]
- Chen, X.; Chen, D.H.; Wang, Z. Several Opinions on Developing Agriculture through Groundwater Extraction in Northern China. Acta Geosci. Sin. 2007, 3, 309–314. [Google Scholar] [CrossRef]
- Li, L.R. Evolution Characteristics and Mechanism of Flow Field in Groundwater Overexploitation Area in Yuncheng Basin. Master’s Thesis, Shanxi Agricultural University, Shanxi, China, 2022. [Google Scholar]
- Guo, C.S.; Li, W.Q.; Xu, Y.R.; Yan, X.B. Distribution Characteristics and Genetic Analysis of Mingtiaogang Fractures in Yuncheng Basin. Earthquake 2023, 43, 50–66. [Google Scholar]
- Qiao, J.W.; Peng, J.B.; Deng, Y.H.; Wen, H.G.; Zang, M.D. The Study on Basic Characteristic of Earth Fissure in Linfen Basin. J. Eng. Geol. 2015, 23, 0856–0865. [Google Scholar] [CrossRef]
- Li, W.L. Thoughts on Water Resources Management in Linfen Area, Shanxi Province. J. Shenyang Agric. Univ. (Soc. Sci. Ed.) 2007, 9, 354–356. [Google Scholar] [CrossRef]
- Si, S.P.; Li, Y.L.; Lv, S.H.; Wang, Y.R. Holocene slip rate and Paleoearthquake Records of the Salt Lake Segment of the Northern Zhongtiaoshan Fault, Shanxi Province. Sci. China Earth Sci. 2014, 57, 2079–2088. [Google Scholar] [CrossRef]
Disclaimer/Publisher’s Note: The statements, opinions and data contained in all publications are solely those of the individual author(s) and contributor(s) and not of MDPI and/or the editor(s). MDPI and/or the editor(s) disclaim responsibility for any injury to people or property resulting from any ideas, methods, instructions or products referred to in the content. |
© 2025 by the authors. Licensee MDPI, Basel, Switzerland. This article is an open access article distributed under the terms and conditions of the Creative Commons Attribution (CC BY) license (https://creativecommons.org/licenses/by/4.0/).