Highlights
What are the main findings?
- Groundwater storage in the NCP showed a declining trend from 2018 to 2021, with a maximum subsidence rate reached −177 mm/a.
- Downscaled GWSA revealed contrasting groundwater variations across the northwest and southeast sides of the Shunyi fissure.
What is the implication of the main finding?
- A novel GRACE statistical downscaling algorithm integrating a weight allocation strategy and InSAR-derived GWS estimation is proposed.
- The multiscale analysis provides insights into groundwater storage and land deformation patterns in the NCP after SNWDP.
Abstract
Leveraging multi-source remote sensing datasets and dynamic groundwater monitoring well observations, this study explores the multiscale spatiotemporal linkages of groundwater storage changes and land deformation in North China Plain (NCP) after the South-to-North Water Diversion Project (SNWDP). Firstly, we employed Gravity Recovery and Climate Experiment (GRACE) and interferometric synthetic aperture radar (InSAR) technology to estimate groundwater storage (GWS) and land deformation. Secondly and significantly, we proposed a novel GRACE statistical downscaling algorithm that integrates a weight allocation strategy and GWS estimation applied with InSAR technology. Finally, the downscaled results were employed to analyze spatial differences in land deformation across typical ground fissure areas. The results indicate that (1) between 2018 and 2021, groundwater storage in the NCP exhibited a declining trend, with an average reduction of −3.81 ± 0.53 km3/a and a maximum land deformation rate of −177 mm/a; (2) the downscaled groundwater storage anomalies (GWSA) showed high correlation with in situ measurements (R = 0.75, RMSE = 2.91 cm); and (3) in the Shunyi fissure area, groundwater storage on the northern side increased continuously, with a maximum growth rate of 28 mm/a, resulting in surface uplift exceeding 70 mm.
1. Introduction
Groundwater is a dynamic resource whose levels continuously fluctuate under the influence of various natural and anthropogenic factors. Excessive groundwater extraction in many regions disrupts the natural balance between recharge and discharge, leading to significant groundwater level (GWL) declines and ecological degradation [1,2]. The resulting pressure on aquifer structures often causes land subsidence, and groundwater overexploitation has become a major environmental issue [3,4]. It is reported that numerous land subsidence events worldwide have been linked to groundwater depletion [5,6,7,8].
Currently, the Gravity Recovery and Climate Experiment (GRACE) and GRACE-follow on (GRACE-FO) missions indirectly provide large-scale groundwater storage (GWS) estimates, helping to overcome the limitations of sparse groundwater well monitoring [9,10,11]. However, GRACE suffers from the severe underestimation of GWS due to its coarse resolution and signal leakage [9,12]. This limitation hinders effective fine-scale groundwater management.
Interferometric synthetic aperture radar (InSAR) can achieve large-scale precise deformation monitoring. In recent years, InSAR has been used to estimate GWS based on Terzaghi’s (1996) [13] effective stress principle [7,14,15,16]. This method allows for accurate GWS estimation with higher spatial and temporal resolution.
Although previous studies have employed high-resolution land surface models (LSMs) to downscale GRACE data [17,18,19,20,21,22], LSMs like the Catchment Land Surface Model (CLSM) and the Noah LSM primarily focus on shallow soil moisture and do not explicitly simulate variations in GWS [23]. InSAR observations offer a high resolution and strong spatial consistency with groundwater measurement data [24,25]. As a result, many researchers have proposed combining GRACE with InSAR, which partially addresses GRACE’s coarse resolution while also enabling quantitative estimation of GWS [12,15]. In this study, we introduce a novel GRACE statistical downscaling algorithm based on a weight allocation strategy. This methodological innovation provides physically interpretable downscaling results that can be directly linked to aquifer mechanics. Unlike machine learning approaches such as Random Forest (RF), geographically weighted regression (GWR), or evapotranspiration (ET)-based method [26,27,28], our framework explicitly enforces mass conservation, which is essential for water balance studies. Furthermore, it offers clear physical interpretability and lower computational cost, whereas machine learning methods, despite their ability to capture nonlinear relationships, often lack physical meaning, rely heavily on large training datasets, and cannot guarantee water mass balance. This approach leverages InSAR data for high-resolution GWS inversion and applies it to enhance the spatial resolution of GRACE data.
Since the 1960s, a significant groundwater depression funnel has developed in the North China Plain (NCP), resulting in the fastest deformation rate in China and expanding the affected area to over 40,000 km2 [29]. Since the implementation of the South-to-North Water Diversion Project (SNWDP), groundwater in the NCP was recharged, and land deformation was effectively alleviated [25]. However, due to the complex geological conditions of the NCP and the prolonged historical shortage of water resources, the implementation of the SNWDP has resulted in the coexistence of groundwater recovery and depletion, as well as land subsidence and rebound. These dynamics have introduced more intricate spatiotemporal and regional patterns of groundwater changes and land deformation in the NCP [25,30]. Beyond its regional role, SNWDP can be viewed as a template for similar projects worldwide, such as the California State Water Project [31], underscoring its broader policy relevance for sustainable groundwater management.
Currently, few studies have comprehensively unraveled spatiotemporal linkages of groundwater storage and land deformation on both large and sub-regional scales after the SNWDP. In this study, firstly, we employed a combined GRACE/InSAR methods to estimate GWS and land deformation. Secondly, we developed a statistical downscaling approach that integrates InSAR-derived GWS with weight allocation strategies to reconstruct high-resolution (0.05°) spatiotemporal GRACE data. Finally, the downscaled results were used to analyze spatial differences in land deformation across typical ground fissure areas, providing a basis for elucidating the coupling mechanisms between groundwater and land deformation.
2. Materials and Methods
2.1. Study Area
The NCP (113.0–119.5°E, 34.5–40.5°N) is bordered by the Yanshan Mountains to the north, the Huaihe River to the south, the Bohai Sea and the Yellow Sea to the east, and the Taihang Mountains to the west (Figure 1a). It gently slopes from west to east, with elevations predominantly under 50 m. Situated in a semi-humid climate zone, it receives approximately 500–700 mm of rainfall annually [6]. The groundwater recharge primarily depends on atmospheric precipitation infiltration, accounting for approximately 60% of the total recharge and peaking in summer [28]. The hydrogeological environment in the NCP is complex. From the foothills to the coastal areas, the aquifer system transitions from a single sand and gravel aquifer to multiple water-bearing sand layers, which are separated by silt or clay layers (Figure 1b). The soil particles become progressively finer, and the thickness of the compressible clay layer gradually increases [32].
2.2. Datasets
2.2.1. Gravity Recovery and Climate Experiment (GRACE)
Three versions of GRACE terrestrial water storage (TWS) data, comprising all available observation months from January 2003 to July 2022, were considered: the Mass Concentration (MASCON) solution from the Center for Space Research (CSR) (https://www2.csr.utexas.edu/grace, accessed on 25 September 2025) [33], and the MASCON solution from the Jet Propulsion Laboratory (JPL) (https://grace.jpl.nasa.gov/data/get-data/jpl_global_mascons, accessed on 25 September 2025) [34], and the MASCON solution from the Goddard Space Flight Center (GSFC) (https://earth.gsfc.nasa.gov/geo/data/grace-mascons, accessed on 25 September 2025) [35]. We used the ensemble mean of these three versions as GRACE-TWS dataset. To address the 11-month data gap between the GRACE and GRACE-FO satellites, we use the GRACE/GRACE-FO supplemental dataset from Yang et al. (2023) [36], which accounts for the effects of natural and anthropogenic factors on the TWS to supplement the missing data.
2.2.2. Hydrometeorological Data
The Global Land Data Assimilation System (GLDAS) V2.1 provides global-scale TWS estimates by assimilating ground observations, satellite remote sensing data, and climate models. The soil moisture storage (SMS) and snow water equivalent (SWE) were derived using the means of three surface models: the variable infiltration capacity (VIC), catchment land surface model (CLSM), and NOAH models [23]. Reservoir storage (RSVS) was derived using the WaterGlobal Assessment and Prognosis (WaterGAP) model [37] and in situ measurement (https://nsbd.swj.beijing.gov.cn/dzxsksq.html, accessed on 25 September 2025). In addition, we did not consider canopy water because its contribution to TWS in the study area is negligible compared to groundwater and soil moisture.

Figure 1.
(a) Description of datasets coverage in the study area, in which the gray rectangle indicates the range of the GRACE 0.25° grid, the red frame indicates the coverage of the Sentinel-1A data used, and the blue dots indicate the water level observation locations. (b) The map of A-A’ profile line hydrogeological [38].
2.2.3. Synthetic Aperture Radar (SAR) and Auxiliary Data
The SAR data used in the study were acquired from ascending data obtained by the Sentinel-1A Satellite from January 2018 to October 2021. The locations and details of the Sentinel-1A images are provided in Figure 1a and Table 1. Additionally, we collected 30 m resolution Shuttle Radar Topography Mission (SRTM) data for use as an external digital elevation model (DEM).

Table 1.
Sentinel-1A data acquisition.
2.2.4. In Situ Groundwater Level (GWL) Measurements and Borehole Data
We selected 1005 sets of GWL data for the confined aquifer in the NCP obtained from the China Institute of Geo-Environment Monitoring (https://geocloud.cgs.gov.cn/, accessed on 25 September 2025). Their spatial distribution is illustrated in Figure 1a.
Additionally, we collected data from two boreholes in the Shunyi ground fissure area to generalize the properties of the soil layers. The borehole data were obtained from the China Institute of Geo-Environment Monitoring (https://geocloud.cgs.gov.cn/, accessed on 25 September 2025), and their details are provided in Table 2. Datasets used in this study are listed in Table S1 of the Supplementary Materials.
Table 2.
Borehole data information.
2.3. Methodology
Figure 2 summarizes the main framework and methodology of this study. First, GRACE and GLDAS data were used to estimate groundwater storage anomalies in the NCP. Next, Sentinel-1A images were processed using the Persistent Scatterer InSAR (PSI) method to obtain the spatiotemporal dynamics of land deformation in the region. Then, a statistical downscaling approach combining InSAR-derived groundwater storage and a weight allocation strategy was applied to reconstruct high-resolution groundwater storage anomalies (GWSA), and the results were validated. Finally, the downscaled results were used to analyze spatial differences in land deformation across typical ground fissure areas.
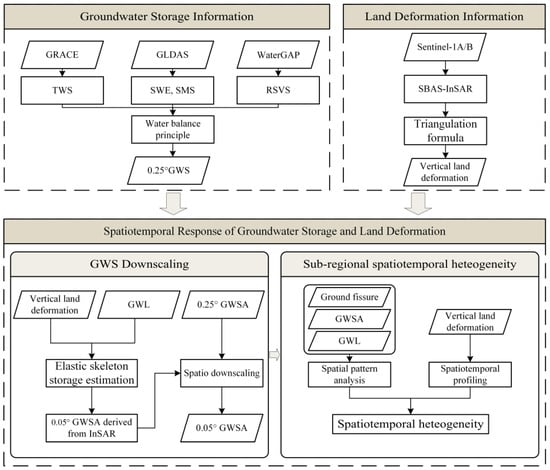
Figure 2.
The flowchart of the method for detecting spatiotemporal heterogeneity in the NCP, including the process of GRACE downscaling. TWS—terrestrial water storage, SWE—snow water equivalent, SMS—soil moisture storage, RSVS—reservoir storage, GWS—groundwater storage, GWL—groundwater leveling.
2.3.1. Deriving Groundwater Storage (GWS)
Based on the water balance principle [39], we calculated the change in the GWS:
where is the groundwater storage; is the terrestrial water storage measured by the GRACE; is the snow water equivalent; is the soil water storage; and is the reservoir storage. In this paper, all of the variables, including the water storage anomalies estimated by GRACE and in situ GWL measurements, are expressed as the equivalent water thickness (EWT). There were differences in the spatial resolution of GRACE/GLDAS data. We did not use any interpolation while extracting the values at the 0.25° grid, rather the value at the 0.5°/1° grid closest to the 0.25° grid is adopted. For robustness, canal leakage, irrigation return flows, and post-SNWDP pumping restrictions were not incorporated into the GWS estimates, as these processes are difficult to quantify and highly uncertain.
2.3.2. Land Deformation Derived from PSI
PSI processing was conducted using SARPROZ [40]. First, one SAR image was selected as the master, and all slave images were co-registered by calculating the coordinate mapping relationships in both azimuth and range directions, followed by resampling. Differential interferograms were then generated, and persistent scatterer (PS) candidates were identified using both the coherence coefficient and the amplitude stability index (ASI). PSI processing was conducted using SARPROZ, and an ASI threshold of 0.8 was applied, effectively reducing noise and errors while yielding an optimal number of PSs. The unwrapped phases were filtered in both the temporal (high-pass) and spatial (low-pass) domains to estimate orbital errors of the master and slave images as well as atmospheric effects. The topographic fringes were corrected using the 30 m resolution SRTM DEM as the reference terrain [41], and residual orbital errors were further compensated through polynomial fitting. The atmospheric phase screen (APS) module was employed to mitigate the delayed atmospheric phases. Finally, after removing residual topographic and atmospheric phase errors, the deformation rates and cumulative displacements of each PS point were recalculated, providing detailed ground deformation information over the study area. By assuming that the horizontal deformation of the surface is negligible [42], the deformations along the line-of-sight () direction were converted into vertical deformations using triangulation formula:
where represents the vertical deformation, represents the vertical deformation along the satellite line of sight, and is the incident angle.
2.3.3. Groundwater Storage Anomaly (GWSA) Derived from InSAR Technology
The skeleton storage coefficient represents the capacity of an aquifer system to respond to hydraulic changes. It is defined as the volume of water released (or stored) per unit area of the aquifer system in response to a one-unit decrease (or increase) in the GWL [14]. In this study, we assumed that all land deformation was attributed to changes in the thickness of the clay layer resulting from variations in GWL within the confined aquifer. We excluded the effects of hydrologic loading and considered the compression of the aquifer skeleton to be elastic, responding to seasonal water level fluctuations during the study period. Therefore, the elastic skeleton storage coefficient () can be expressed as follows:
where is the monthly land deformation observed by InSAR technology, and is the in situ monthly GWL change. We calculated the monthly elastic skeletal storage coefficients () at the monitoring sites of the 1005 wells. The was interpolated to a 0.05° resolution () using the kriging method and was applied across the entire NCP [43]. We selected kriging interpolation because it accounts for spatial autocorrelation via the variogram, providing optimal linear unbiased estimates and enabling quantification of interpolation uncertainty. Deterministic methods, such as inverse distance weighting (IDW) or spline interpolation, do not consider spatial correlation and may underestimate local heterogeneity. Cross-validation of the kriging results yielded R2 = 0.82, confirming the robustness of this approach.
We then calculated the change in the GWS () at a 0.05° resolution in the NCP:
where is the mean land deformation value for each 0.05° grid across the NCP. The change in the GWS () was multiplied by the specific yield () (provided by the China Institute of Geo-Environment Monitoring, https://geocloud.cgs.gov.cn/, accessed on 25 September 2025) to derive the GWS at a 0.05° resolution [44]. The specific yield across the NCP varied widely, ranging from 0 to 0.2. Finally, these GWS values were converted to GWSA.
To assess robustness, a sensitivity test was performed by perturbing values by ±20%. The resulting downscaled GWSA estimates showed variations within ±8% of the baseline, with negligible impact on spatial patterns. This confirms that the downscaling framework is relatively insensitive to moderate uncertainties in .
2.3.4. Statistical Downscaling Approach with Weight Allocation Strategies
In this study, we built upon Wan’s approach [21] by utilizing the InSAR-derived GWSA at a 0.05° resolution to reconstruct the high-resolution GWSA data (Figure 3).
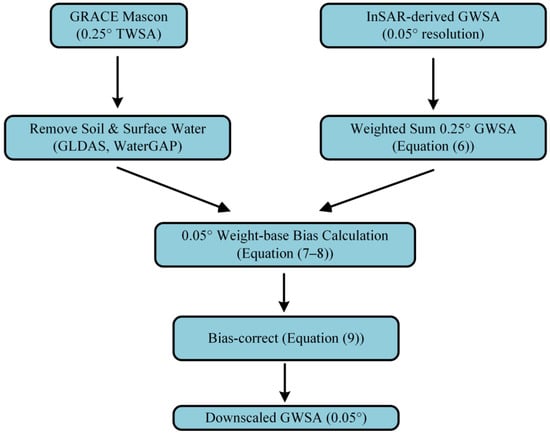
Figure 3.
The flowchart of the method for downscaling the GRACE-derived GWSA data.
First, the values from the InSAR-derived GWSA were normalized to obtain standardized values (). These 0.05° grids were then aggregated into a 0.25° grid, serving as an area-weighting factor to match the 0.25° GRACE-derived GWSA:
where is the normalized groundwater equivalent thickness data at a 0.25° resolution (mm); is the area of a 0.05° grid (m2); and is the total area of all of the 0.05° grids within a 0.25° grid (m2).
The GRACE-derived GWSA was taken as the true value. The difference between the aggregated 0.25° normalized groundwater equivalent thickness data ) and the 0.25° GRACE normalized equivalent water thickness () was defined as the bias (B) of the modeled equivalent water thickness:
The groundwater offset () between the model and GRACE data was further distributed across the 0.05° grids using water as the weighting factor:
where is the bias of the 0.01° model equivalent water thickness, and is the pre-standardized 0.05° model equivalent water thickness. By subtracting the bias from , the bias-corrected 0.05° monthly equivalent water thickness can be obtained:
This downscaling method preserves the accuracy of the GRACE data while ensuring that the sum of the equivalent water thicknesses of all of the 0.05° grids within a 0.25° grid matches the original 0.25° GRACE value.
2.3.5. Uncertainty Analysis
When evaluating the contributions of our study, it is important to consider its limitations, which can be addressed in future research to further enhance the ability to identify groundwater depletion hotspots. First, there is inconsistency in the spatial resolution of the hydrological datasets used for GWS estimation. We addressed this by directly extracting coarser-resolution data onto a higher-resolution grid for calculations. The uncertainties of hydrological models can be dealt with by using the ensemble mean of several models [45]. Second, to reduce the limitations introduced by spatial interpolation during the downscaling process, we employed a denser network of observation wells in the InSAR-based GWS estimation approach.
To provide a quantitative error budget, we explicitly propagated uncertainties from multiple sources into the final downscaled GWSA estimates. Specifically: (1) the spread among the three GRACE mascon solutions (CSR, JPL, GSFC) was computed as the grid-wise standard deviation (); (2) ensemble variance across GLDAS models (Noah, VIC, CLSM) was included as ; (3) InSAR phase noise was quantified from redundant interferograms and converted into land deformation uncertainty, which was then propagated through the inversion to obtain ; (4) the kriging interpolation error of was assessed via leave-one-out cross-validation (R2 = 0.82), yielding
; and (5) the sensitivity of the downscaled GWSA to ±20% variations in was treated as .The total uncertainty was calculated as:
The resulting values were mapped at 0.05° resolution (Figure 4), providing spatially explicit confidence intervals for the downscaled groundwater storage anomalies. Higher uncertainties are concentrated in the piedmont zone near Shijiazhuang and the central NCP.
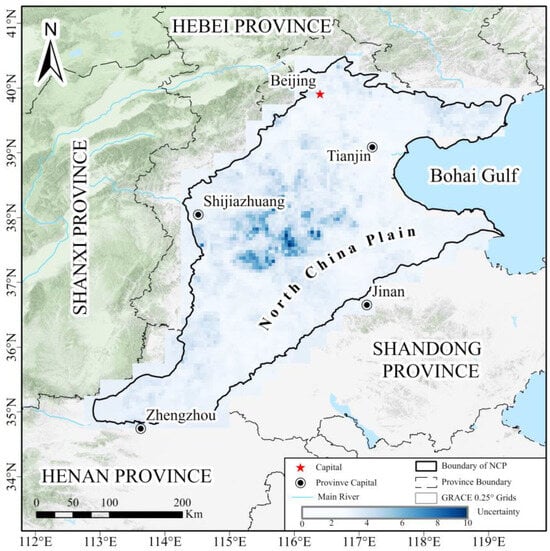
Figure 4.
Spatially explicit uncertainty intervals for the downscaled GWSA.
3. Results
3.1. Validation
We compared the average displacement rate of PS points within a 100 m buffer zone around the leveling points with the land deformation measurements derived from InSAR and leveling observations (Figure 5a). The InSAR-derived results showed excellent agreement with leveling data, with a correlation coefficient of 0.95, an RMSE of 3.36 mm/a, and an MAE of 2.87 mm/a.
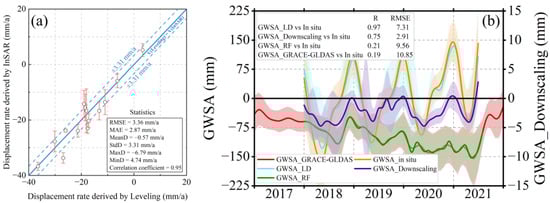
Figure 5.
Validation results. (a) Comparison of GWL and InSAR results for 2021. The red line indicates the error for each level. (b) Downscaled GWSA validation for 2018–2021. GWS_LD and GWS_RF represent groundwater storage derived from land deformation and random forest, respectively.
We obtained three types of GWSA data: GRACE-derived GWSA, downscaled GWSA, and in situ GWSA (Figure 5b and Table 3). The correlations between these datasets and the in situ measurements were 0.97, 0.75, and 0.19, respectively, with corresponding RMSE values of 7.31 cm, 2.91 cm, and 10.85 cm. These results indicate that inverting GWL changes using land deformation data is both effective and feasible, and the downscaling method significantly improves the accuracy of the original GRACE data.
Table 3.
Groundwater depletion rate and groundwater depletion in the NCP (2018–2021) and their R and RMSE values compared to the in situ measurements.
3.2. Analysis of GWSA and Land Subsidence Variations in the NCP
3.2.1. Characteristics of GWSA in the NCP
Figure 6 illustrates the monthly precipitation, GRACE-derived Terrestrial Water Storage Change (TWSC), and GLDAS-derived Terrestrial Water Storage Anomaly (TWSA) in the NCP from January 2003 to August 2021. From 2003 to 2004, the TWSA increased sharply at a rate of 38.25 mm/a. However, due to heavy groundwater extraction, there was a sudden decline in the TWSA, with a depletion rate of −18.99 mm/a from 2005 to 2009. Between 2010 and 2013, the TWSA stabilized due to increased precipitation. Despite the successful implementation of the SWDP in 2014, the TWSA continued to decrease at a rate of −35.89 mm/a from 2014 to 2015, primarily due to severe drought and low rainfall. From 2016 to 2020, the TWSA remained stable due to increased precipitation and recharge from the SWDP. Subsequently, the TWSA increased sharply again until the middle of 2021. Overall, the terrestrial water storage in the NCP exhibited a decreasing trend, with a rate of decrease of −11.57 ± 2.33 mm/a (or −3.85 ± 0.75 km3/a) as retrieved by GRACE.
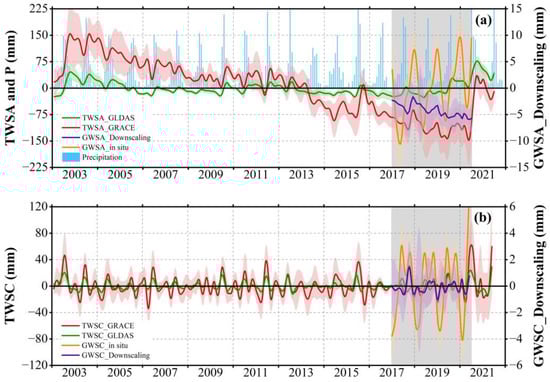
Figure 6.
The monthly time series from 2003 to 2021 includes (a) precipitation data, along with TWSA derived by GRACE, GLDAS, downscaling GWS, and in situ groundwater equivalent height; and (b) the corresponding monthly changes in the TWSC, represented as the TWSA. The gray shading indicates the time range covered by this study. The red and purple lines denote the 0.25° GRACE data and the 0.05° downscaling data, respectively. The different colors of shading denote the uncertainty (i.e., error) associated with the corresponding data estimates.
Additionally, we analyzed the changes in GWS in the NCP from 2018 to 2021 and generated a graph of the rate of change in the GWS (Figure 7a). The results indicate that the GWS exhibited a general decreasing trend across the NCP during the study period. The severe groundwater depletion was concentrated in the southwestern part of the NCP, and Anyang City in Henan Province experienced a rate of decrease of −47.86 ± 5.89 mm/a. In contrast, the northern part of the NCP exhibited less significant groundwater loss, and some areas even exhibited increasing trends. The highest increases occurred in Beijing and Tianjin, the major cities of the SWDP, with rates of increase of up to 8.71 ± 3.99 mm/a.
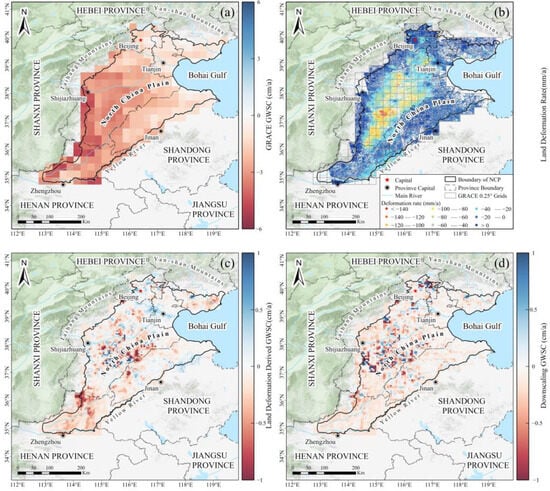
Figure 7.
The distribution of the rate of change in the GWS and the average annual land deformation rate in the NCP from 2018 to 2021. (a) a GRACE-derived GWSC map showing the rate of change in the GWS, (b) a map illustrating the average land deformation rate, (c) a land deformation derived GWSC map of the rate of change in the GWS, and (d) a downscaling GWSC map showing the rate of change in the GWS. Note: the legends are for the data within the 99% confidence interval, and the colors beyond this interval are shown as the corresponding legend extremes.
3.2.2. Characteristics of Land Deformation in the NCP
We obtained vertical displacement data for the NCP from 2018 to 2021 and generated corresponding deformation rate maps (Figure 7b). The research results show that land subsidence continues to occur in the central and southern parts of the NCP, with significant expansion of subsidence centers in Xingtai and Hengshui, where the maximum subsidence rate reaches up to 177 mm/a. In contrast, the subsidence trend has slowed in some areas of Beijing. Notably, the Chaobai River Basin has exhibited ground uplift, with a cumulative rise of 78.37 mm, which is closely related to groundwater recovery in the region.
3.3. Downscaling of GRACE-Derived GWSA
According to the method described in Section 3.2.1, we first inverted the GWSA at a 0.05° resolution using InSAR deformation time series, as shown in Figure 7c. The inversion results exhibit a high consistency with in situ groundwater level measurements (R = 0.97, RMSE = 7.31 cm), confirming the reliability of this method. In the Beijing–Tianjin region, the InSAR-inverted GWSA remained generally stable and showed an increasing trend, with a maximum growth rate of 9.84 mm/a; in contrast, the central NCP, particularly the Shijiazhuang–Hengshui–Dezhou area, displayed a pronounced decreasing trend, with the maximum annual decline in Jingxian County, Hengshui, reaching −22 mm/a.
Subsequently, the high-resolution GWSA derived from InSAR was used to downscale the GRACE data (Figure 7d). From January 2018 to July 2021, the original GRACE results at 0.25° resolution indicated an overall groundwater deficit across the NCP, with an average annual change rate of −12.36 ± 1.65 mm/a. After downscaling, the groundwater storage variations revealed much clearer spatial heterogeneity. For instance, some areas of the Beijing Plain exhibited a noticeable recovery in groundwater storage (shown in blue), which was not clearly captured in the original GRACE data.
Based on the downscaled GWSA data, we observed pronounced differences in groundwater variations on either side of the Shunyi ground fissure in Beijing (Figure 8a). The results reveal a clear north–south contrast: groundwater storage on the northern side continued to increase, reaching a maximum growth rate of 28 mm/a, whereas the southern side remained in deficit, with a maximum decline rate of −29.5 mm/a. Furthermore, groundwater storage in the upper Chaobai River region also exhibited recovery, which closely aligns with the surface rebound trends detected by InSAR.
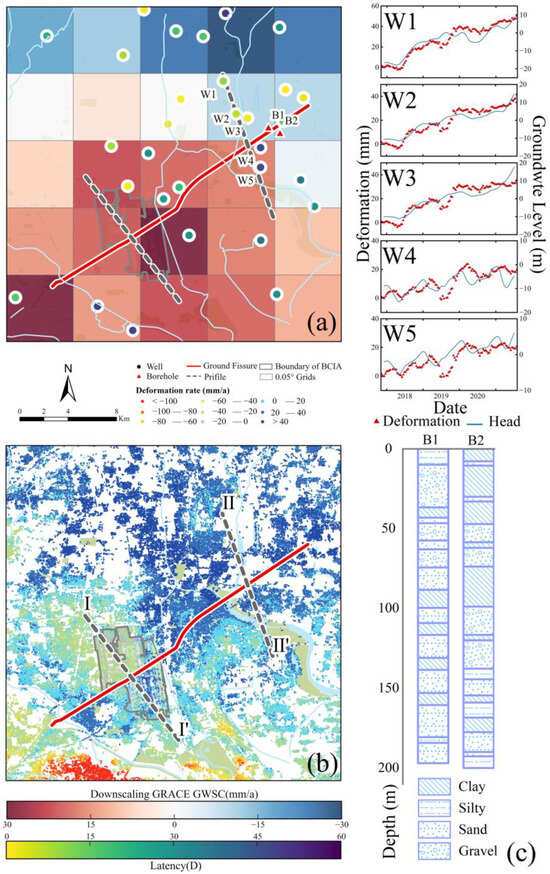
Figure 8.
(a) Downscaling results for Shunyi ground fissure area; (b) land deformation derived from InSAR; (c) borehole data; and (W1–W5) comparison of deformation changes and GWL in different groundwater monitoring wells (Table S2). BCIA—Beijing Capital International Airport.
4. Discussion
4.1. Advantages and Limitations of the GRACE Downscaling
To evaluate the effectiveness of the GRACE downscaling method proposed in this study, we conducted a comparative experiment using the Random Forest (RF) method to downscale GWSA [46] (see Supplementary Materials Sections S1–S3 for details). The results indicate that the RF-generated groundwater storage distribution is relatively smooth (Figure 9), but its accuracy is lower compared with in situ groundwater measurements, and it struggles to resolve fine-scale spatial variations, limiting its applicability for local-scale groundwater assessments. In contrast, the method proposed in this study not only demonstrates a significant advantage in accuracy (correlation coefficient R = 0.75, RMSE = 2.91 cm) but, more importantly, effectively preserves fine-scale spatial heterogeneity that is critical for local-scale investigations. For instance, although GRACE observations indicate overall groundwater depletion in the NCP, our approach reveals localized groundwater recovery in the Beijing Plain, highlighting its enhanced spatial resolution.
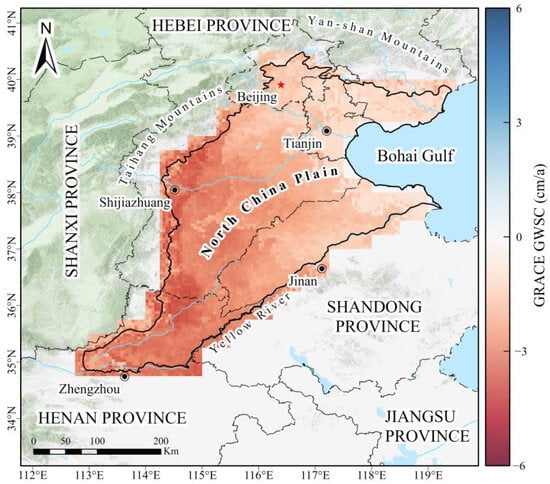
Figure 9.
The distribution of the rate of change in the GWS (derived from RF model) in the NCP from 2018 to 2021.
The 0.05° downscaled GWSA maps provide actionable insights for groundwater management, including (1) identifying zones with relatively stable storage for safer well drilling, (2) highlighting aquifer sections with greater storage potential for artificial recharge, and (3) integrating GWSA with InSAR-derived deformation to prioritize subsidence-prone regions for mitigation. These applications demonstrate the method’s practical value in data-rich regions.
Nevertheless, several limitations should be noted. The validation dataset covers only 2018–2021, providing a relatively short observation window. Although the high correlation with well data highlights the method’s value, this limited period may not capture longer-term variability. In particular, extreme hydroclimatic events, such as the severe 2014–2015 drought, could drive groundwater storage changes independent of SNWDP inflows [47], complicating attribution. Moreover, the recovery from long-term groundwater overexploitation is inherently gradual [48]. Under extreme drought conditions, water demand increases substantially, and surface water inputs from diversion projects and precipitation alone may not be sufficient to offset deficits. Future research should therefore incorporate longer well records or reconstructed time series to disentangle the combined effects of climate extremes and inter-basin water transfers.
Furthermore, while the method performs well in unconsolidated sedimentary basins, its applicability to karst or fractured aquifers is constrained. InSAR coherence is often poor in these environments due to vegetation and rough terrain, and aquifer responses are dominated by preferential flow and localized storage processes that may not be adequately captured by the current bias allocation scheme. Future extensions could integrate complementary geophysical and hydrological data (e.g., spring discharge, dense well networks) to enhance applicability in such complex hydrogeological settings.
4.2. Analysis of Surface Deformation Differences on Both Sides of Ground Fissures Based on GRACE Downscaling Results
In the Shunyi ground fissure area, the downscaled GRACE-derived groundwater storage anomaly (GWSA) results reveal pronounced spatial heterogeneity in groundwater changes, providing crucial evidence for explaining the differential surface deformation observed on both sides of the fissure (Figure 8).
InSAR monitoring results along Profile I and Profile II indicate significant deformation on the northwest side of the fissure (Figure 8b and Figure 10): Profile I shows cumulative subsidence reaching −99.32 mm, while Profile II displays surface uplift with a maximum value of 78.37 mm. In contrast, the southeast side exhibits smaller and more stable surface deformation, with an average of only −15.39 mm along Profile I and just 2.38 mm along Profile II.
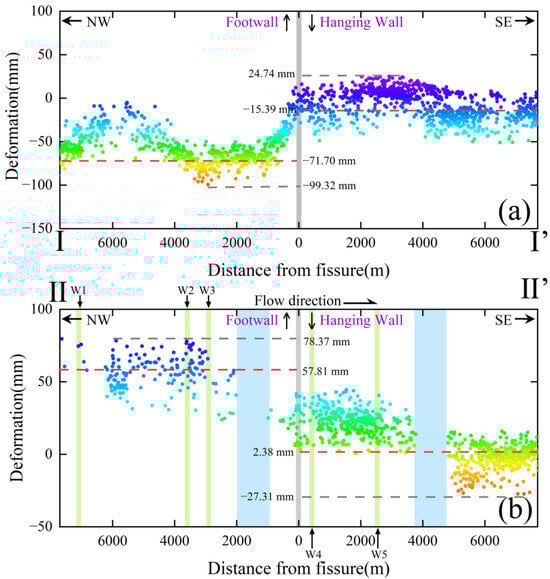
Figure 10.
(a) Profile I cumulative deformation; (b) Profile II cumulative deformation.
The observed differences in surface deformation are closely linked to groundwater dynamics. The downscaled GWSA results suggest a continuous increase in groundwater storage on the northwest side, primarily due to recharge from the upstream Chaobai River, resulting in surface rebound in the northern area. Meanwhile, the southeast side, located downstream with limited recharge, shows little variation in groundwater storage and correspondingly stable surface conditions.
Moreover, previous studies have indicated that since the implementation of the Middle Route of the South-to-North Water Diversion Project, significant groundwater recharge has occurred in the northern part of Shunyi, alleviating regional land subsidence trends to some extent [25]. The downscaled GWSA results in this study further clarify the spatial distribution of this localized recharge effect.
It is noteworthy that the response time of land deformation to groundwater variations exhibits clear differences across the fissure (Figure 8a). To quantify these lags, we first extracted the seasonal components of both groundwater levels and surface deformation using STL decomposition. The time-lagged cross-correlation (TLCC) method [49] was then applied, with the lag corresponding to the maximum correlation between the seasonal signals taken as the response time. Based on this procedure, the northwest side shows a lag of approximately 2–30 days, whereas the southeast side exhibits a lag of 30–60 days, indicating that, under fault control, the hanging wall (northwest side) responds more slowly to groundwater fluctuations than the footwall (southeast side). Further evidence from the five groundwater monitoring wells (W1–W5) along Profile II shows that the southeast wells (W4 and W5) display more pronounced seasonal fluctuations, while the northwest wells (W1–W3) exhibit smaller variations (Figure 8c). These differences are largely controlled by subsurface lithology: borehole data (Figure 8c) indicate that the clay layer on the southeast side of the fissure is 87.18 m thick, 2.17 times that of the northwest side (40.20 m), and the thicker clay layer induces a greater lag effect, reducing the propagation rate of groundwater changes to the land surface.
Comparable fault-controlled hydrogeological responses have been reported in other regions [50,51,52], including Mexico, the California Central Valley, and Utah, USA, where aquifer deformation is strongly modulated by variations in lithostratigraphy across fault boundaries, highlighting that the mechanism observed at the Shunyi fissure is consistent with global observations of fault-controlled aquifer behavior.
5. Conclusions
This study systematically analyzed the multiscale spatiotemporal responses of groundwater storage (GWS) and land deformation in the NCP following the implementation of the South-to-North Water Diversion Project (SNWDP), based on GRACE satellite data, Persistent Scatterer InSAR (PSI) technology, and dynamic groundwater monitoring well observations. A GRACE statistical downscaling algorithm, integrating InSAR-derived GWS and a weight allocation strategy, was developed to reconstruct high-resolution (0.05°) groundwater storage anomalies (GWSA), which were then used to investigate spatial differences in surface deformation in typical ground fissure areas. The main conclusions are as follows:
(1) Between 2018 and 2021, groundwater storage in the NCP exhibited a declining trend, with an average reduction of −3.81 ± 0.53 km3/a, and the maximum vertical deformation rate reached −177 mm/a. Although the SNWDP supplied water to some areas, causing groundwater recovery in the northern region, the overall groundwater deficit persisted, and land subsidence continued.
(2) The proposed GRACE downscaling algorithm enhanced the spatial resolution from 0.25° to 0.05° and significantly improved the accuracy of GWSA inversion. Validation indicates a high correlation with in situ measurements (R = 0.79, RMSE = 2.91 cm). The method is applicable to regions with confined or semi-confined aquifers where deformation can be reliably monitored using InSAR, providing a feasible solution for GWSA estimation in areas lacking dense in situ monitoring data.
(3) Downscaled GRACE data revealed pronounced spatial heterogeneity in groundwater variations across the Shunyi ground fissure area, explaining the asymmetric surface deformation: the northwest side experienced groundwater recovery accompanied by surface rebound, whereas the southeast side remained in deficit with relatively stable surface conditions.
Supplementary Materials
The following supporting information can be downloaded at: https://www.mdpi.com/article/10.3390/rs17193336/s1, Figure S1: Schematic diagram of the groundwater storage anomaly (GWSA) downscaling approach; Figure S2: Variable important measures predictive (VIMP) (%) of the predictors; Figure S3: Model accuracy verification chart; Figure S4: Downscaled GWSA validation for 2018–2021; Table S1: Introduction of the data used in this paper; Table S2: Groundwater monitoring wells.
Author Contributions
Conceptualization, B.C. and X.W.; methodology, X.W. and B.C.; software, X.W.; validation, S.Z. and D.M.; formal analysis, X.W.; investigation, C.Z. (Chong Zhang); resources, X.W.; data curation, H.W. and J.Z.; writing—original draft preparation, X.W.; writing—review and editing, B.C., R.M., Z.M. and K.L.; Visualization, Z.M. and J.Z. supervision, B.C. and C.Z. (Chaofan Zhou); funding acquisition, B.C., H.G. and C.Z. (Chaofan Zhou) All authors have read and agreed to the published version of the manuscript.
Funding
This research was funded by the National Natural Science Foundation of China (No. 42371089/D0104, No. 42371081/D0104, No. 42201081/D0104, No. 41930109/D010702) and the Beijing Outstanding Young Scientist Program (BJJWZYJH01201910028032).
Data Availability Statement
The original contributions presented in the study are included in the article, further inquiries can be directed to the corresponding author.
Acknowledgments
We acknowledge the China Institute of Geo-Environment Monitoring and the Hebei Institute of Geological Environment Monitoring for providing relevant data on the research area.
Conflicts of Interest
The authors declare no conflicts of interest.
References
- Khorrami, B.; Arik, F.; Gunduz, O. Land deformation and sinkhole occurrence in response to the fluctuations of groundwater storage: An integrated assessment of GRACE gravity measurements, ICESat/ICESat-2 altimetry data, and hydrologic models. GISci. Remote Sens. 2021, 58, 1518–1542. [Google Scholar] [CrossRef]
- Zhong, X.; Gong, H.; Chen, B.; Zhou, C.; Xu, M. Study on the evolution of shallow groundwater levels and its spatiotemporal response to precipitation in the Beijing Plain of China based on variation points. Ecol. Indic. 2024, 166, 112466. [Google Scholar] [CrossRef]
- Rezaei, A.; Mousavi, Z. Characterization of land deformation, hydraulic head, and aquifer properties of the Gorgan confined aquifer, Iran, from InSAR observations. J. Hydrol. 2019, 579, 124196. [Google Scholar] [CrossRef]
- Zhao, X.; Yu, Y.; Cheng, J.; Ding, K.; Luo, Y.; Zheng, K.; Xian, Y.; Lin, Y. A Novel Framework for Heterogeneity Decomposition and Mechanism Inference in Spatiotemporal Evolution of Groundwater Storage: Case Study in the North China Plain. Water Resour. Res. 2024, 60, e2023WR036102. [Google Scholar] [CrossRef]
- Chen, B.; Gong, H.; Lei, K.; Li, J.; Zhou, C.; Gao, M.; Guan, H.; Lv, W. Land subsidence lagging quantification in the main exploration aquifer layers in Beijing plain, China. Int. J. Appl. Earth Obs. Geoinf. 2019, 75, 54–67. [Google Scholar] [CrossRef]
- Shi, M.; Gong, H.; Gao, M.; Chen, B.; Zhang, S.; Zhou, C. Recent Ground Subsidence in the North China Plain, China, Revealed by Sentinel-1A Datasets. Remote Sens. 2020, 12, 3579. [Google Scholar] [CrossRef]
- Chen, J.; Knight, R.; Zebker, H.A.; Schreüder, W.A. Confined aquifer head measurements and storage properties in the San Luis Valley, Colorado, from spaceborne InSAR observations. Water Resour. Res. 2016, 52, 3623–3636. [Google Scholar] [CrossRef]
- Castellazzi, P.; Schmid, W.; Fu, G. Exploring the potential for groundwater-related ground deformation in Southern New South Wales, Australia. Sci. Total Environ. 2023, 895, 165167. [Google Scholar] [CrossRef] [PubMed]
- Pan, Y.; Zhang, C.; Gong, H.; Yeh, P.J.-F.; Shen, Y.; Guo, Y.; Huang, Z.; Li, X. Detection of human-induced evapotranspiration using GRACE satellite observations in the Haihe River basin of China. Geophys. Res. Lett. 2017, 44, 190–199. [Google Scholar] [CrossRef]
- Wang, F.; Wang, Z.; Yang, H.; Di, D.; Zhao, Y.; Liang, Q. Utilizing GRACE-based groundwater drought index for drought characterization and teleconnection factors analysis in the North China Plain. J. Hydrol. 2020, 585, 124849. [Google Scholar] [CrossRef]
- Wu, Y.; Zhong, Y.; Liu, S.; Xu, G.; Xiao, C.; Wu, X.; Xie, B.; Li, Z.; Shum, C.K. Hydrogeodesy Facilitates the Accurate Assessment of Extreme Drought Events. J. Earth Sci. 2025, 36, 347–350. [Google Scholar] [CrossRef]
- Castellazzi, P.; Longuevergne, L.; Martel, R.; Rivera, A.; Brouard, C.; Chaussard, E. Quantitative mapping of groundwater depletion at the water management scale using a combined GRACE/InSAR approach. Remote Sens. Environ. 2018, 205, 408–418. [Google Scholar] [CrossRef]
- Terzaghi, K.; Peck, R.B.; Mesri, G.J.S.S. Soil Mechanics in Engineering Practice; Wiley-Interscience: Hoboken, NJ, USA, 1996; Volume 68. [Google Scholar]
- Ghobadi-Far, K.; Werth, S.; Shirzaei, M.; Bürgmann, R. Spatiotemporal Groundwater Storage Dynamics and Aquifer Mechanical Properties in the Santa Clara Valley Inferred From InSAR Deformation Over 2017–2022. Geophys. Res. Lett. 2023, 50, e2023GL105157. [Google Scholar] [CrossRef]
- Hu, J.; Zhou, Z.; Wang, J.; Qin, F.; Wang, J.; Zhang, R.; Wang, L.; Wu, W.; Huang, L. Enhancing the groundwater storage estimates by integrating MT-InSAR, GRACE/GRACE-FO, and hydraulic head measurements in Henan Plain (China). Int. J. Appl. Earth Obs. Geoinf. 2024, 131, 103993. [Google Scholar] [CrossRef]
- Li, M.; Sun, J.; Xue, L.; Shen, Z.-K.; Li, Y.; Zhao, B.; Hu, L. Characterizing Aquifer Properties and Groundwater Storage at North China Plain Using Geodetic and Hydrological Measurements. Water Resour. Res. 2025, 61, e2024WR037425. [Google Scholar] [CrossRef]
- Khorrami, B.; Ali, S.; Gündüz, O. An appraisal of the local-scale spatio-temporal variations of drought based on the integrated GRACE/GRACE-FO observations and fine-resolution FLDAS model. Hydrol. Process. 2023, 37, e15034. [Google Scholar] [CrossRef]
- Khorrami, B.; Ali, S.; Gündüz, O. Investigating the Local-scale Fluctuations of Groundwater Storage by Using Downscaled GRACE/GRACE-FO JPL Mascon Product Based on Machine Learning (ML) Algorithm. Water Resour. Manag. 2023, 37, 3439–3456. [Google Scholar] [CrossRef]
- Khorrami, B.; Gorjifard, S.; Ali, S.; Feizizadeh, B. Local-scale monitoring of evapotranspiration based on downscaled GRACE observations and remotely sensed data: An application of terrestrial water balance approach. Earth Sci. Inf. 2023, 16, 1329–1345. [Google Scholar] [CrossRef]
- Khorrami, B.; Pirasteh, S.; Ali, S.; Sahin, O.G.; Vaheddoost, B. Statistical downscaling of GRACE TWSA estimates to a 1-km spatial resolution for a local-scale surveillance of flooding potential. J. Hydrol. 2023, 624, 129929. [Google Scholar] [CrossRef]
- Wan, Z.; Zhang, K.; Xue, X.; Hong, Z.; Hong, Y.; Gourley, J.J. Water balance-based actual evapotranspiration reconstruction from ground and satellite observations over the conterminous United States. Water Resour. Res. 2015, 51, 6485–6499. [Google Scholar] [CrossRef]
- Yin, W.; Han, S.-C.; Zheng, W.; Yeo, I.-Y.; Hu, L.; Tangdamrongsub, N.; Ghobadi-Far, K. Improved water storage estimates within the North China Plain by assimilating GRACE data into the CABLE model. J. Hydrol. 2020, 590, 125348. [Google Scholar] [CrossRef]
- Rodell, M.; Houser, P.R.; Jambor, U.; Gottschalck, J.; Mitchell, K.; Meng, C.J.; Arsenault, K.; Cosgrove, B.; Radakovich, J.; Bosilovich, M.; et al. The Global Land Data Assimilation System. Bull. Am. Meteorol. Soc. 2004, 85, 381–394. [Google Scholar] [CrossRef]
- Meng, D.; Chen, B.; Gong, H.; Zhang, S.; Ma, R.; Zhou, C.; Lei, K.; Xu, L.; Wang, X. Land subsidence and rebound response to groundwater recovery in the Beijing Plain: A new hydrological perspective. J. Hydrol. Reg. Stud. 2025, 57, 102127. [Google Scholar] [CrossRef]
- Shi, M.; Gao, M.; Chen, Z.; Lyu, M.; Gong, H.; Zhai, Y.; Pan, Y. Land subsidence in Beijing: Response to the joint influence of the South-to-North Water Diversion Project and ecological water replenishment, observed by satellite radar interferometry. GISci. Remote Sens. 2024, 61, 2315708. [Google Scholar] [CrossRef]
- Chen, L.; He, Q.; Liu, K.; Li, J.; Jing, C. Downscaling of GRACE-Derived Groundwater Storage Based on the Random Forest Model. Remote Sens. 2019, 11, 2979. [Google Scholar] [CrossRef]
- Yang, R.; Zhong, Y.; Zhang, X.; Maimaitituersun, A.; Ju, X. A Comparative Study of Downscaling Methods for Groundwater Based on GRACE Data Using RFR and GWR Models in Jiangsu Province, China. Remote Sens. 2025, 17, 493. [Google Scholar] [CrossRef]
- Yin, W.; Hu, L.; Zhang, M.; Wang, J.; Han, S.-C. Statistical Downscaling of GRACE-Derived Groundwater Storage Using ET Data in the North China Plain. J. Geophys. Res.-Atmos. 2018, 123, 5973–5987. [Google Scholar] [CrossRef]
- Su, G.; Wu, Y.; Zhan, W.; Zheng, Z.; Chang, L.; Wang, J. Spatiotemporal evolution characteristics of land subsidence caused by groundwater depletion in the North China plain during the past six decades. J. Hydrol. 2021, 600, 126678. [Google Scholar] [CrossRef]
- Chen, B.; Gong, H.; Chen, Y.; Li, X.; Zhou, C.; Lei, K.; Zhu, L.; Duan, L.; Zhao, X. Land subsidence and its relation with groundwater aquifers in Beijing Plain of China. Sci. Total Environ. 2020, 735, 139111. [Google Scholar] [CrossRef] [PubMed]
- Ke, J.; Blum, H. A panel analysis of groundwater use in California. J. Clean. Prod. 2021, 326, 129357. [Google Scholar] [CrossRef]
- Liu, R.; Zhong, B.; Li, X.; Zheng, K.; Liang, H.; Cao, J.; Yan, X.; Lyu, H. Analysis of groundwater changes (2003–2020) in the North China Plain using geodetic measurements. J. Hydrol. Reg. Stud. 2022, 41, 101085. [Google Scholar] [CrossRef]
- Save, H.; Bettadpur, S.; Tapley, B.D. High-resolution CSR GRACE RL05 mascons. J. Geophys. Res. Solid Earth 2016, 121, 7547–7569. [Google Scholar] [CrossRef]
- Watkins, M.M.; Wiese, D.N.; Yuan, D.-N.; Boening, C.; Landerer, F.W. Improved methods for observing Earth’s time variable mass distribution with GRACE using spherical cap mascons. J. Geophys. Res. Solid Earth 2015, 120, 2648–2671. [Google Scholar] [CrossRef]
- Loomis, B.D.; Luthcke, S.B.; Sabaka, T.J. Regularization and error characterization of GRACE mascons. J. Geod. 2019, 93, 1381–1398. [Google Scholar] [CrossRef]
- Yang, X.; You, W.; Tian, S.; Jiang, Z.; Wan, X. A Two-Step Linear Model to Fill the Data Gap Between GRACE and GRACE-FO Terrestrial Water Storage Anomalies. Water Resour. Res. 2023, 59, e2022WR034139. [Google Scholar] [CrossRef]
- Müller Schmied, H.; Cáceres, D.; Eisner, S.; Flörke, M.; Herbert, C.; Niemann, C.; Peiris, T.A.; Popat, E.; Portmann, F.T.; Reinecke, R.; et al. The global water resources and use model WaterGAP v2.2d: Model description and evaluation. Geosci. Model Dev. 2021, 14, 1037–1079. [Google Scholar] [CrossRef]
- Guoliang, C. Evalution of Groundwater System in the North China Plain Using Groundwater Modeling. Ph.D. Thesis, China University of Geosciences, Beijing, China, 2013. [Google Scholar]
- Liu, P.-W.; Famiglietti, J.S.; Purdy, A.J.; Adams, K.H.; McEvoy, A.L.; Reager, J.T.; Bindlish, R.; Wiese, D.N.; David, C.H.; Rodell, M. Groundwater depletion in California’s Central Valley accelerates during megadrought. Nat. Commun. 2022, 13, 7825. [Google Scholar] [CrossRef]
- Perissin, D.; Wang, Z.; Wang, T. The SARPROZ InSAR tool for urban subsidence/manmade structure stability monitoring in China. In Proceedings of the ISRSE 2010, Sidney, Australia, 10–15 April 2011. [Google Scholar]
- NASA. Shuttle Radar Topography Mission 1-Arc Second Global. Available online: https://cmr.earthdata.nasa.gov/search/concepts/C1220567890-USGS_LTA.html (accessed on 25 September 2025).
- Castellazzi, P.; Arroyo-Domínguez, N.; Martel, R.; Calderhead, A.I.; Normand, J.C.L.; Gárfias, J.; Rivera, A. Land subsidence in major cities of Central Mexico: Interpreting InSAR-derived land subsidence mapping with hydrogeological data. Int. J. Appl. Earth Obs. Geoinf. 2016, 47, 102–111. [Google Scholar] [CrossRef]
- Jones, D.R. A Taxonomy of Global Optimization Methods Based on Response Surfaces. J. Glob. Optim. 2001, 21, 345–383. [Google Scholar] [CrossRef]
- Bhanja, S.N.; Mukherjee, A.; Saha, D.; Velicogna, I.; Famiglietti, J.S. Validation of GRACE based groundwater storage anomaly using in-situ groundwater level measurements in India. J. Hydrol. 2016, 543, 729–738. [Google Scholar] [CrossRef]
- Cao, Y.; Nan, Z.; Cheng, G. GRACE Gravity Satellite Observations of Terrestrial Water Storage Changes for Drought Characterization in the Arid Land of Northwestern China. Remote Sens. 2015, 7, 1021–1047. [Google Scholar] [CrossRef]
- Agarwal, V.; Akyilmaz, O.; Shum, C.K.; Feng, W.; Yang, T.-Y.; Forootan, E.; Syed, T.H.; Haritashya, U.K.; Uz, M. Machine learning based downscaling of GRACE-estimated groundwater in Central Valley, California. Sci. Total Environ. 2023, 865, 161138. [Google Scholar] [CrossRef]
- Ali, S.; Ran, J.; Luan, Y.; Khorrami, B.; Xiao, Y.; Tangdamrongsub, N. The GWR model-based regional downscaling of GRACE/GRACE-FO derived groundwater storage to investigate local-scale variations in the North China Plain. Sci. Total Environ. 2024, 908, 168239. [Google Scholar] [CrossRef]
- Chen, Z.; Nie, Z.; Zhang, Z.; Qi, J.; Nan, Y. Isotopes and sustainability of ground water resources, North China Plain. Groundwater 2005, 43, 485–493. [Google Scholar] [CrossRef]
- Zhang, X.; Chen, B.; Gong, H.; Lei, K.; Zhou, C.; Lu, Z.; Zhao, D. Inversion of Groundwater Storage Variations Considering Lag Effect in Beijing Plain, from RadarSat-2 with SBAS-InSAR Technology. Remote Sens. 2022, 14, 991. [Google Scholar] [CrossRef]
- Ochoa-González, G.H.; Carreón-Freyre, D.; Franceschini, A.; Cerca, M.; Teatini, P. Overexploitation of groundwater resources in the faulted basin of Querétaro, Mexico: A 3D deformation and stress analysis. Eng. Geol. 2018, 245, 192–206. [Google Scholar] [CrossRef]
- Lundgren, P.; Liu, Z.; Ali, S.T. San Andreas Fault Stress Change Due To Groundwater Withdrawal in California’s Central Valley, 1860–2010. Geophys. Res. Lett. 2022, 49, e2021GL095975. [Google Scholar] [CrossRef]
- Hu, X.; Bürgmann, R. Aquifer deformation and active faulting in Salt Lake Valley, Utah, USA. Earth Planet. Sci. Lett. 2020, 547, 116471. [Google Scholar] [CrossRef]
Disclaimer/Publisher’s Note: The statements, opinions and data contained in all publications are solely those of the individual author(s) and contributor(s) and not of MDPI and/or the editor(s). MDPI and/or the editor(s) disclaim responsibility for any injury to people or property resulting from any ideas, methods, instructions or products referred to in the content. |
© 2025 by the authors. Licensee MDPI, Basel, Switzerland. This article is an open access article distributed under the terms and conditions of the Creative Commons Attribution (CC BY) license (https://creativecommons.org/licenses/by/4.0/).