1. Introduction
The geological environment is continuously undergoing gradual dynamic evolution. Within the evolving geological environment, landslides manifest different activity states, including stable state, deep-seated creep-clip state, and local deformation state. The development characteristics of stable ancient landslides (inactive landslides) can reflect the inherent disaster-causing background at the time of their occurrence. Conversely, active landslides are the products of the current disaster-causing background and the development characteristics of active landslides can better reflect the current disaster-causing background. Under identical triggering conditions, slopes exhibiting similar disaster-causing background with active landslide are more likely to experience slope failure, thereby demonstrating a higher landslide susceptibility.
Landslide susceptibility denotes the likelihood of slope instability and failure under existing geological environment conditions. Landslide susceptibility assessment constitutes a critical component of landslide disaster research and serves as a fundamental prerequisite for conducting landslide disaster risk assessment. The models for landslide susceptibility assessment can be classified into qualitative and quantitative approaches. Among these, the widely adopted and well-established models include information value model (IV) [
1,
2], frequency ratio model (FR) [
3,
4], evidential weight model (EW) [
5], logistic regression model (LR) [
6], support vector machine model (SVM) [
7], artificial neural network model (ANN) [
8], and machine learning model (ML) [
9]. Current studies on landslide susceptibility primarily center on exploring differences and identifying optimal solutions among assessment models [
8], disaster-causing factors [
10], and landslide samples [
11]. However, the studies on landslide susceptibility that incorporate the characteristics and intensity of landslide activities remain relatively limited. Slope deformation serves as a critical indicator of landslide activity and is increasingly being incorporated into landslide susceptibility assessment [
12,
13]. It has been applied in several landslide susceptibility studies conducted across diverse regions, including Messina Province in Italy [
14], the Arno River basin in central Italy [
15], the north Lisbon region, Portugal [
16], and western Hubei Province in China [
17]. Nevertheless, slope deformation represents a specific phase in the evolution of landslides rather than a natural geological environmental factor that directly influences landslide development.
The upper Jinsha River in the Qinghai–Tibet Plateau is characterized by deep river valleys and fragmented rock masses, which frequently experience geological disasters. Among these, landslides are the most prevalent, widely distributed, and damaging. In the Baiyu–Batang section of the upper Jinsha River, some large landslides have developed, some of which have triggered damming, subsequent dam failure, and flood disaster chains, as exemplified by the Xuelongnang landslide [
18] and the Baige landslide [
19]. Additionally, numerous old landslides and unstable slopes remain in a long-term slow deformation phase, including the Woda landslide [
20], the Xiongba landslide [
21], the Chashushan landslide [
22], and the Xiaomojiu landslide [
23]. To date, several studies on landslide susceptibility assessment in the upper Jinsha River have been conducted, yielding credible results [
24,
25,
26,
27]. Nevertheless, the influence of landslide activity on landslide susceptibility has not been sufficiently investigated in these studies.
This study aims to propose a comprehensive framework for landslide susceptibility assessment incorporating landslide activity. Taking the Baiyu–Batang section of the upper Jinsha River as a case study, multi-source remote sensing techniques and field surveys are employed to systematically analyze landslide activity characteristics, classify landslides into active and inactive categories, and conduct a landslide susceptibility assessment incorporating these activity features. The findings highlight the critical influence of landslide activity on landslide susceptibility assessment. The methodology and outcomes can provide valuable insights for enhancing the accuracy of landslide susceptibility assessments in tectonically active and mountainous canyon regions.
2. Geological Setting
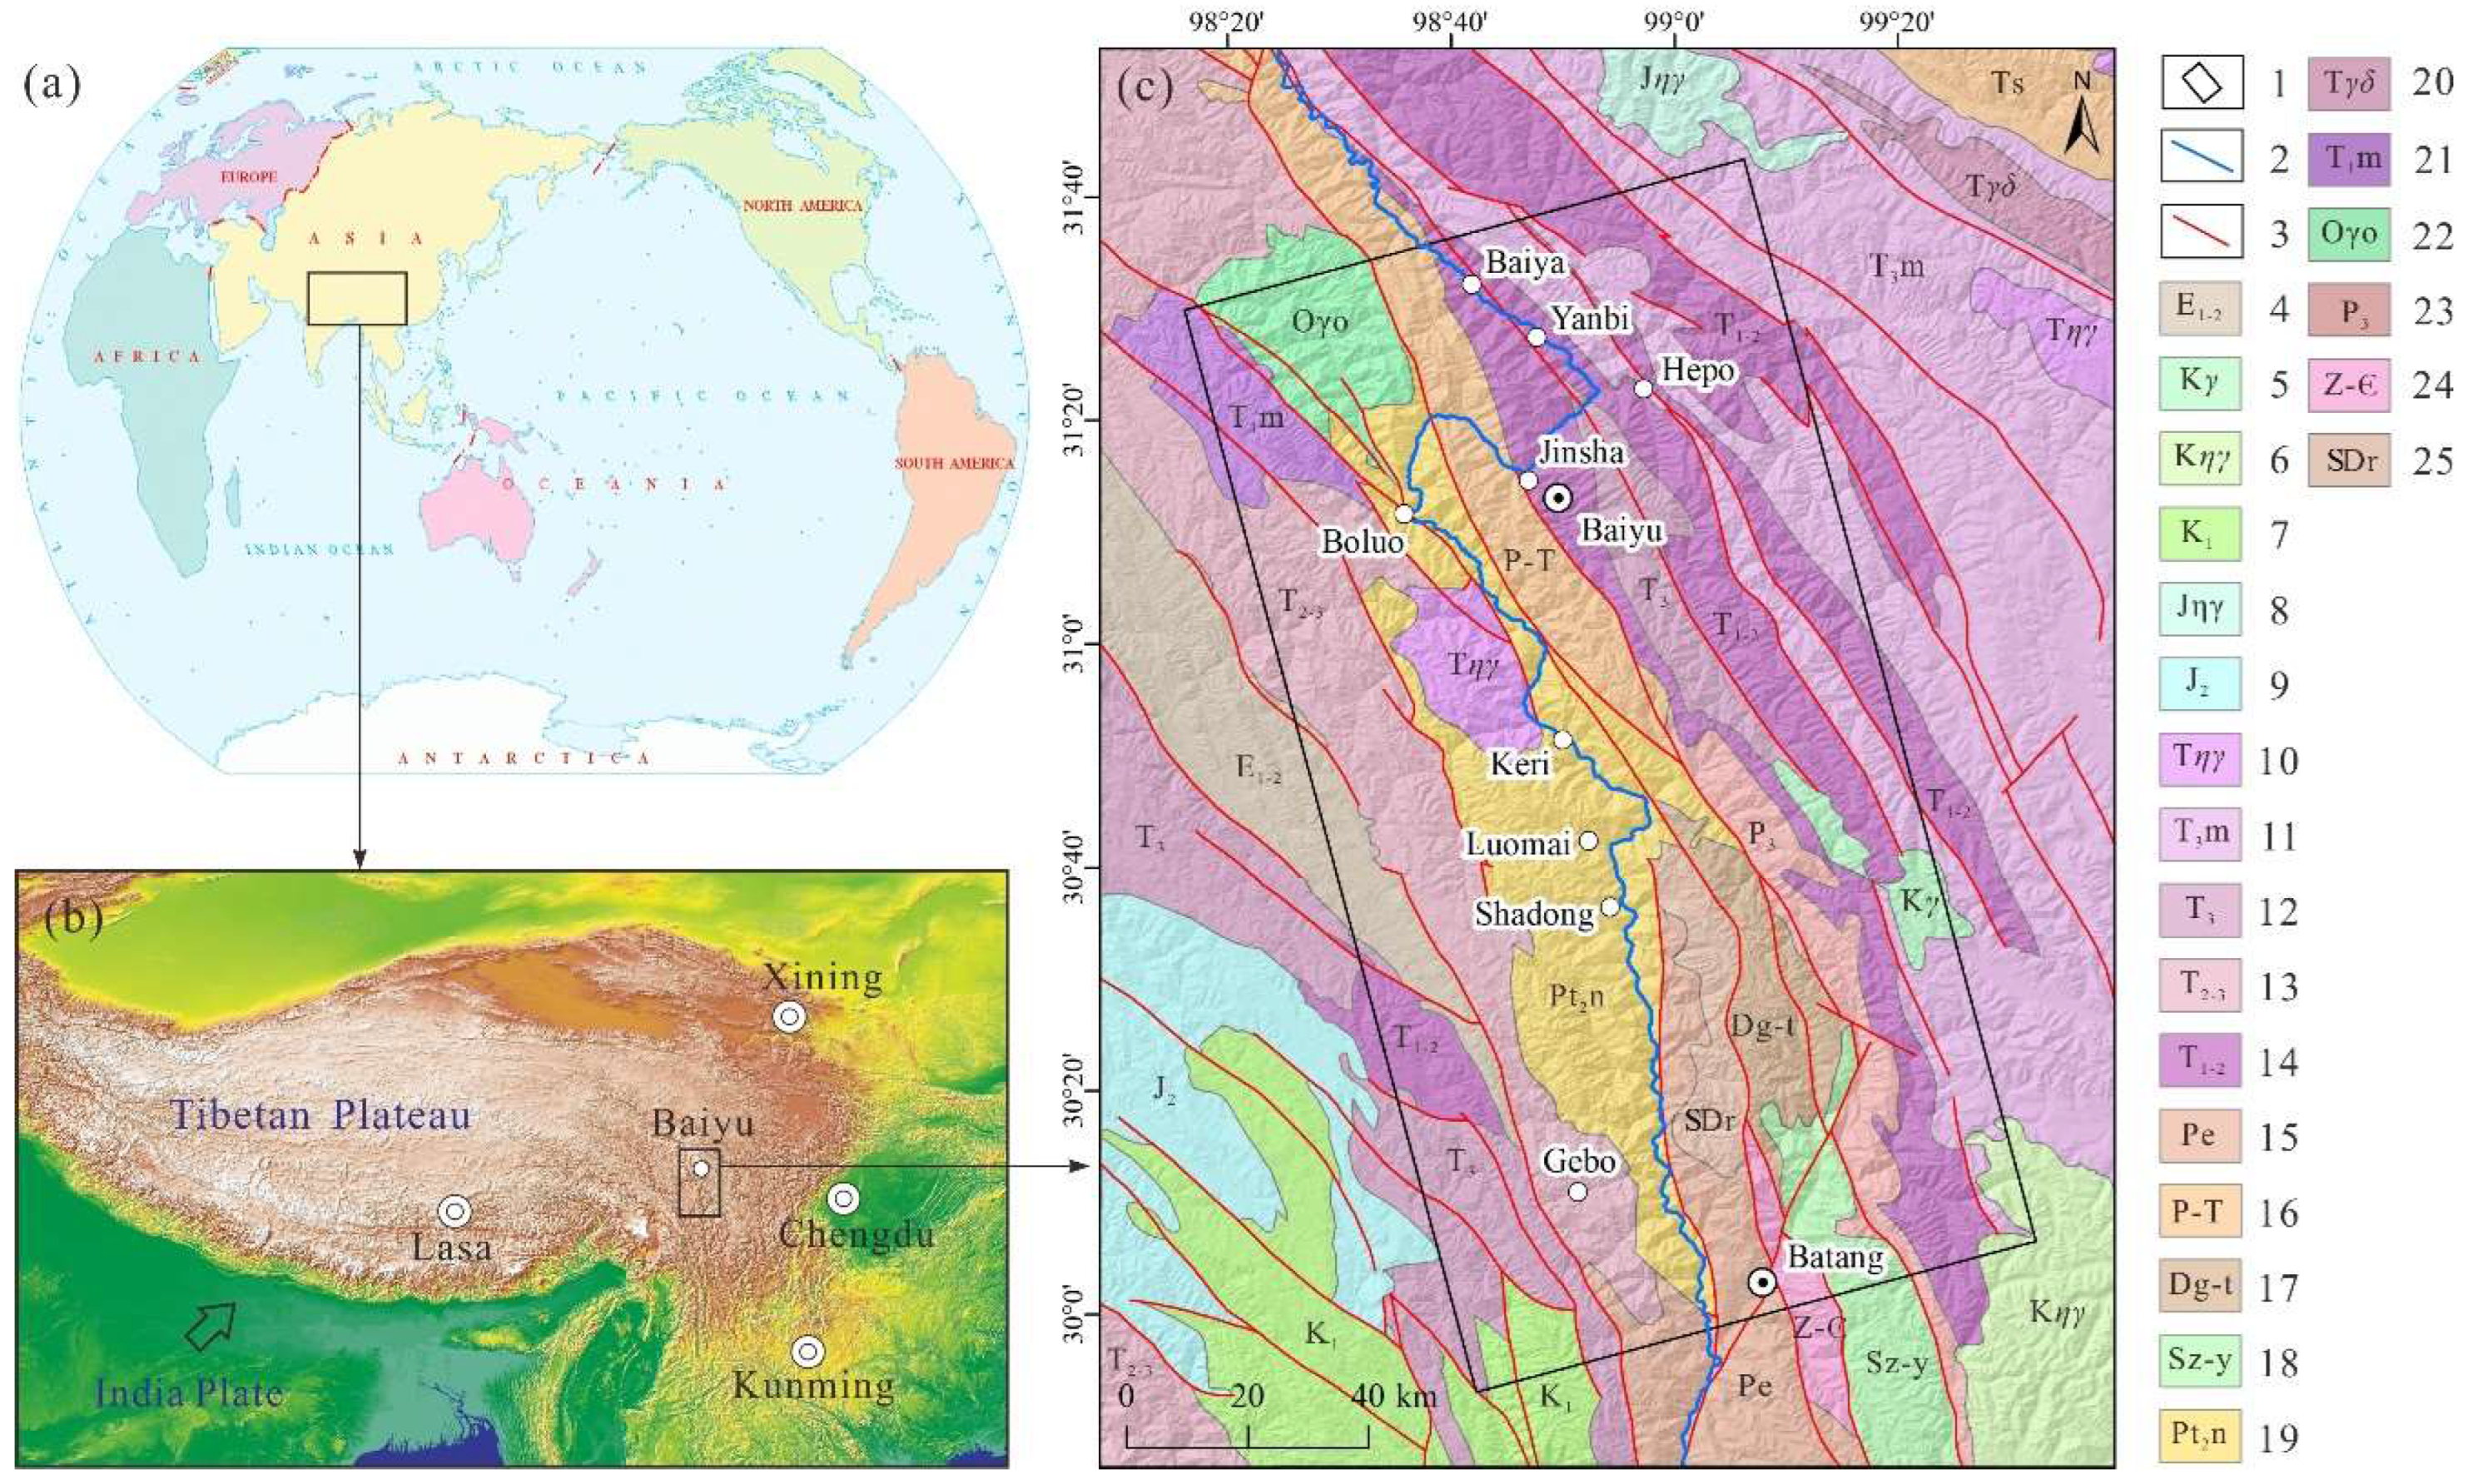
The Baiyu–Batang section of the upper Jinsha River is situated on the eastern Qinghai–Tibet Plateau (
Figure 1). This region represents a transitional zone between the second and first topographic steps of China. Characterized by deep valleys and steep slopes, it exhibits a typical “V”-shaped mountainous canyon landscape. The elevation ranges from 2472 m to 6055 m, with a maximum relief of approximately 3580 m. Terrain slopes generally vary between 25° and 40°, with some areas exceeding 55°.
The Baiyu–Batang section of the upper Jinsha River is characterized by a complex geological structure, marked by intense neotectonic activity and well-developed folds and faults. The primary fault zones in the region are the NNW-trending Jinshajiang Fault Zone, an active fault system dating back to the Middle–Late Pleistocene, and the NNE-trending Batang Fault Zone, which has been active since the Holocene. The region exhibits a diverse lithological composition, dominated by widespread regional metamorphic and igneous rocks. Major exposed strata include formations from the Quaternary, Cretaceous, Triassic, Permian, and Devonian system. Common rock types include granite, limestone, sandstone, phyllite, and gneiss. Under the influence of strong tectonic forces, tectonic mélange and altered rocks are extensively developed. The Quaternary deposits mainly consist of modern floodplain alluvial sand, silt, and terrace alluvial gravel.
The Baiyu–Batang section of the upper Jinsha River is located within the sub-humid climatic zone. The region experiences abundant sunshine and maintains a mean annual temperature of approximately 6.5 °C. Precipitation is limited and highly seasonal, with the majority occurring between May and September. The maximum annual precipitation reaches 828.8 mm, while the average annual precipitation is 490 mm. Due to pronounced topographic relief and significant elevation differences, vegetation exhibits a distinct vertical zonation pattern.
3. Methods and Data
3.1. Comprehensive Study Framework
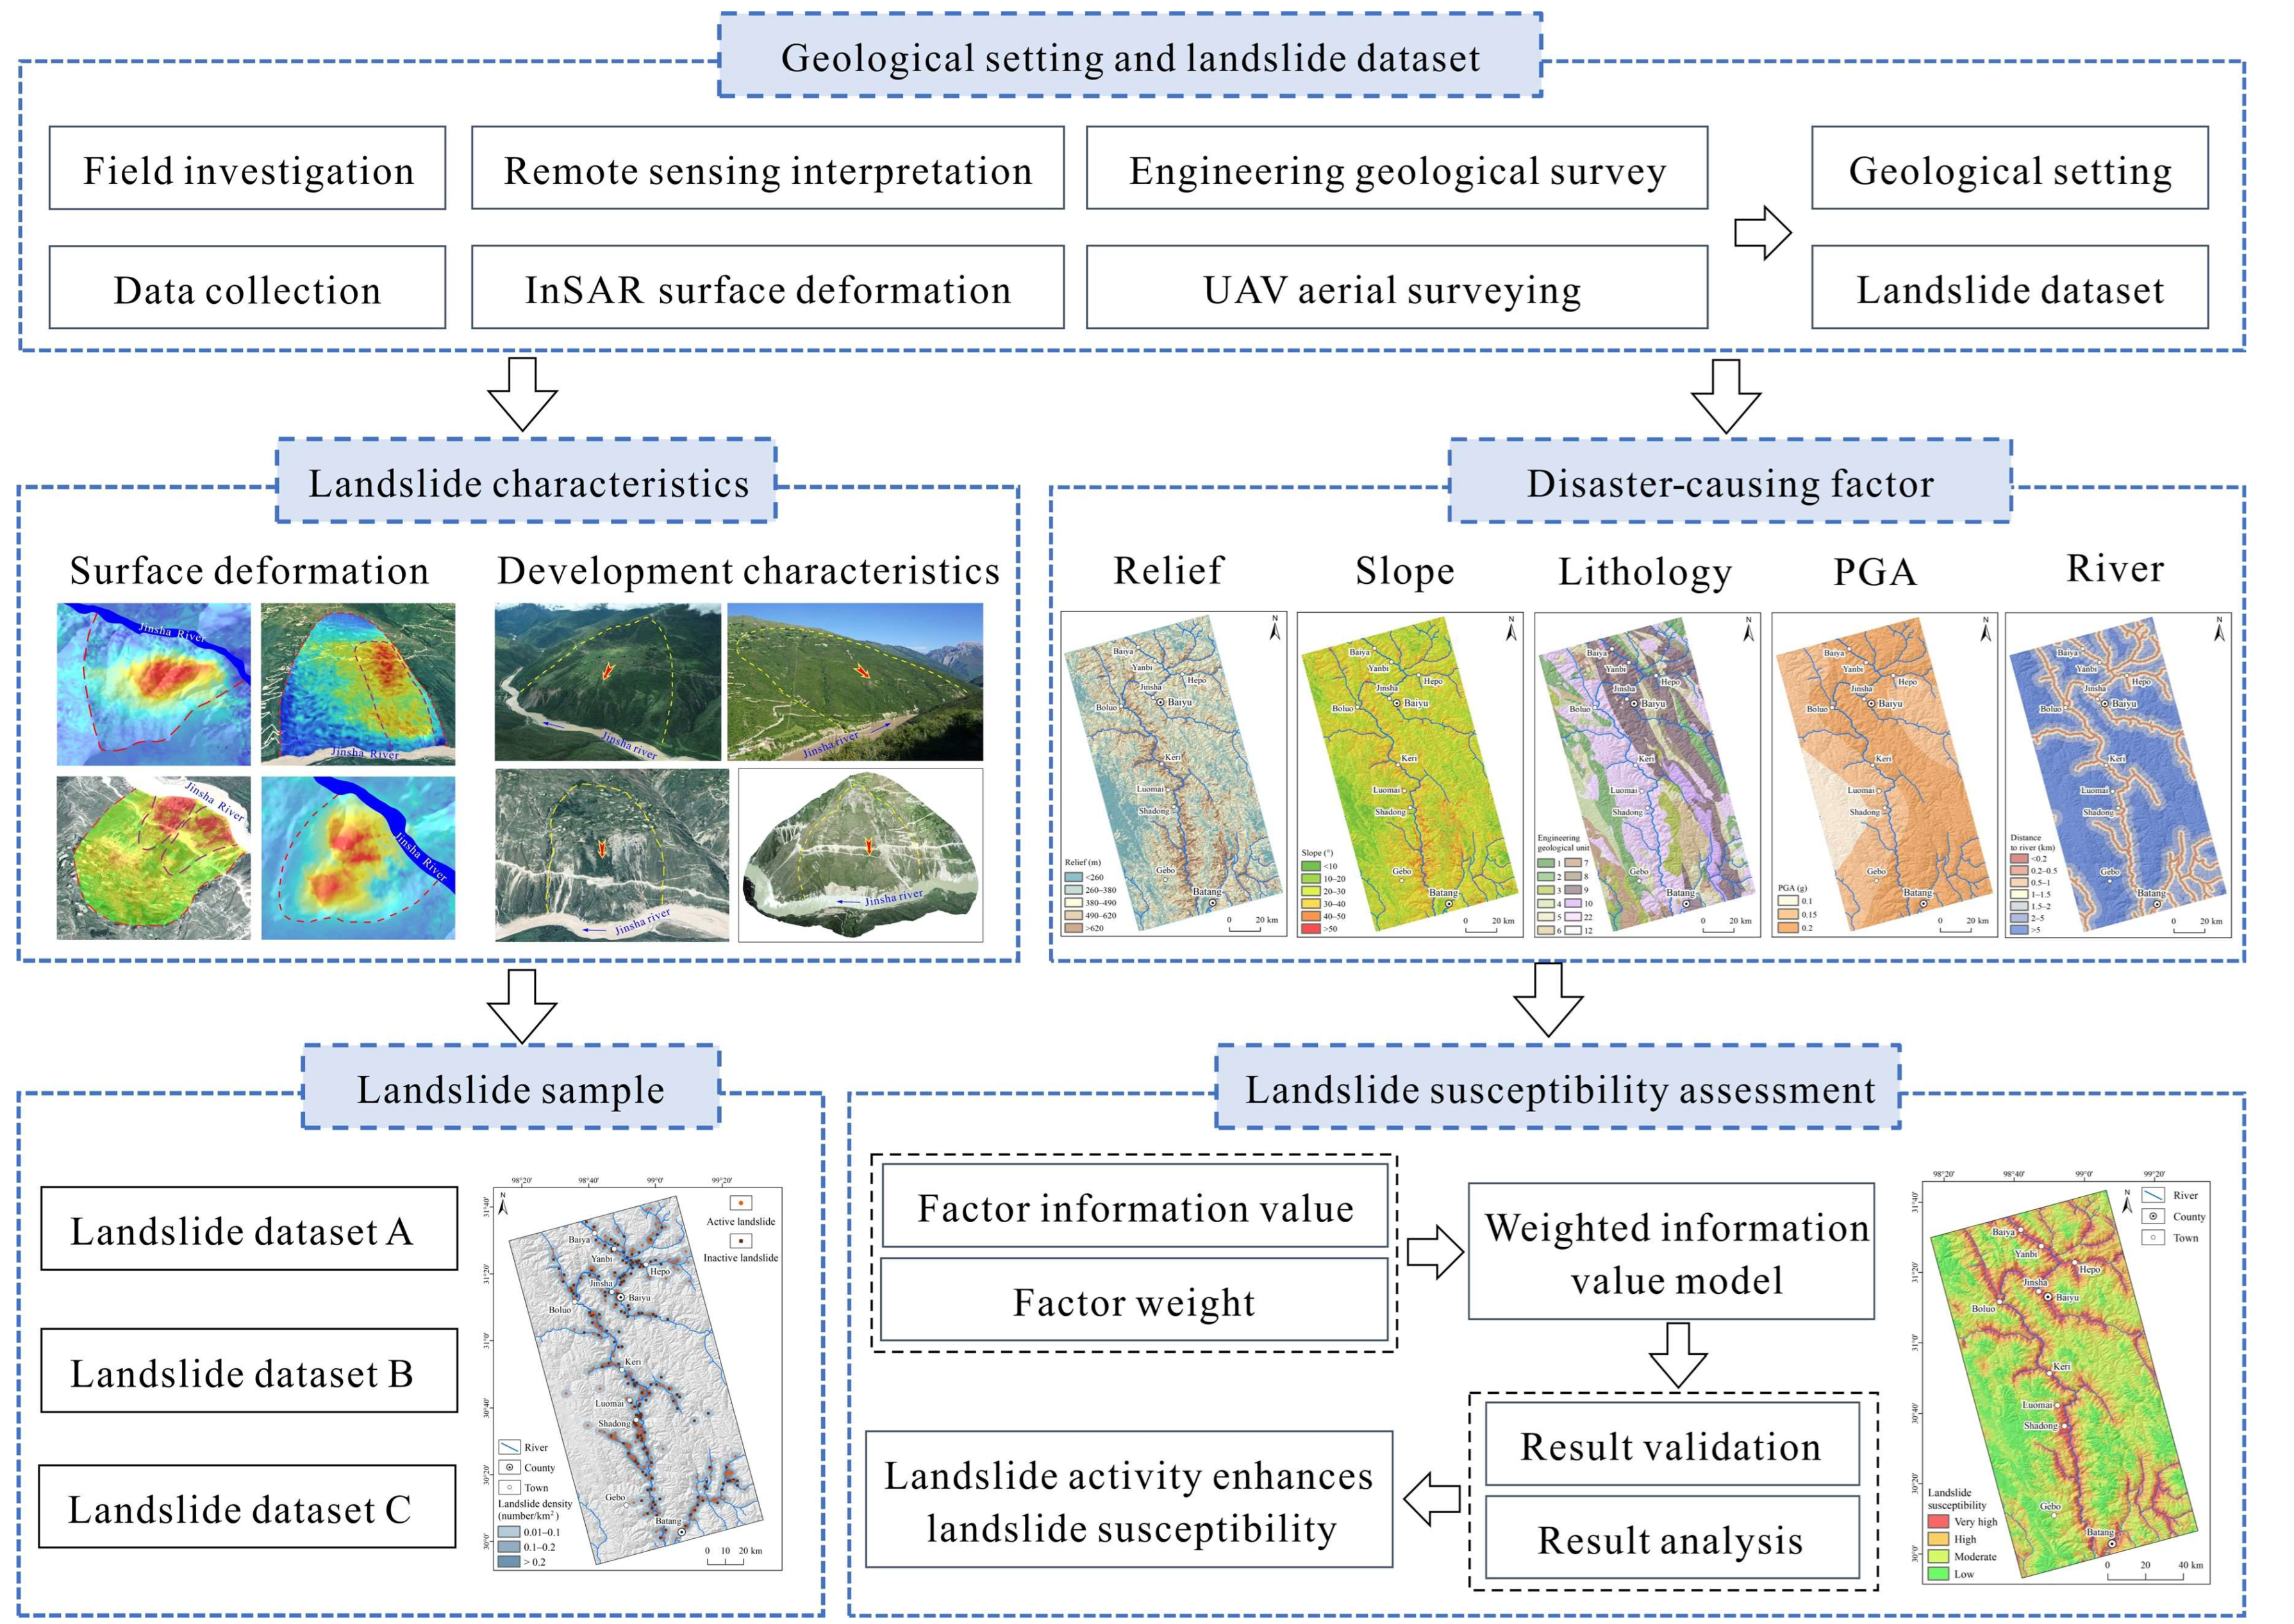
For assessing landslide susceptibility in regions characterized by active geological structures as well as complex topography and geomorphology, landslide activity represents a critical factor that must be taken into account. Based on this, a comprehensive study framework for landslide susceptibility assessment incorporating landslide activity was proposed (
Figure 2). The methodology consists of the following six key steps: (1) the regional geological setting and landslide dataset are collected and compiled using technical approaches including data collection, multi-source remote sensing interpretation, InSAR deformation monitoring, and field investigations; (2) landslide development and activity characteristics are analyzed to distinguish active from inactive landslides, leading to the establishment of three distinct landslide sample datasets; (3) the spatial relationships between active/inactive landslides and disaster-causing factors were statistically analyzed. Through sensitivity analysis of these factors, a factor index system is established; (4) factor weights are determined using the analytic hierarchy process model, while factor information values are calculated using the landslide sample datasets and the information value model; (5) factor-weighted information values are computed by integrating the factor weights with the corresponding information values; (6) the accuracy and reliability of the landslide susceptibility assessment results are evaluated through validation and comparative analysis.
3.2. Landslide Investigation
Landslide investigation primarily integrates the interpretation of satellite remote sensing imagery with InSAR-based surface deformation monitoring results, employing technical approaches such as low-altitude unmanned aerial vehicles (UAVs) and engineering geological surveys to systematically analyze landslide activity characteristics and their geological environment. The historical multi-temporal optical remote sensing data are utilized to identify patterns of landslide development and evolution, while InSAR technology is applied to extract time-series deformation information. For representative landslide zones, DJI low-altitude UAVs are deployed to conduct photogrammetric surveys, facilitating the production of high-precision orthophotos and digital elevation models with a ground spatial resolution of 0.2 m.
3.3. SBAS-InSAR
The InSAR technique enables the effective retrieval of surface deformation information by utilizing multi-temporal SAR data acquired over the same geographic area [
28,
29]. Among these techniques, SBAS-InSAR is a well-established time-series InSAR approach [
30,
31] that partitions SAR images into multiple small baseline subsets according to predefined spatial and temporal baseline thresholds. Each subset is then processed using the least squares method to derive continuous time-series surface deformation results. SBAS-InSAR effectively mitigates decorrelation caused by long spatial baselines and atmospheric disturbances, while simultaneously improving spatiotemporal coherence, increasing sampling density, and offering reliable performance in regions with limited persistent scatterers. The SBAS-InSAR technique has been extensively applied in landslide identification and monitoring studies [
32,
33]. In this study, SBAS-InSAR processing is conducted using the GAMMA 2023 software platform and Sentinel-1 SAR data with ascending orbit [
34]. A 30-m-resolution SRTM digital elevation model (DEM) is employed to eliminate topographic phase contributions. The time baseline is 48 days and the spatial baseline is 200 m. The minimum cost flow (MCF) method is used to complete phase unwrapping, ultimately yielding time-series surface deformation for the period from January 2016 to February 2025.
3.4. Weighted Information Value Model
As a bivariate statistical technique, the information value model utilizes actual landslide data to assess the stability of geological bodies [
1,
2]. In this model, landslide susceptibility is strongly influenced by both the quantity and quality of the information value derived from disaster-causing factors. The calculation of information value is as follows (Formula (1)). In the formula,
Ii represents the information value of the
i-th grade interval of the disaster-causing factor,
Ni represents the landslide area or the landslide number corresponding to the
i-th grade interval of the disaster-causing factor,
N represents the total landslide area or landslide number,
Si represents the area occupied by the
i-th grade interval of the disaster-causing factor,
S represents the total area.
The total information value can be computed using Formula (2), where
I denotes the total information value and
n denotes the number of disaster-causing factors.
The analytic hierarchy process model is a decision-making framework designed to handle multiple criteria by combining qualitative and quantitative analyses. It enables the effective quantification of expert opinions, which can then be systematically incorporated into the decision-making process [
35,
36]. The fundamental principle of AHP involves three key steps. Firstly, constructing a hierarchical structure model in which assessment factors are organized into multiple levels—typically with the decision-making level at the top, the scheme level at the bottom, and one or more intermediate levels in between. Then, performing pairwise comparisons of the assessment factors to construct a judgment matrix. Finally, the maximum eigenvalue λmax of the judgment matrix is calculated, followed by a consistency check to ensure the reliability of the pairwise comparisons. Once the consistency check is passed, the weight values corresponding to each assessment factor are determined.
Building upon the information value model and integrating it with the analytic hierarchy process model, this approach assigns an appropriate weighted information value to the assessment unit (Formula (3)), referred to as the weighted information value model. In this formula,
Iw denotes the weighted information value,
Ii denotes the information value of the
i-th factor, and
Wi denotes the weight value of the
i-th factor.
3.5. Data
Landslide data are primarily acquired through literature reviews, remote sensing interpretation, and field surveys. Satellite-based optical remote sensing imageries are obtained from Google Earth and the World Imagery Wayback platform (
https://livingatlas.arcgis.com/wayback/, accessed on 15 February 2025). And satellite-based SAR data are obtained from the European Space Agency (ESA), comprising 244 scenes of Sentinel-1 ascending orbit imagery collected between January 2016 and February 2025 (
Table 1). These data are in the C-band (wavelength: 5.6 cm) with an incidence angle of 37.48°. The elevation data (SRTM DEM) are obtained from the USGS (
https://earthexplorer.usgs.gov/, accessed on 1 March 2025) with a resolution of 30 m [
37]. The topographic relief, slope gradient, and slope aspect can be calculated from the DEM dataset using ArcGIS 10.8 software [
38]. Stratum lithology and active fault information are derived from 1:200,000 regional geological maps, based on which engineering geological units are classified according to lithological characteristics and rock mass structure. Rainfall data are acquired from the National Meteorological Science Data Center (
https://data.cma.cn/, accessed on 15 February 2025). The peak ground acceleration data are derived from the “Seismic Motion Parameter Zonation Map of China” (
https://www.gb18306.net/, accessed on 20 February 2025). River distribution data are obtained from a 1:1,000,000 Chinese geographic dataset (
https://www.webmap.cn/commres.do?method=dataDownload, accessed on 20 February 2025) and supplemented by visual interpretation from Google Earth. Normalized difference vegetation index (NDVI) data are assessed using Landsat 8 imagery (
https://earthexplorer.usgs.gov/, accessed on 25 February 2025), with a resolution of 30 m.
4. Results
4.1. Landslide Characteristics
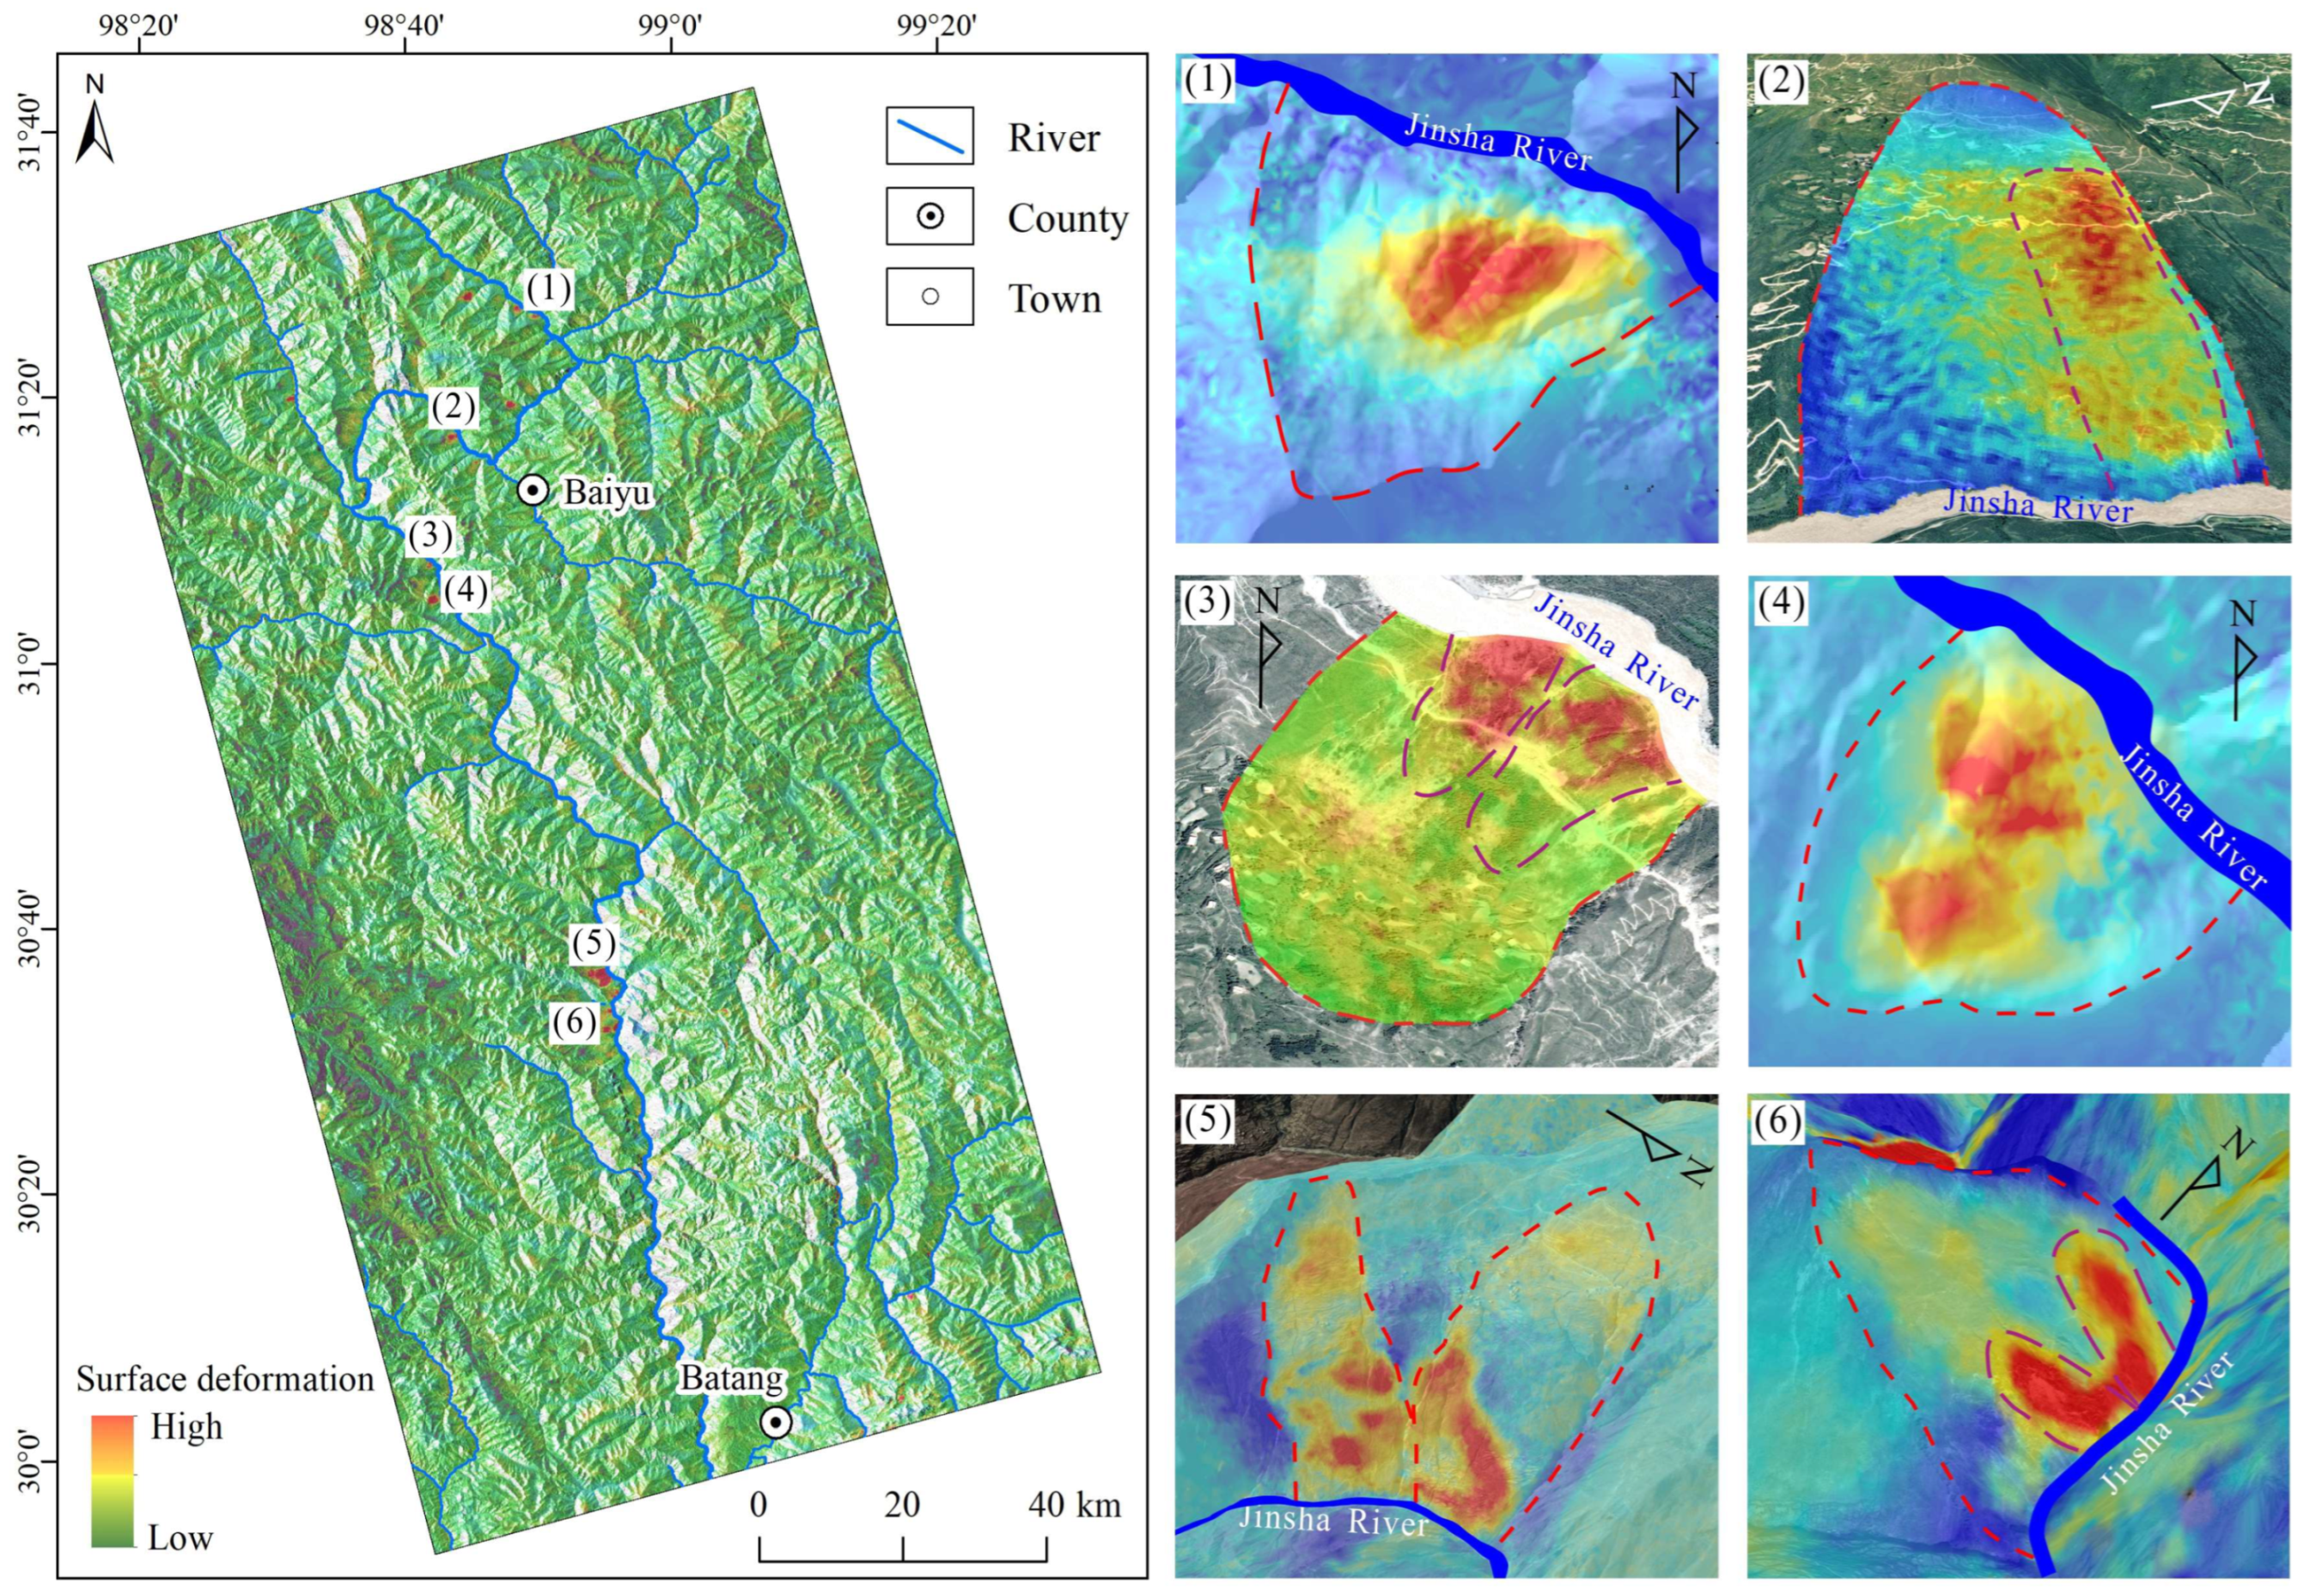
The landslide dataset provides the essential foundation for assessing landslide susceptibility. Firstly, we compile the 1:50,000 and 1:100,000 county-level landslide survey data provided by the Ministry of Natural Resources of China. Subsequently, multi-source optical remote sensing is employed for landslide interpretation, alongside InSAR-based deformation monitoring (
Figure 3). Finally, field surveys are carried out to verify the collected landslide data, remote sensing interpretation, and deformation monitoring results (
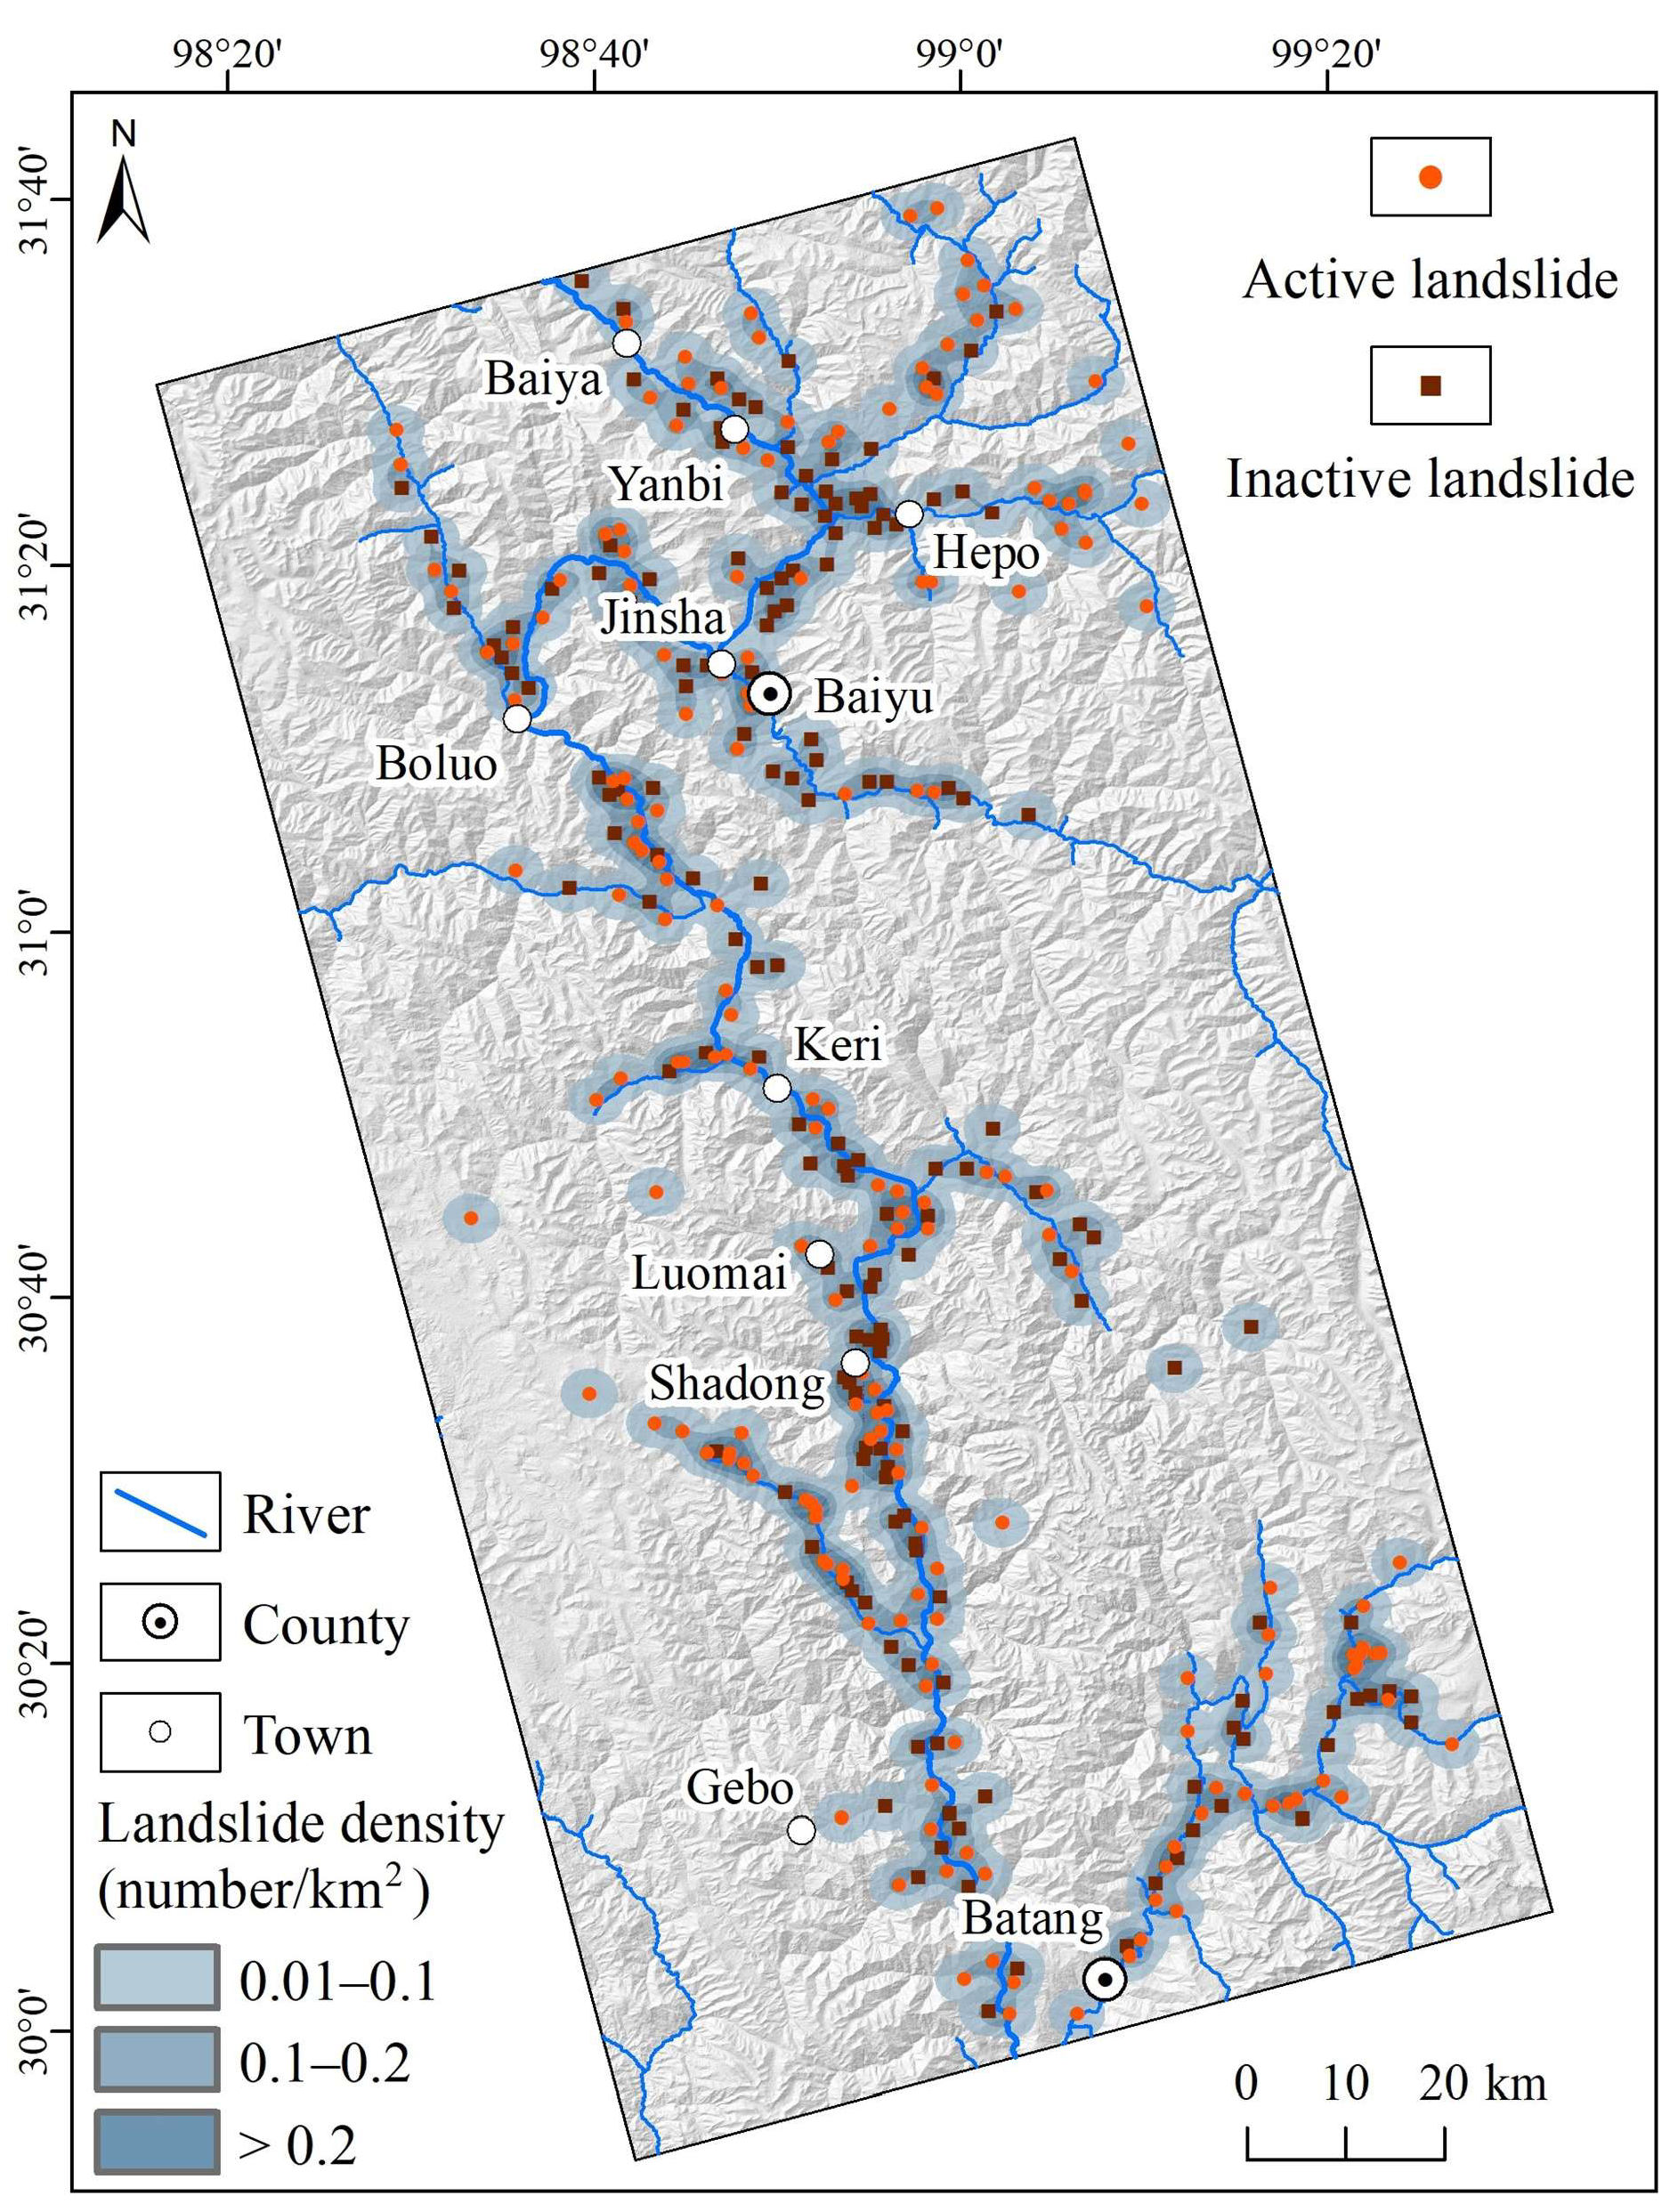
Figure 4), thereby refining the landslide dataset. The final dataset comprises 366 landslides (
Figure 5), of which 190 are classified as active landslides and 176 as inactive landslides.
Statistical analysis reveals that the total area affected by landslides is about 1380.65 km2, with the largest individual landslide covering an area of 6.99 km2. Landslide development and spatial distribution are strongly influenced by active faults, topographic features, and lithological characteristics. These landslides typically exhibit a linear distribution pattern along rivers such as the Jinsha River and Jiangqu River, with inactive landslides predominantly concentrated along the main river channels. Inactive landslides include some large and giant ancient landslides, which may reactivate and transform into active landslides under prolonged cumulative effects of external triggering factors like earthquakes and rainfall. To explore the influence of landslide activity characteristics on landslide susceptibility assessment, the landslide dataset is categorized into three subsets: Dataset A (including 190 active landslides), Dataset B (including both 190 active and 176 inactive landslides), and Dataset C (including 176 inactive landslides).
4.2. Factor Sensitivity Analysis
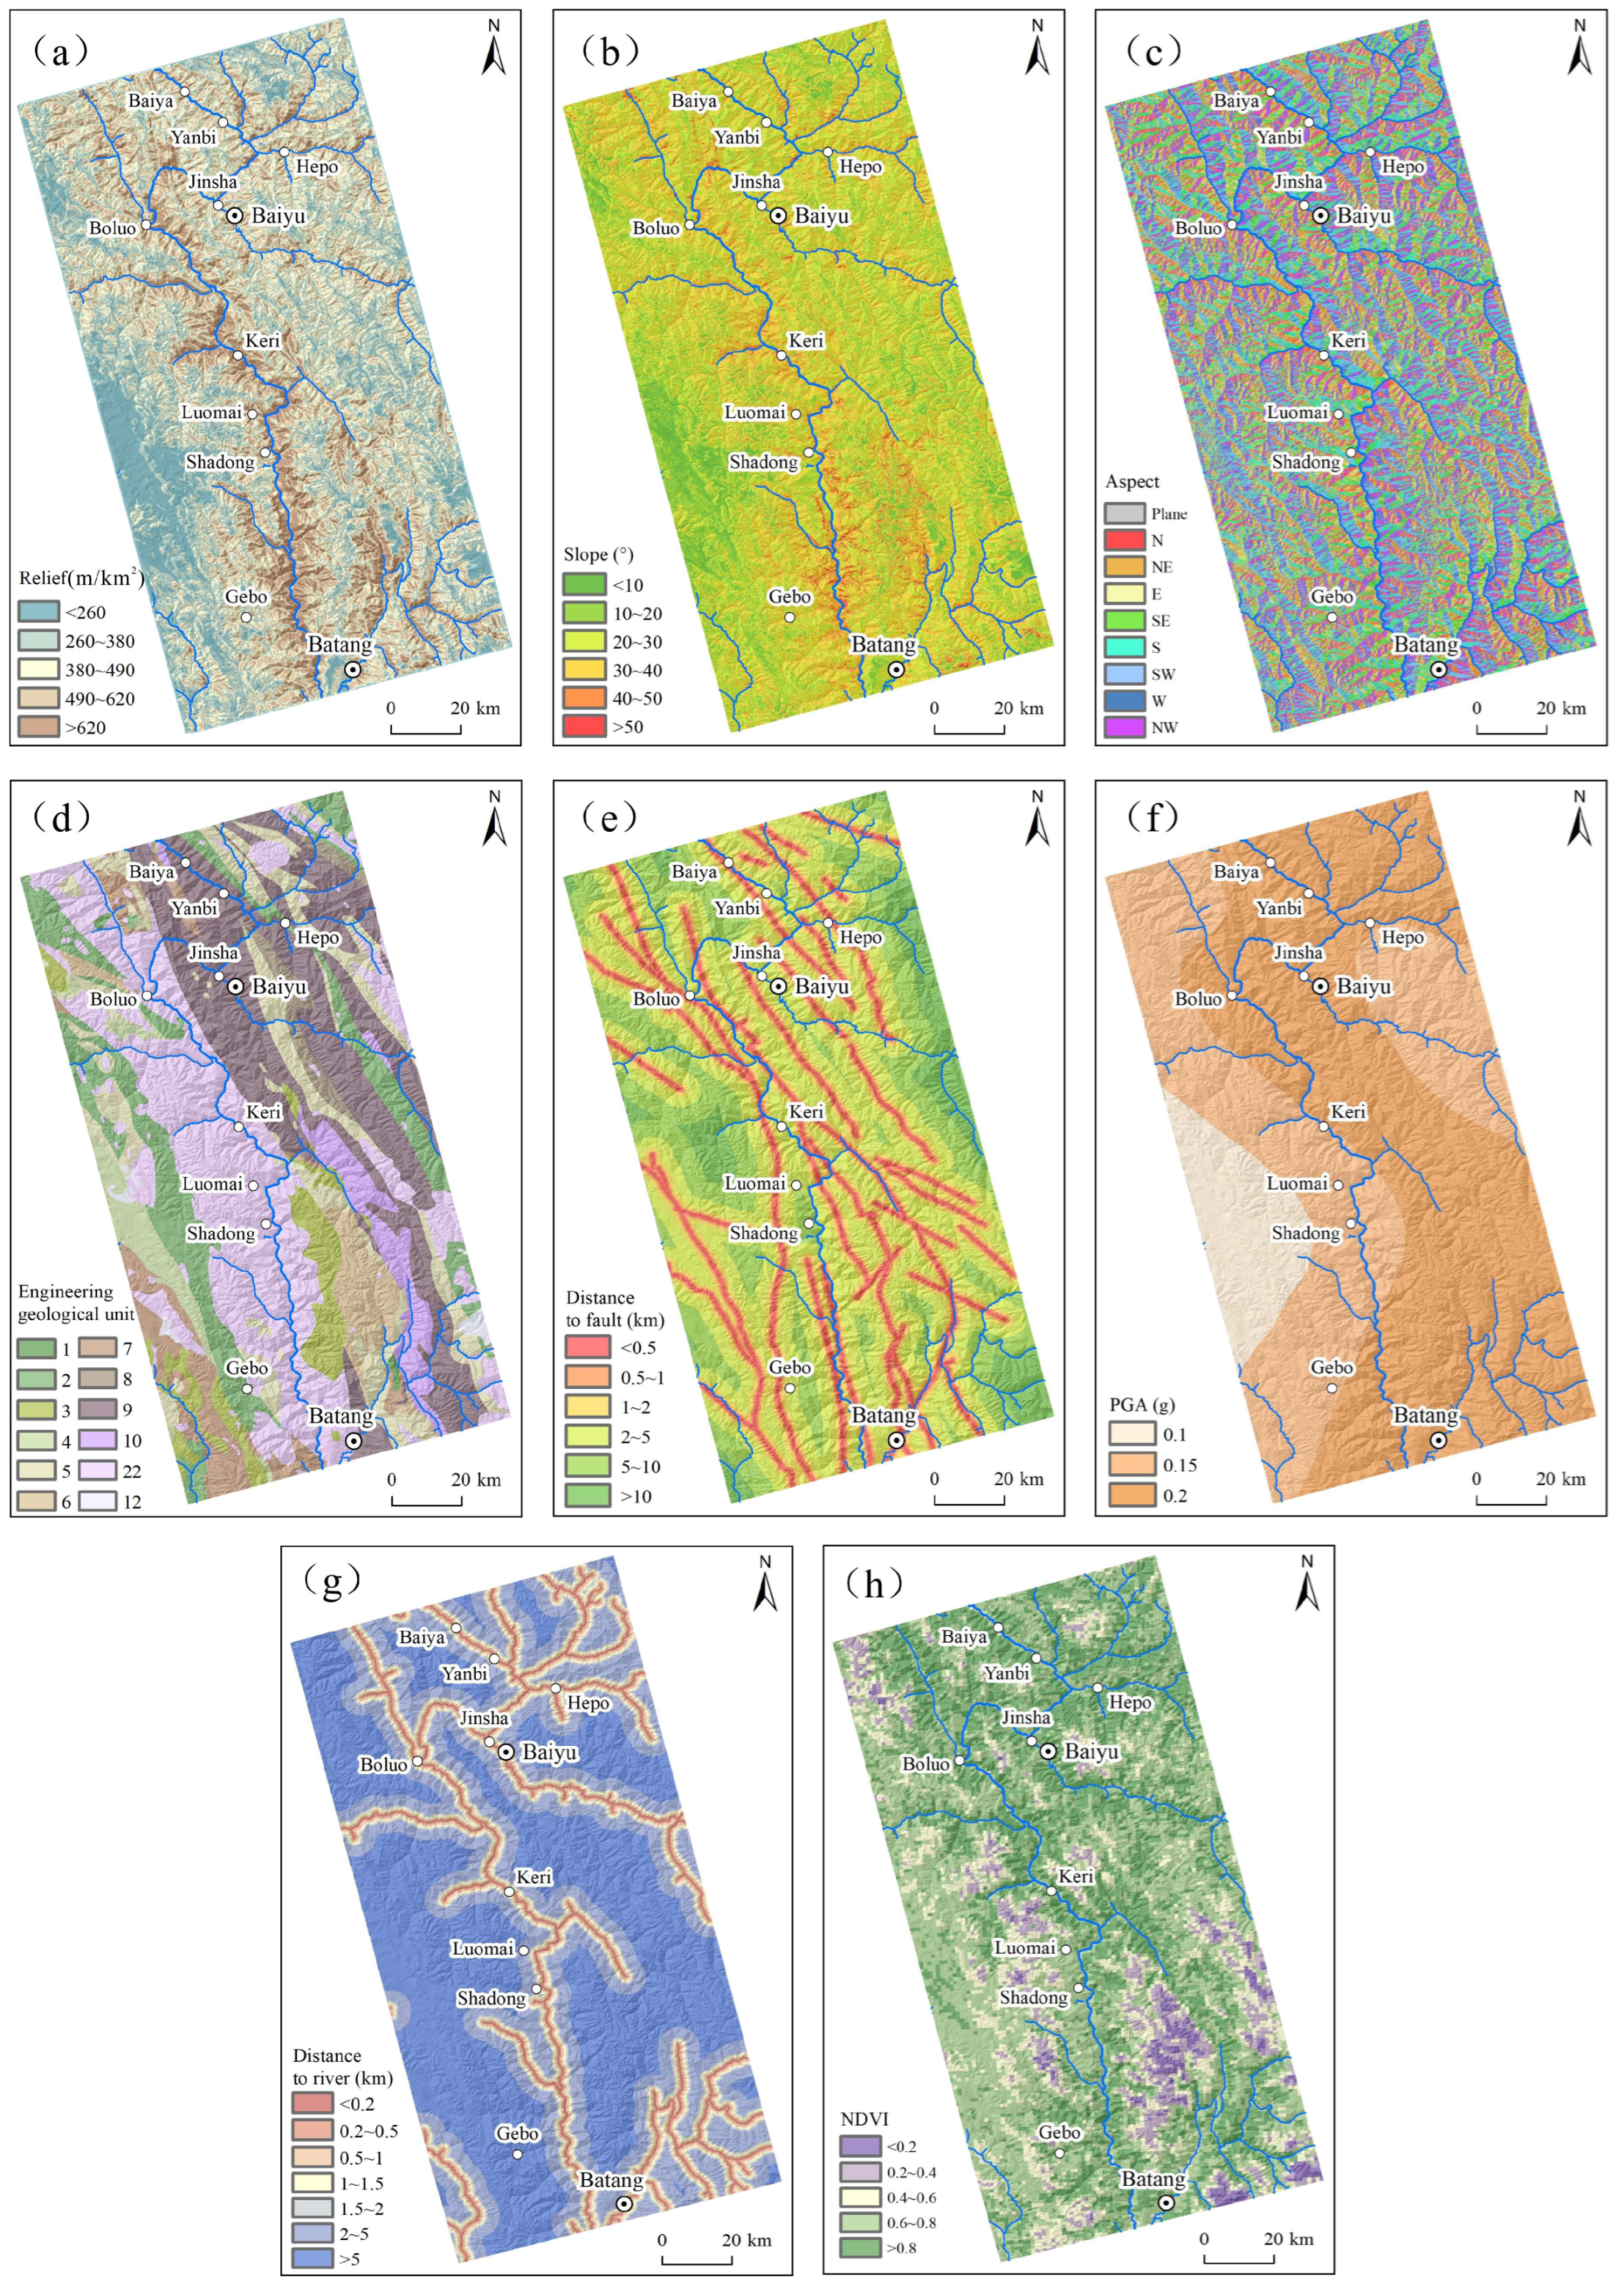
Based on an analysis of geological setting and landslide characteristics, topographic relief, slope gradient, and slope aspect are selected to represent the influence of topography and geomorphology on landslide susceptibility. Engineering geological units are used to reflect the effects of stratum lithology and rock mass structure. The distance to fault is incorporated to account for the influence of active tectonic structures. PGA is employed to represent the impact of historical seismic activity. The distance to the river is considered to capture the effects of river incision and fluvial geomorphology. Additionally, the NDVI is utilized to assess the role of vegetation coverage and vegetation growth conditions. In summary, eight key disaster-causing factors—topographic relief, slope gradient, slope aspect, engineering geological units, distance to faults, PGA, distance to rivers, and NDVI (
Figure 6)—are integrated to establish a factor index system.
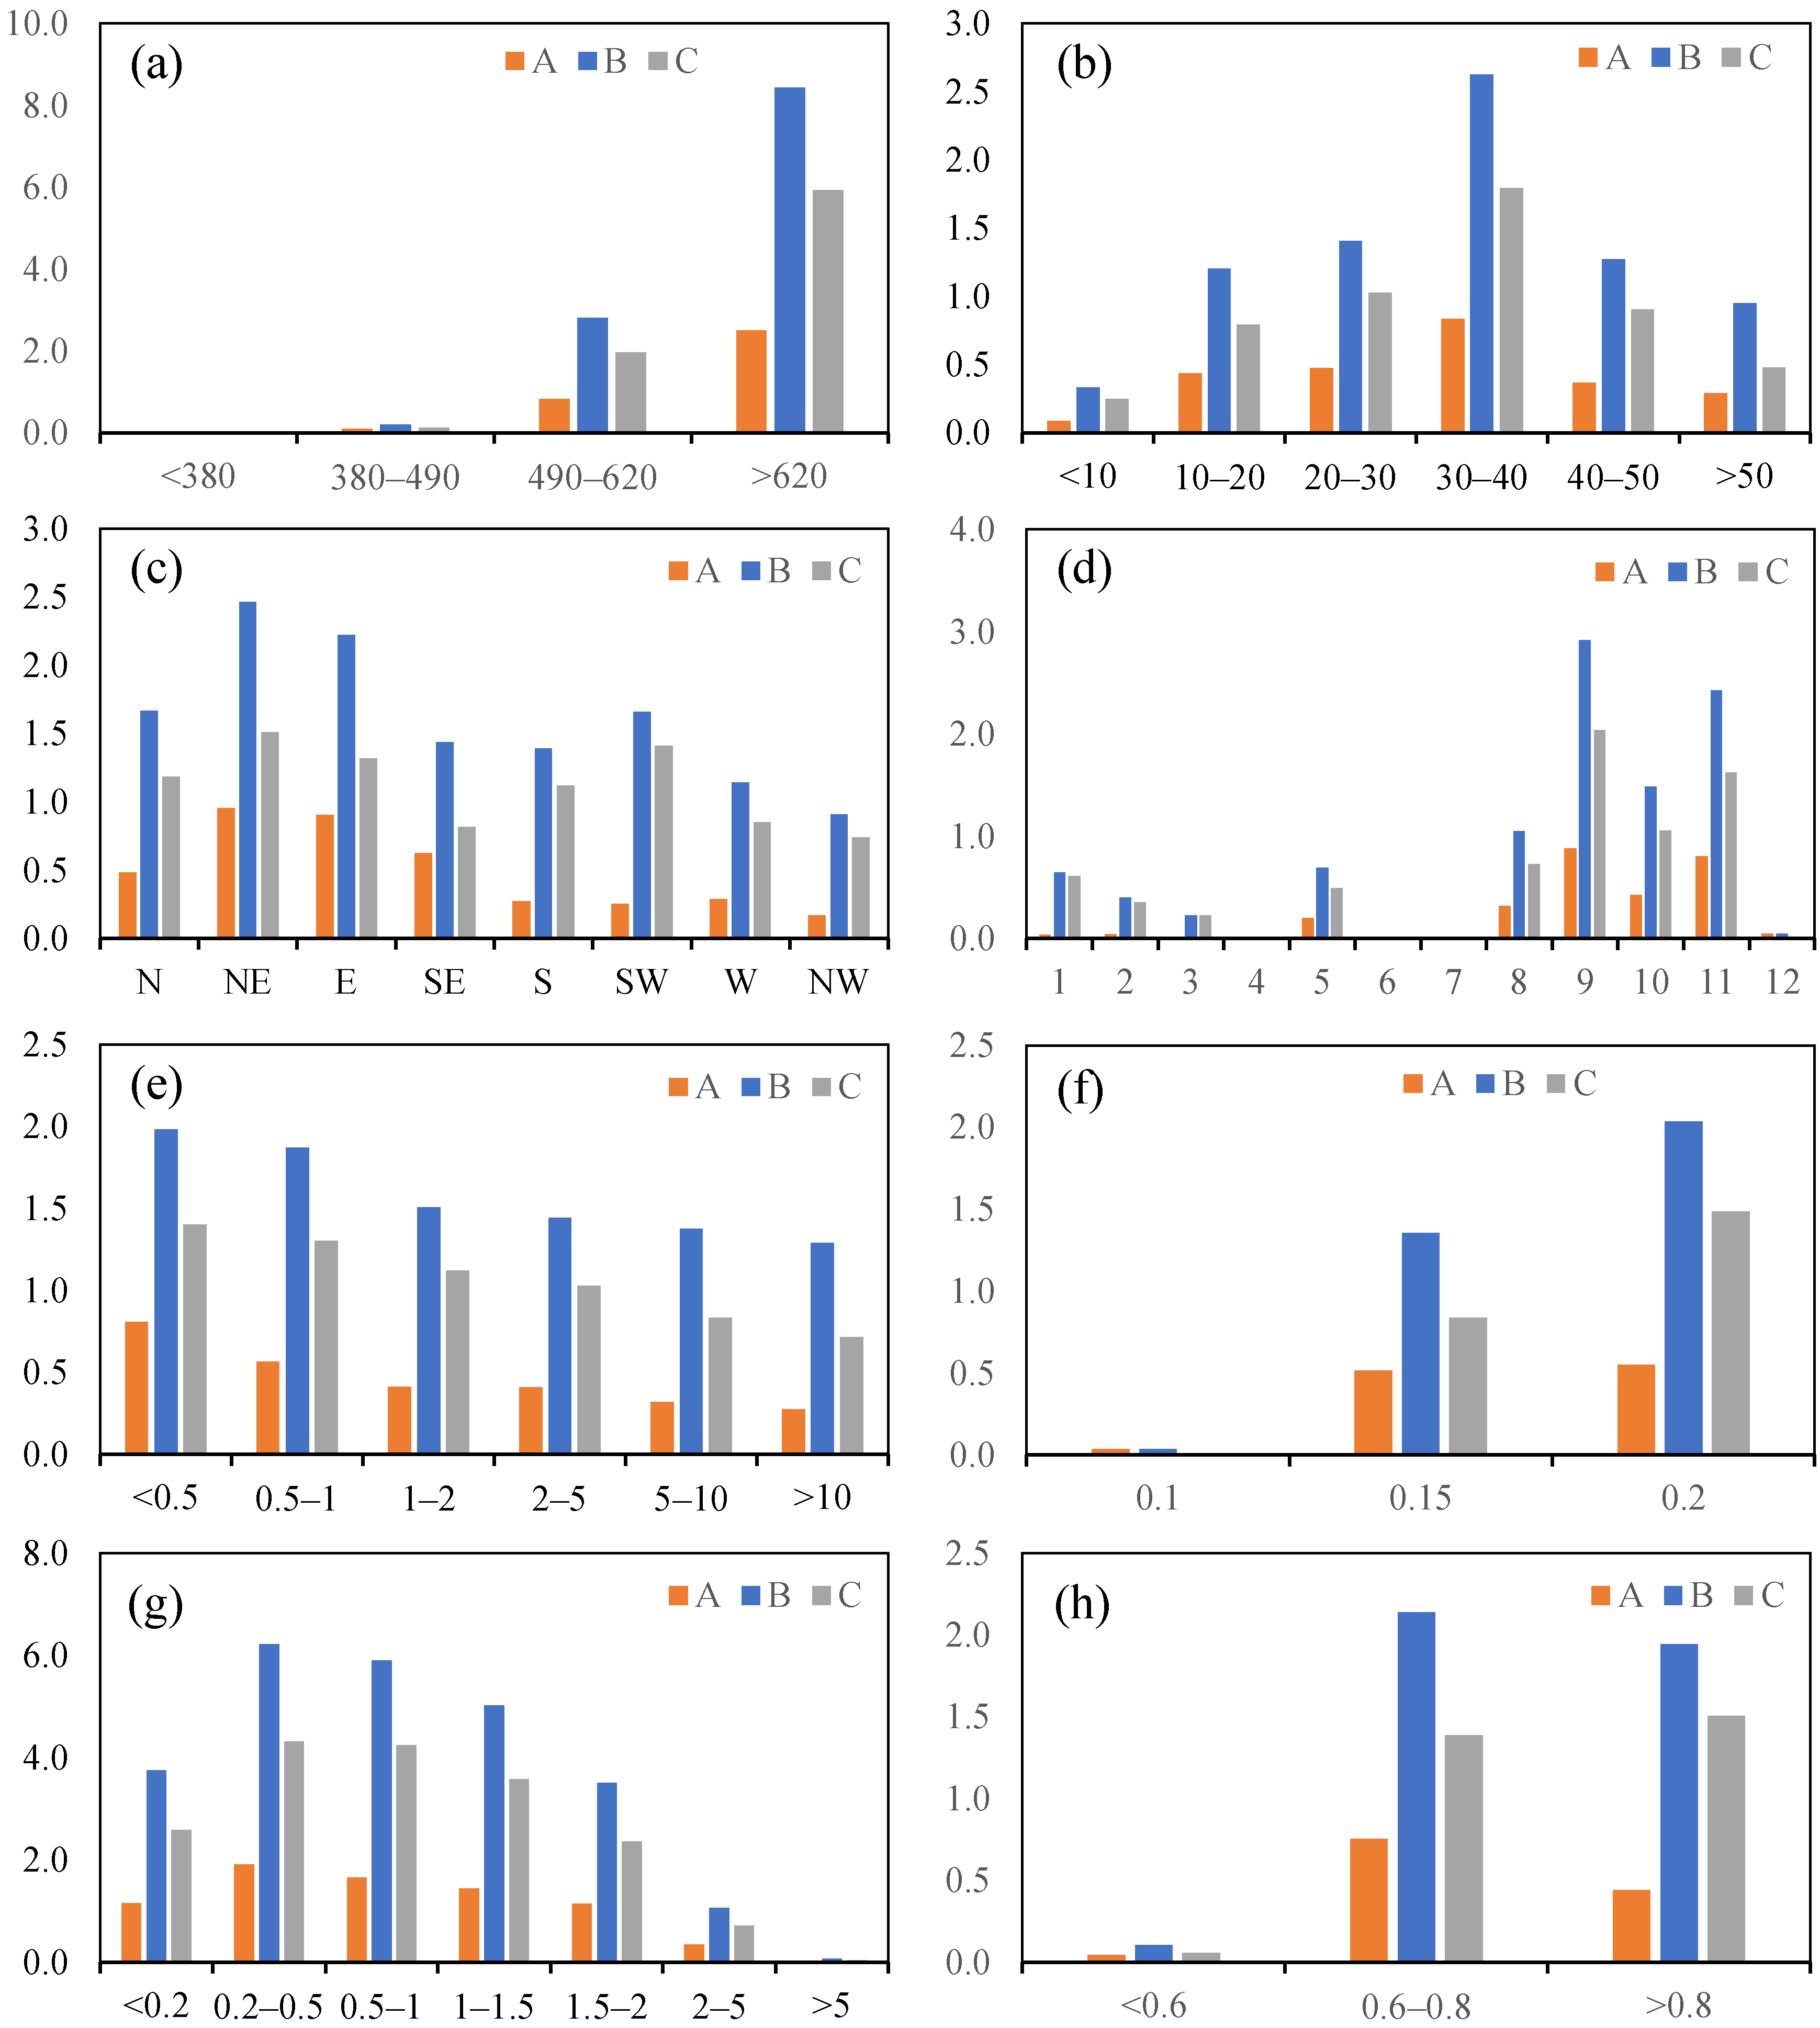
Figure 7 presents the statistical analysis results of the landslide distribution characteristics.
4.2.1. Topography
- (1)
Topographic relief
Topographic relief reflects the elevation difference within a unit area. In the upper Jinsha River, intense river incision has led to the development of prominent mountainous and canyon landforms, resulting in significant topographic relief. The topographic relief is divided into four categories (
Figure 6a): less than 380 m/km
2, 380–490 m/km
2, 490–620 m/km
2, and greater than 620 m/km
2. Within the zone where topographic relief exceeds 620 m/km
2, Datasets A, B, and C record 80, 171, and 101 landslides, respectively, showing the highest landslide density (
Figure 7a). This indicates that areas with topographic relief greater than 620 m/km
2 are most susceptible to landsliding.
- (2)
Slope gradient
Slope gradient is a key factor influencing the initiation and progression of landslides. As slope steepness increases, the downslope sliding force intensifies, shear stress at the slope toe rises, and overall slope stability diminishes. Consequently, steeper slopes are more susceptible to deformation and failure. The slope gradient is divided into six categories (
Figure 6b): less than 10°, 10–20°, 20–30°, 30–40°, 40–50°, and greater than 50°. Within the slope gradient range of 30–40°, Datasets A, B, and C record 79, 151, and 73 landslides, respectively, showing the highest landslide density (
Figure 7b). This suggests that the 30–40° slope gradient range is most conducive to landslide occurrence.
- (3)
Slope aspect
Variations in solar radiation received by different slope aspects influence surface temperature, water evaporation rates, and rock weathering processes, thereby affecting landslide development. Slope aspect is categorized into eight classes (
Figure 6c): North (N), Northeast (NE), East (E), Southeast (SE), South (S), Southwest (SW), West (W), and Northwest (NW). The highest landslide density across Datasets A, B, and C is observed in the NE-facing slopes (
Figure 7c)., indicating that NE-facing slopes represent the dominant aspect for landslide occurrence.
4.2.2. Stratum Lithology
Stratum lithology and rock mass structure represent key internal controlling factors that influence landslide occurrence. Based on lithological composition and engineering geological–mechanical properties, the stratum lithology is categorized into 12 engineering geological units (
Figure 6d,
Table 2). The highest landslide density is found in areas composed of low to moderately resistant phyllite and schist (
Figure 7d), indicating that this particular engineering geological unit is most susceptible to landsliding.
4.2.3. Active Fault
Rock and soil masses within active tectonic zones are typically fragmented, highly susceptible to weathering, and exhibit reduced mechanical strength, all of which facilitate landslide development. In the upper Jinsha River, the regional geological structure exhibits considerable complexity marked by extensively developed active fault systems such as the Jinshajiang Fault Zone and the Batang Fault Zone. The distance to these faults has been divided into six categories (
Figure 6e): less than 0.5 km, 0.5–1 km, 1–2 km, 2–5 km, 5–10 km, and greater than 10 km. In areas located within 0.5 km of active faults, Datasets A, B, and C record 64, 99, and 34 landslides, respectively, showing the highest landslide density (
Figure 7e). This indicates that areas within 0.5 km of active faults are most prone to landslide occurrence.
4.2.4. PGA
PGA can directly quantify the inertial forces generated by earthquakes, which are capable of inducing surface damage and triggering landslides. PGA is categorized into three levels (
Figure 6f): 0.1 g, 0.15 g, and 0.2 g. Within the zones with PGA of 0.2 g, Datasets A, B, and C record 127, 249, and 121 landslides, respectively, resulting in the highest landslide density among all zones (
Figure 7f). This indicates that areas subjected to PGA of 0.2 g are most susceptible to landslide occurrence, demonstrating that PGA significantly affects the development and distribution characteristics of landslides.
4.2.5. Drainage
River incision contributes to the formation of mountainous and canyon topography. River erosion at the slope toes compromises slope stability, thereby promoting slope instability. The distance to drainage is classified into seven categories (
Figure 6g): less than 0.2 km, 0.2–0.5 km, 0.5–1 km, 1–1.5 km, 1.5–2 km, 2–5 km, and greater than 5 km. Within the 0.2–0.5 km from drainage buffer zones, Datasets A, B, and C document 39, 63, and 24 landslides, respectively, representing the highest landslide density observed across all distance intervals (
Figure 7g). This indicates that areas located within 0.2–0.5 km from drainage are most susceptible to landslide occurrence.
4.2.6. NDVI
Vegetation exerts a dual influence on landslide development. On one hand, it contributes to soil and water conservation and enhances slope stability through root reinforcement. On the other hand, vegetation can also promote landslide occurrence. For example, dense vegetation may reduce the exposed surface area of a slope, thereby inhibiting natural drainage and increasing pore water pressure, which ultimately compromises slope stability. The NDVI is classified into three categories (
Figure 6h): < 0.6, 0.6–0.8, and > 0.8. Within the zones with NDVI 0.6–0.8, Datasets A and B record 117 and 210 landslides, respectively, exhibiting the highest landslide density (
Figure 7h). This suggests that areas with NDVI 0.6–0.8 are most susceptible to landslide occurrence for Datasets A and B. Within the zones where NDVI is greater than 0.8, Dataset C records 81 landslides, exhibiting the highest landslide density (
Figure 7h). This suggests that areas where NDVI is greater than 0.8 are most susceptible to landslide occurrence for Dataset C.
4.3. Factor Information Value and Weight
4.3.1. Factor Information Value
Seventy percent of Datasets A, B and C are respectively selected as the corresponding landslide sample datasets. Then, the information values of disaster-causing factors are calculated using Formula (1), integrating the regional area of each factor interval and the corresponding landslide area (
Table 3). The results reveal a direct relationship between landslide density and information value, with higher value reflecting greater landslide susceptibility. Although the absolute information values vary across the three landslide datasets, the factor interval exhibiting the highest information values are basically consistent, except for NDVI. Based on the factor information values, it can be determined that the most favorable factor range for landslide occurrence is topographic relief greater than 620 m/km
2, slope gradient of 30–40°, slope aspect of NE, engineering geological unit with low to moderately resistant phyllite and schist, distance to fault less than 0.5 km, PGA of 0.2 g, distance to drainage of 0.2–0.5 km, NDVI of 0.6–0.8 for Datasets A and B, and NDVI greater than 0.8 for Dataset C.
4.3.2. Factor Weight
According to the basic principles of the AHP method, a judgment matrix is established for the eight disaster-causing factors (
Table 4). Drawing upon the regional geological background, landslide development characteristics, and expert knowledge, the relative importance values among the disaster-causing factors are determined. The calculated maximum eigenvalue (λ
max) of the judgment matrix is 8.193, with a consistency ratio (CR) of 0.0195, which is less than the threshold value of 0.1. This suggests that the judgment matrix satisfies the consistency requirement, indicating that the AHP model is valid and logically structured. The resulting weights for each factor are as follows: topographic relief (W
e = 0.083), slope gradient (W
sl = 0.265), slope aspect (W
a = 0.060), engineering geological unit (W
gr = 0.134), distance to fault (W
fd = 0.168), PGA (W
pga = 0.062), distance to drainage (W
rd = 0.121), and NDVI (W
trd = 0.107). Among these, slope gradient has the highest weight, followed by distance to fault and engineering geological unit, indicating their dominant influence on landslide susceptibility.
4.4. Landslide Susceptibility Result and Validation
Based on the previously determined factor weight values and information values, a weighted overlay calculation is performed on each factor layer using Formula (3) to derive the weighted information values of the disaster-causing factors, integrating data from three landslide datasets. The detailed calculation process is as follows:
Among these variables, Ie represents the information value associated with topographical relief, Isl represents the information value associated with slope gradient, Ia represents the information value associated with slope aspect, Ig represents the information value associated with engineering geological unit, Ifd represents the information value associated with distance to fault, Ipga represents the information value associated with PGA, Ird represents the information value associated with distance to drainage, and Itrd represents the information value associated with NDVI.
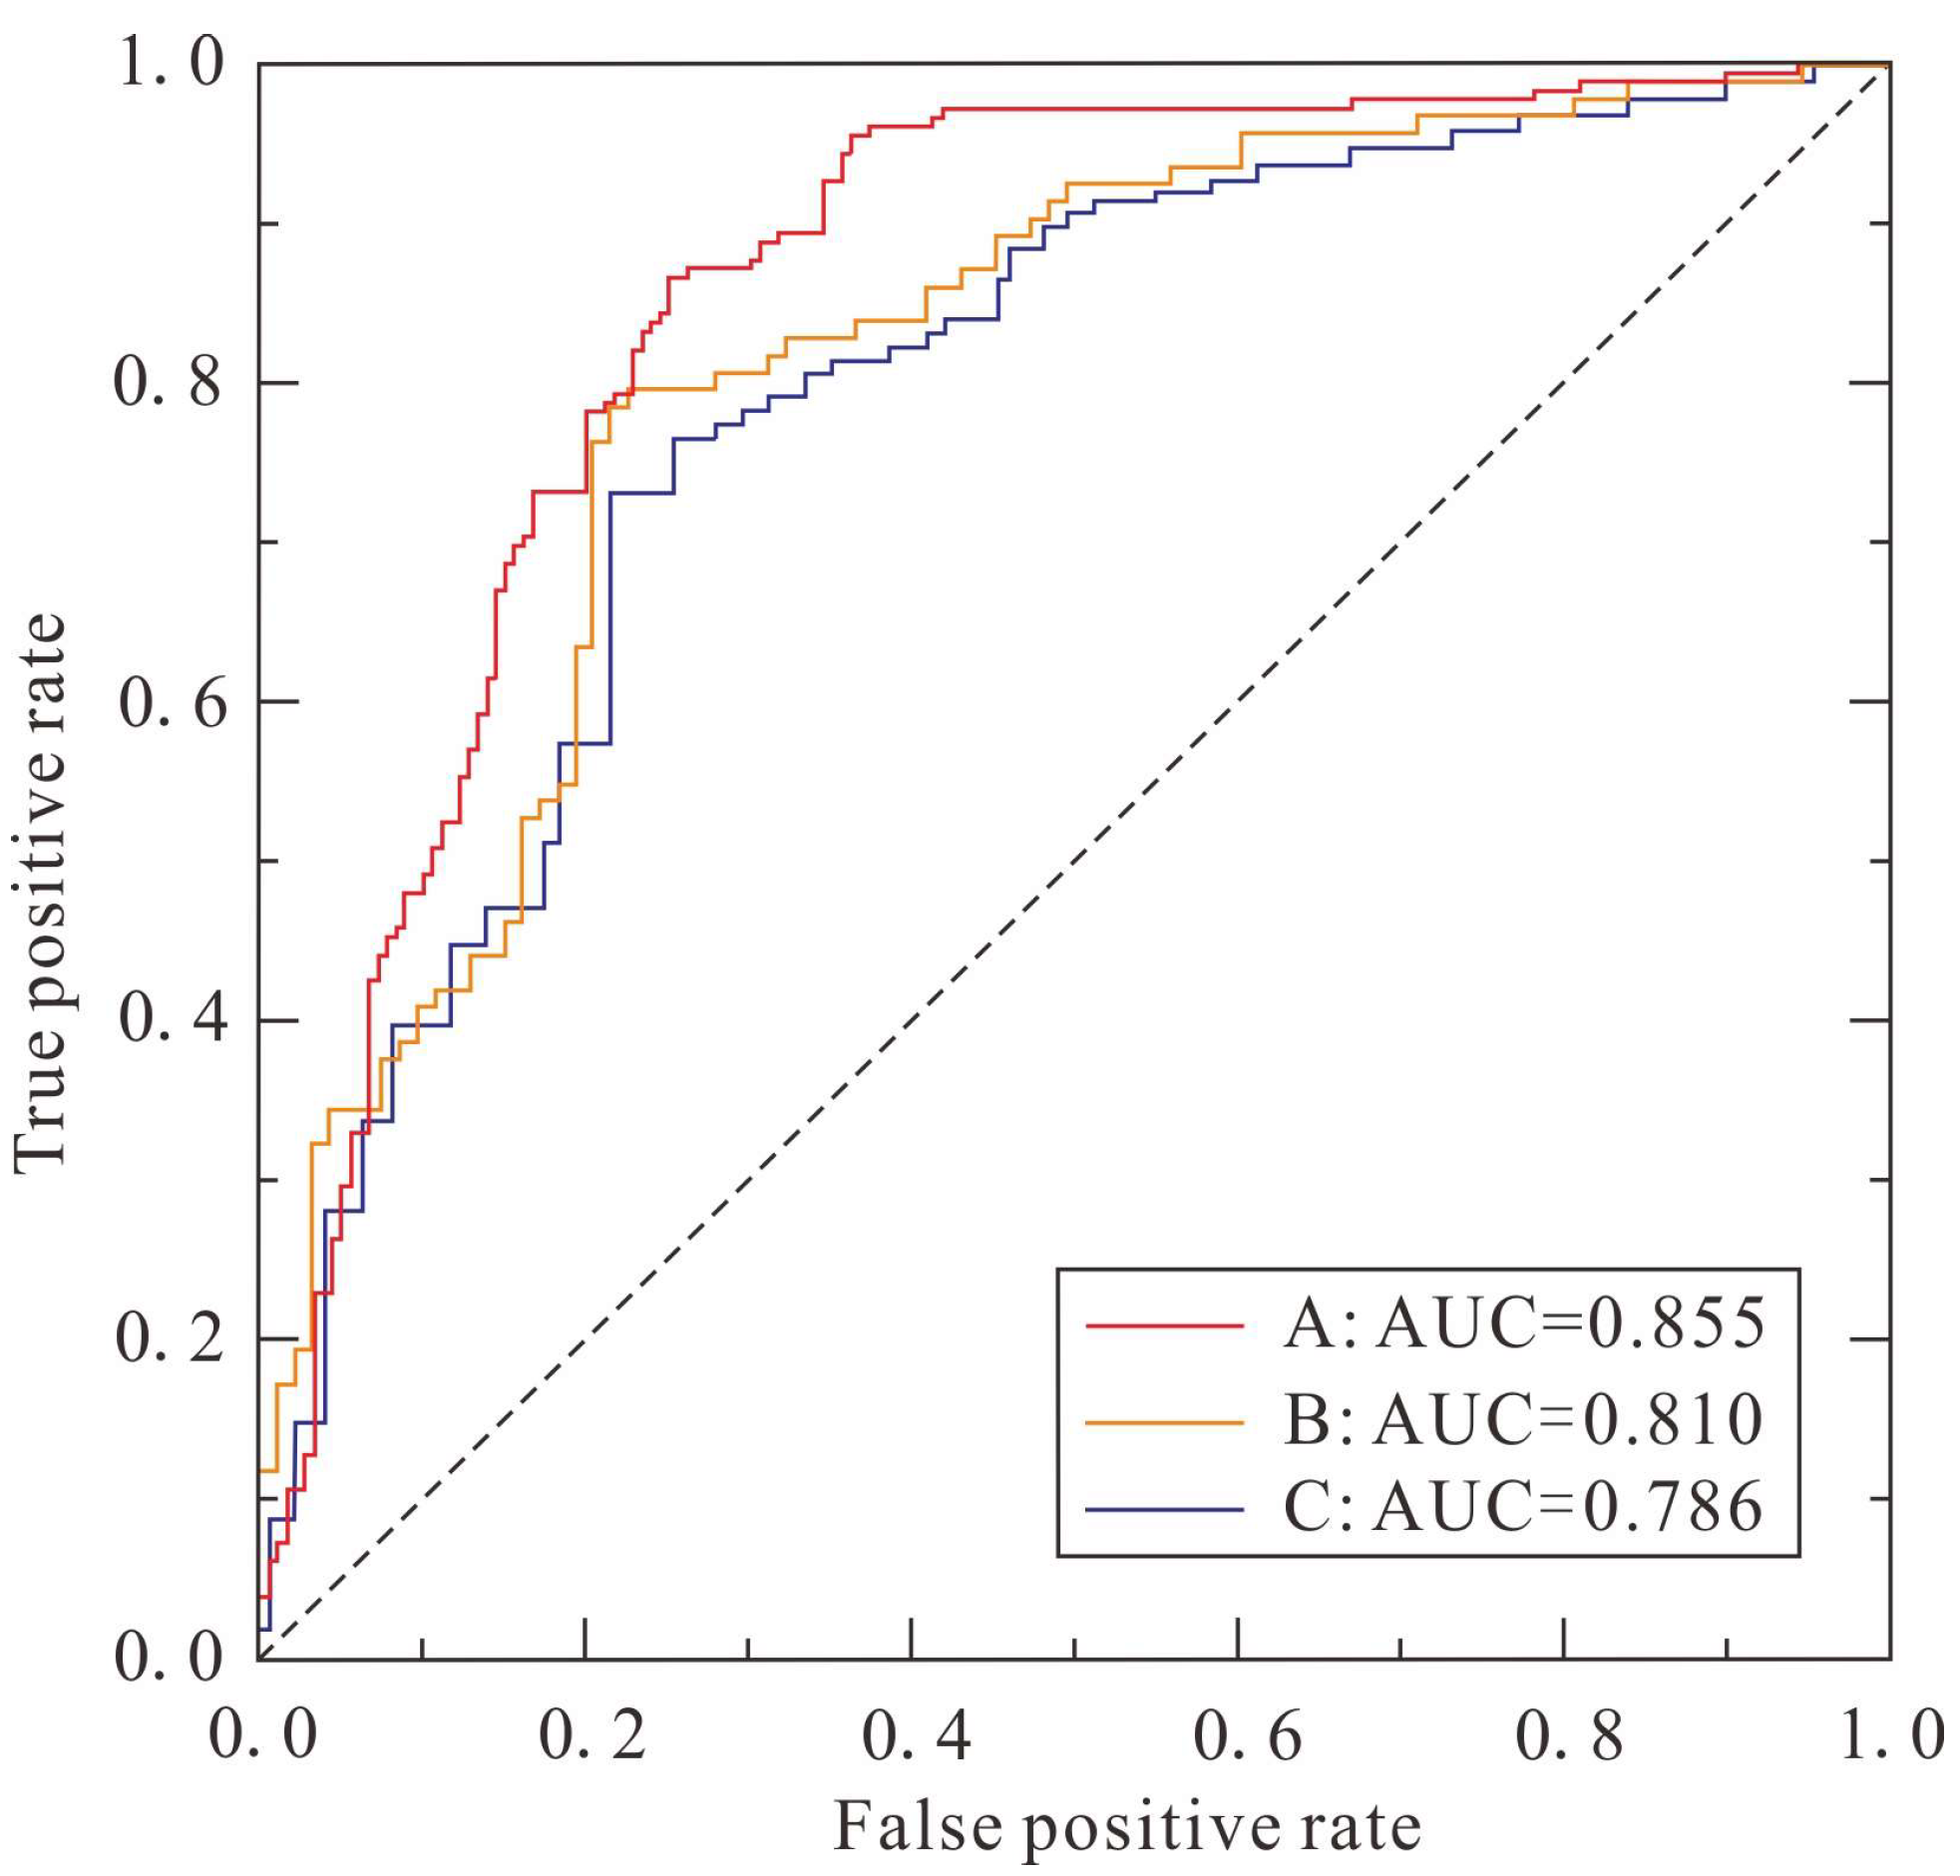
ROC curve analysis is utilized to assess the accuracy of the three landslide susceptibility results. Thirty percent of Datasets A, B and C are respectively selected, while the same quantity of non-landslide points is randomly sampled from stable areas to construct the landslide validation dataset. The ROC curves are then plotted (
Figure 8). The area under the curve (AUC) values for landslide Datasets A, B, and C are 0.855, 0.810, and 0.786, respectively, indicating that the landslide susceptibility result based on active landslide samples achieves higher predictive accuracy.
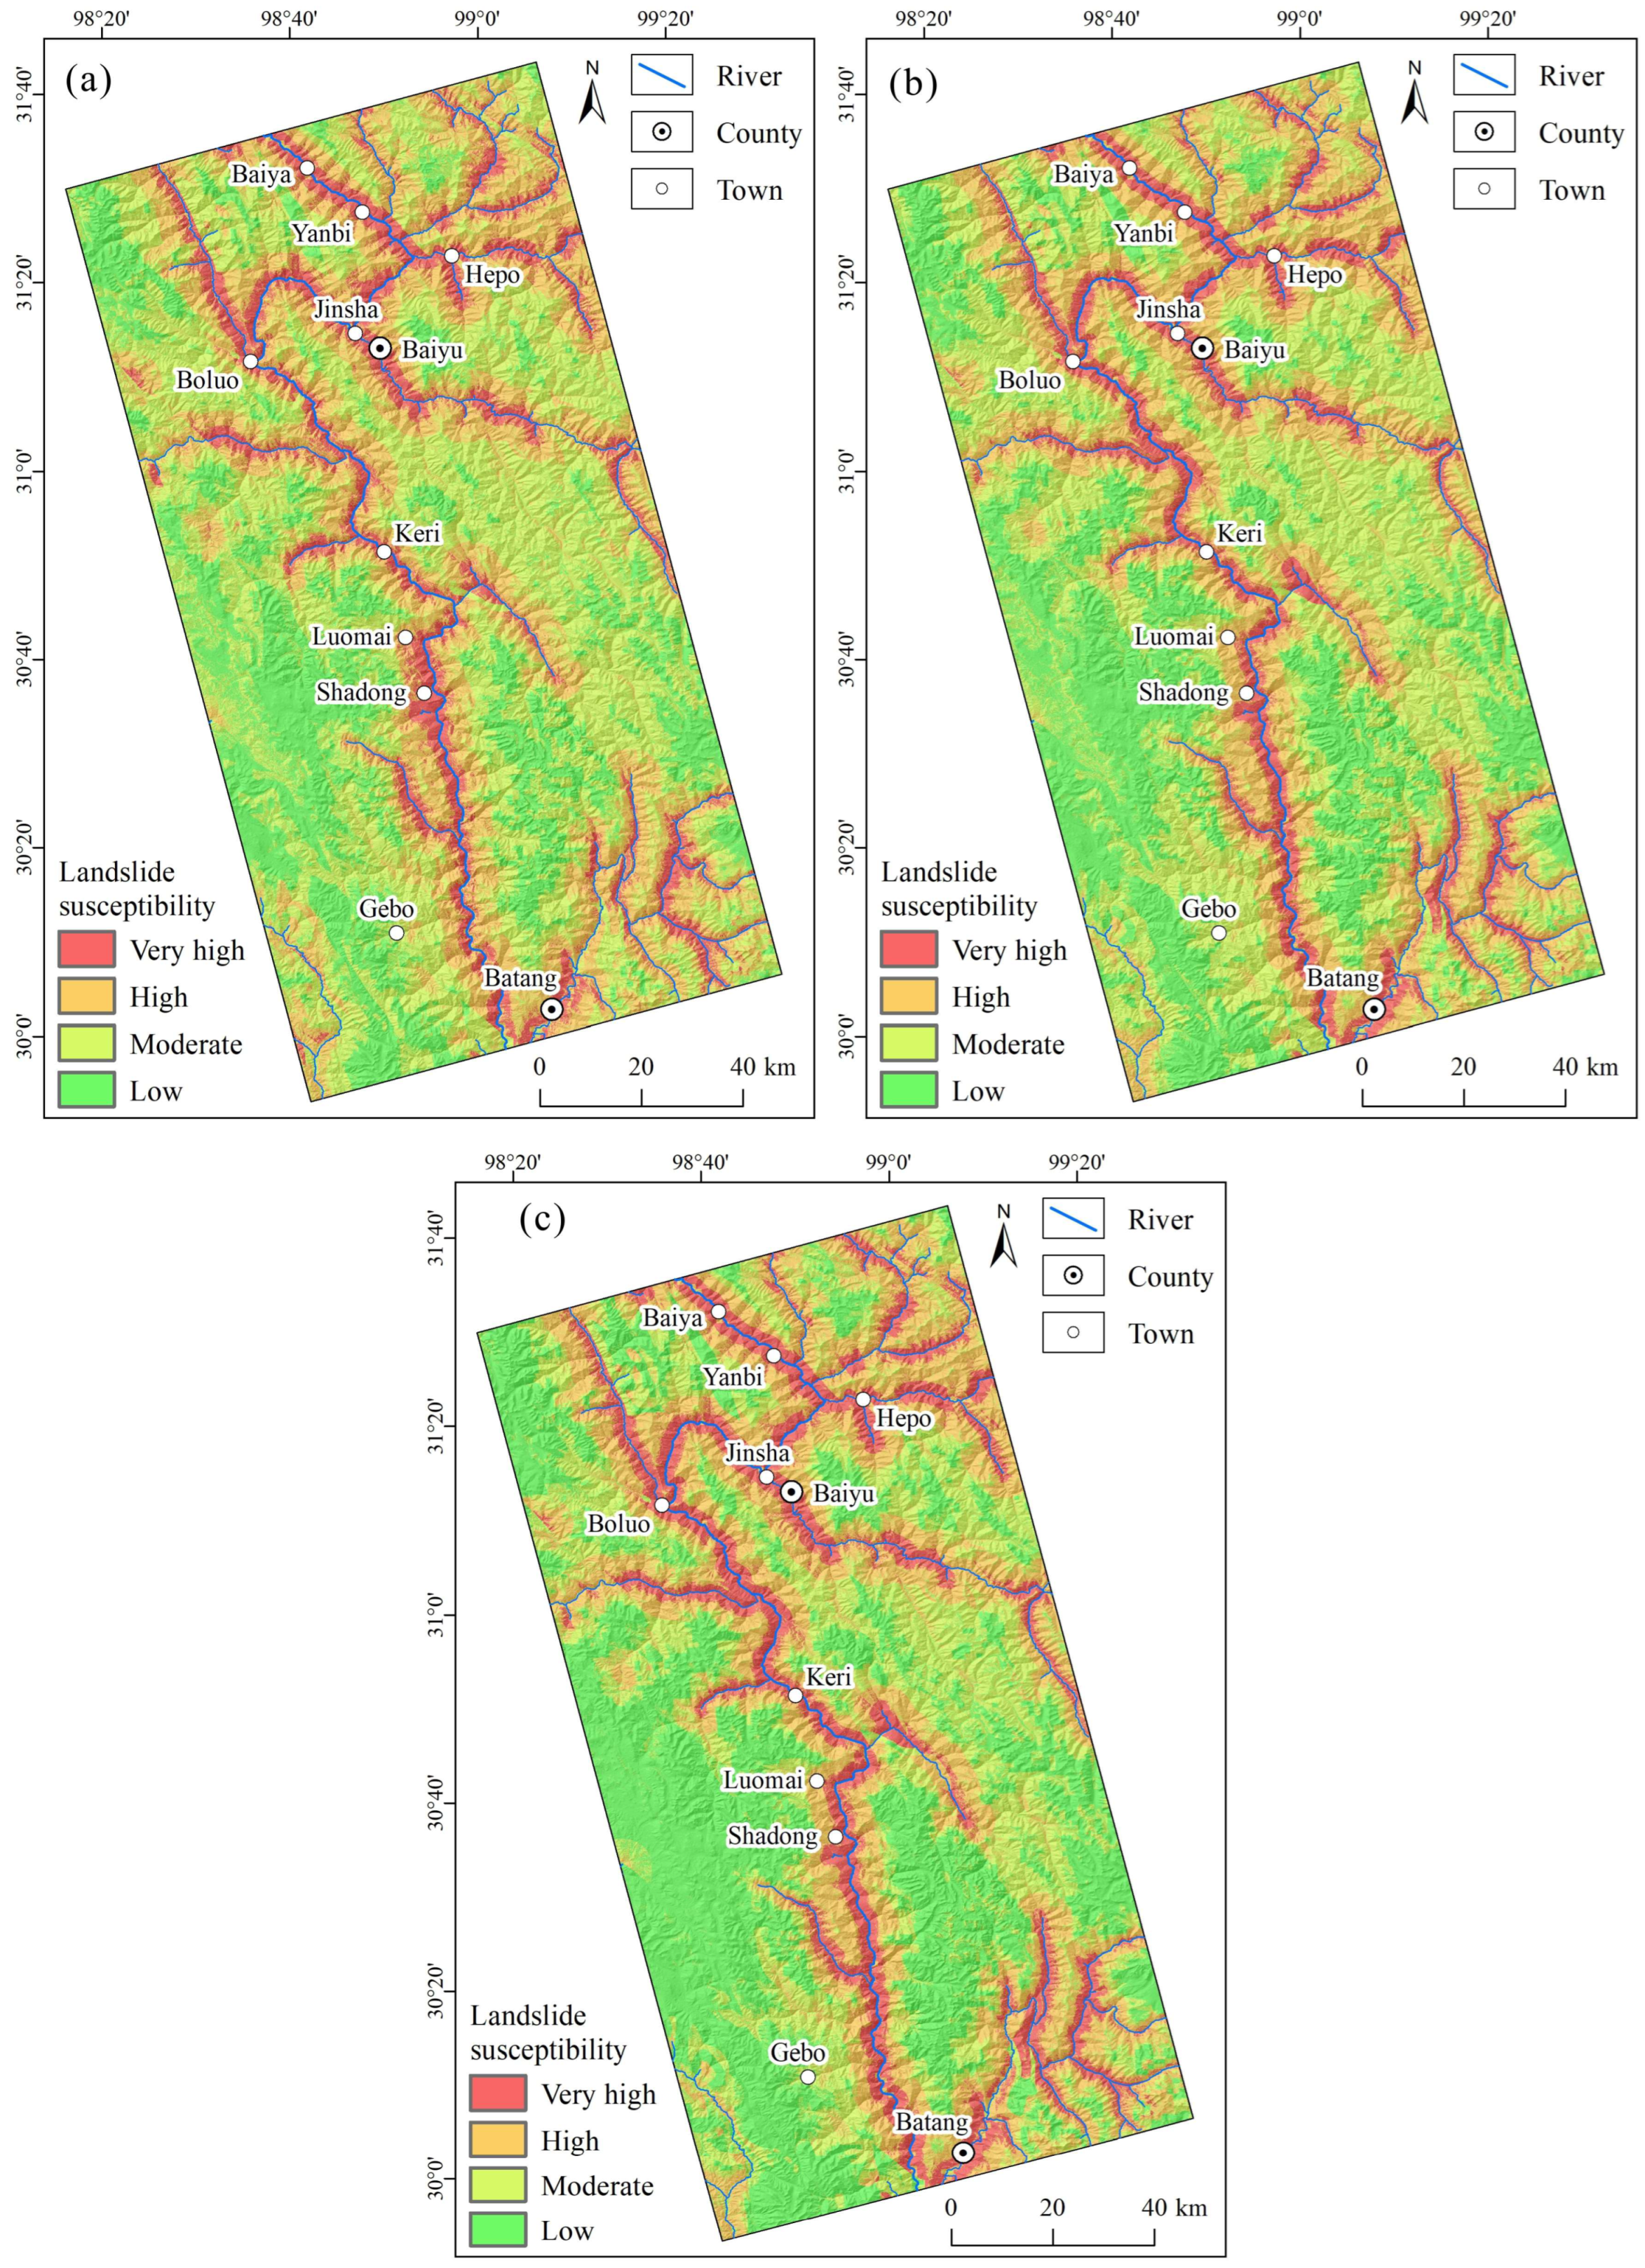
A higher weighted information value of the disaster-causing factors indicates a greater likelihood of landslide occurrence. Using these weighted information values, the natural break method is employed to classify regional landslide susceptibility into four levels: very high, high, moderate, and low susceptibility (
Figure 9).
Overall, the spatial distribution characteristics of the three landslide susceptibility outcomes are highly similar. Regions exhibiting very high and high landslide susceptibility are mainly situated along riverbanks such as the Jinsha River, Baqu River, and Ouqu River, exhibiting a distinct linear distribution along river systems. These regions feature steep topography and intense fluvial erosion, which provide favorable topographic and dynamic conditions for landslide occurrence. Regions exhibiting moderate landslide susceptibility are mainly found in the zones between longitudinal valleys and ridges, where the terrain is relatively gentle and elevation differences are small. Areas with low landslide susceptibility are primarily distributed across flat plateau surfaces and broad river valleys with mild topography.
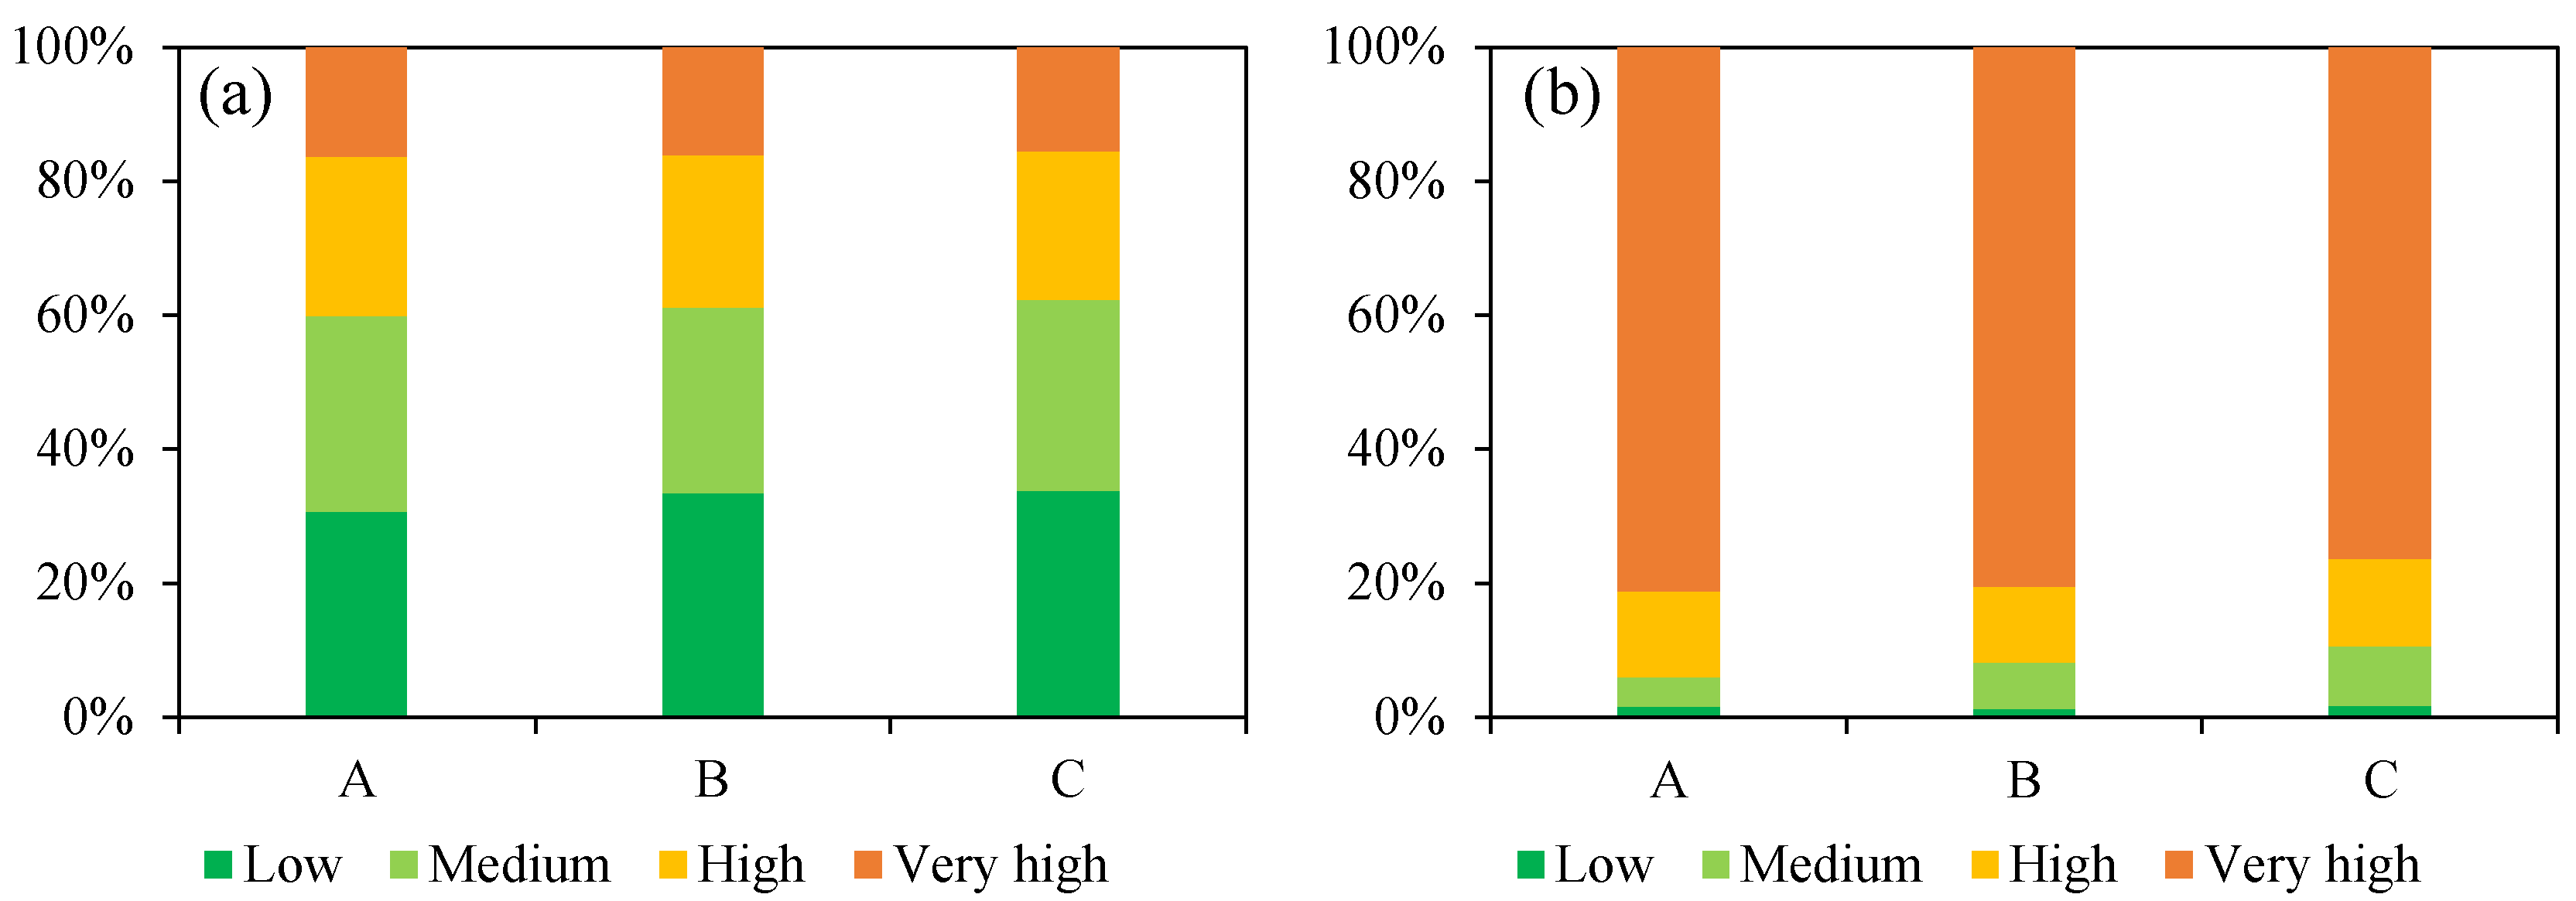
Statistical analysis of landslide susceptibility and distribution patterns (
Table 5,
Figure 10) reveals that the regions categorized as very high and high landslide susceptibility zones according to Datasets A, B, and C cover 6128 km
2, 5938 km
2, and 5773 km
2, respectively, accounting for 40.08%, 38.84%, and 37.76% of the entire study area. The counts of landslides occurring within these zones for Datasets A, B, and C are 178, 335, and 157, respectively, representing 93.98%, 91.80%, and 89.43% of the total landslide number. These statistical results demonstrate that, based on active landslide dataset samples, more accurate landslide susceptibility results are obtained, with significantly higher recognition rates for areas with very high and high susceptibility.
5. Discussions
Currently, landslide susceptibility assessment primarily focuses on optimizing factor selection and improving predictive models. Although slope deformation has been used as an assessment factor in some studies, it represents a significant developmental stage of landslides rather than a natural geographical or geological environmental factor that inherently influences landslide formation.
With changes of topographic, meteorological, hydrological, and geological conditions, the environmental background of landslide development also evolves over time. Inactive landslides, particularly ancient and old landslides, are products of past geological conditions, and therefore their development characteristics reflect past environmental background of landslide development. In contrast, active landslides (including reactivated ancient landslides and old landslides) are shaped by the current geological conditions, making their development characteristics more indicative of the current environmental background of landslide development. The differing development characteristics of active and inactive landslides highlights the variability in the environmental background of landslide development across different geological periods. The contemporary geological conditions associated with active landslides exhibit higher landslide sensitivity.
For active and inactive landslides, the contribution weights of various factors to landslide susceptibility differ significantly. Therefore, it is essential to calculate the factor information values separately based on the landslide activity characteristics. Although all three landslide susceptibility assessments employ the well-established and widely applied weighted information value model, the landslide dataset explicitly distinguishes between active and inactive landslides. This distinction enables a comparative analysis of how landslide activity influences the outcomes of landslide susceptibility assessments. The incorporation of the active landslide dataset has significantly enhanced the accuracy of landslide susceptibility assessment. The research results provide valuable insights for improving the accuracy of landslide susceptibility assessment within the context of the current geological environment.
Through field surveys, advanced InSAR technology was utilized to identify active landslides and construct an active landslide dataset, thereby establishing a robust data foundation for this study. InSAR technology enables the detection of large-scale surface deformation, offering critical indicators for identifying active landslides over extensive areas. However, due to the inherent limitations of InSAR technology, such as geometric distortions and signal loss in steep terrain, there is a risk of misclassification and missed detection of active landslides in mountainous and canyon regions. Therefore, field surveys are essential to verify and validate the identification results of active landslides, ensuring the accuracy and reliability of the dataset. The Sentinel SAR data used in this study commenced in January 2016, which means that landslides active prior to this date but inactive thereafter could not be detected.
6. Conclusions
Centering on the theme of enhancing the accuracy of landslide susceptibility assessment, taking the Baiyu–Batang section of the upper Jinsha River in the Qinghai–Tibet Plateau as a case, this study investigates and analyzes the influence of landslide activity characteristics on landslide susceptibility assessment and reaches the following main conclusions.
(1) Active landslides serve as indicators of the current environmental background of landslide development and are an important factor to be considered in the landslide susceptibility assessment at present. Based on this, a comprehensive methodology framework for landslide susceptibility assessment based on landslide activity is proposed. The main idea is to divide active and inactive landslide samples.
(2) InSAR technology enables the detection of large-scale surface deformation, offering critical indicators for identifying active landslides over extensive areas. Field surveys are essential to verify and validate the identification results of active landslides.
(3) There are a total of 366 landslides in the Baiyu–Batang section of the upper Jinsha River, including 190 active landslides and 176 inactive landslides. Regions exhibiting very high and high landslide susceptibility are mainly situated along the banks of the Jinsha River, Baqu River, Ouqu River, and other tributaries, exhibiting a distinct linear distribution pattern aligned with the river systems.
(4) The incorporation of the active landslide dataset has significantly enhanced the accuracy of landslide susceptibility assessment, with higher recognition rates for very high and high landslide susceptibility zones. Identifying and incorporating landslide activity characteristics can significantly enhance the accuracy of landslide susceptibility assessment. For the current landslide susceptibility assessment, it is essential to account for and remove the influence of inactive or old landslides. The research results can provide target locations for regional-scale landslide risk prevention and control management.
Author Contributions
Conceptualization and methodology, Z.Y., R.W. and C.G.; software, validation, formal analysis, W.S. and H.Y.; investigation, re-sources, data curation, W.S. and X.W.; writing—original draft preparation, Z.Y. and W.S.; writing—review and editing, R.W. and C.G.; funding acquisition, Z.Y., R.W. and C.G. All authors have read and agreed to the published version of the manuscript.
Funding
This study was supported by the National Natural Science Foundation of China (No. 42277180, 42207233) and the China Geological Survey Project (DD20221816).
Data Availability Statement
Data are contained within the article. Further inquiries can be directed to the corresponding author.
Acknowledgments
The authors would like to thank the Editor and anonymous reviewers for their comments and suggestions, which helped to improve this paper.
Conflicts of Interest
Author X.W. has been involved as a consultant and expert witness in Tuzhizhi (Beijing) Technology Co., Ltd. The authors declare no other conflict of interest.
References
- Bhandari, B.P.; Dhakal, S.; Tsou, C.Y. Assessing the Prediction Accuracy of Frequency Ratio, Weight of Evidence, Shannon Entropy, and Information Value Methods for Landslide Susceptibility in the Siwalik Hills of Nepal. Sustainability 2024, 16, 2092. [Google Scholar] [CrossRef]
- Sharma, L.P.; Patel, N.; Ghose, M.K.; Debnath, P. Development and application of Shannon’s entropy integrated information value model for landslide susceptibility assessment and zonation in Sikkim Himalayas in India. Nat. Hazards 2015, 75, 1555–1576. [Google Scholar] [CrossRef]
- Regmi, A.D.; Devkota, K.C.; Yoshida, K.; Pradhan, B.; Pourghasemi, H.R.; Kumamoto, T.; Akgun, A. Application of frequency ratio, statistical index, and weights-of-evidence models and their comparison in landslide susceptibility mapping in Central Nepal Himalaya. Arab. J. Geosci. 2014, 7, 725–742. [Google Scholar] [CrossRef]
- Yang, Z.H.; Lan, H.X.; Gao, X.; Li, L.P.; Meng, Y.S.; Wu, Y.M. Urgent landslide susceptibility assessment in the 2013 Lushan earthquake-impacted area, Sichuan Province, China. Nat. Hazards 2015, 75, 2467–2487. [Google Scholar] [CrossRef]
- Ozdemir, A.; Altural, T. A comparative study of frequency ratio, weights of evidence and logistic regression methods for landslide susceptibility mapping: Sultan Mountains, SW Turkey. J. Asian Earth Sci. 2013, 64, 180–197. [Google Scholar] [CrossRef]
- Cemiloglu, A.; Zhu, L.C.; Mohammednour, A.B.; Azarafza, M.; Nanehkaran, Y.A. Landslide susceptibility assessment for Maragheh County, Iran, using the logistic regression algorithm. Land 2023, 12, 1397. [Google Scholar] [CrossRef]
- Kumar, D.; Thakur, M.; Dubey, C.S.; Shukla, D.P. Landslide susceptibility mapping & prediction using support vector machine for Mandakini River Basin, Garhwal Himalaya, India. Geomorphology 2017, 295, 115–125. [Google Scholar] [CrossRef]
- Yilmaz, I. Comparison of landslide susceptibility mapping methodologies for Koyulhisar, Turkey: Conditional probability, logistic regression, artificial neural networks, and support vector machine. Environ. Earth Sci. 2010, 61, 821–836. [Google Scholar] [CrossRef]
- Vaka, D.S.; Yaragunda, V.R.; Perdikou, S.; Papanicolaou, A. InSAR integrated machine learning approach for landslide susceptibility mapping in California. Remote Sens. 2024, 16, 3574. [Google Scholar] [CrossRef]
- Yesilnacara, E.; Topal, T. Landslide susceptibility mapping: A comparison of logistic regression and neural networks methods in a medium scale study, Hendek region (Turkey). Eng. Geol. 2005, 79, 251–266. [Google Scholar] [CrossRef]
- Ai, X.; Sun, B.T.; Chen, X.Z. Construction of small sample seismic landslide susceptibility evaluation model based on transfer learning: A case study of Jiuzhaigou earthquake. Bull. Eng. Geol. Environ. 2022, 81, 116. [Google Scholar] [CrossRef]
- Novellino, A.; Cesarano, M.; Cappelletti, P.; Martire, D.D.; Napoli, M.D.; Ramondini, M.; Sowter, A.; Calcaterra, D. Slow-moving landslide risk assessment combining machine learning and InSAR techniques. Catena 2021, 203, 105317. [Google Scholar] [CrossRef]
- Cheng, Y.S.; Pang, H.L.; Li, Y.Y.; Fan, L.; Wei, S.J.; Yuan, Z.W.; Fang, Y.Q. Applications and advancements of spaceborne InSAR in landslide monitoring and susceptibility mapping: A systematic review. Remote Sens. 2025, 17, 999. [Google Scholar] [CrossRef]
- Ciampalini, A.; Raspini, F.; Lagomarsino, D.; Catani, F.; Casagli, N. Landslide susceptibility map refinement using PSInSAR data. Remote Sens. Environ. 2016, 184, 302–315. [Google Scholar] [CrossRef]
- Lu, P.; Catani, F.; Tofani, V.; Casagli, N. Quantitative hazard and risk assessment for slow-moving landslides from persistent scatterer interferometry. Landslides 2014, 11, 685–696. [Google Scholar] [CrossRef]
- Oliveira, S.C.; ZêzerE, J.L.; Catalão, J.; Nico, G. The contribution of PSInSAR interferometry to landslide hazard in weak rock-dominated areas. Landslides 2015, 12, 703–719. [Google Scholar] [CrossRef]
- Zhang, G.; Wang, S.Y.; Chen, Z.W.; Liu, Y.T.; Xu, Z.X.; Zhao, R.S. Landslide susceptibility evaluation integrating weight of evidence model and InSAR results, west of Hubei Province, China. Egypt. J. Remote Sens. 2023, 26, 95–106. [Google Scholar] [CrossRef]
- Chen, J.; Zhou, W.D.; Cui, Z.J.; Li, W.C.; Wu, S.E.; Ma, J.X. Formation process of a large paleolandslide-dammed lake at Xuelongnang in the upper Jinsha River, SE Tibetan Plateau: Constraints from OSL and 14C dating. Landslides 2018, 15, 2399–2412. [Google Scholar] [CrossRef]
- Fan, X.M.; Xu, Q.; Alonso-Rodriguez, A.; Subramanian, S.S.; Li, W.L.; Zheng, G.; Dong, X.J.; Huang, R.Q. Successive landsliding and damming of the Jinsha River in eastern Tibet, China: Prime investigation, early warning, and emergency response. Landslides 2019, 16, 1003–1020. [Google Scholar] [CrossRef]
- Wu, R.A.; Yang, Z.H.; Guo, C.B.; Zhang, Y.S.; Song, D.G.; Ma, H.S.; Li, X.; Ni, J.W. Reactivation and dynamic process prediction of the Woda landslide in the upper Jinsha River Basin, China. Environ. Earth Sci. 2023, 82, 528. [Google Scholar] [CrossRef]
- Guo, C.B.; Yan, Y.Q.; Zhang, Y.S.; Zhang, X.J.; Zheng, Y.Z.; Li, X.; Yang, Z.H.; Wu, R.A. Study on the creep-sliding mechanism of the giant Xiongba ancient landslide based on the SBAS-InSAR method, Tibetan Plateau, China. Remote Sens. 2021, 13, 3365. [Google Scholar] [CrossRef]
- Zhang, Y.S.; Ren, S.S.; Liu, X.Y.; Guo, C.B.; Li, J.Q.; Bi, J.B.; Ran, L.N. Reactivation mechanism of old landslide triggered by coupling of fault creep and water infiltration: A case study from the east Tibetan Plateau. Bull. Eng. Geol. Environ. 2023, 82, 291. [Google Scholar] [CrossRef]
- Yang, Z.H.; Guo, C.B.; Wu, R.A.; Ni, J.W.; Yan, Y.Q.; Mai, X.M. Deformation mechanism of large deep-seated deposit landslide under the combined action of river and surface erosion: A case study of the Xiaomojiu landslide in the upper Jinsha River, Tibetan Plateau. Landslides 2025, 22, 1973–1988. [Google Scholar] [CrossRef]
- Su, L.; Zhang, L.; Gui, Y.; Li, Y.; Zhang, Z.; Xu, L.; Ming, D. Landslide hazard analysis combining BGA-Net-Based landslide susceptibility perception and small baseline subset interferometric synthetic aperture radar in the Baige Section in the Upper Reaches of Jinsha River. Remote Sens. 2024, 16, 2125. [Google Scholar] [CrossRef]
- Sun, X.; Chen, J.; Han, X.; Bao, Y.; Zhan, J.; Peng, W. Application of a GIS-based slope unit method for landslide susceptibility mapping along the rapidly uplifting section of the upper Jinsha River, South-Western China. Bull. Eng. Geol. Environ. 2020, 79, 533–549. [Google Scholar] [CrossRef]
- Sun, X.; Chen, J.; Li, Y.; Rene, N.N. Landslide susceptibility mapping along a rapidly uplifting river valley of the upper Jinsha River, southeastern Tibetan Plateau, China. Remote Sens. 2022, 14, 1730. [Google Scholar] [CrossRef]
- Yao, J.; Yao, X.; Zhao, Z.; Liu, X. Performance comparison of landslide susceptibility mapping under multiple machine-learning based models considering InSAR deformation: A case study of the Upper Jinsha River. Geomat. Nat. Haz. Risk 2023, 14, 2212833. [Google Scholar] [CrossRef]
- Ferretti, A.; Prati, C.; Rocca, F. Permanent scatterers in SAR interferometry. IEEE. Trans. Geosci. Remote Sens. 2001, 39, 8–20. [Google Scholar] [CrossRef]
- Ferretti, A.; Fumagalli, A.; Novali, F.; Prati, C.; Rocca, F.; Rucci, A. A new algorithm for processing interferometric data-stacks: SqueeSAR. IEEE Trans. Geosci. Remote Sens. 2011, 49, 3460–3470. [Google Scholar] [CrossRef]
- Berardino, P.; Fornaro, G.; Lanari, R.; Sansosti, E. A new algorithm for surface deformation monitoring based on small baseline differential SAR interferograms. IEEE Trans. Geosci. Remote Sens. 2002, 40, 2375–2383. [Google Scholar] [CrossRef]
- Lanari, R.; Mora, O.; Manunta, M.; Mallorqui, J.J.; Berardino, P.; Sansosti, E. A small-baseline approach for investigating deformations on full-resolution differential SAR interferograms. IEEE Trans. Geosci. Remote Sens. 2004, 42, 1377–1386. [Google Scholar] [CrossRef]
- Kulsoom, I.; Hua, W.H.; Hussain, S.; Chen, Q.H.; Khan, G.; Shihao, D. SBAS-InSAR based validated landslide susceptibility mapping along the Karakoram Highway: A case study of Gilgit-Baltistan, Pakistan. Sci. Rep. 2023, 13, 3344. [Google Scholar] [CrossRef] [PubMed]
- Strzabala, K.; Cwiakala, P.; Puniach, E. Identification of landslide precursors for early warning of hazards with remote sensing. Remote Sens. 2024, 16, 2781. [Google Scholar] [CrossRef]
- Werner, C.; Wegmüller, U.; Strozzi, T.; Wiesmann, A. GAMMA Sentinel Users Guide; GAMMA Remote Sensing AG: Gümligen, Switzerland, 2023. [Google Scholar]
- Mansouri, D.M.R. Landslide susceptibility zonation using analytical hierarchy process and GIS for the Bojnurd region, northeast of Iran. Landslides 2014, 11, 1079–1091. [Google Scholar] [CrossRef]
- Nicu, I.C. Application of analytic hierarchy process, frequency ratio, and statistical index to landslide susceptibility: An approach to endangered cultural heritage. Environ. Earth Sci. 2018, 77, 79. [Google Scholar] [CrossRef]
- U.S. Geological Survey (USGS). Shuttle Radar Topography Mission (SRTM) 1 Arc-Second; U.S. Geological Survey (USGS): Reston, VA, USA, 2015.
- Environmental Systems Research Institute (ESRI). ArcGIS 10.8; ESRI: Redlands, CA, USA, 2020. [Google Scholar]
Figure 1.
Geographical location and geological setting in the Baiyu–Batang section of the upper Jinsha River. (a) Geographical location of the Qinghai-Tibet Plateau, (b) Geographical location of the study area, (c) Geological setting of the study area. 1: Study area, 2: Jinsha River, 3: Active faults, 4: Paleocene–Eocene conglomerate, sandstone, and mudstone, 5: Cretaceous granite, 6: Cretaceous monzonite granite, 7: Cretaceous sandstone, siltstone, and conglomerate, 8: Jurassic monzonite granite, 9: Jurassic mudstone, siltstone, sandstone, limestone, and conglomerate, 10: Triassic monzonite granite, 11: Upper Triassic limestone, sandstone, and slate, 12: Upper Triassic sandstone, shale, and mudstone, 13: Middle and upper Triassic conglomerate, sandstone, siltstone, and limestone, 14: Low and middle Triassic phyllite and sandstone, 15: Permian metamorphic mudstone and tuffs, interbedded with marble; 16: Permian–Triassic ophiolitic mélange; 17: Devonian carbonate rock interbedded with minor sandstone; 18: Silurian limestone, mudstone, and slate; 19: Mesoproterozoic gneiss, quartz schist, and marbles; 20: Triassic granite; 21: Lower Triassic conglomerate; 22: Ordovician plagioclase granite; 23: Upper Permian volcanic rock and argillaceous sandstone; 24: Sinian–Cambrian marble; 25: Silurian–Devonian volcanic and carbonate rocks.
![Remotesensing 17 03335 g001 Remotesensing 17 03335 g001]()
Figure 2.
Comprehensive study framework of landslide susceptibility assessment considering landslide activity. PGA indicates the Peak Ground Acceleration.
Figure 2.
Comprehensive study framework of landslide susceptibility assessment considering landslide activity. PGA indicates the Peak Ground Acceleration.
Figure 3.
Surface deformation monitoring and deformation characteristics of typical landslides in the Baiyu–Batang section of the upper Jinsha River. Red represents areas with significant surface deformation, whereas green and blue represent areas with minimal surface deformation. (1) Woda landslide, (2) Shadingmai landslide, (3) Guili landslide, (4) Xiaomojiu landslide, (5) Xiongba landslide, (6) Sela landslide. The red dotted line indicates the boundary of the landslide.
Figure 4.
Development characteristics of typical active landslides in the Baiyu–Batang section of the upper Jinsha River. (a) Woda landslide (photo, mirror 225°), (b) Shadingmai landslide (photo, mirror 275°), (c) Guili landslide (Google image, mirror 215°), (d) Xiaomojiu landslide (UAV image, mirror 235°), (e) Xiongba landslide (photo, mirror 140°), (f) Sela landslide (photo, mirror 20°). The yellow dotted line indicates the boundary of the landslide, and the red arrow indicates the sliding direction of the landslide.
Figure 5.
Landslide spatial distribution characteristics in the Baiyu–Batang section of the upper Jinsha River. The search range for landslide density calculation is 3 km.
Figure 5.
Landslide spatial distribution characteristics in the Baiyu–Batang section of the upper Jinsha River. The search range for landslide density calculation is 3 km.
Figure 6.
Disaster-causing factors for landslide development in the Baiyu–Batang section of the upper Jinsha River. (
a) Topographic relief, (
b) Slope gradient, (
c) Slope aspect, (
d) Engineering geological unit, (
e) Distance to fault, (
f) PGA, (
g) Distance to river, (
h) NDVI. The meaning of the engineering geological unit number is referred to in
Table 2.
Figure 7.
Statistical analysis of landslide distribution characteristics. (
a) Topographic relief (m/km
2), (
b) Slope gradient (°), (
c) Slope aspect, (
d) Engineering geological unit (the classification number is presented in
Figure 6d), (
e) Distance to fault (km), (
f) PGA, (
g) Distance to river (km), (
h) NDVI. The horizontal axis of the histogram represents the factor grade intervals, and the vertical axis represents the landslide density (km
2/10 km
2). In the legend, A indicates Dataset A, B indicates Dataset B, and C indicates Dataset C.
Figure 8.
ROC curve of landslide susceptibility results. In the legend, A indicates Dataset A, B indicates Dataset B, and C indicates Dataset C.
Figure 8.
ROC curve of landslide susceptibility results. In the legend, A indicates Dataset A, B indicates Dataset B, and C indicates Dataset C.
Figure 9.
Landslide susceptibility distribution in the Baiyu–Batang section of the upper Jinsha River. (a) Landslide susceptibility result based on Dataset A (active landslide), (b) Landslide susceptibility result based on Dataset B (active and inactive landslide), (c) Landslide susceptibility result based on Dataset C (inactive landslide).
Figure 10.
Statistical charts of landslide susceptibility distribution. (a) Statistical area proportion of landslide susceptibility zones, (b) Statistical landslide proportion corresponding to landslide susceptibility zones. A indicates Dataset A, B indicates Dataset B, and C indicates Dataset C.
Figure 10.
Statistical charts of landslide susceptibility distribution. (a) Statistical area proportion of landslide susceptibility zones, (b) Statistical landslide proportion corresponding to landslide susceptibility zones. A indicates Dataset A, B indicates Dataset B, and C indicates Dataset C.
Table 1.
SAR image parameters in the Baiyu–Batang section of the upper Jinsha River.
Table 1.
SAR image parameters in the Baiyu–Batang section of the upper Jinsha River.
| SAR Sensor | Sentinel-1A |
|---|
| Orbital direction | Ascending |
| Path | 99 |
| Wave band | C |
| Radar wavelength (cm) | 5.6 |
| Incident angle (°) | 37.48 |
| Time interval (d) | 12 |
| Time period | January 2016 to February 2025 |
| Image quantity | 244 |
Table 2.
Engineering geological units in the Baiyu–Batang section of the upper Jinsha River.
Table 2.
Engineering geological units in the Baiyu–Batang section of the upper Jinsha River.
| ID | Engineering Geological Unit |
|---|
| 1 | Highly resistant sandstone |
| 2 | Moderately to highly resistant sandstone |
| 3 | Interbedded sequences of soft and competent sandstone and mudstone |
| 4 | Low to moderately resistant sandstone and mudstone |
| 5 | High-strength limestone and dolomite |
| 6 | Moderately resistant limestone |
| 7 | Alternating layers of weak and strong limestone and dolomite |
| 8 | Moderately to highly resistant slate and phyllite |
| 9 | Low to moderately resistant phyllite and schist |
| 10 | Massive, high-strength basalt |
| 11 | Massive, high-strength granite, andesite, and diorite |
| 12 | Weak loose sediments and deposits |
Table 3.
Factor information values for landslide susceptibility in the Baiyu–Batang section of the upper Jinsha River.
Table 3.
Factor information values for landslide susceptibility in the Baiyu–Batang section of the upper Jinsha River.
| Factor | Interval | Information Value (Ii) |
|---|
| A | B | C |
|---|
| Topographic relief (m/km2) | <380 | −4.284 | −4.789 | −5.128 |
| 380–490 | −1.652 | −2.053 | −2.296 |
| 490–620 | 0.520 | 0.546 | 0.557 |
| >620 | 1.624 | 1.650 | 1.661 |
| Slope gradient (°) | <10 | −1.759 | −1.580 | −1.511 |
| 10–20 | −0.096 | −0.175 | −0.212 |
| 20–30 | 0.104 | 0.013 | 0.060 |
| 30–40 | 0.298 | 0.259 | 0.241 |
| 40–50 | 0.047 | −0.042 | −0.118 |
| >50 | −0.196 | −0.536 | −0.861 |
| Slope aspect | N | −0.024 | 0.027 | 0.028 |
| NE | 0.659 | 0.420 | 0.293 |
| E | 0.604 | 0.317 | 0.159 |
| SE | 0.231 | −0.119 | −0.322 |
| S | −0.597 | −0.152 | −0.006 |
| SW | −0.670 | 0.025 | 0.223 |
| W | −0.525 | −0.350 | −0.281 |
| NW | −1.085 | −0.578 | −0.417 |
| Engineering geological unit | 1 | −0.204 | −1.390 | −1.689 |
| 2 | −2.362 | −1.389 | −1.148 |
| 3 | − | −1.976 | −1.612 |
| 4 | − | − | − |
| 5 | −0.884 | −0.843 | −0.826 |
| 6 | − | − | − |
| 7 | − | − | − |
| 8 | −0.431 | −0.433 | −0.434 |
| 9 | 0.578 | 0.588 | 0.593 |
| 10 | −0.140 | −0.086 | −0.064 |
| 11 | 0.487 | 0.405 | 0.367 |
| 12 | −2.280 | −3.468 | − |
| Distance to fault (km) | <0.5 | 0.494 | 0.357 | 0.343 |
| 0.5–1 | 0.138 | 0.334 | 0.310 |
| 1–2 | −0.174 | 0.103 | 0.145 |
| 2–5 | −0.182 | −0.060 | 0.095 |
| 5–10 | −0.426 | −0.208 | −0.230 |
| >10 | −0.577 | −2.902 | −0.376 |
| PGA (g) | 0.1 | −2.555 | −3.744 | − |
| 0.15 | 0.042 | −0.179 | −0.294 |
| 0.2 | 0.112 | 0.228 | 0.275 |
| Distance to drainage (km) | <0.2 | 0.854 | 0.841 | 0.836 |
| 0.2–0.5 | 1.353 | 1.346 | 1.342 |
| 0.5–1 | 1.212 | 1.293 | 1.326 |
| 1–1.5 | 1.073 | 1.131 | 1.156 |
| 1.5–2 | 0.846 | 0.773 | 0.739 |
| 2–5 | −0.349 | −0.418 | −0.449 |
| >5 | −2.855 | −3.033 | −3.123 |
| NDVI | <0.6 | −2.347 | −2.728 | −2.955 |
| 0.6–0.8 | 0.422 | 0.279 | 0.209 |
| >0.8 | −0.112 | 0.183 | 2.289 |
Table 4.
Factor judgment matrix for landslide susceptibility in the Baiyu–Batang section of the upper Jinsha River.
Table 4.
Factor judgment matrix for landslide susceptibility in the Baiyu–Batang section of the upper Jinsha River.
| Factor | F1 | F2 | F3 | F4 | F5 | F6 | F7 | F8 | Weight |
|---|
| F1 | 1 | 1/4 | 2 | 1/2 | 1/2 | 1 | 1/2 | 1/2 | 0.083 |
| F2 | 4 | 1 | 3 | 2 | 2 | 4 | 2 | 3 | 0.265 |
| F3 | 1/2 | 1/3 | 1 | 1/2 | 1/2 | 1 | 1 | 1/2 | 0.060 |
| F4 | 2 | 1/2 | 2 | 1 | 1/2 | 2 | 1 | 2 | 0.134 |
| F5 | 2 | 1/2 | 2 | 2 | 1 | 3 | 1 | 2 | 0.168 |
| F6 | 1 | 1/4 | 1 | 1/2 | 1/3 | 1 | 1/2 | 1/2 | 0.062 |
| F7 | 2 | 1/2 | 1 | 1 | 1 | 2 | 1 | 1 | 0.121 |
| F8 | 2 | 1/3 | 2 | 1/2 | 1/2 | 2 | 1 | 1 | 0.107 |
Table 5.
Statistical analysis of landslide susceptibility distribution.
Table 5.
Statistical analysis of landslide susceptibility distribution.
| Landslide Susceptibility | Area (km2) | Area Proportion (%) | Landslide Number | Landslide Number Proportion (%) |
|---|
| A | B | C | A | B | C | A | B | C | A | B | C |
|---|
| Very high | 2489 | 2448 | 2369 | 16.28 | 16.01 | 15.49 | 154 | 294 | 134 | 81.20 | 80.47 | 76.42 |
| High | 3639 | 3490 | 3464 | 23.80 | 22.83 | 22.66 | 24 | 41 | 23 | 12.78 | 11.33 | 13.01 |
| Medium | 4465 | 4230 | 4348 | 29.20 | 27.67 | 28.44 | 9 | 26 | 16 | 4.51 | 7.03 | 8.94 |
| Low | 4696 | 5121 | 5108 | 30.71 | 33.49 | 33.41 | 3 | 4 | 3 | 1.50 | 1.17 | 1.63 |
| Disclaimer/Publisher’s Note: The statements, opinions and data contained in all publications are solely those of the individual author(s) and contributor(s) and not of MDPI and/or the editor(s). MDPI and/or the editor(s) disclaim responsibility for any injury to people or property resulting from any ideas, methods, instructions or products referred to in the content. |
© 2025 by the authors. Licensee MDPI, Basel, Switzerland. This article is an open access article distributed under the terms and conditions of the Creative Commons Attribution (CC BY) license (https://creativecommons.org/licenses/by/4.0/).
