Article

Spatiotemporal Characteristics of Ground Subsidence in Xiong’an New Area Revealed by a Combined Observation Framework Based on InSAR and GNSS Techniques

1
School of Civil Engineering, Beijing Jiao Tong University, Beijing 100044, China
2
Beijing Urban Rail Transit Safety and Disaster Prevention Engineering and Technology Research Center, Beijing 100044, China
3
Beijing Institute of Geology and Mineral Exploration, Beijing 100044, China
*
Author to whom correspondence should be addressed.
Remote Sens. 2025, 17(15), 2654; https://doi.org/10.3390/rs17152654 (registering DOI)
Submission received: 1 June 2025 / Revised: 24 July 2025 / Accepted: 25 July 2025 / Published: 31 July 2025
(This article belongs to the Special Issue Advances in Remote Sensing for Land Subsidence Monitoring)

Abstract

The Xiong’an New Area, a newly established national-level zone in China, faces the threat of land subsidence and ground fissure due to groundwater overexploitation and geothermal extraction, threatening urban safety. This study integrates time-series InSAR and GNSS monitoring to analyze spatiotemporal deformation patterns from 2017/05 to 2025/03. The key results show: (1) Three subsidence hotspots, namely northern Xiongxian (max. cumulative subsidence: 591 mm; 70 mm/yr), Luzhuang, and Liulizhuang, strongly correlate with geothermal wells and F4/F5 fault zones; (2) GNSS baseline analysis (e.g., XA01-XA02) reveals fissure-induced differential deformation (max. horizontal/vertical rates: 40.04 mm/yr and 19.8 mm/yr); and (3) InSAR–GNSS cross-validation confirms the high consistency of the results (Pearson’s correlation coefficient = 0.86). Subsidence in Xiongxian is driven by geothermal/industrial groundwater use, without any seasonal variations, while Anxin exhibits agricultural pumping-linked seasonal fluctuations. The use of rooftop GNSS stations reduces multipath effects and improves urban monitoring accuracy. The spatiotemporal heterogeneity stems from coupled resource exploitation and tectonic activity. We propose prioritizing rooftop GNSS deployments to enhance east–west deformation monitoring. This framework balances regional and local-scale precision, offering a replicable solution for geological risk assessments in emerging cities.

1. Introduction

The establishment of the Xiong’an New Area (XNA) is one of the strategic responses to promote the coordinated development of densely populated cities in the Beijing–Tianjin–Hebei urban agglomeration, which is located in the North China Plain [1]. The urbanization process of the XNA has continued since 1 April 2017, with the planning and construction broadly divided into three periods, and its total development area has expanded from 100 km2 at the initial stage to 202 km2 currently [2]. However, the geo-environmental risks faced by the XNA have still not been accurately assessed, which is especially importance since there is a long history of geothermal energy extraction and groundwater pumping in the area, which is a common trigger for ground subsidence hazards [3]. And previous studies show that the obvious uneven settlement and ground crack disasters in the area have threatened the infrastructure safety, urbanization process, and sustainable development of the XNA. Therefore, it is necessary to monitor surface deformation and analyze the spatial and temporal evolution of ground settlement and ground fissures in the XNA.
Traditionally, ground subsidence on regional scales can be monitored using in situ means of survey measurements, such as levelling, bedrock marking, and stratification calibration [4,5]. Although the above methods have high monitoring accuracy, they have low spatial resolution, making it difficult to obtain information on the complete deformation field and, at the same time, they are labor intensive and it is difficult to carry out long-term and continuous ground settlement monitoring, which means that they cannot meet the practical needs of modern urban infrastructure construction and disaster risk management [6]. With the abundance of space-based Earth observation data and the improvement of data processing and analysis capabilities, Global Navigation Satellite System (GNSS) and Interferometric Synthetic Aperture Radar (InSAR) technologies have been proven to be two reliable geodetic means for carrying out ground subsidence monitoring research. These technologies effectively and efficiently overcome the above limitations of traditional methods and show great potential for application in ground settlement monitoring [7].
Specifically, the GNSS technique has the advantages of high precision, all-weather all-day operation, the capture of automated observation and recording data, and it can obtain high-precision three-dimensional coordinate information, etc., which has been widely used in the field of urban ground subsidence monitoring [8]. From the viewpoint of technology development history, GNSS ground settlement monitoring technology has developed from the early stage of static relative positioning, relying on a single reference station, to the stage involving the dynamic solving of a single calendar element by establishing a continuously operating reference station (CORS) network, and the accuracy and stability of the monitoring results have been improved significantly. In the meantime, benefiting from the development of real-time data transmission technology, it has become possible to use GNSS technology for real-time monitoring and early warning of ground subsidence. Currently, GNSS techniques have been widely used in ground subsidence studies worldwide, such as in Sacramento Valley, USA [9]; Aswan, Egypt [10]; Konya Closed Basin, Turkey [11]; Yiyang, China [12,13]; and Ganzhou, China [14]. However, it should be noted that GNSS ground subsidence monitoring technology mainly depends on the deployment of ground monitoring stations. Due to the strict requirements on data quality and the need for the deployment of monitoring stations, the operation and maintenance costs involved are relatively high, which to a certain extent restricts the application of such monitoring in regard to a wide range of applications, resulting in low spatial resolution and poor data continuity in terms of the application of GNSS technology to ground subsidence monitoring and other problems. In addition, during the process of station deployment, there is a lack of a systematic station deployment strategy, which makes it difficult to accurately select key monitoring areas, thus affecting the overall effectiveness of the monitoring stations.
The InSAR technique, as a new type of Earth observation technique, has the advantages of a large range, data capture over long periods; all-day, all-weather operation; and high accuracy, and has now become one of the main means of ground subsidence monitoring [15,16]. In view of the development period, the InSAR technology has undergone changes from the Single-temporal InSAR stage, represented by D-InSAR [17], to the multi-time-phase Multi-temporal InSAR stage, constituted by PS-InSAR [18,19] and SBAS-InSAR [20], gradually overcoming the shortcomings of long-time deformation monitoring, which is susceptible to interference by factors related to spatial and temporal incoherence and atmospheric delays, etc. InSAR technology has been widely used in the field of deformation monitoring, and has been used in relation to spatial and temporal incoherence. In the last two decades, InSAR technology has been widely used in global ground subsidence monitoring studies, such as in Tehran, Iran [21]; Houston, USA [22]; the Grand Canyon, California [23]; and the Louisiana Wetlands [24]; Mexico [25]; Beijing, China [26]; Xi’an [27]; and the Qilian Mountains [28]. Some scholars have also carried out relevant studies on the XNA, and, in 2018, Zhang Yong Hong et al. [29] calculated the average subsidence rate and cumulative subsidence in the XNA based on 28-phase RADARSAT-2 images, and revealed the main causes of ground subsidence. In 2021, Dai et al. [30] explored the spatial relationship between the average subsidence rate and cumulative subsidence based on the ground subsidence in the XNA between 2017 and 2018, combined with the spatial distribution of geothermal wells. In 2022, Ran Peilian et al. [31] monitored the ground subsidence in the XNA between 2017 and 2019, and analyzed the relationship between ground subsidence and groundwater and geothermal resources. In general, current SAR satellites are dominated by near-polar orbits [32], and the orbital characteristics of these satellites lead to lower accuracy of InSAR technology in regard to horizontal displacements, in particular, they are insensitive to east–west displacements [33]. Therefore, GNSS and InSAR technologies have their own advantages and limitations, and the construction of a targeted joint monitoring framework is an opportunity to capture regional surface deformation data; however, the current monitoring framework for the integration of GNSS and InSAR is still insufficient, and there is an urgent need to propose a joint observation framework for ground subsidence monitoring based on the geological conditions and the characteristics of the deformation field.
This paper is organized as follows: firstly, the geological features and multi-source datasets of the XNA are introduced, and the evidence of ground crack development from field surveys is described; secondly, a multi-source data processing framework involving joint time-series InSAR and real-time GNSS technology is introduced, with a focus on the baseline point solution dual-mode GNSS analysis system; furthermore, the different methods used to monitor the ground surface deformation in the XNA, in regard to the 2017- 2025 surface deformation results, quantitatively assess the differential deformation patterns on both sides of the ground fissure and accuracy analysis is performed by using GNSS–InSAR cross-validation; finally, the data advantages of GNSS station deployment on the top of buildings are discussed in depth, and the subsidence-driven mechanism of geothermal mining and groundwater overexploitation is demonstrated.

2. Study Area and Dataset
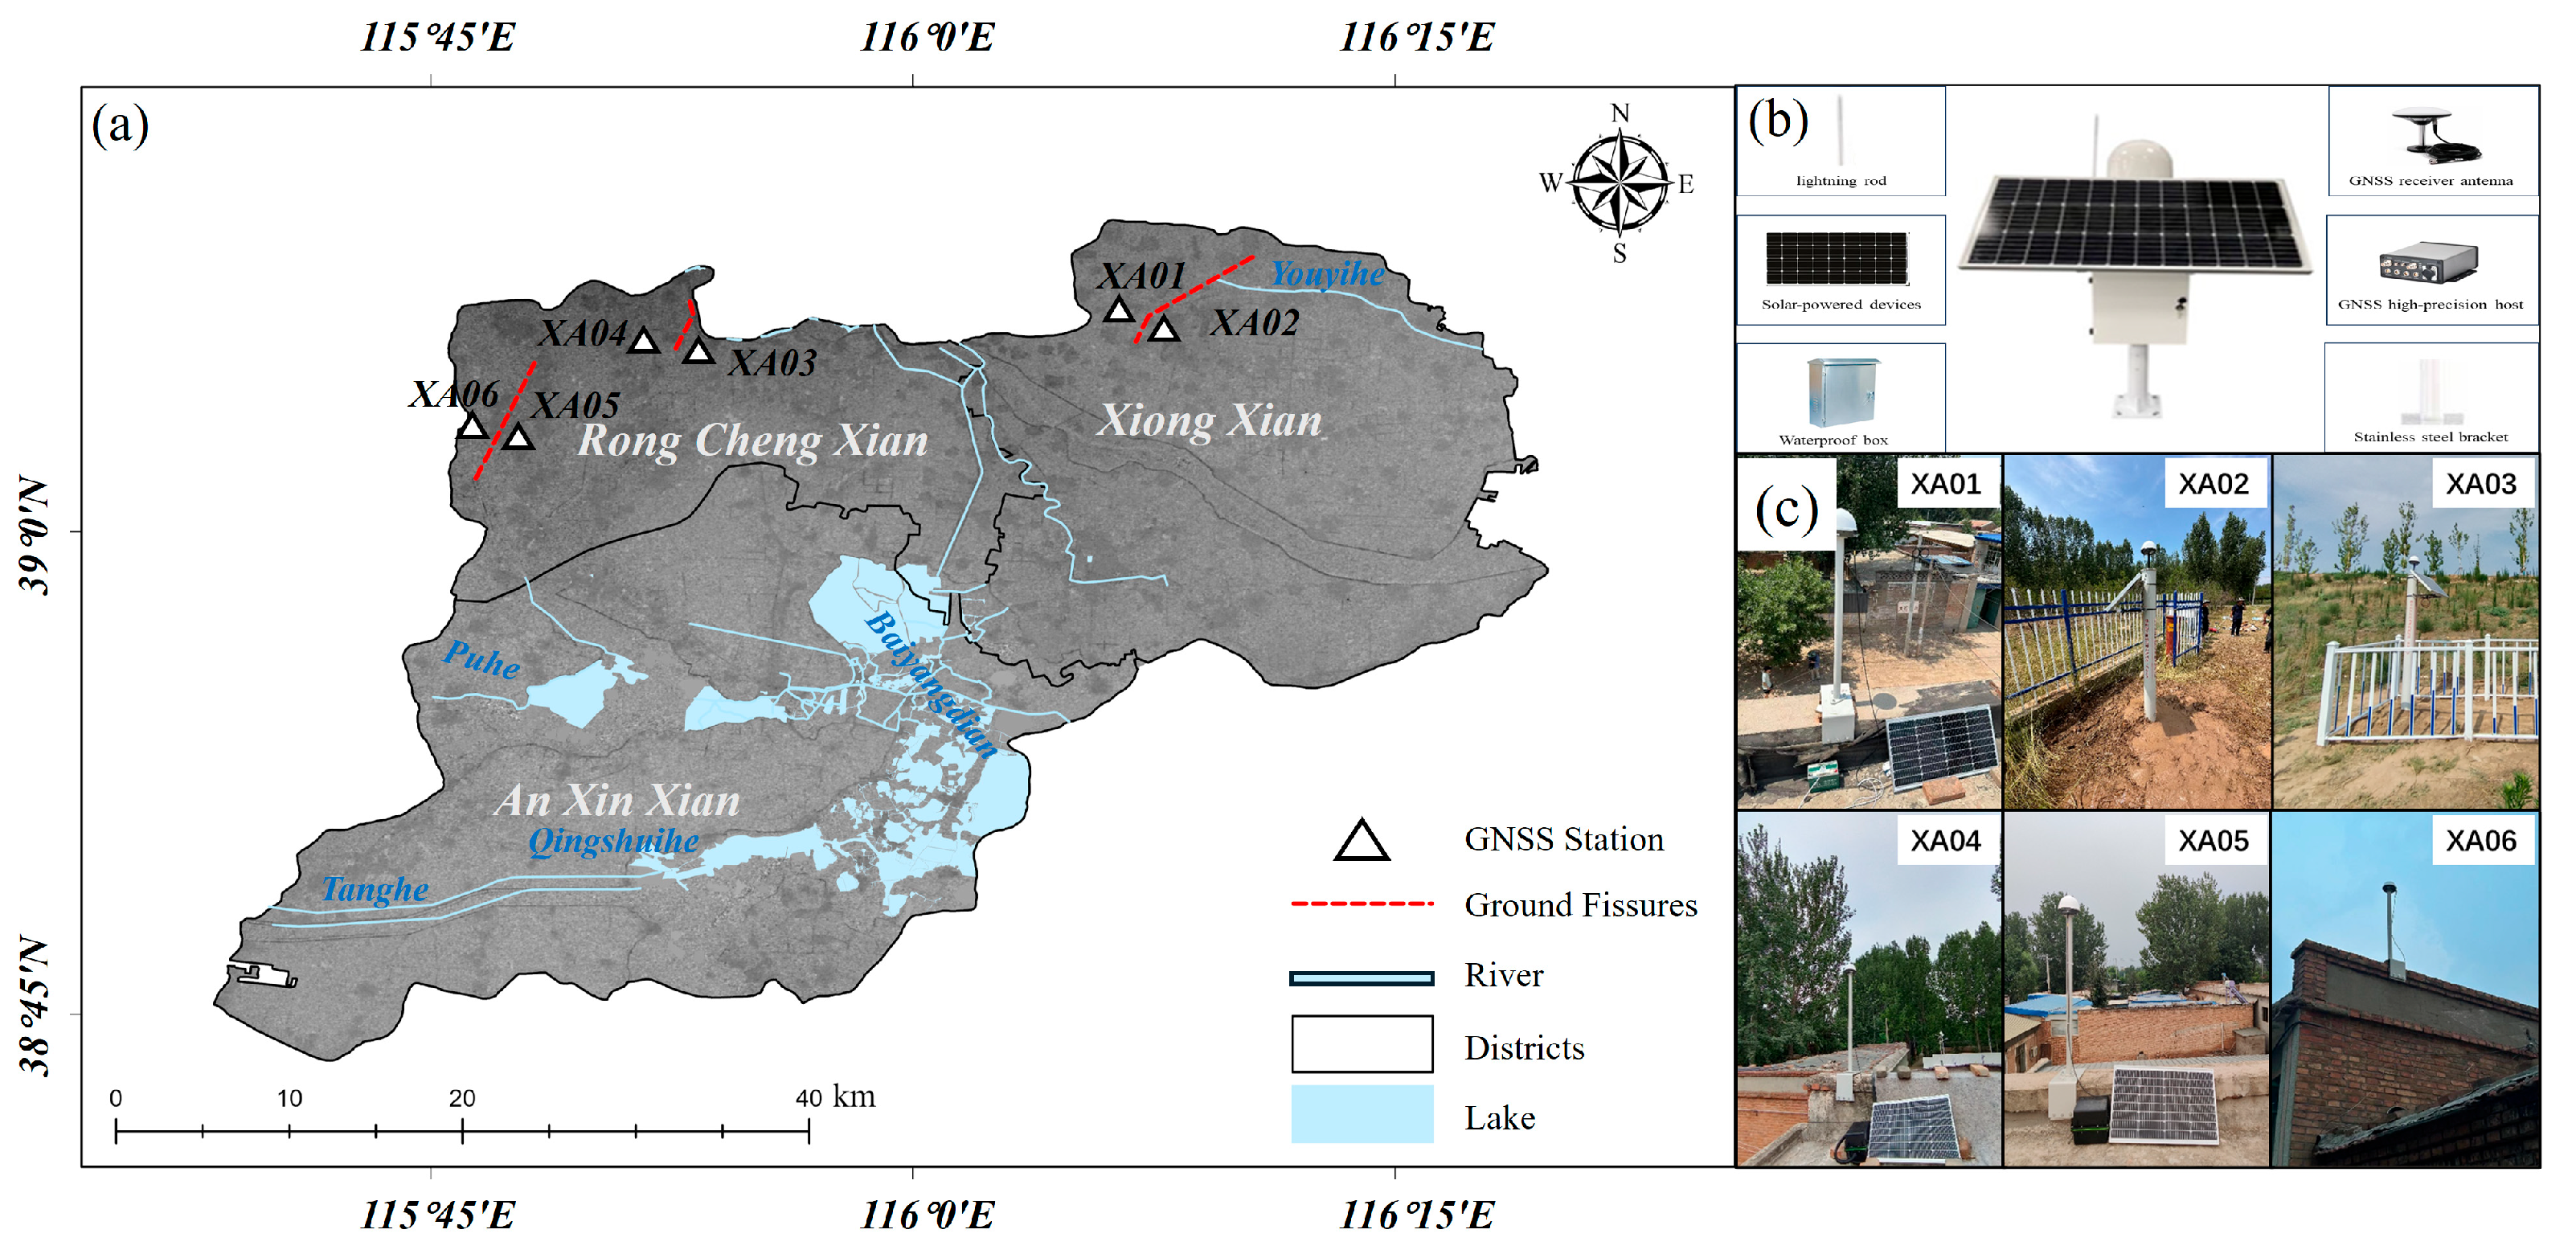
2.1. Study Area

Xiong’an New Area (XNA) is located in the heart of the Beijing–Tianjin–Hebei region, approximately 100 km from both Beijing and Tianjin (between 115°38′E–116°20′E and 38°43′N–39°10′N), serving as a core area for the coordinated development of the region. Figure 1a illustrates the geographical location and administrative planning of the XNA. The area encompasses Xiong County, Rongcheng County, Anxin County, and surrounding regions, with a planned total area of approximately 1770 km2 (Figure 1b). XNA is situated on the eastern foothills of the Taihang Mountains and the central part of the North China Plain, featuring a gently sloping topography that is slightly elevated in the northwest and lower in the southeast. The surface slope is less than 2%, with elevations ranging from 5 to 20 m, indicating a relatively flat terrain. The regional geological structure is complex, characterized by alternating NE–NNE-trending uplifts and faulted depressions, forming a multi-convex, multi-concave structural pattern. The area lies within a warm temperate continental monsoon climate zone, featuring semi-humid and semi-arid characteristics. According to climate observations from 2009 to 2018, the average annual precipitation across most of the area ranges between 410 and 450 mm, with 68% occurring from June to September, while winter precipitation accounts for less than 2% of the annual total [34]. Groundwater is a crucial source of drinking water, as well as industrial and agricultural water in the XNA. The region is characterized by a well-developed surface water system, with shallow groundwater of generally good quality and deep groundwater of excellent quality. Additionally, the area is rich in geothermal resources, with favorable conditions for thermal energy development and utilization [35]. Influenced by active regional faults, ground fissure and uneven subsidence (Figure 1b) are widely distributed in Xiong’an New Area [36,37,38], primarily including five regional faults: the Rongxi Fault (F1), the Rongdong Fault (F2), the Rongcheng Fault (F3), the Niuxi Fault (F4), and the Niudong Fault (F5). Figure 1b also shows the spatial distribution of three typical ground fissures in the region.

2.2. Data Sources

2.2.1. GNSS Network Design Strategy

To accurately characterize the spatiotemporal evolution of land subsidence and ground fissure in the Xiong’an New Area (XNA), this study establishes a GNSS monitoring network that integrates InSAR-derived deformation information with field survey results on ground fissures. This system offers several advantages, including targeted deployment, high temporal resolution, and intelligent data acquisition. It enables highly precise, continuous monitoring of both horizontal and vertical ground deformations, making it particularly suitable for detecting subtle localized deformation patterns in ground fissure-prone areas. During the deployment of the GNSS monitoring network, comprehensive factors were considered, such as the spatial distribution of ground fissures, the intensity of the subsidence, geological conditions, and the observational environment. A key deployment principle was proposed: prioritize the placement of monitoring stations on both sides of the fissure. A flexible strategy that included both ground-based and rooftop-mounted platforms was adopted to enhance the adaptability to surface conditions and ensure the continuity of data acquisition.
By symmetrically deploying GNSS stations on both sides of the fissure, synchronous observations can be achieved, enabling the effective detection of three-dimensional ground deformation and high-precision real-time monitoring. This provides strong data support for disaster early warning systems and risk assessments. The spatial distribution of the GNSS stations is illustrated by the white triangles in Figure 2a. In areas with complex terrain, frequent construction disturbances, or where safe ground deployment is difficult, traditional monitoring station placement faces significant limitations. To address this, the study proposes the use of building rooftops as alternative monitoring platforms. In urban or geologically complex areas, installing GNSS equipment on structurally stable rooftops minimizes interference from surface obstructions and multipath effects, thereby improving observation accuracy and data continuity. This study adheres to fundamental principles on structural stability and construction safety, prioritizing modern buildings without noticeable tilting, cracking, or risks of foundational settlement, and that have not undergone major construction activity in recent years. All of the selected locations underwent rigorous calibration and accuracy testing. This deployment strategy ensures the long-term stable operation of rooftop GNSS stations, providing robust support for real-time deformation monitoring in ground fissure-prone areas. Figure 2c presents field photos of each GNSS monitoring site.

2.2.2. Dataset

Based on the C-band Sentinel-1A satellite TOPSAR’s ascending orbit imagery (Track 142) provided by the European Space Agency (ESA), this study employed time-series InSAR technology to investigate the spatiotemporal distribution of ground subsidence and ground fissure deformation in the Xiong’an New Area from May 2017 to March 2025. A total of 125 Interferometric Wide Swath (IW) scenes were used, with the spatial coverage shown in Figure 1a and detailed data parameters listed in Table 1. The Copernicus Digital Elevation Model (COP-DEM), generated by the ESA, based on TerraSAR-X observations from 2010 to 2015, with a spatial resolution of 30 m, was used to remove the topographic phase. Compared to other DEMs with a similar spatial resolution, such as SRTM DEM (2000) and ASTER DEM (2011), COP-DEM offers better temporal proximity to the Sentinel-1A data acquisition period (2017–2025), thereby enhancing the accuracy of the deformation estimates. Precise Orbit Ephemerides (POD) data were used to eliminate orbit errors and improve orbital accuracy.
As shown in Figure 2b, the GNSS monitoring system constructed in this study comprises a power supply module, data acquisition devices, a communication module, and a data storage and processing platform. The power supply system integrates solar panels, a smart power controller, and batteries. The controller features overload and undervoltage protection and can automatically shut off the power when the battery voltage falls below a certain threshold, and can restart the receiver when the voltage recovers, thus enabling 24/7 unattended intelligent power management. The data acquisition equipment consists of multi-system GNSS receivers, capable of tracking signals from BDS, GPS, GLONASS, and Galileo systems. The data are recorded every 15 s and stored in RTCM format, according to the standards set by the Radio Technical Commission for Maritime Services (RTCM). The communication module uses the internet-based NTRIP (Networked Transport of RTCM via Internet Protocol) to transmit observational data in real-time to a central cloud server via a 4G cellular network. The cloud server platform integrates data storage, backup, quality control, and processing functions, supporting the unified management and processing of large-scale, multi-station observational data.
The GNSS data used in this study were collected from six continuously operating stations within the study area. All the stations were configured using identical equipment and data acquisition specifications to ensure consistency in the temporal and spatial resolution and data quality. A comprehensive quality control workflow was implemented, including multipath effect identification, signal-to-noise ratio analysis, outlier removal, and data integrity verification, thus providing reliable data support for surface deformation analysis and subsequent applications.

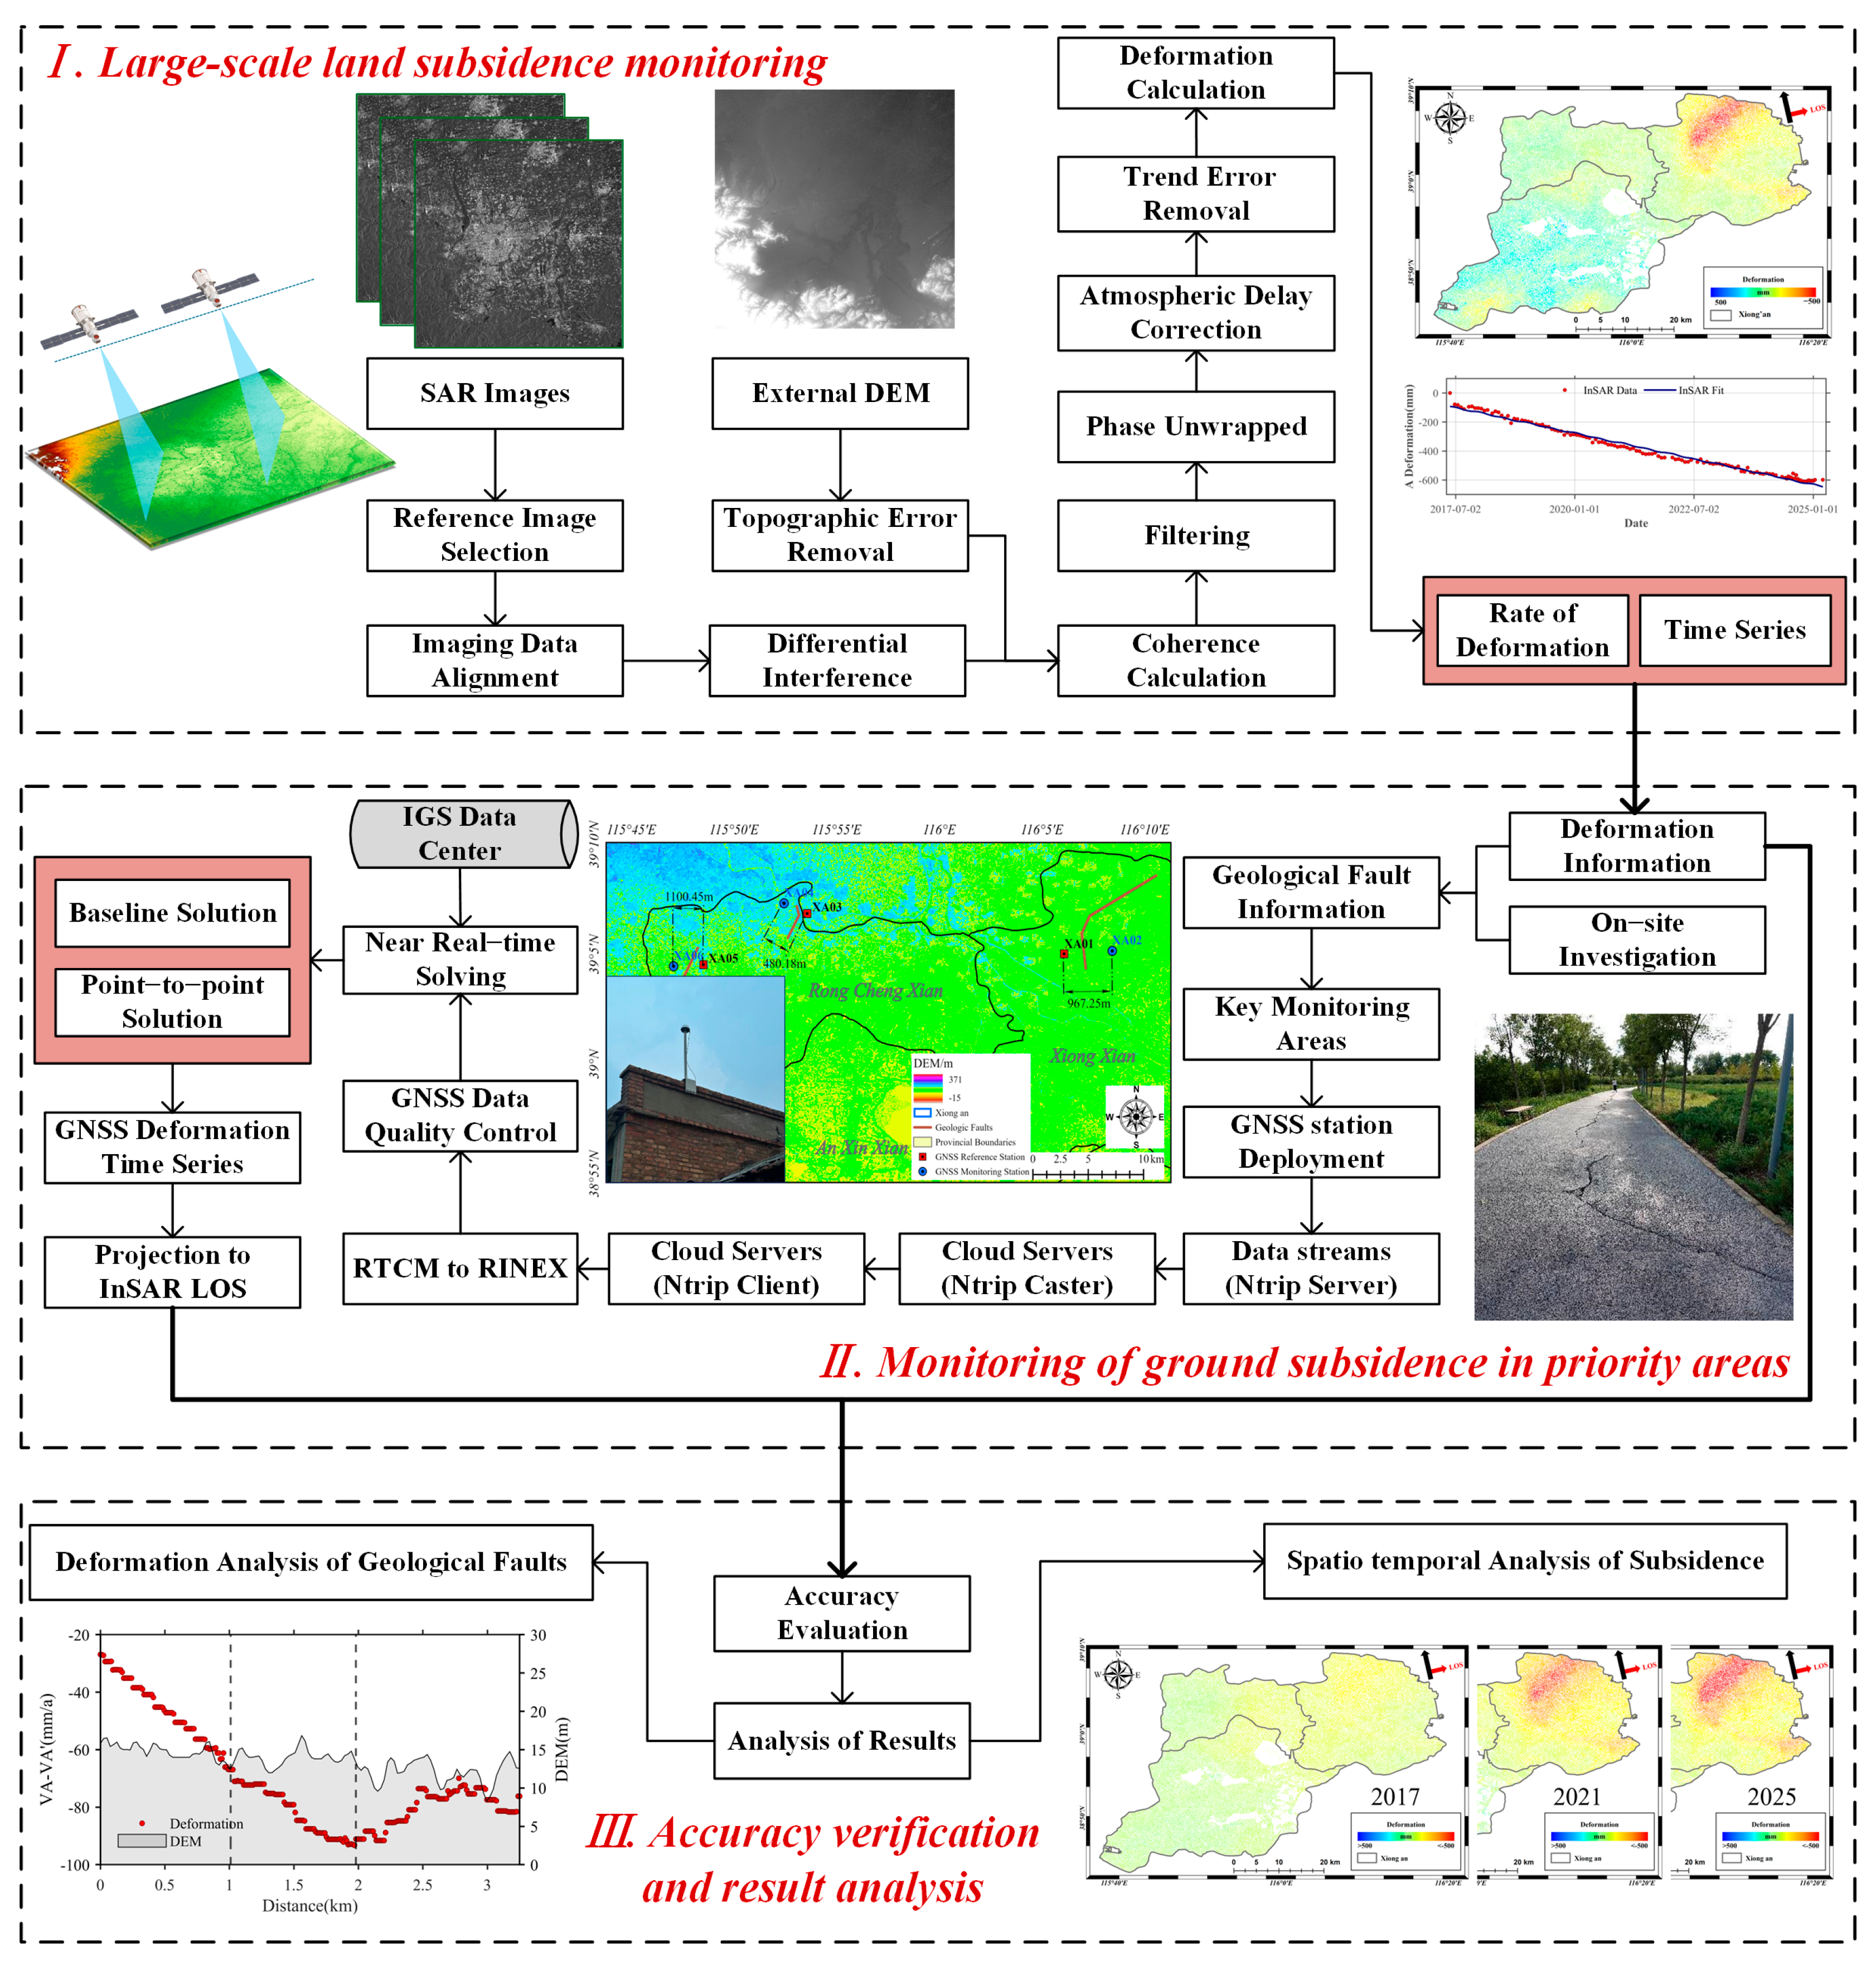
3. Multi-Source Data Processing Strategy

3.1. Construction of a Joint Monitoring Framework for Ground Fissure and Land Subsidence Based on Multi-Source Data

In response to the practical demands of large-scale, rapid surveys and high-precision, real-time monitoring of ground fissure development zones and land subsidence areas during the construction of large emerging urban regions, this study proposes a multi-source land subsidence monitoring framework that integrates time-series InSAR and real-time GNSS technologies (as illustrated in Figure 3). The core concept of this framework encompasses the following aspects: First, time-series InSAR technology is employed to derive long-term, large-scale surface deformation fields and their temporal evolution across the study area, thereby providing an initial understanding of the spatial and temporal characteristics of land subsidence. Prior to InSAR analysis, a series of systematic preprocessing steps must be performed on the raw radar imagery to ensure the accuracy of the deformation results. The original data are often affected by factors such as topographic errors and orbital inaccuracies. Topographic errors can be corrected by incorporating high-resolution external DEM, while orbital errors can be significantly reduced using precise orbit products. After extracting the deformation field, key monitoring zones can be delineated based on the extent and rate of subsidence, supplemented by field surveys of ground fissures, thus supporting subsequent risk assessment and disaster mitigation efforts. GNSS monitoring stations are deployed within these key areas to establish a deformation monitoring network. To address the distinct needs of capturing subtle ground fissure deformations and monitoring significant land subsidence, two GNSS data processing strategies, namely baseline and relative positioning, are applied to compute real-time three-dimensional deformation results, yielding highly precise, continuous deformation time-series data. In addition, the InSAR-derived deformation results are cross-validated with the real-time GNSS solutions to assess the accuracy and feasibility of the proposed monitoring approach. Finally, by integrating the time-series InSAR results, GNSS-derived 3D deformation data, and geological field investigation data, the spatiotemporal distribution of land subsidence and the subtle deformation features of ground fissures within the study area are comprehensively analyzed. This framework effectively leverages the complementary strengths of multiple sensing technologies, balancing monitoring accuracy with the spatial and temporal resolution. It provides technical support for land subsidence monitoring of urban development, meeting both the broad-scale survey needs at the regional level and the continuous monitoring requirements of critical areas.

3.2. SBAS-InSAR

In this paper, the spatial and temporal features of the XNA surface deformation are extracted using the intensity and phase information provided by the Sentinel-1 data, and the data processing methods adopted include single-view multiplexed image preprocessing and SBAS-InSAR deformation solving. ISCE-2 was used to preprocess the Sentinel-1 data with image co-alignment, terrain phase contribution removal, image resampling, and noise phase removal and, for the completed preprocessed SAR data, the surface deformation field was inverted, based on the SBAS-InSAR method.
The SBAS-InSAR technique is a time-series InSAR processing method based on least squares estimation, designed to obtain highly precise deformation time-series data [19]. This method constructs an interferogram network by combining SAR image pairs with short spatial and temporal baselines, thereby increasing the number of interferograms and mitigating the effects of spatiotemporal decorrelation on interferogram quality. After denoising, the least squares algorithm is applied to the deformation rates, and the radar line-of-sight deformation velocities and time series of coherent targets are retrieved using Singular Value Decomposition (SVD).
For the i-th differential interferogram generated from the slave image acquired at time t A and the master image at time t B , the interferometric phase for any pixel x , y can be expressed as:
δ Φ i x , y = Φ B x , y Φ A x , y = Φ d e f i x , y + Φ d e m i x , y + Φ a t m i x , y + Φ n o i i x , y + Φ o r b i x , y  
In this expression, Φ d e f i represents the deformation phase component along the radar line-of-sight direction; Φ d e m i denotes the residual topographic phase induced by elevation errors; Φ a t m i corresponds to the atmospheric delay phase; Φ n o i i represents the decorrelation noise phase; and Φ o r b i denotes the residual orbital error phase.
Assuming that Φ n o i i is relatively small and is, thus, negligible, and after removing the topographic, atmospheric, and orbital phase components, to obtain a well-defined time series, the phase in Equation (3) can be expressed as the product of the average phase velocity between two time points and the time interval. Therefore, the phase value of the i-th interferogram can be expressed as:
k = t A , i + 1 t B , i t k t k 1 v k = δ Φ i
The time series of the deformation rates can be represented in matrix form as:
B v = δ Φ
Here, B is an M × N matrix, and δ Φ is the vector of the interferometric phase values. L denotes the number of small baseline subsets. When L = 1, the matrix B is of full column rank, and the cumulative deformation phases can be estimated using the least squares method. When L > 1, B becomes rank deficient, and the least squares solution with the minimum norm of deformation rates must be obtained using Singular Value Decomposition (SVD).

3.3. Universal GNSS Near Real-Time Resolution

To accurately capture surface deformation characteristics in the monitoring area, particularly the differential ground movement on both sides of a ground fissure (e.g., horizontal compression and extension, as well as vertical uplift and subsidence), this study designed and implemented two GNSS data processing strategies: the baseline processing strategy and the point-pair processing strategy. These approaches are suited for regional deformation trend analysis (baseline processing) and local tectonic differential movement identification (point-pair processing). By complementing each other, they provide comprehensive insights into the physical processes and mechanisms underlying surface deformation.

3.3.1. GAMIT Baseline Processing Strategy

GAMIT baseline processing employs carrier-phase double-difference observations for positioning, effectively eliminating receiver and satellite clock errors, while mitigating errors due to satellite ephemeris, tropospheric delays, and ionospheric delays. In this study, the baseline processing strategy adopts a fixed reference station approach, using the globally stable continuous operating reference station, BJFS (39.609°N, 115.892°E, 87.483 m), in Beijing Fangshan as the datum. Each monitoring point (XA01-XA06) within the study area was connected to the BJFS, forming multiple independent single baselines. The baseline processing strategy for the quasi-real-time GNSS data adopted in this study is summarized in Table 2. This includes the selection of baseline solution modes, atmospheric correction strategies, and satellite orbit information, among other key parameters.
In regard to the GAMIT processing configuration, we adopted the dual-frequency ionosphere-free combination (LC) to eliminate first-order ionospheric delay effects, while utilizing wide lane (WL) and narrow lane (NL) combined observations to decompose and resolve LC ambiguities. The Saastamoinen model was applied for tropospheric delay correction. For precise positioning, we employed near real-time (NRT) hybrid precise ephemeris products, provided by the IGS Analysis Centers, with the broadcast ephemeris serving as the real-time reference data. This comprehensive approach ensures high-accuracy GNSS solutions by effectively mitigating various error sources, including ionospheric, tropospheric, and ephemeris-related errors.
By solving the relative baseline variations in the observation stations at time t, we can obtain the deformation time series.
Δ X N / E / U = X ( t ) X ( t 0 )
where X ( t 0 ) represents the baseline length at the initial epoch t 0 , and X ( t ) denotes the baseline length at epoch t . The advantage of this strategy lies in its ability to establish a unified reference frame, which facilitates the analysis of regional deformation trends and temporal evolution characteristics.

3.3.2. Point-Pair Processing Strategy

To focus on the localized deformation characteristics induced by ground fissure activity, this study further adopts a point-pair processing strategy. For each pair of monitoring points, one station is selected as the reference to form a single baseline with its counterpart. Relative displacement time series are then derived through double-difference phase processing. Taking monitoring point pair O (reference station) and P (monitoring station) as an example, the baseline displacement at any epoch t is expressed as:
Δ Y N / E / U = Y P ( t ) Y O ( t )
When employing GAMIT for point-pair processing, its key distinction from the baseline strategy lies in the selection of L1_ONLY as the observation type for shorter baselines. In this study, the baseline processing strategy is applied to extract the regional deformation background field of the monitored area. The point-pair processing strategy specifically characterizes localized differential movements across the ground fissure. The combined use of both strategies enables comprehensive interpretation of regional deformation features, effectively decoupling large-scale trends from localized displacement patterns.

3.3.3. GNSS Near Real-Time (NRT) Processing

The GNSS-NRT data processing workflow consists of four key steps: (1) A cloud-based data management module continuously receives and decodes raw data streams from monitoring stations, converting them into standardized RINEX observation files for storage; (2) an automated Python 3.9.1 script downloads necessary auxiliary data, including satellite ephemeris, IGS reference station observations, and configuration tables; (3) rigorous quality control is applied to the RINEX files, excluding stations with either less than 80% data completeness or observation durations shorter than 4 hours; and (4) the system automatically executes GAMIT processing and stores the derived deformation parameters in a structured database. This integrated pipeline ensures efficient NRT monitoring, with a typical latency of under 30 min, while maintaining millimeter-level precision for deformation analysis.

3.4. GNSS and InSAR Deformation Field Extraction

GNSS observations can provide a three-dimensional deformation time series of the surface. In this study, a function fitting and vector synthesis method is used to extract the deformation field in the monitored area; the method is also applicable to the modeling of cumulative surface deformation sequences obtained from InSAR observations. The method is based on a physically meaningful functional model that combines different deformation signals and, ultimately, synthesizes a comprehensive vector deformation field from three directional components (east (E), north (N), and vertical (U)). In extracting the deformation signals, each directional component is modeled using the following equation:
y N / E / U ( t i ) = a + b t i + c sin ( 2 π t i ) + d cos ( 2 π t i ) + e sin ( 4 π t i ) + f cos ( 4 π t i )
where t represents the epoch time of daily coordinate solutions; a denotes the initial position at the reference epoch; b is the linear deformation rate; c and d are coefficients for the annual periodic term; and e and f are coefficients for the semi-annual periodic term. The parameters are estimated via least squares adjustment. After extracting the linear deformation rate ( b ) for each component (E, N, U), 3D vector synthesis is performed to derive the regional deformation field. It should be noted that the GNSS data in this paper is less than one year old, but the InSAR observations are more than 7 years old, so the coefficients c ,   d , e , f are set to 0 when estimating the deformation rate for less than a year.

4. Land Subsidence Results and Analysis in Xiong’an New Area

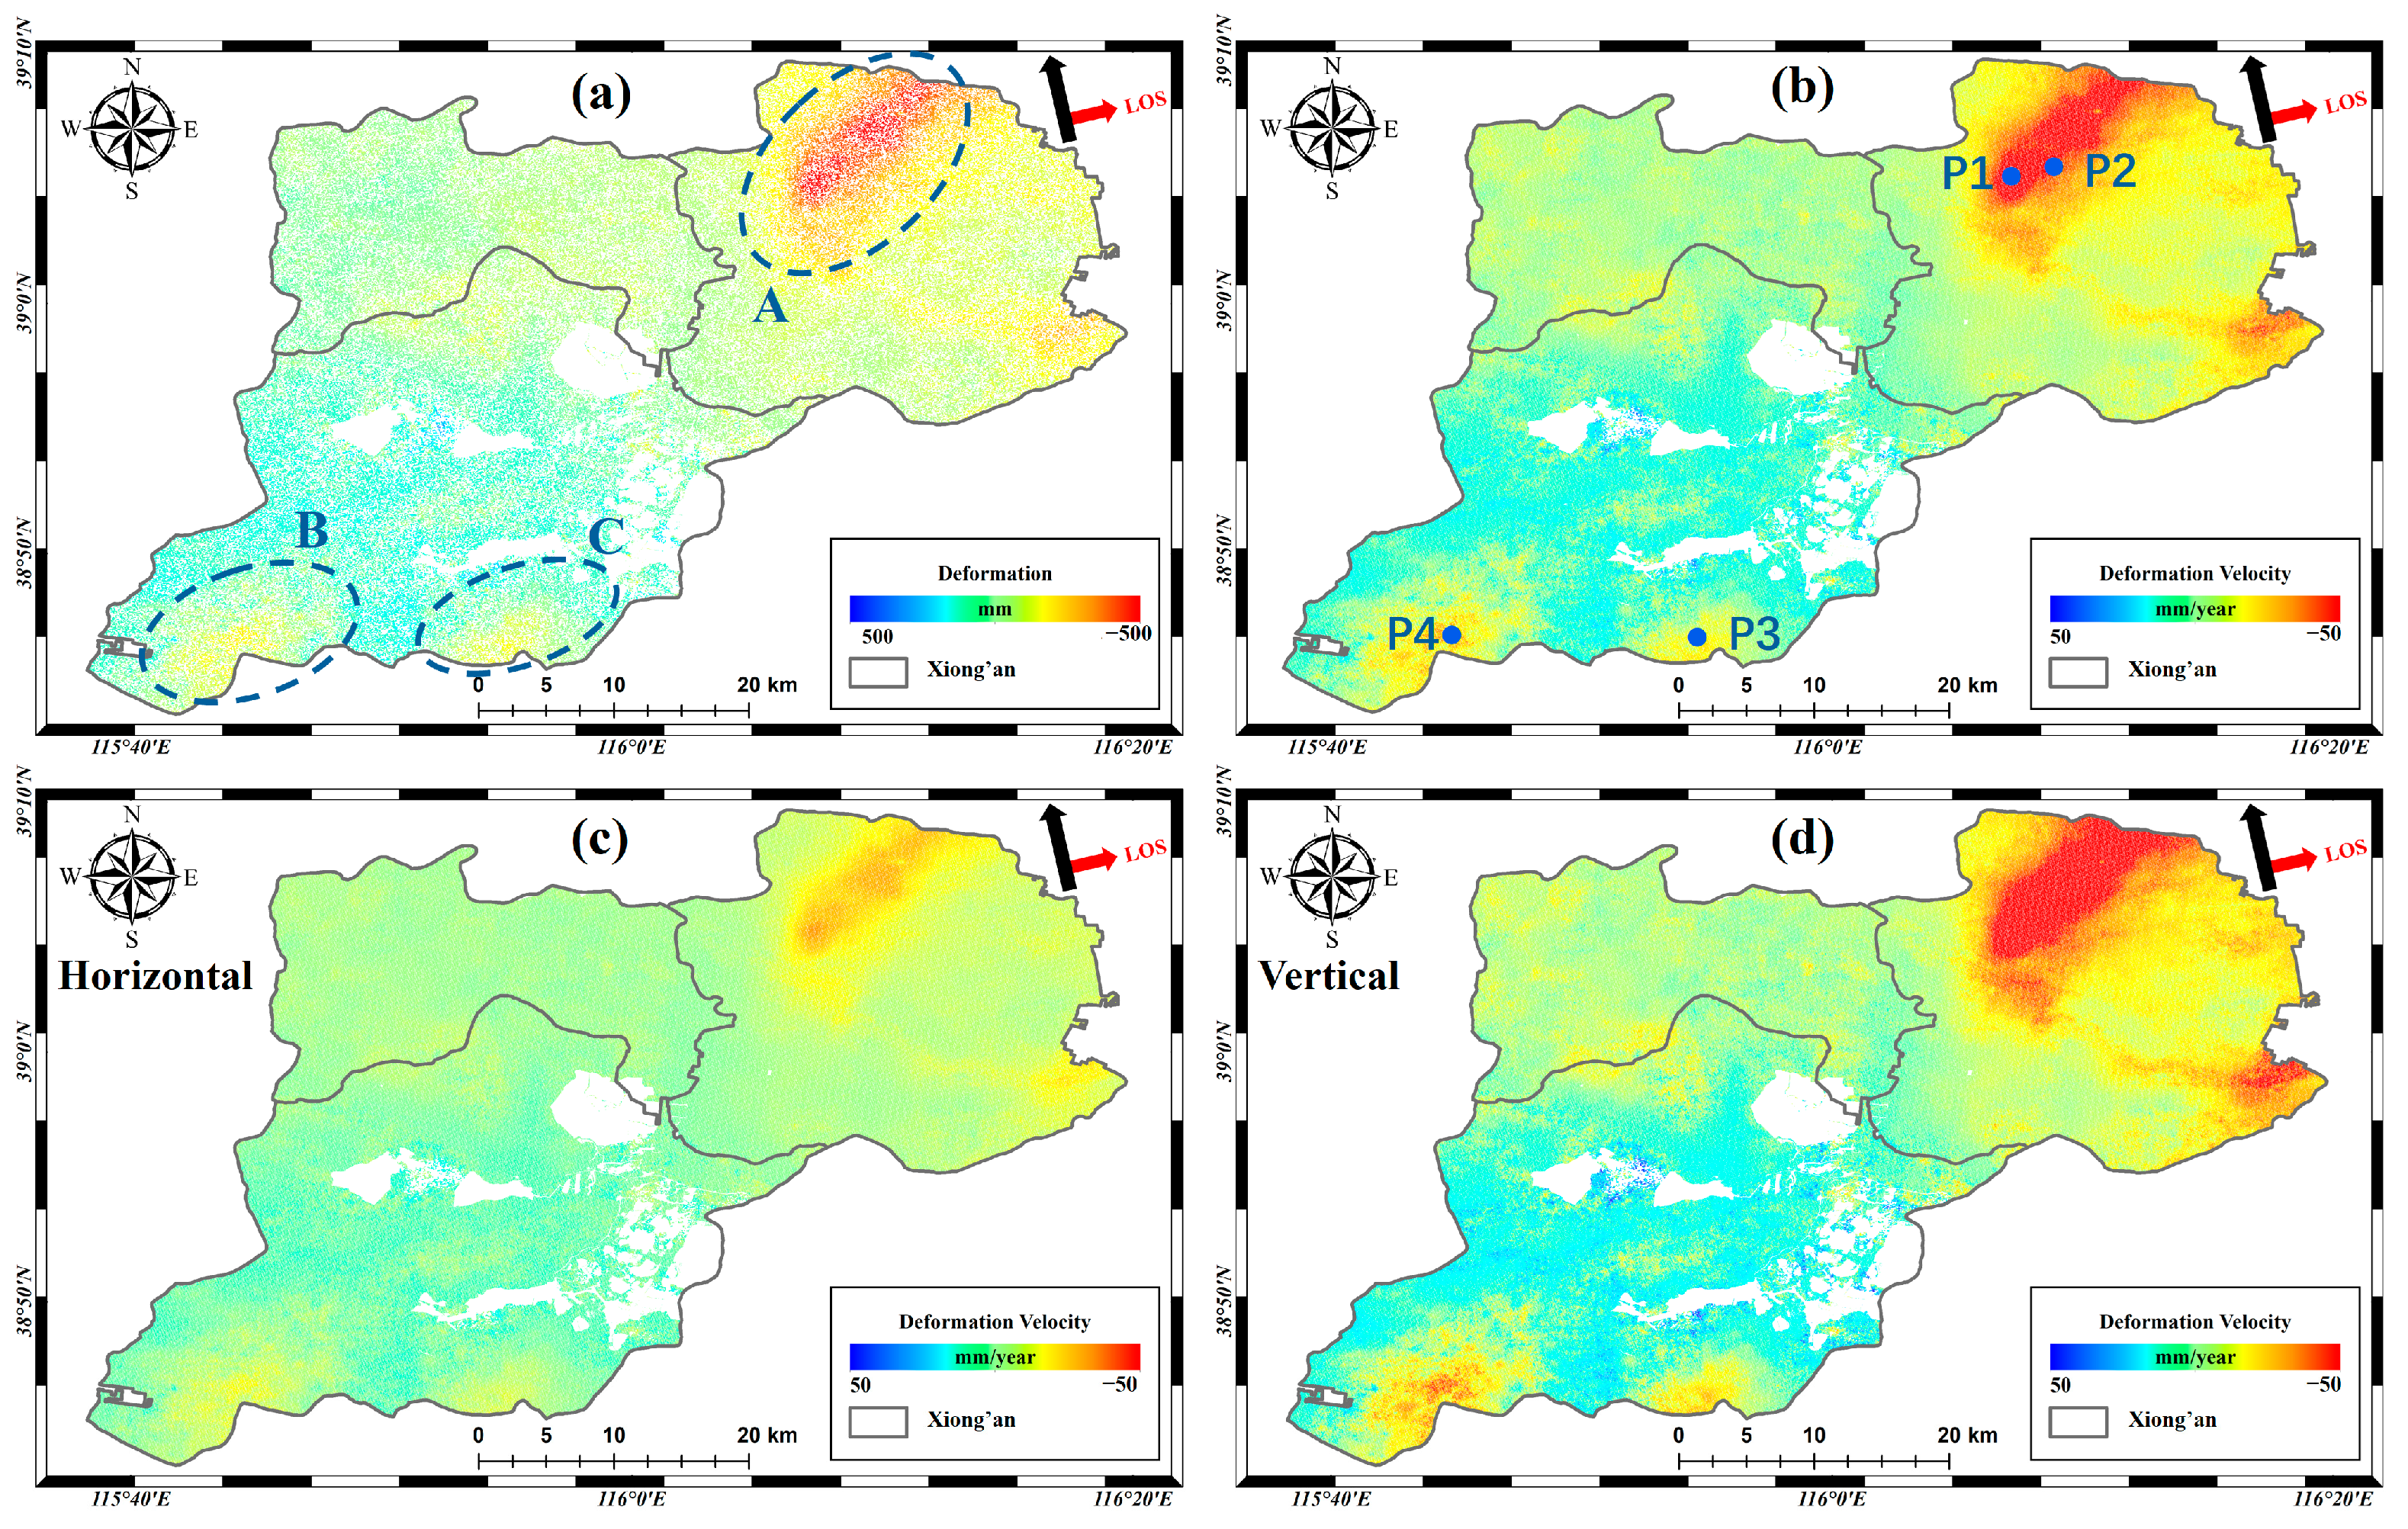
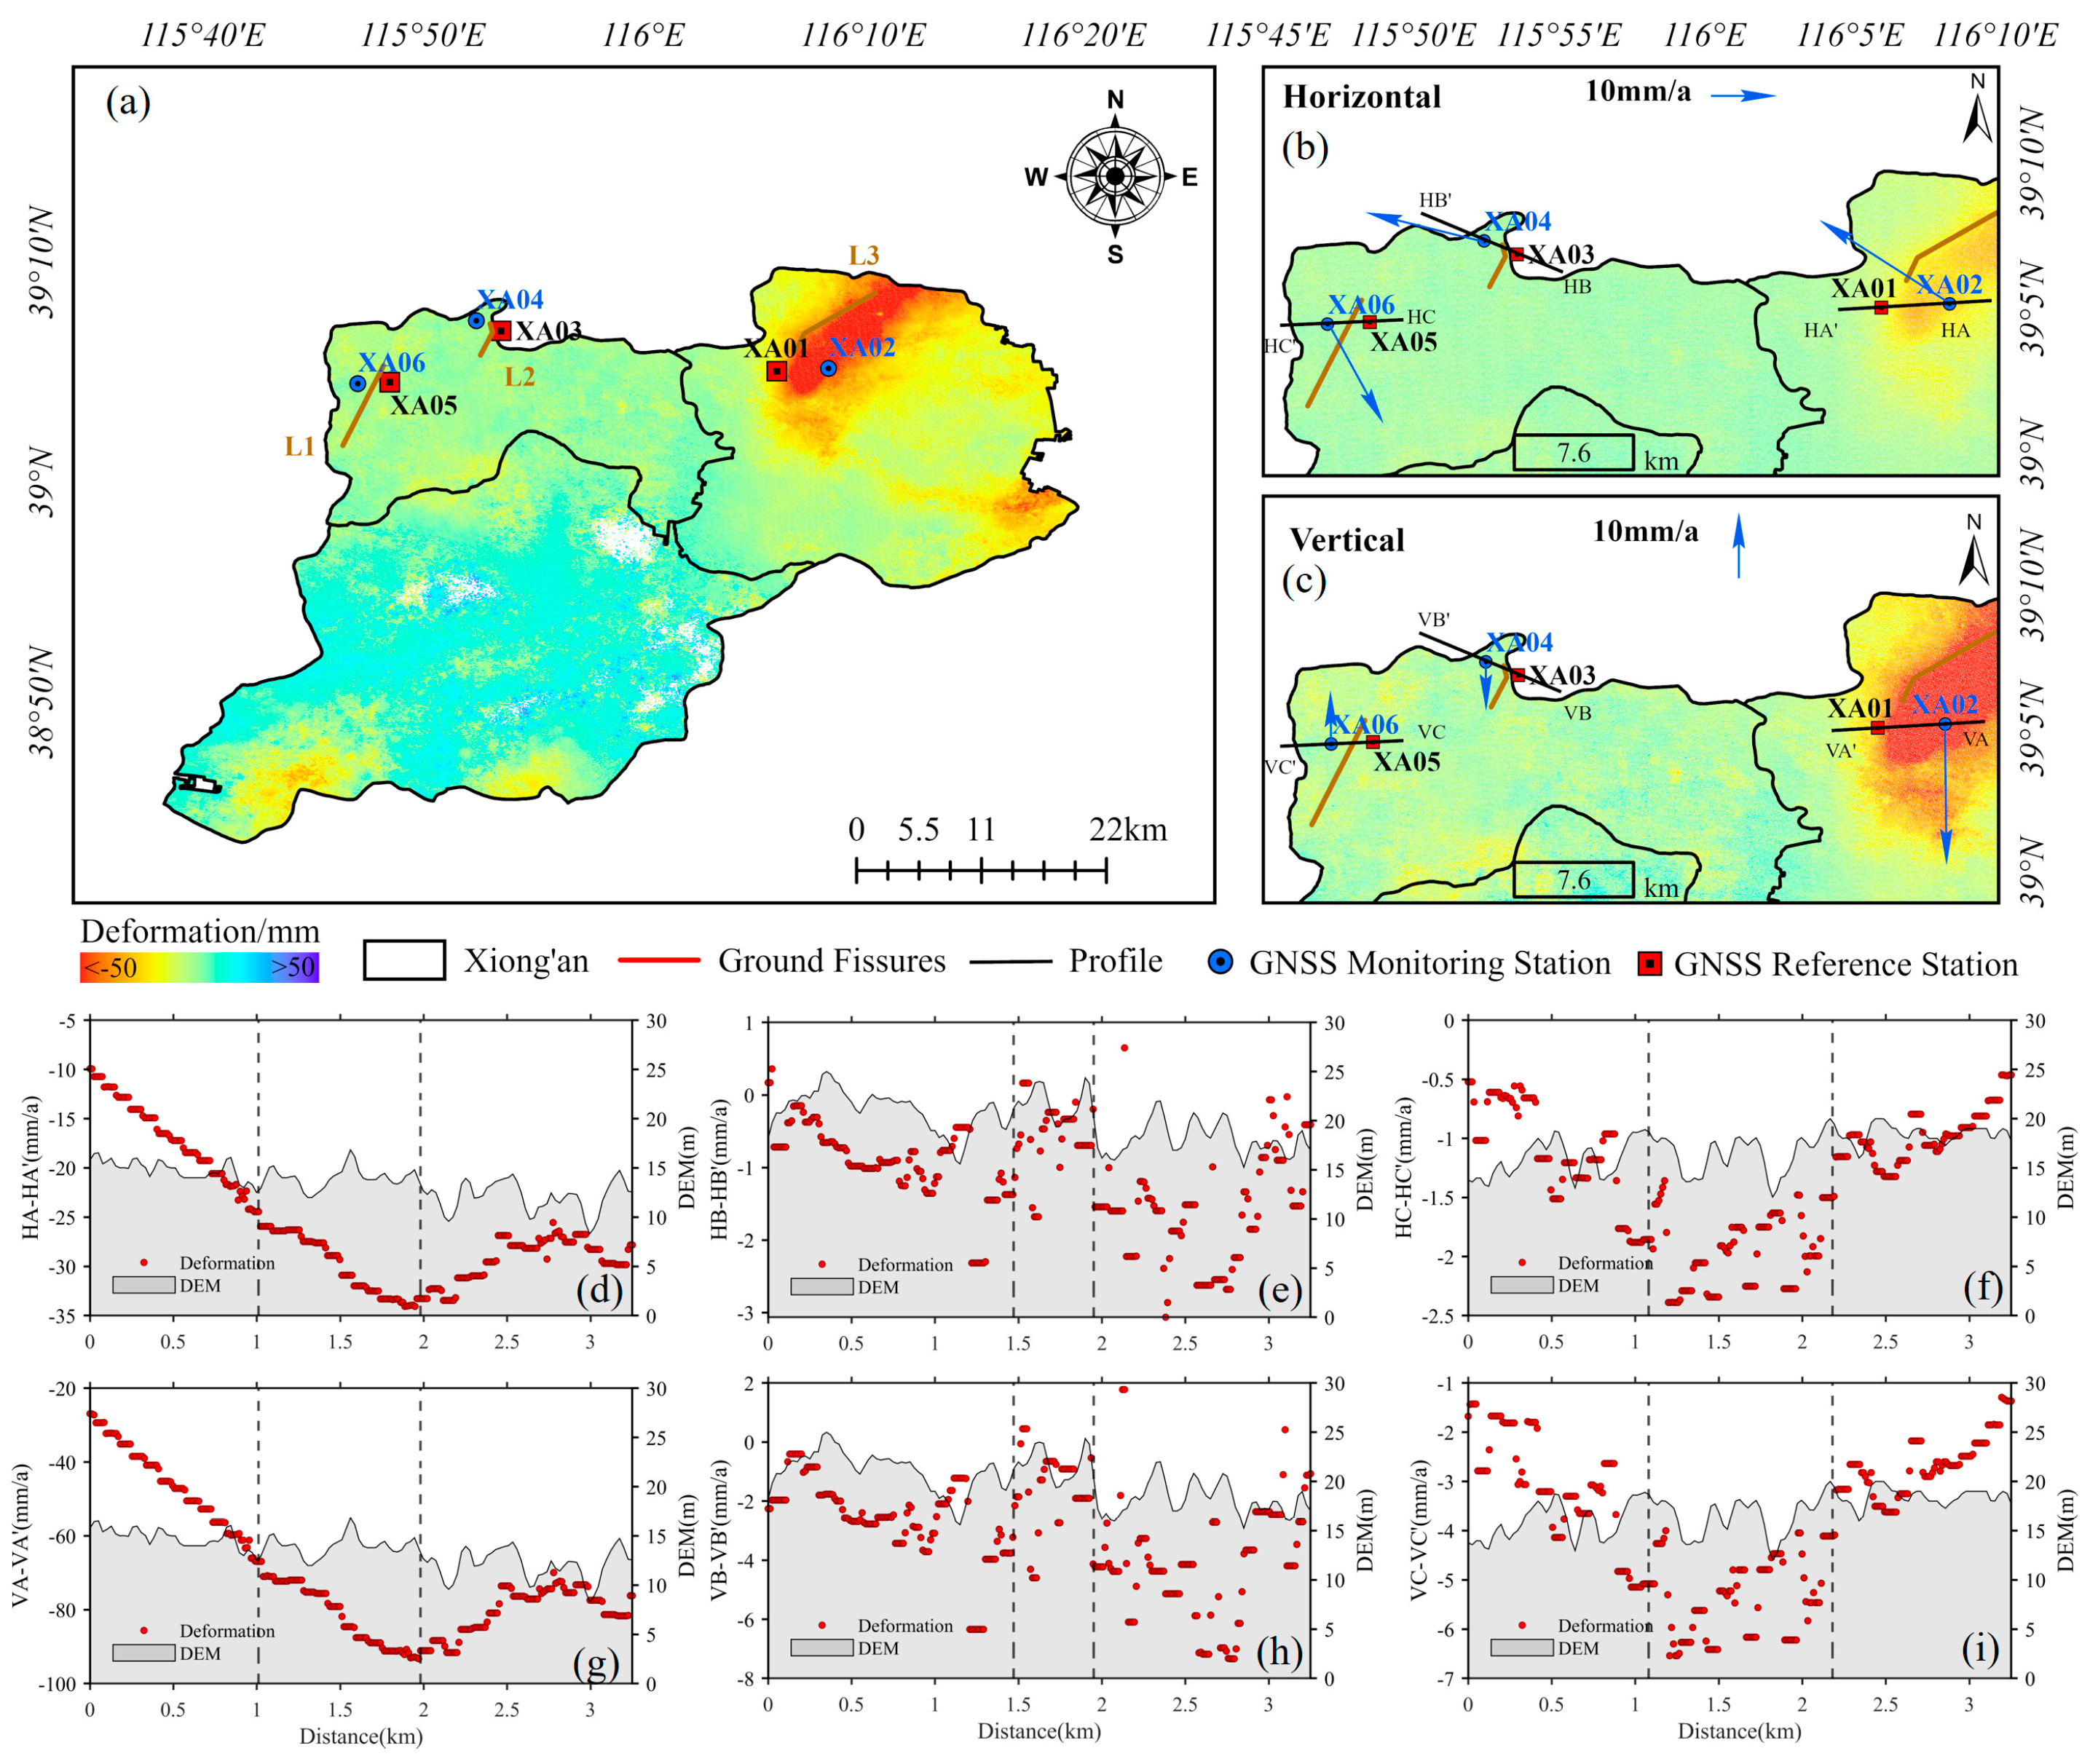
4.1. Spatiotemporal Distribution of Land Subsidence in Xiong’an New Area

Based on the SBAS-InSAR technique, a total of 125 Sentinel-1A images, acquired between May 2017 and March 2025, were processed to derive the ground deformation time series and the spatial distribution of the annual average deformation rates in the Xiong’an New Area, as shown in Figure 4. The cumulative deformation along the line-of-sight direction (Figure 4a) and the annual average deformation rate (Figure 4b) reveal three major subsidence zones within the XNA: North Xiongxian (A), Luzhuang Township (B), and Liulizhuang Town (C). Among these, North Xiongxian (A) exhibits the largest and most extensive subsidence. From May 2017 to March 2025, the maximum cumulative subsidence in this area reached 591 mm, with a peak annual average subsidence rate of 70 mm/year. The subsidence belt extends northeastward from Xiongxian County, following a southwest–northeast orientation. The most pronounced subsidence occurs between Daying Town and Dazhuang Village and significantly affects surrounding areas, such as Xiongzhou Town, Mijiawu Town, Beishakou Township, Zhugezhuang Township, and Zangang Town. In Anxin County, subsidence is primarily concentrated in the southern region, extending northward from Gaoyang County into Anxin County. Both Luzhuang Township (B) and Liulizhuang Town (C) are located within this subsidence zone. The maximum cumulative subsidence in Luzhuang Township (B) is 249 mm, with a peak annual subsidence rate of 43 mm/year, while Liulizhuang Town (C) exhibits a maximum cumulative subsidence of 221 mm and an annual average rate of 27 mm/year. These two subsidence areas are relatively limited in regard to spatial extent and exert minimal impact on the rest of Anxin County. In contrast, subsidence rates in Rongcheng County are generally low, not exceeding 15 mm/year. To further investigate the two-dimensional deformation characteristics of the surface in the Xiong’an New Area, the annual average deformation rate along the LOS direction is extrapolated into a vertical component based on the incidence angle at the moment of radar image imaging (Figure 4d), and is simultaneously decomposed into an east–west component in combination with the azimuth (Figure 4c). The spatial distribution of the 2D velocity components indicates that the ground deformation in this region is dominated by vertical movement, with a maximum annual vertical deformation rate of up to 91 mm/year. The east–west deformation component is comparatively smaller, with a peak annual rate of approximately 33 mm/year.
To analyze the spatiotemporal evolution characteristics of land subsidence in the Xiong’an New Area, this study utilized the deformation time series derived from SBAS-InSAR to generate annual cumulative ground deformation maps from 2017 to 2025 (Figure 5a–i). Additionally, to examine the subsidence trends in three key areas, namely North Xiongxian (A), Luzhuang Township (B), and Liulizhuang Town (C), the cumulative deformation time series were extracted for four representative points: P1, P2, P3, and P4. To further investigate the long-term periodic deformation behavior, the time series of these points were fitted using Equation (6), and the results were analyzed in conjunction with contemporaneous rainfall data (Figure 5j–m). The results indicate that from 2017 to 2025, the subsidence rates in North Xiongxian (A) and Liulizhuang Town (C) showed a general downward trend, suggesting that ground subsidence in these regions has been partially mitigated. Specifically, the annual cumulative subsidence at points P1 and P2 in North Xiongxian (A) gradually decreased from 103 mm in 2017 to 45 mm in 2024. At point P3 in Liulizhuang Town (C), significant subsidence occurred mainly during 2017–2019 and in 2023, while subsidence in other years was minimal and the surface remained relatively stable. In contrast, ground subsidence in Luzhuang Township (B) has not been effectively suppressed. The annual cumulative subsidence at point P4 remained consistently around 40 mm throughout the monitoring period, with no significant downward trend observed. In terms of temporal variation, the subsidence rate in North Xiongxian (A) did not exhibit a strong correlation with time and appeared to be less affected by external factors, such as seasonal changes or rainfall. However, both Luzhuang Township (B) and Liulizhuang Town (C) showed similar subsidence patterns, characterized by undulating subsidence over time, albeit with different magnitudes. Moreover, the ground deformation in these two areas was highly correlated with seasonal variations, particularly during the summer rainy season, when more intense subsidence events were often followed by partial rebound. This phenomenon is likely related to the widespread distribution of cultivated land and the strong dependence of groundwater resources on seasonal rainfall in Anxin County, which renders ground deformation highly sensitive to seasonal changes.
To verify the reliability of the results presented in this study, a comparative analysis was conducted with the ground subsidence findings obtained from other satellite data sources during different time periods reported in relevant literature [29,30,31,39]. The comparison indicates that the subsidence patterns found in this study are largely consistent with the deformation trends identified in previous research. Specifically, all the studies confirm significant ground subsidence occurring in the northern part of Xiongxian and the southern region of Anxin County, while the subsidence magnitude in Rongcheng County remains relatively minor. This consistency indirectly corroborates the credibility and reliability of the results obtained herein. However, InSAR technology has limitations, such as low sensitivity to horizontal north–south displacements and susceptibility to atmospheric effects and human activities on the land surface. Therefore, in this paper, the deformation in the north–south direction observed by the InSAR is not considered, and the use of the GNSS as a supplement can be used to construct a monitoring framework for better three-dimensional spatial characterization of the key settlement areas.

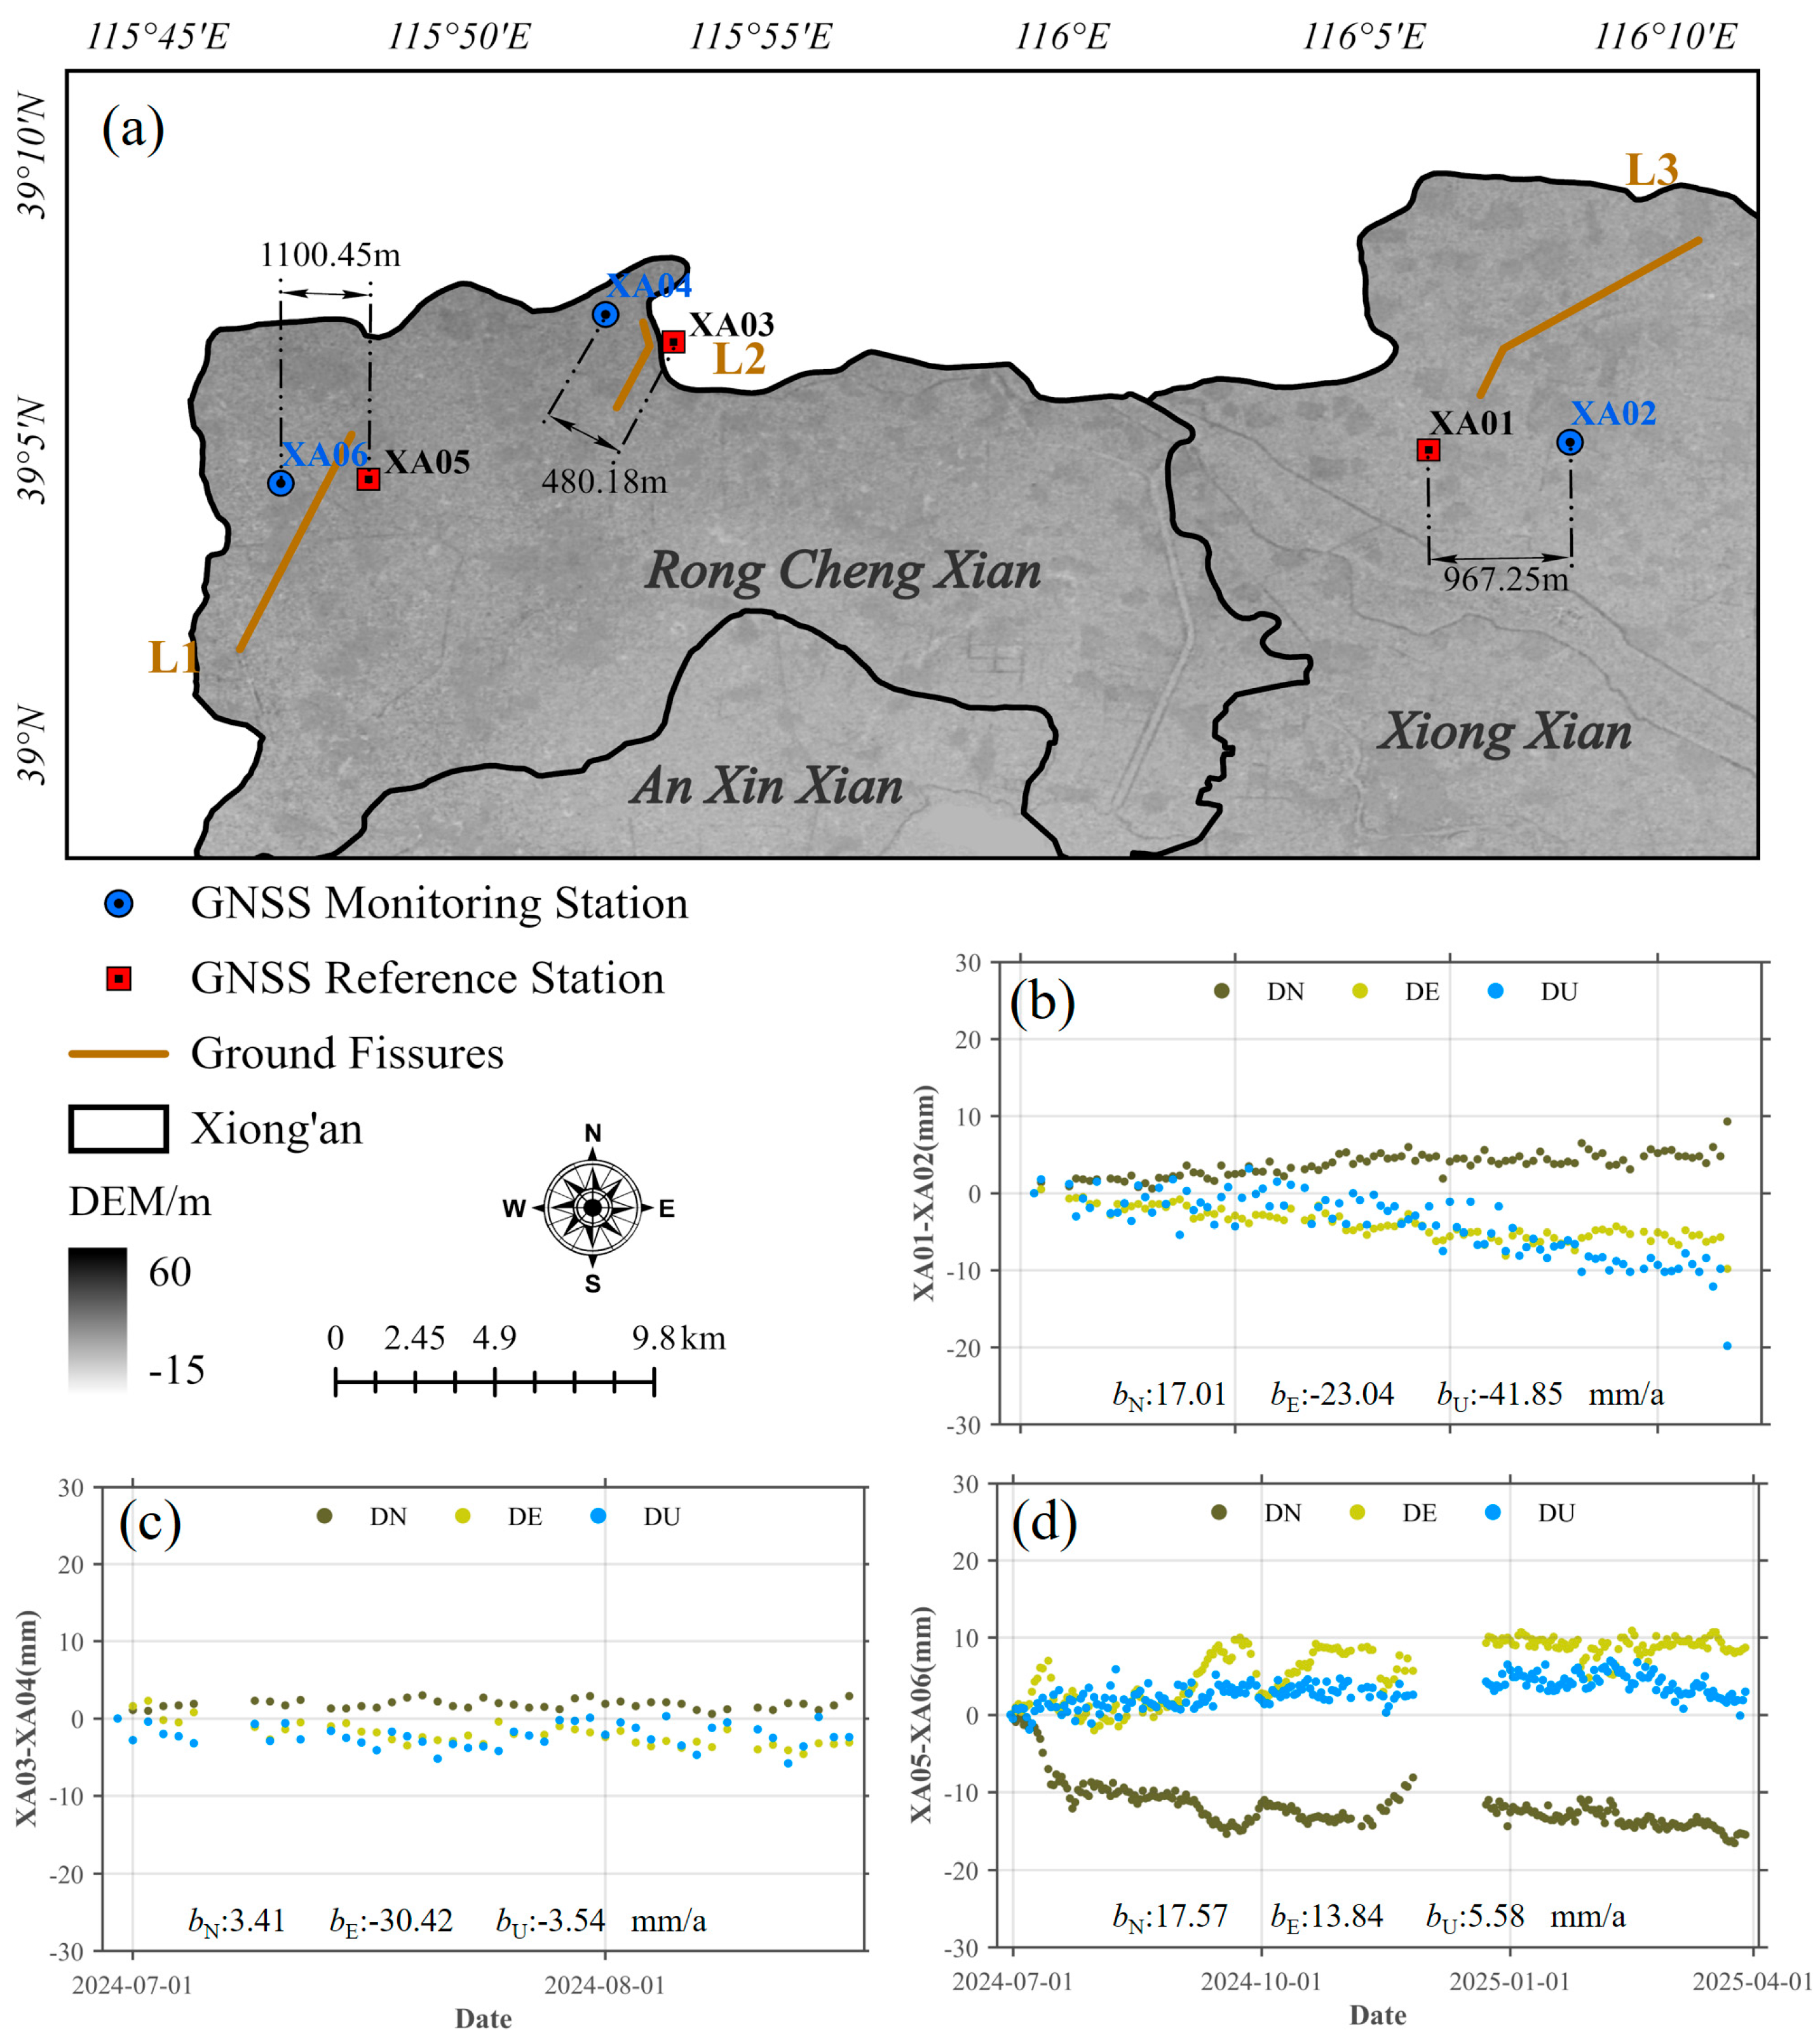
4.2. Ground Fissure Deformation Spatial Characterization Analysis

Field investigations reveal that ground fissures in the study area are predominantly distributed across three zones: (1) Daying Town, Zhugezhuang Township, and Xiongzhou Town in Xiong County; and (2) the surrounding areas centered on Nanzhang Town, Dahe Town, and Jiaguang Township in Rongcheng County. These fissures manifest as irregular circular/elliptical collapse pits or linear subsidence belts, with significant scale variations. While exhibiting diverse local orientations, they dominantly align along a north–south strike direction. To characterize deformation patterns across fissure zones, we deployed paired GNSS stations (XA01-XA06) on both eastern and western sides of three representative fissures: XA01/XA02 in Daying Town, XA03/XA04 in Jiaguang Township, and XA05/XA06 in Nanzhang Town (Figure 6a). For the spatial analysis, XA01, XA03, and XA05 were designated as reference stations to form three baselines with their adjacent counterparts (XA02, XA04, XA06), spanning 480.8 m (shortest) to 1100.45 m (longest). This short baseline configuration (<1.5 km) ensures optimal observation sensitivity to localized differential movements.
The three-dimensional relative deformation time series obtained from the point-pair processing strategy are presented in Figure 6. In regard to the horizontal component, the baseline XA01-XA02 exhibits opposing movement characteristics, with displacement rates of +17.01 mm/yr (XA01 direction) and −23.03 mm/yr (XA02 direction), demonstrating significant convergent motion (Figure 6b). The XA03-XA04 baseline shows distinct divergent movement, with rates of +3.41 mm/yr and −30.42 mm/yr at its two ends (Figure 6c), while the XA05-XA06 baseline displays rates of −17.57 mm/yr and +13.84 mm/yr, suggesting strong horizontal shear or compression (Figure 6d). Notably, the relative baseline changes in regard to both north (DN) and east (DE) components exhibit considerable fluctuations, for instance, between 1 September and 1 October 2024, the relative motion first accelerated, then decelerated, followed by renewed acceleration after 1 October. These fluctuations primarily result from inconsistent movement rates and potential uplift components. In regard to the vertical dimension, the three baselines show markedly different behaviors: XA01-XA02 subsides at −41.86 mm/yr, indicating pronounced ground settlement; XA03-XA04 shows minor subsidence at −3.54 mm/yr; while XA05-XA06 demonstrates uplift at +5.58 mm/yr. These results reveal significant spatial variability in the three-dimensional deformation characteristics across different fissure segments, reflecting regional differences in regard to both the intensity of fissure activity and the underlying deformation mechanisms.
Figure 7a shows the LOS deformation rate distribution based on the InSAR up-orbit data, Figure 7b,c shows the GNSS 3D deformation fields extracted based on Equations (4) and (5), Figure 7d–f shows the results of the horizontally oriented deformation rate profiles on both sides of the ground crack, and Figure 7g–i shows the results of the vertically oriented deformation rate profiles on both sides of the ground crack. Figure 7a shows that there are surface inhomogeneous deformations with different deformation rates in the monitoring area, among which, the northern part of Xiongxian County is the key subsidence area, with the maximum deformation rate in the LOS direction reaching −72.33 mm/a, and the rest of the area is not characterized by significant surface deformations and displays inhomogeneous subsidence. Figure 7b,c shows that the baselines of different ground fracture regions exhibit significant differences in terms of their 3D deformation. The dashed lines in Figure 7d–i indicate the locations of the GNSS monitoring stations, and the middle of the dashed lines indicate the ground crack regions. The overall deformation results show that the deformation rate in the horizontal direction of the XNA is significantly smaller than that in the vertical direction.
Specifically, Figure 7b illustrates that for XA01 (reference) and XA02, there is a tendency for the two points to move in step with each other in the horizontal direction, and, in the vertical direction, XA02 exhibits an obvious subsidence tendency relative to XA01. As of November 11, 2024, the accumulated relative horizontal displacement in this area reaches 9.8 mm and the relative vertical displacement reaches 19.8 mm. This characteristic is consistent with typical ground subsidence processes: the larger the subsidence rate is, the more significant the horizontal motion usually is. For XA03 (reference) and XA04, in the horizontal direction, the two points show a movement away from each other, and there is a subsidence trend in the vertical direction. As of August 17, 2024, the cumulative relative horizontal displacements in this area amounted to 3.1 mm and the relative vertical displacements were 2.4 mm (Figure 7c). It is worth noting that the subsidence of XA04 is significantly smaller than the aforementioned baseline solution (Figure 7b), which is mainly due to the fact that XA03 itself has a subsidence trend, which is partially canceled out in regard to the pair of points. For XA05 (reference) and XA06, the two points show a tendency to approach each other in the horizontal direction and, what is more special, is that in the vertical direction, XA06 shows a lifting tendency with respect to XA05, and as of March 30, 2025, the cumulative relative horizontal displacement reaches 17.8 mm, and the relative vertical displacement is 3.0 mm (Figure 7d). Combined with Figure 7f,i, it can be seen that since the subsidence rate of XA05 is larger than that of XA06, the motion trend is partially canceled out and, thus, the relative displacement shows the phenomenon of “lifting”.
From the GNSS point baseline results and deformation field distribution, it can be seen that there is a certain degree of differential deformation on both sides of the three geocracks. In order to analyze the activity characteristics of the ground cracks more closely, the results of the projections of the deformation rates in the horizontal and vertical directions in the InSAR line-of-sight (LOS) direction, as well as the profile analysis, were further combined to carry out a comprehensive study. The difference between the relative deformation rates of the GNSS and InSAR at the profile line is presented statistically in Table 2. Where HA-HA′, HB-HB′, and HC-HC′ are used to denote the profiles of the relative phase transition rates in the east–west direction, and VA-VA′, VB-VB′, and VC-VC′ are used to denote the profiles of the relative deformation rates in the vertical direction. The results show that in the vertical direction, the surface deformation characteristics on both sides of the profile line are more consistent with the GNSS observations; however, in the horizontal direction, there is a large difference between the two.
To further investigate the causes of the observed discrepancies, we conducted a detailed analysis of the spatial relationship between the GNSS stations and surface fissures. All our monitoring stations are located on opposite sides of the observed ground cracks, suggesting that the geometric configuration between the reference and monitoring points may influence the deformation results. However, this factor alone cannot fully account for the significant differences observed between the InSAR and GNSS measurements along the horizontal profile. Our analysis indicates that the discrepancies are primarily attributable to two key factors: (1) The GNSS observation period is relatively short (less than one year). During this time, local tectonic activity or surface disturbances may result in GNSS measurements reflecting more localized deformation patterns. (2) The InSAR measures displacement along the radar line-of-sight (LOS) direction. When data from a single satellite track are used, the deformation is effectively captured in only one dimension. Since the radar LOS is typically oblique to the ground surface, the technique has limited sensitivity to horizontal deformation components, especially in the north–south direction.
When the surface deformation is dominated by east–west horizontal displacement and the track direction is nearly perpendicular to the horizontal direction, the horizontal displacement component captured by InSAR in the LOS direction is small, which leads to an obvious deviation between the inversion results and the actual horizontal displacement (Table 3). Therefore, we believe that the insufficient response of single-track InSAR data to horizontal deformation features is the main reason for the large difference between the GNSS and InSAR measurements in the horizontal direction.
In summary, the three-dimensional deformation characteristics of the cracked area can be summarized as follows: (1) there are different degrees of subsidence on both sides of the three cracks; and (2) the three cracks are in a state of expansion, with the first and the second cracks pointing in the same direction to the north–west, and the third crack expanding to the south–east. The synergistic effect of ground crack expansion and ground subsidence will further exacerbate the risk of infrastructure damage in the region. Therefore, it is important to continuously monitor the geocrack activities in the Xiong’an New Area.

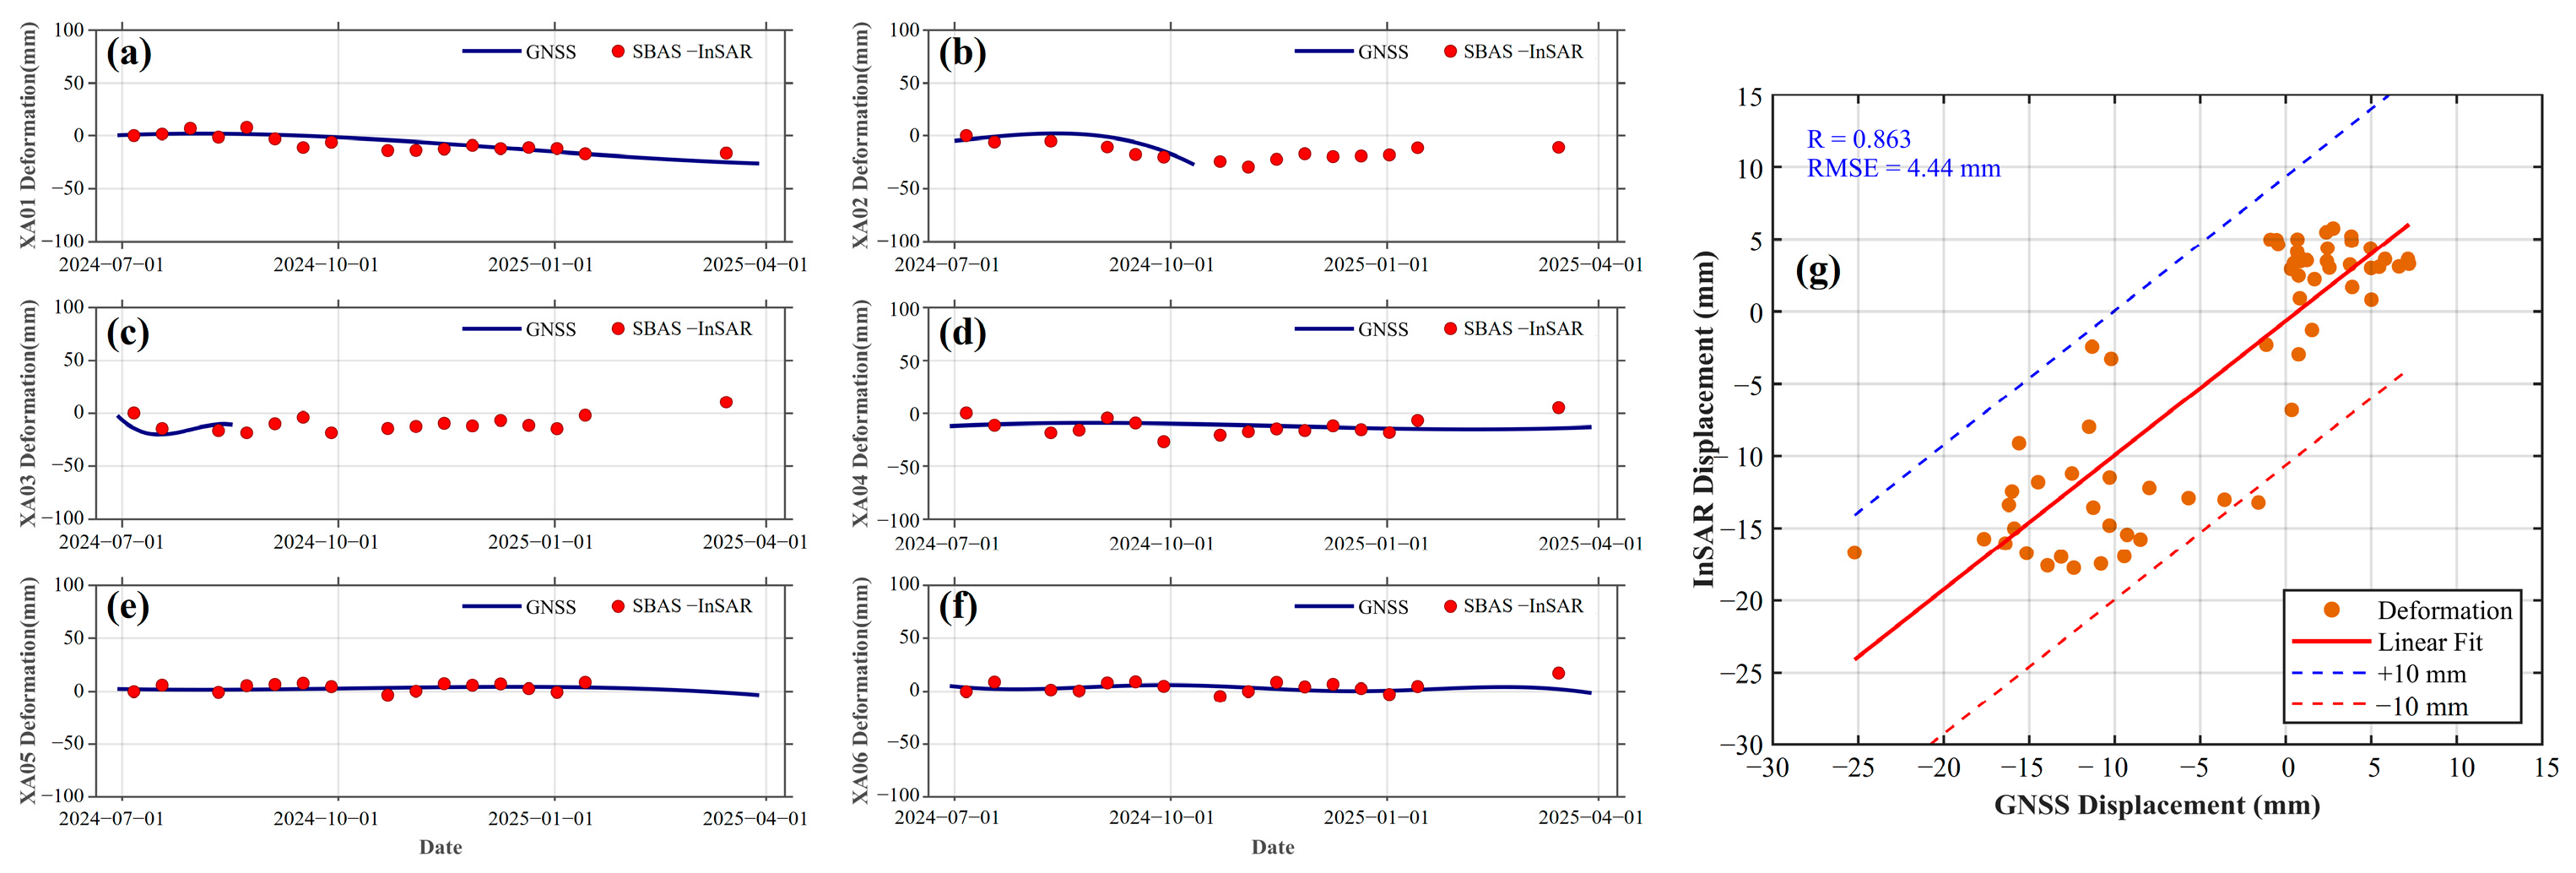
4.3. Validation of Accuracy

To verify the reliability and accuracy of the InSAR-derived deformation results, this study conducted an accuracy assessment using the deformation measurements obtained from the GNSS monitoring stations. Since InSAR only captures one-dimensional deformation along the line of sight, the three-dimensional deformation vectors provided by GNSS must be projected in the InSAR LOS direction prior to the comparison. The transformation relationship is expressed as follows:
d l o s = sin θ cos α 3 2 π s i n θ sin α 3 2 π c o s θ d N d E d U
where d l o s represents the deformation along the line-of-sight direction; θ is the incidence angle of the Sentinel-1A satellite (39.14°) and α denotes the angle between the satellite’s flight direction and true north (76.69°); d N , d E , and d U represent the GNSS-derived displacements in the north–south, east–west, and vertical directions, respectively. After the projection transformation, the resulting GNSS LOS-direction deformation time series was compared with the InSAR-derived results (Figure 8a–f).
There are three common approaches for comparing GNSS measurements with InSAR deformation results: point-to-point validation, point-to-area validation, and point-to-line validation. In this study, the point-to-point method is employed for the accuracy assessment. Specifically, the InSAR-derived deformation results at the GNSS station locations over the same time period were extracted for comparison. A correlation analysis and Root Mean Square Error (RMSE) calculation were conducted (Figure 8g). The analysis shows that the absolute differences between the InSAR and GNSS results are generally within 10 mm, with an RMSE of 4.44 mm, indicating good agreement between the two. The Pearson correlation coefficient (R) reaches 0.86, suggesting a strong linear relationship between the InSAR and GNSS measurements.

5. Discussion

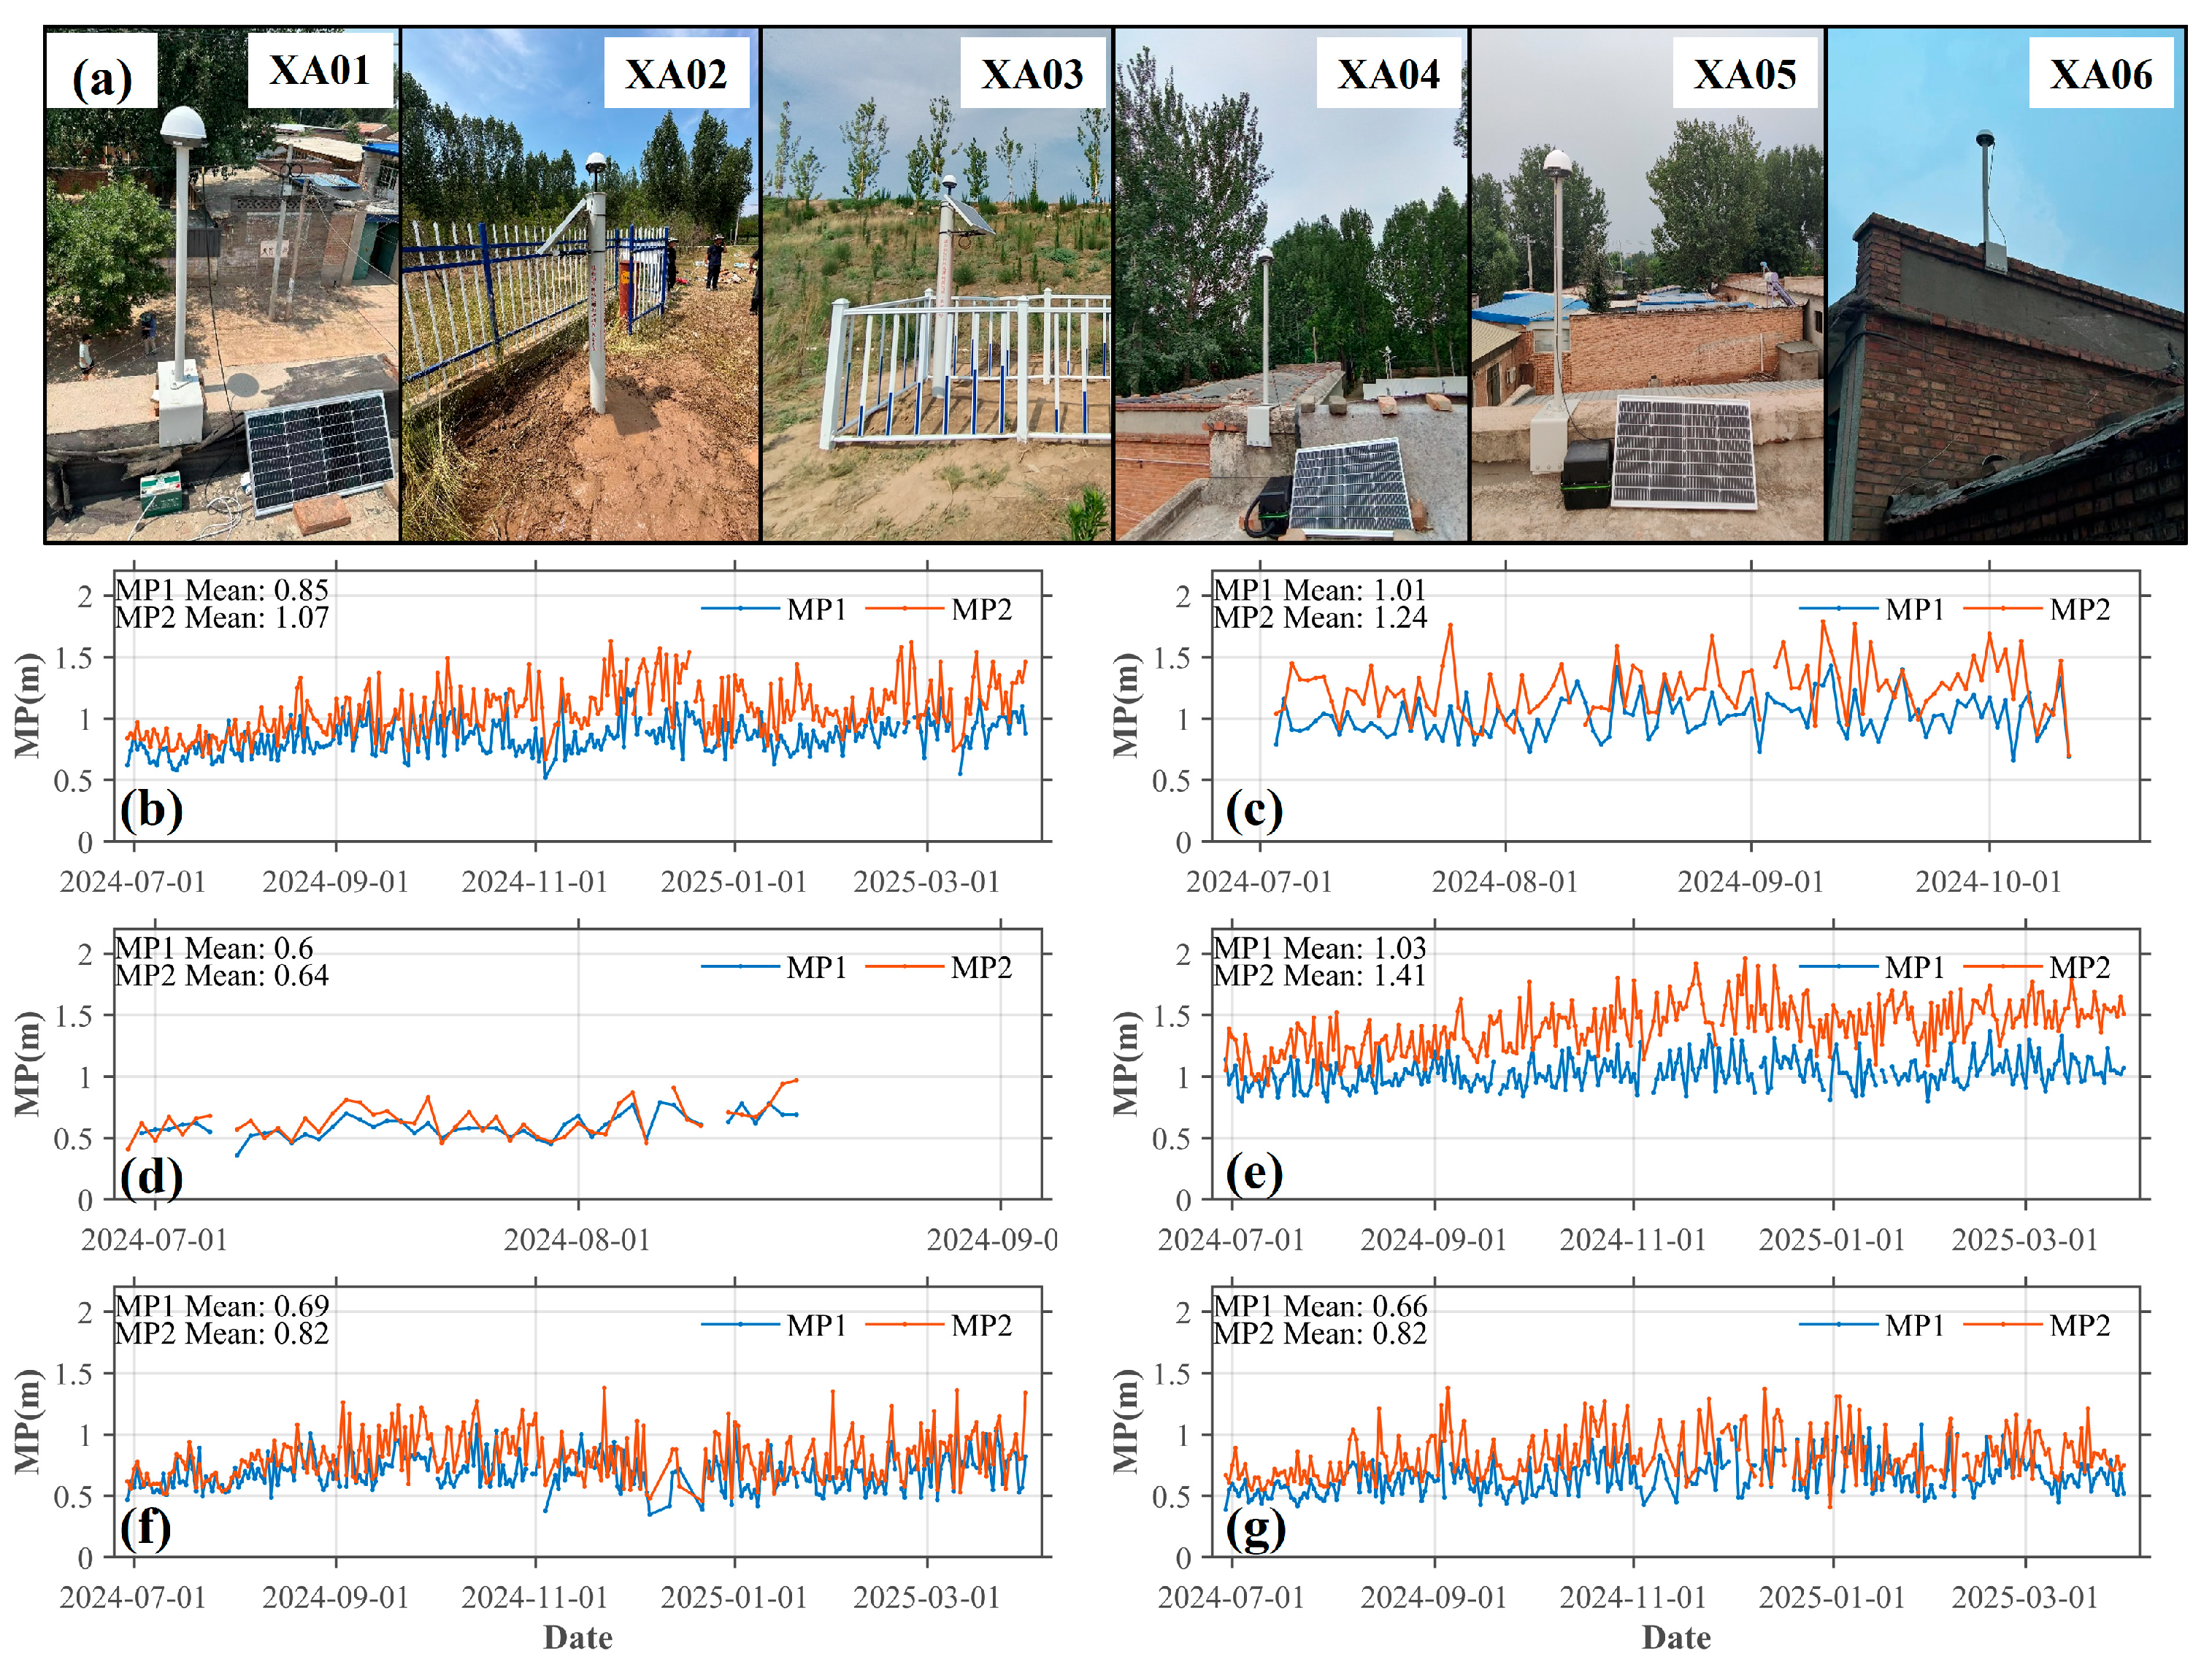
5.1. Variation in Data Quality of GNSS Stations in Different Deployment Scenarios

The GNSS data quality is highly dependent on the surrounding observation environment. Figure 9 shows the results of the multipath (MP) effect assessment in regard to the quality check of the GNSS observation data, covering the time-series characteristics of MP1 and MP2 (corresponding to the L1 and L2 bands, respectively) for the period of July 2024–April 2025 for the six stations, XA01-XA06, which are shown in Figure 9a, reflecting the significant differences in the GNSS signal reflections from different stations. Combined with the site environment, Figure 9 shows that there are significant differences in the multipath effects of different stations, reflecting the influence of their observation environments on the reflection of the GNSS signals: there is a clear contrast between ground-based stations XA02 and XA03 and, despite being related to the same ground-based station, XA02 has a significantly higher mean MP value (MP2 up to 1.24 m), which is mainly because of the more reflective sources in its vicinity and the taller trees that cover it, severely, while the error of XA03 is significantly higher. The error mean value of XA03 is only about 0.6 m, which is mainly due to its more open environment, although it is not a ground station, but there is no tree shading around it. It is worth noting that the XA04 station deployed on the roof of the building shows the most serious multipath interference, with an average MP2 value as high as 1.41 m. Based on our field investigation, we found that the building where station XA04 is installed had a metal structure with a steel roof underneath, less than 5 m from the GNSS antenna. In contrast, the surroundings of the other three GNSS stations did not contain any significant metal structures. Therefore, we hypothesized that the nearby steel structure was likely the primary cause of the significant multipath errors observed at station XA04. In contrast, the mean values of XA05 and XA06 errors are at a medium level, thus the observation environment is relatively good.
Overall, the MP2 errors are generally higher than MP1, consistent with the characteristics of lower L2 signal power and greater sensitivity to reflections. The mean MP errors range from 0.6 m to 1.4 m, indicating that multipath effects have a non-negligible impact on the quality of GNSS data in different environments. For this study, the ground-delivered GNSS sites are more susceptible to multipath effects and occlusion interference, which cause satellite signal quality degradation and affect the deformation solution accuracy. In contrast, the top of a building usually has a wide field of view and superior observation conditions, with less signal occlusion and a high signal-to-noise ratio, which is conducive to obtaining more stable and continuous deformation sequences, but it is also necessary to avoid a large number of strong reflectors, such as metal structures.
In addition, the structural stability of the building itself, in terms of the impact on the roof used for the GNSS station deployment, also needs to be fully considered. In general, a modern building with a solid structure, good foundation, and no significant signs of settlement or tilting is selected as the monitoring platform, which can effectively reduce the non-true deformation signals introduced by structural disturbances related to the building. In this study, the building on which the rooftop site was used meets the requirements of stable monitoring in terms of structural safety and the degree of construction disturbance, which guarantees the long-term consistency and credibility of the observation data. InSAR data may be affected by coherence degradation, de-entanglement error, or spatial filtering in some areas, which leads to an insensitive response to local small deformations, and then causes a deviation from GNSS data. The deviation from GNSS data is caused by these differences. Such differences are more prominent in areas with active crack development or complex geological conditions. On the contrary, the GNSS has higher deformation detection sensitivity in these areas, which is an important complement to the InSAR results.

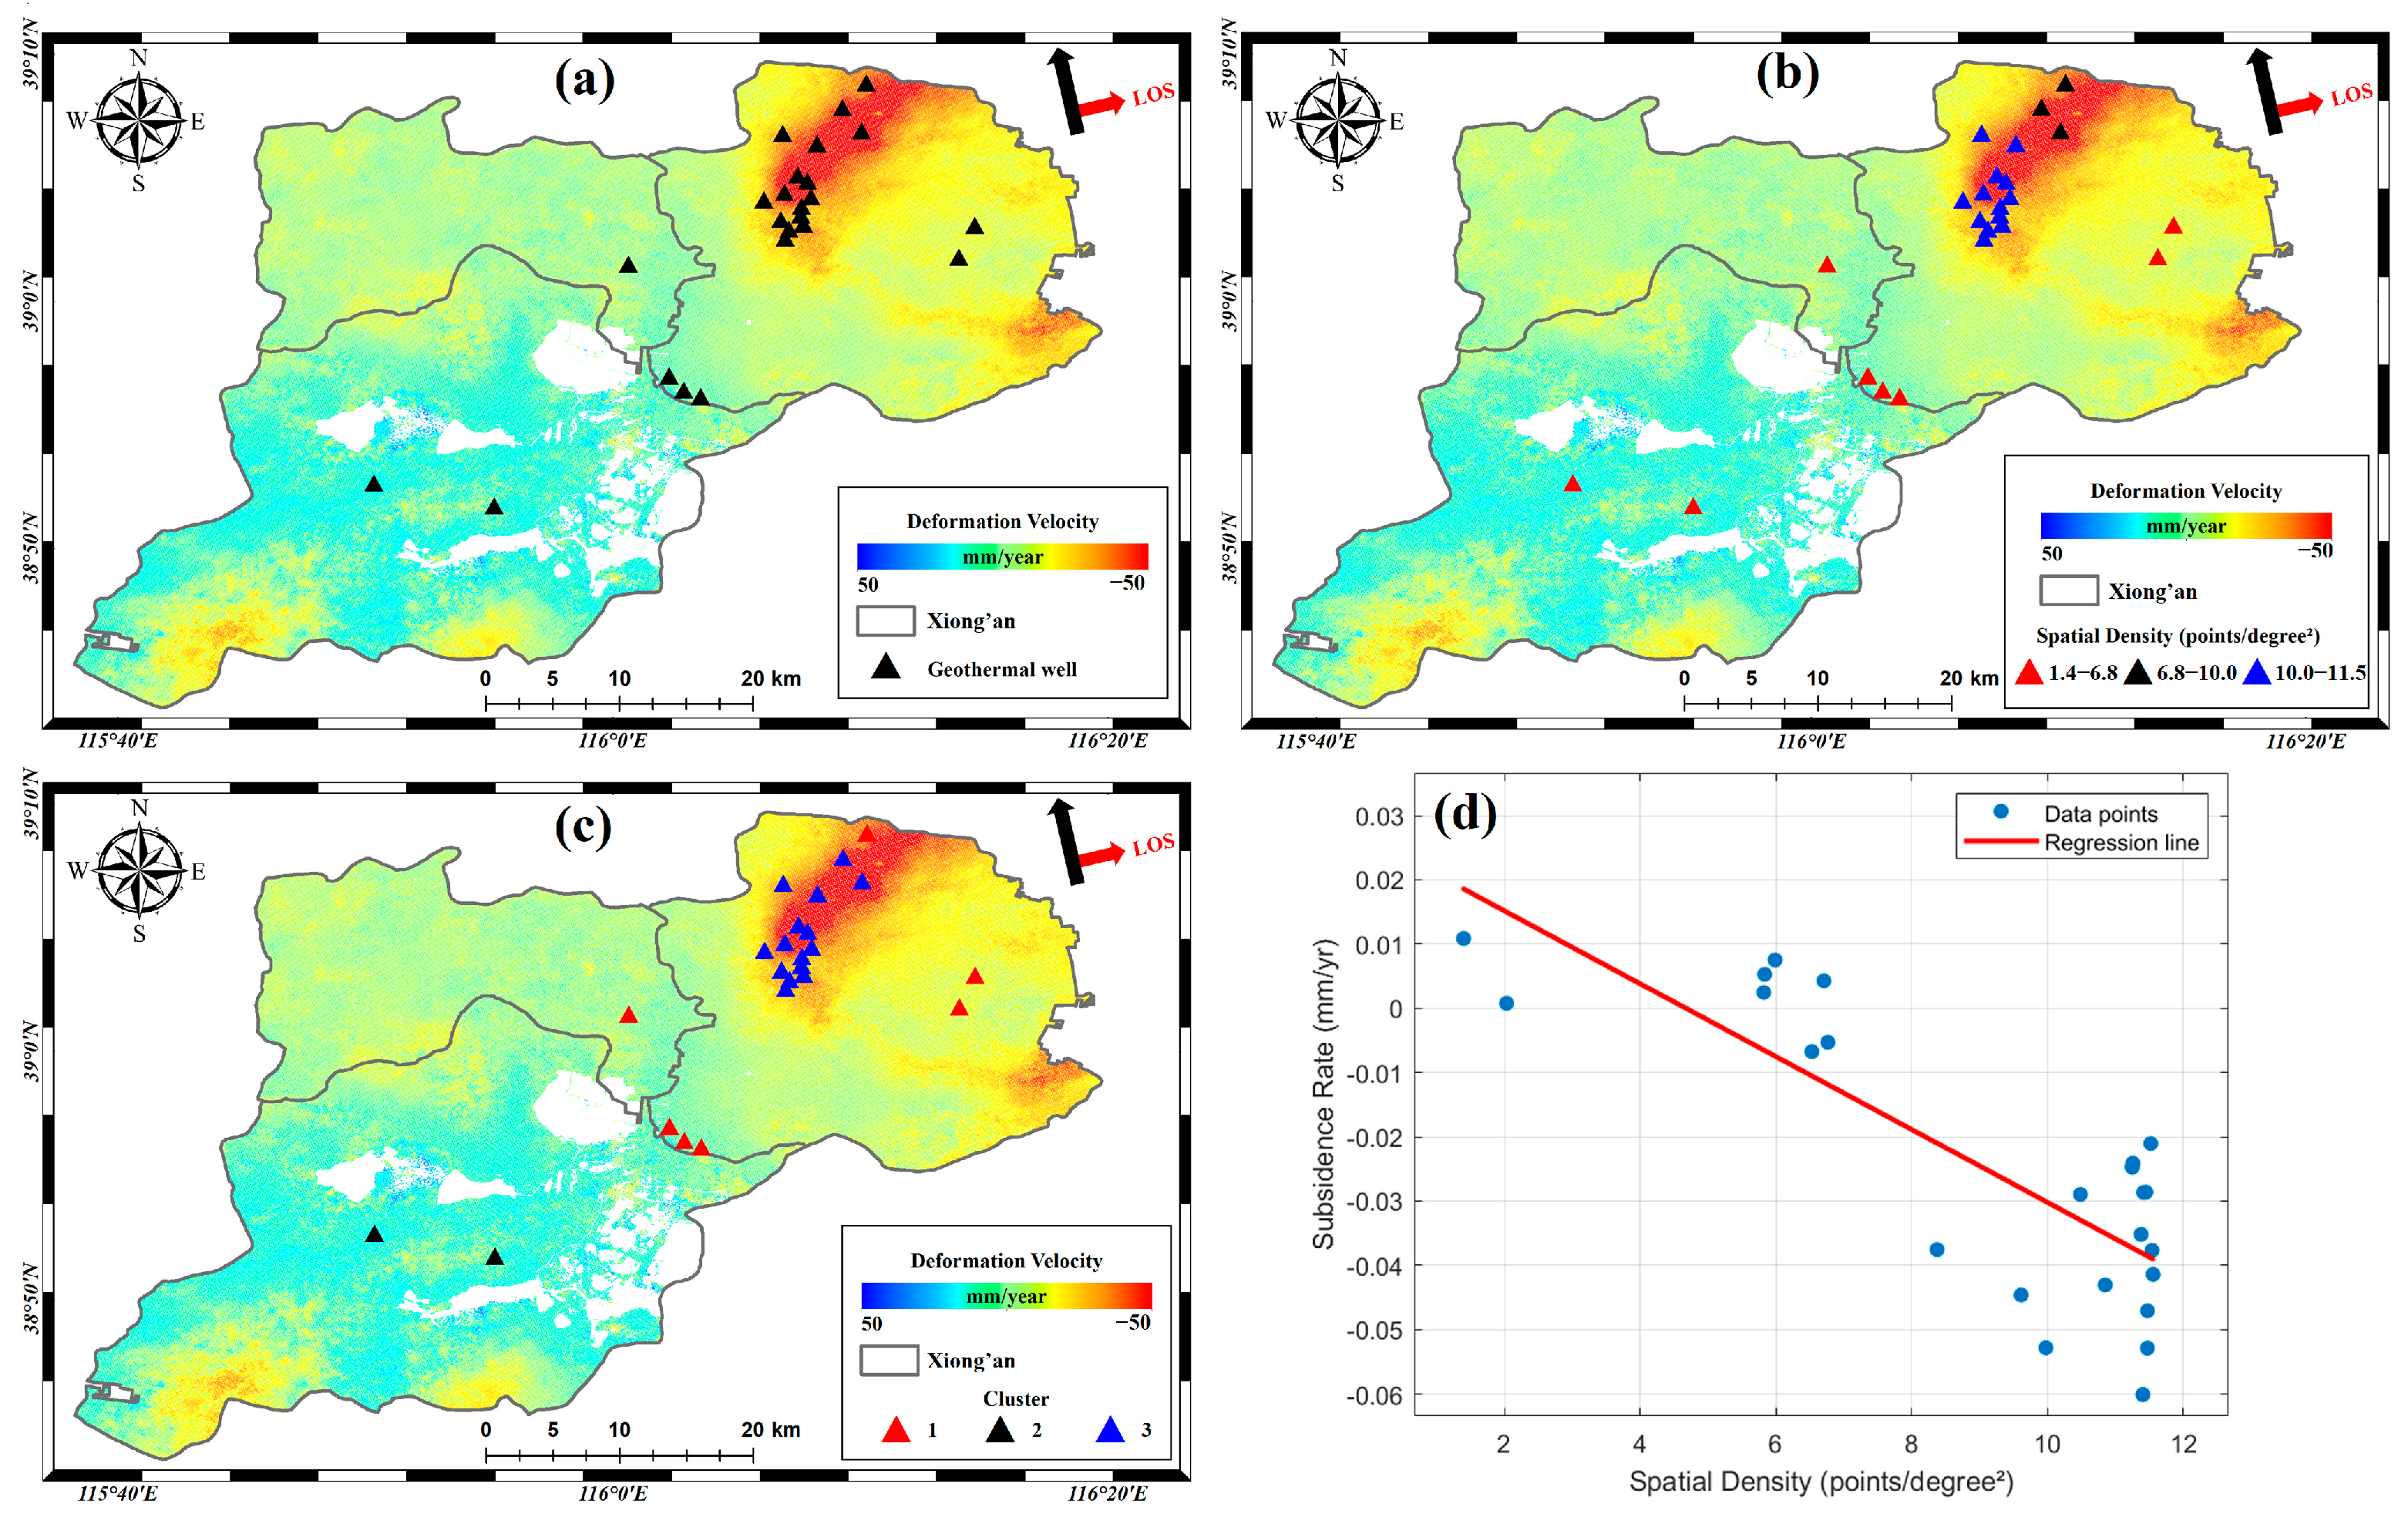
5.2. Triggers of Ground Subsidence in Xiong’an New Area

Both the InSAR deformation monitoring (Figure 4a) and integrated GNSS monitoring results (Figure 6d) demonstrate that Area A exhibits the most pronounced subsidence within the XNA. The geological analysis reveals that the ground subsidence in this area is primarily controlled by faults F4 and F5, with the deformation boundaries showing high consistency with the fault zones. Located in northern Xiong County, this region is characterized by extensive geothermal resources and a long history of exploitation. Prolonged and intensive geothermal extraction may have caused a decline in thermal reservoir pressure, potentially triggering or exacerbating ground subsidence, which could be a critical factor contributing to the observed subsidence. To validate the relationship between geothermal exploitation and subsidence, we conducted spatial correlation analysis by overlaying the InSAR-derived subsidence rates with the geothermal well distributions (Figure 10).
Figure 10a shows the spatial distribution of geothermal wells, and the different colors in Figure 10b show their spatial densities, where blue color indicates the densest distribution. The figure shows that the geothermal wells in the Xiong’an New Area are predominantly located in the northern part of Xiong County, where significant ground subsidence has occurred. The subsidence areas show a high spatial correlation with the geothermal well distribution. In contrast, the eastern and southern regions of Xiong County have a low level of geothermal resource development, with a sparse distribution of geothermal wells and no significant ground subsidence observed. To further analyze the relationship between the spatial distribution density of geothermal wells and the ground subsidence rate, we divided the geothermal wells into three clusters, as shown in Figure 10c. The average deformation rate for Cluster 1 is −4.3 mm/yr; Cluster 2 has the sparsest geothermal well distribution, with an average deformation rate of 5.8 mm/yr; and Cluster 3, with the densest geothermal well distribution, has an average deformation rate of −38.1 mm/yr. The Pearson correlation coefficient between the spatial density of the geothermal wells and subsidence rates was calculated to be −0.8103, as shown in Figure 10d. This spatial correlation shows that geothermal exploitation is a potential driver of subsidence. Additionally, as a major industrial hub in North China, Xiong County faces substantial water demand. Chronic over-extraction of groundwater in the water-scarce North China Plain may further contribute to localized subsidence. Therefore, both excessive geothermal and groundwater exploitation likely synergistically influence subsidence in Area A.
Although Anxin County lacks large-scale geothermal development, Areas B and C host water-intensive industries (e.g., textiles and plastic processing), requiring sustained high-volume groundwater extraction, which may explain the localized subsidence in southern Anxin. Notably, the subsidence magnitude and rates in Anxin remain lower than those in northern Xiong County, where geothermal and groundwater exploitation coexist, providing indirect evidence that geothermal activities may amplify subsidence.
These findings collectively suggest that overexploitation of groundwater and geothermal resources constitutes a critical latent mechanism driving severe subsidence in the Xiong’an New Area. This study provides essential insights for optimizing future groundwater/geothermal management strategies and subsurface spatial planning in the region.

6. Conclusions

(1)
The integrated GNSS–InSAR monitoring framework proposed in this study demonstrates significant advantages in regard to land subsidence monitoring for the Xiong’an New Area (XNA). By combining large-scale deformation background fields derived from time-series InSAR (maximum annual subsidence rate: 70 mm/yr) technology with high-precision 3D GNSS monitoring (RMSE: 4.44 mm; correlation coefficient: 0.86), the framework achieves millimeter-level detection of differential deformation across ground fissures in the area (e.g., a horizontal velocity difference of 40.04 mm/yr for baseline XA01-XA02). This approach overcomes the spatiotemporal resolution limitations of single-technique methods, providing a replicable technical paradigm for geohazard monitoring in emerging cities.
(2)
Land subsidence in the XNA exhibits marked spatiotemporal heterogeneity, driven by coupled multi-factor mechanisms. The monitoring results from 2017 to 2025 reveal substantially higher subsidence magnitudes in northern Xiongxian County (maximum: 591 mm) compared to Anxin County (249 mm) and Rongcheng County (<15 mm), with spatial patterns strongly aligned with the F4/F5 fault zones and geothermal well density. Seasonal analysis shows that Anxin’s subsidence is modulated by agricultural groundwater extraction, while northern Xiongxian’s industrial-dominated pumping results in minimal seasonal fluctuations. Synergistic effects between fissure activity and subsidence cause an annual incremental relative displacement of 19.8 mm (XA01-XA02), exacerbating infrastructure damage risks.
(3)
The deployment of rooftop GNSS stations presents an innovative solution for deformation monitoring in densely built urban areas. The comparative monitoring results show that rooftop environments typically offer a wider sky view and are less affected by electromagnetic and signal interference, effectively reducing multipath effects on GNSS observations. This leads to improved positioning accuracy and enhanced solution stability. It is, therefore, recommended that future urban deformation monitoring systems prioritize the installation of continuously operating GNSS stations on high-rise and supertall buildings. When implementing this strategy, the practical deployment conditions must be carefully considered. First, in terms of site selection, rooftops with open surroundings, minimal obstructions, and those that are located away from reflective surfaces should be prioritized to reduce systematic errors caused by non-ideal signal paths. Second, during the installation of GNSS equipment, stable antenna mounting structures, such as concrete platforms or specially anchored bases, are recommended to minimize the impact of building vibrations on the observation results. Finally, in regard to real-world applications, challenges, such as structural vibrations, rooftop load-bearing limitations, and the complexity of data transmission infrastructure, must also be addressed. The key advantage of rooftop GNSS stations lies in their ability to provide representative relative deformation information within dense urban settings. When integrated with InSAR data, they hold great potential for cross-validation and enhanced monitoring of horizontal ground deformation and urban subsidence. Therefore, the rooftop GNSS station deployment strategy proposed in this study should be regarded as a complementary approach rather than a replacement for ground-based stable reference stations.

Author Contributions

Methodology, S.L.; Formal analysis, S.L.; Investigation, S.L.; Data curation, S.L.; Writing—original draft, S.L.; Writing—review & editing, M.B.; Supervision, M.B.; Project administration, M.B.; Funding acquisition, M.B. All authors have read and agreed to the published version of the manuscript.

Funding

This research was supported by the Natural Science Foundation of China (Grant No. 42172311) and Beijing Natural Science Foundation (Grant No. 8242018).

Data Availability Statement

Dataset available on request from the authors. The raw data supporting the conclusions of this article will be made available by the authors on request.

Conflicts of Interest

The authors declare no conflict of interest.

References

  1. Hu, Y.; Connor, D.S.; Stuhlmacher, M.; Peng, J.; Turner, B.L., II. More Urbanization, More Polarization: Evidence from Two Decades of Urban Expansion in China. npj Urban Sustain. 2024, 4, 33. [Google Scholar] [CrossRef]
  2. Zhang, G.; Xu, Z.Q. High-Standard and High-Quality Promoting the Construction of Xiong’an New Area with High-Standards and High-Quality: History, Logic and Path Selection. Sci. Sci. Manag. S. T. 2024, 45, 64–82. (In Chinese) [Google Scholar]
  3. Allis, R.; Bromley, C.; Currie, S. Update on Subsidence at the Wairakei–Tauhara Geothermal System, New Zealand. Geothermics 2009, 38, 169–180. [Google Scholar] [CrossRef]
  4. Han, Y.; Liu, G.; Liu, J.; Yang, J.; Xie, X.; Yan, W.; Zhang, W. Monitoring and Analysis of Land Subsidence in Jiaozuo City (China) Based on SBAS-InSAR Technology. Sustainability 2023, 15, 11737. [Google Scholar] [CrossRef]
  5. Zhang, Z.; Hu, C.; Wu, Z.; Zhang, Z.; Yang, S.; Yang, W. Monitoring and Analysis of Ground Subsidence in Shanghai Based on PS-InSAR and SBAS-InSAR Technologies. Sci. Rep. 2023, 13, 8031. [Google Scholar] [CrossRef] [PubMed]
  6. Bai, Z.; Wang, Y.; Balz, T. Beijing Land Subsidence Revealed Using PS-InSAR with Long Time Series TerraSAR-X SAR Data. Remote Sens. 2022, 14, 2529. [Google Scholar] [CrossRef]
  7. Wang, Y.J.; Hu, J.; Liu, J.H.; Sun, Q. Measurements of Three-Dimensional Deformations by Integrating InSAR and GNSS: An Improved SISTEM Method Based on Variance Component Estimation. Geomat. Inf. Sci. Wuhan Univ. 2021, 46, 1598–1608. (In Chinese) [Google Scholar] [CrossRef]
  8. Susilo, S.; Salman, R.; Hermawan, W.; Widyaningrum, R.; Wibowo, S.T.; Lumban-Gaol, Y.A.; Meilano, I.; Yun, S.-H. GNSS Land Subsidence Observations along the Northern Coastline of Java, Indonesia. Sci. Data 2023, 10, 421. [Google Scholar] [CrossRef]
  9. Blodgett, J.C.; Ikehara, M.E.; Williams, G.E. Monitoring Land Subsidence in Sacramento Valley, California, Using GPS. J. Surv. Eng. 1990, 116, 112–130. [Google Scholar] [CrossRef]
  10. Rayan, A.; Fernandes, R.M.S.; Khalil, H.A.; Mahmoud, S.; Miranda, J.M.; Tealab, A. Evaluation of the Crustal Deformations in the Northern Region of Lake Nasser (Egypt) Derived from 8 Years of GPS Campaign Observations. J. Geodyn. 2010, 49, 210–215. [Google Scholar] [CrossRef]
  11. Ustun, A.; Tusat, E.; Yalvac, S. Preliminary Results of Land Subsidence Monitoring Project in Konya Closed Basin Between 2006–2009 by Means of GNSS Observations. Nat. Hazards Earth Syst. Sci. 2010, 10, 1151–1157. [Google Scholar] [CrossRef]
  12. Zhang, X.H.; Li, Z.H.; Li, Z.H. GPS Sensitivity Analysis Applied to the Automatic Monitoring System of Geheyan Dam Deformation. Bull. Surv. Mapp. 2000, 10, 10–12. (In Chinese) [Google Scholar]
  13. Xu, S.; Liu, J.; Li, Z.; Li, Z. GPS Automatic Monitoring System for Outside Deformation of Geheyan Dam on the Qingjiang River. Geo-Spat. Inf. Sci. 2000, 3, 58–64. [Google Scholar] [CrossRef]
  14. Ma, J. BDS/GPS Deformation Analysis of a Long-Span Cable-Stayed Bridge Based on Colored Noise Filtering. Geod. Geodyn. 2023, 14, 163–171. [Google Scholar] [CrossRef]
  15. Hasan, M.F.; Smith, R.; Vajedian, S.; Pommerenke, R.; Majumdar, S. Global Land Subsidence Mapping Reveals Widespread Loss of Aquifer Storage Capacity. Nat. Commun. 2023, 14, 6180. [Google Scholar] [CrossRef] [PubMed]
  16. Zhao, J.; Zhang, M.; Zhou, Z.; Wang, Z.; Lang, F.; Shi, H.; Zheng, N. CFFormer: A Cross-Fusion Transformer Framework for the Semantic Segmentation of Multisource Remote Sensing Images. IEEE Trans. Geosci. Remote Sens. 2025, 63, 4401117. [Google Scholar] [CrossRef]
  17. Massonnet, D.; Rossi, M.; Carmona, C.; Adragna, F.; Peltzer, G.; Feigl, K.; Rabaute, T. The Displacement Field of the Landers Earthquake Mapped by Radar Interferometry. Nature 1993, 364, 138–142. [Google Scholar] [CrossRef]
  18. Ferretti, A.; Prati, C.; Rocca, F. Nonlinear Subsidence Rate Estimation Using Permanent Scatterers in Differential SAR Interferometry. IEEE Trans. Geosci. Remote Sens. 2000, 38, 2202–2212. [Google Scholar] [CrossRef]
  19. Ferretti, A.; Prati, C.; Rocca, F. Permanent Scatterers in SAR Interferometry. IEEE Trans. Geosci. Remote Sens. 2001, 39, 8–20. [Google Scholar] [CrossRef]
  20. Berardino, P.; Fornaro, G.; Lanari, R.; Sansosti, E. A New Algorithm for Surface Deformation Monitoring Based on Small Baseline Differential SAR Interferograms. IEEE Trans. Geosci. Remote Sens. 2002, 40, 2375–2383. [Google Scholar] [CrossRef]
  21. Rezaei, A. Comments on “Quantifying Groundwater Exploitation Induced Subsidence in the Rafsanjan Plain, Southeastern Iran, Using InSAR Time-Series and in Situ Measurements” by Motagh, M., Shamshiri, R., Haghighi, M.H., Wetzel, H.U., Akbari, B., Nahavandchi, H., … & Arabi, S. [Engineering Geology, 218 (2017), 134–151]. Eng. Geol. 2018, 246, 417–419. [Google Scholar] [CrossRef]
  22. Qu, F.; Lu, Z.; Zhang, Q.; Bawden, G.W.; Kim, J.-W.; Zhao, C.; Qu, W. Mapping Ground Deformation over Houston–Galveston, Texas Using Multi-Temporal InSAR. Remote Sens. Environ. 2015, 169, 290–306. [Google Scholar] [CrossRef]
  23. Ojha, C.; Shirzaei, M.; Werth, S.; Argus, D.F.; Farr, T.G. Sustained Groundwater Loss in California’s Central Valley Exacerbated by Intense Drought Periods. Water Resour. Res. 2018, 54, 4449–4460. [Google Scholar] [CrossRef]
  24. Zhao, J.; Niu, Y.; Lu, Z.; Yang, J.; Li, P.; Liu, W. Applicability Assessment of UAVSAR Data in Wetland Monitoring: A Case Study of Louisiana Wetland. Int. Arch. Photogramm. Remote Sens. Spat. Inf. Sci 2018, XLII-3, 2375–2378. [Google Scholar] [CrossRef]
  25. Cigna, F.; Tapete, D. Present-Day Land Subsidence Rates, Surface Faulting Hazard and Risk in Mexico City with 2014–2020 Sentinel-1 IW InSAR. Remote Sens. Environ. 2021, 253, 112161. [Google Scholar] [CrossRef]
  26. Zhang, X.; Sun, Q.; Gui, R.; Hu, J.; Yang, Q.; Su, G. Long-Time Surface Deformation in Beijing, China for Three Decades by Multi-Sensor, Multi-Track and Multi-Temporal InSAR Seamless Connection. Geomat. Nat. Hazards Risk 2025, 16, 2478950. [Google Scholar] [CrossRef]
  27. Qu, F.; Zhang, Q.; Lu, Z.; Zhao, C.; Yang, C.; Zhang, J. Land Subsidence and Ground Fissure in Xi’an, China 2005–2012 Revealed by Multi-Band InSAR Time-Series Analysis. Remote Sens. Environ. 2014, 155, 366–376. [Google Scholar] [CrossRef]
  28. Si, J.; Zhang, S.; Niu, Y.; Zhang, Y.; Fan, Q.; Chen, Y. The Surface Deformation of Permafrost and Active Layer Thickness in the Upper Reaches of the Black River Basin, Revealed by InSAR Observations and Independent Component Analysis. Sci. Total Environ. 2024, 951, 175667. [Google Scholar] [CrossRef]
  29. Zhang, Y.H.; Liu, B.; Wu, H.A.; Cheng, X.; Kang, Y.H. Ground Subsidence in Xiong’an New Area from 2012 to 2016 Monitored by InSAR Technique. J. Earth Sci. Environ. 2018, 40, 652–662. (In Chinese) [Google Scholar]
  30. Dai, K.; Ran, P.; Li, Z.; Austin, J.; Muller, J.-P.; Zeng, Q.; Zhang, J.; Hu, L. Land Subsidence in Xiong’an New Area, China Revealed by InSAR Observations. J. Geod. Geoinf. Sci. 2021, 4, 70–76. [Google Scholar] [CrossRef]
  31. Ran, P.L.; Li, S.D.; Dai, K.R.; Yang, X.X.; Zeng, S.; Ran, Z.X. SBAS-InSAR monitoring and analysis of land subsidence in Xiongan New Area from 2017 to 2019. J. Henan Polytech. Univ. Nat. Sci. 2022, 41, 66–73. (In Chinese) [Google Scholar] [CrossRef]
  32. Hu, X.; Bürgmann, R.; Schulz, W.H.; Fielding, E.J. Four-Dimensional Surface Motions of the Slumgullion Landslide and Quantification of Hydrometeorological Forcing. Nat. Commun. 2020, 11, 2792. [Google Scholar] [CrossRef] [PubMed]
  33. Liu, J.-H.; Hu, J.; Li, Z.-W.; Zhu, J.-J.; Sun, Q.; Gan, J. A Method for Measuring 3-D Surface Deformations with InSAR Based on Strain Model and Variance Component Estimation. IEEE Trans. Geosci. Remote Sens. 2018, 56, 239–250. [Google Scholar] [CrossRef]
  34. Liao, Y.M.; Huang, D.P. Climate Characteristics and Change Trend of Xiongan New Area. Chin. Agric. Sci. Bull. 2020, 36, 99–105. (In Chinese) [Google Scholar]
  35. Ma, Z.; Xia, Y.B.; Li, H.T.; Han, B.; Yu, X.Z.; Zhou, Y.L.; Wang, Y.S.; Guo, X.; Li, H.Q.; Pei, Y.D. Analysis of natural resources and environment eco-geological conditions in the Xiong’an New Area. Geol. China 2021, 48, 677–696. (In Chinese) [Google Scholar]
  36. Xue, C.; Zang, M.; Zhang, Z.; Yang, G.; Xu, N.; Wang, F.; Hong, C.; Li, G.; Wang, F. Distribution Characteristics and Genesis Mechanism of Ground Fissure in Three Northern Counties of the North China Plain. Sustainability 2024, 16, 8027. [Google Scholar] [CrossRef]
  37. Sowter, A.; Amat, M.B.C.; Cigna, F.; Marsh, S.; Athab, A.; Alshammari, L. Mexico City Land Subsidence in 2014–2015 with Sentinel-1 IW TOPS: Results Using the Intermittent SBAS (ISBAS) Technique. Int. J. Appl. Earth Obs. Geoinf. 2016, 52, 230–242. [Google Scholar] [CrossRef]
  38. Hu, L.; Dai, K.; Xing, C.; Li, Z.; Tomás, R.; Clark, B.; Shi, X.; Chen, M.; Zhang, R.; Qiu, Q.; et al. Land Subsidence in Beijing and Its Relationship with Geological Faults Revealed by Sentinel-1 InSAR Observations. Int. J. Appl. Earth Obs. Geoinf. 2019, 82, 101886. [Google Scholar] [CrossRef]
  39. Zhang, Y.H.; Wu, H.A.; Kang, Y.H. Ground Subsidence over Beijing-Tianjin-Hebei Region during Three Periods of 1992 to 2014 Monitored by Interferometric SAR. Acta Geod. Cartogr. Sin. 2016, 45, 1050–1058. (In Chinese) [Google Scholar]
Figure 1. Overview of the study area: (a) geographical location and administrative divisions of XNA; (b) distribution of major faults, ground fissures, and surface water systems in XNA; (c) typical ground fissure observed at site L1 during field investigation; (d) typical ground fissure at site L2; and (e) typical ground fissure at site L3.
Remotesensing 17 02654 g001
Figure 2. GNSS ground subsidence monitoring network in Xiong’an New Area: (a) spatial distribution of GNSS monitoring stations; (b) structural components of a GNSS monitoring station; and (c) field photos of the deployed GNSS stations.
Remotesensing 17 02654 g002
Figure 3. Flowchart of data processing.
Remotesensing 17 02654 g003
Figure 4. Cumulative LOS deformation and average annual deformation rates in Xiong’an New Area derived from Sentinel-1A data (2017–2025): (a) cumulative deformation along the LOS direction; (b) average annual deformation rate along the LOS direction; (c) average annual deformation rate in the east–west direction; and (d) average annual deformation rate in the vertical direction.
Remotesensing 17 02654 g004
Figure 5. InSAR-derived deformation time series in Xiong’an New Area: (ai) cumulative deformation maps for each year from 2017 to 2025; and (jm) deformation time series extracted at points P1, P2, P3, and P4.
Remotesensing 17 02654 g005
Figure 6. The time-series results of point-pair baseline measurements: (a) the distribution of GNSS station pairs across the study area; (b) displacement time series for the XA01-XA02 baseline; (c) time series for the XA03-XA04 baseline, and (d) deformation records for the XA05-XA06 baseline.
Remotesensing 17 02654 g006
Figure 7. Relative 3D deformation fields of the baseline: (a) LOS-oriented deformation rates from InSAR; (b) horizontal deformation field with LOS-oriented projection to east–west deformation rates in the bottom panel; (c) vertical deformation field with LOS-oriented projection to vertical deformation rates in the bottom panel; (df) results of horizontal deformation rate profiles on both sides of the geosyncline; and (gi) results of vertical deformation rate profiles on both sides of the geosyncline. We use HA-HA′, HB-HB′, and HC-HC′ to denote profiles of relative phase transition rates in the east–west direction, and VA-VA′, VB-VB′, and VC-VC′ to denote profiles of relative deformation rates in the vertical direction.
Remotesensing 17 02654 g007
Figure 8. Comparison of cumulative LOS deformation derived from InSAR and GNSS at each monitoring site: (af) LOS deformation time series obtained from InSAR and GNSS; and (g) correlation coefficients and RMSE between InSAR and GNSS LOS deformation measurements.
Remotesensing 17 02654 g008
Figure 9. Quality check of GNSS observation data multipath effect: (a) real photo of each GNSS station; and (bg) assessment results of multipath effect for stations XA01~XA06.
Remotesensing 17 02654 g009
Figure 10. InSAR deformation rates and spatial distribution of geothermal wells in XNA: (a) spatial distribution of geothermal wells; (b) spatial density of geothermal wells, the different colors show their spatial density differences; (c) cluster analysis of spatial density and deformation rates; and (d) correlation between spatial density and deformation rates.
Remotesensing 17 02654 g010
Table 1. Key parameters of SAR data.
SatelliteSentinel-1A
Incidence (°)39.14°
Orbit directionAscending
Band/wavelength (cm)C/5.6
PolarizationVV
Acquisition dates20 May 2017–15 March 2025
Total acquisitions125
Table 2. GAMIT near real-time baseline processing strategy.
ParameterSolution Strategy
Processing ModeBASELINE
Observation TypeLC_AUTCLN
Tropospheric Mapping FunctionGMF
Cutoff Altitude Angle10°
Precision EphemerisSuperfast ephemeris (23 h actual + 1 h forecast)
Broadcast EphemerisHybrid broadcast ephemeris
GNSS Data Sampling Frequency15 s
Station Coordinate ConstraintsBase station: 0.050 m, 0.050 m, 0.050 m
Monitoring station: 0.100 m, 0.100 m, 0.100 m
Participating Global IGS StationsBJFS
Table 3. Comparison of relative deformation rate differences between GNSS and InSAR at the profile line.
Profile LineHorizontalVertical
HA-HA′HB-HB′HC-HC′VA-VA′VB-VB′VC-VC′
InSAR relative deformation rate (mm/a)−6.9−0.9−0.5−22.1−2.92.1
GNSS relative deformation rate (mm/a)−23.04−30.4213.84−41.85−3.545.58
Disclaimer/Publisher’s Note: The statements, opinions and data contained in all publications are solely those of the individual author(s) and contributor(s) and not of MDPI and/or the editor(s). MDPI and/or the editor(s) disclaim responsibility for any injury to people or property resulting from any ideas, methods, instructions or products referred to in the content.

