


Aerial-Ground Cross-View Vehicle Re-Identification: A Benchmark Dataset and Baseline


Abstract
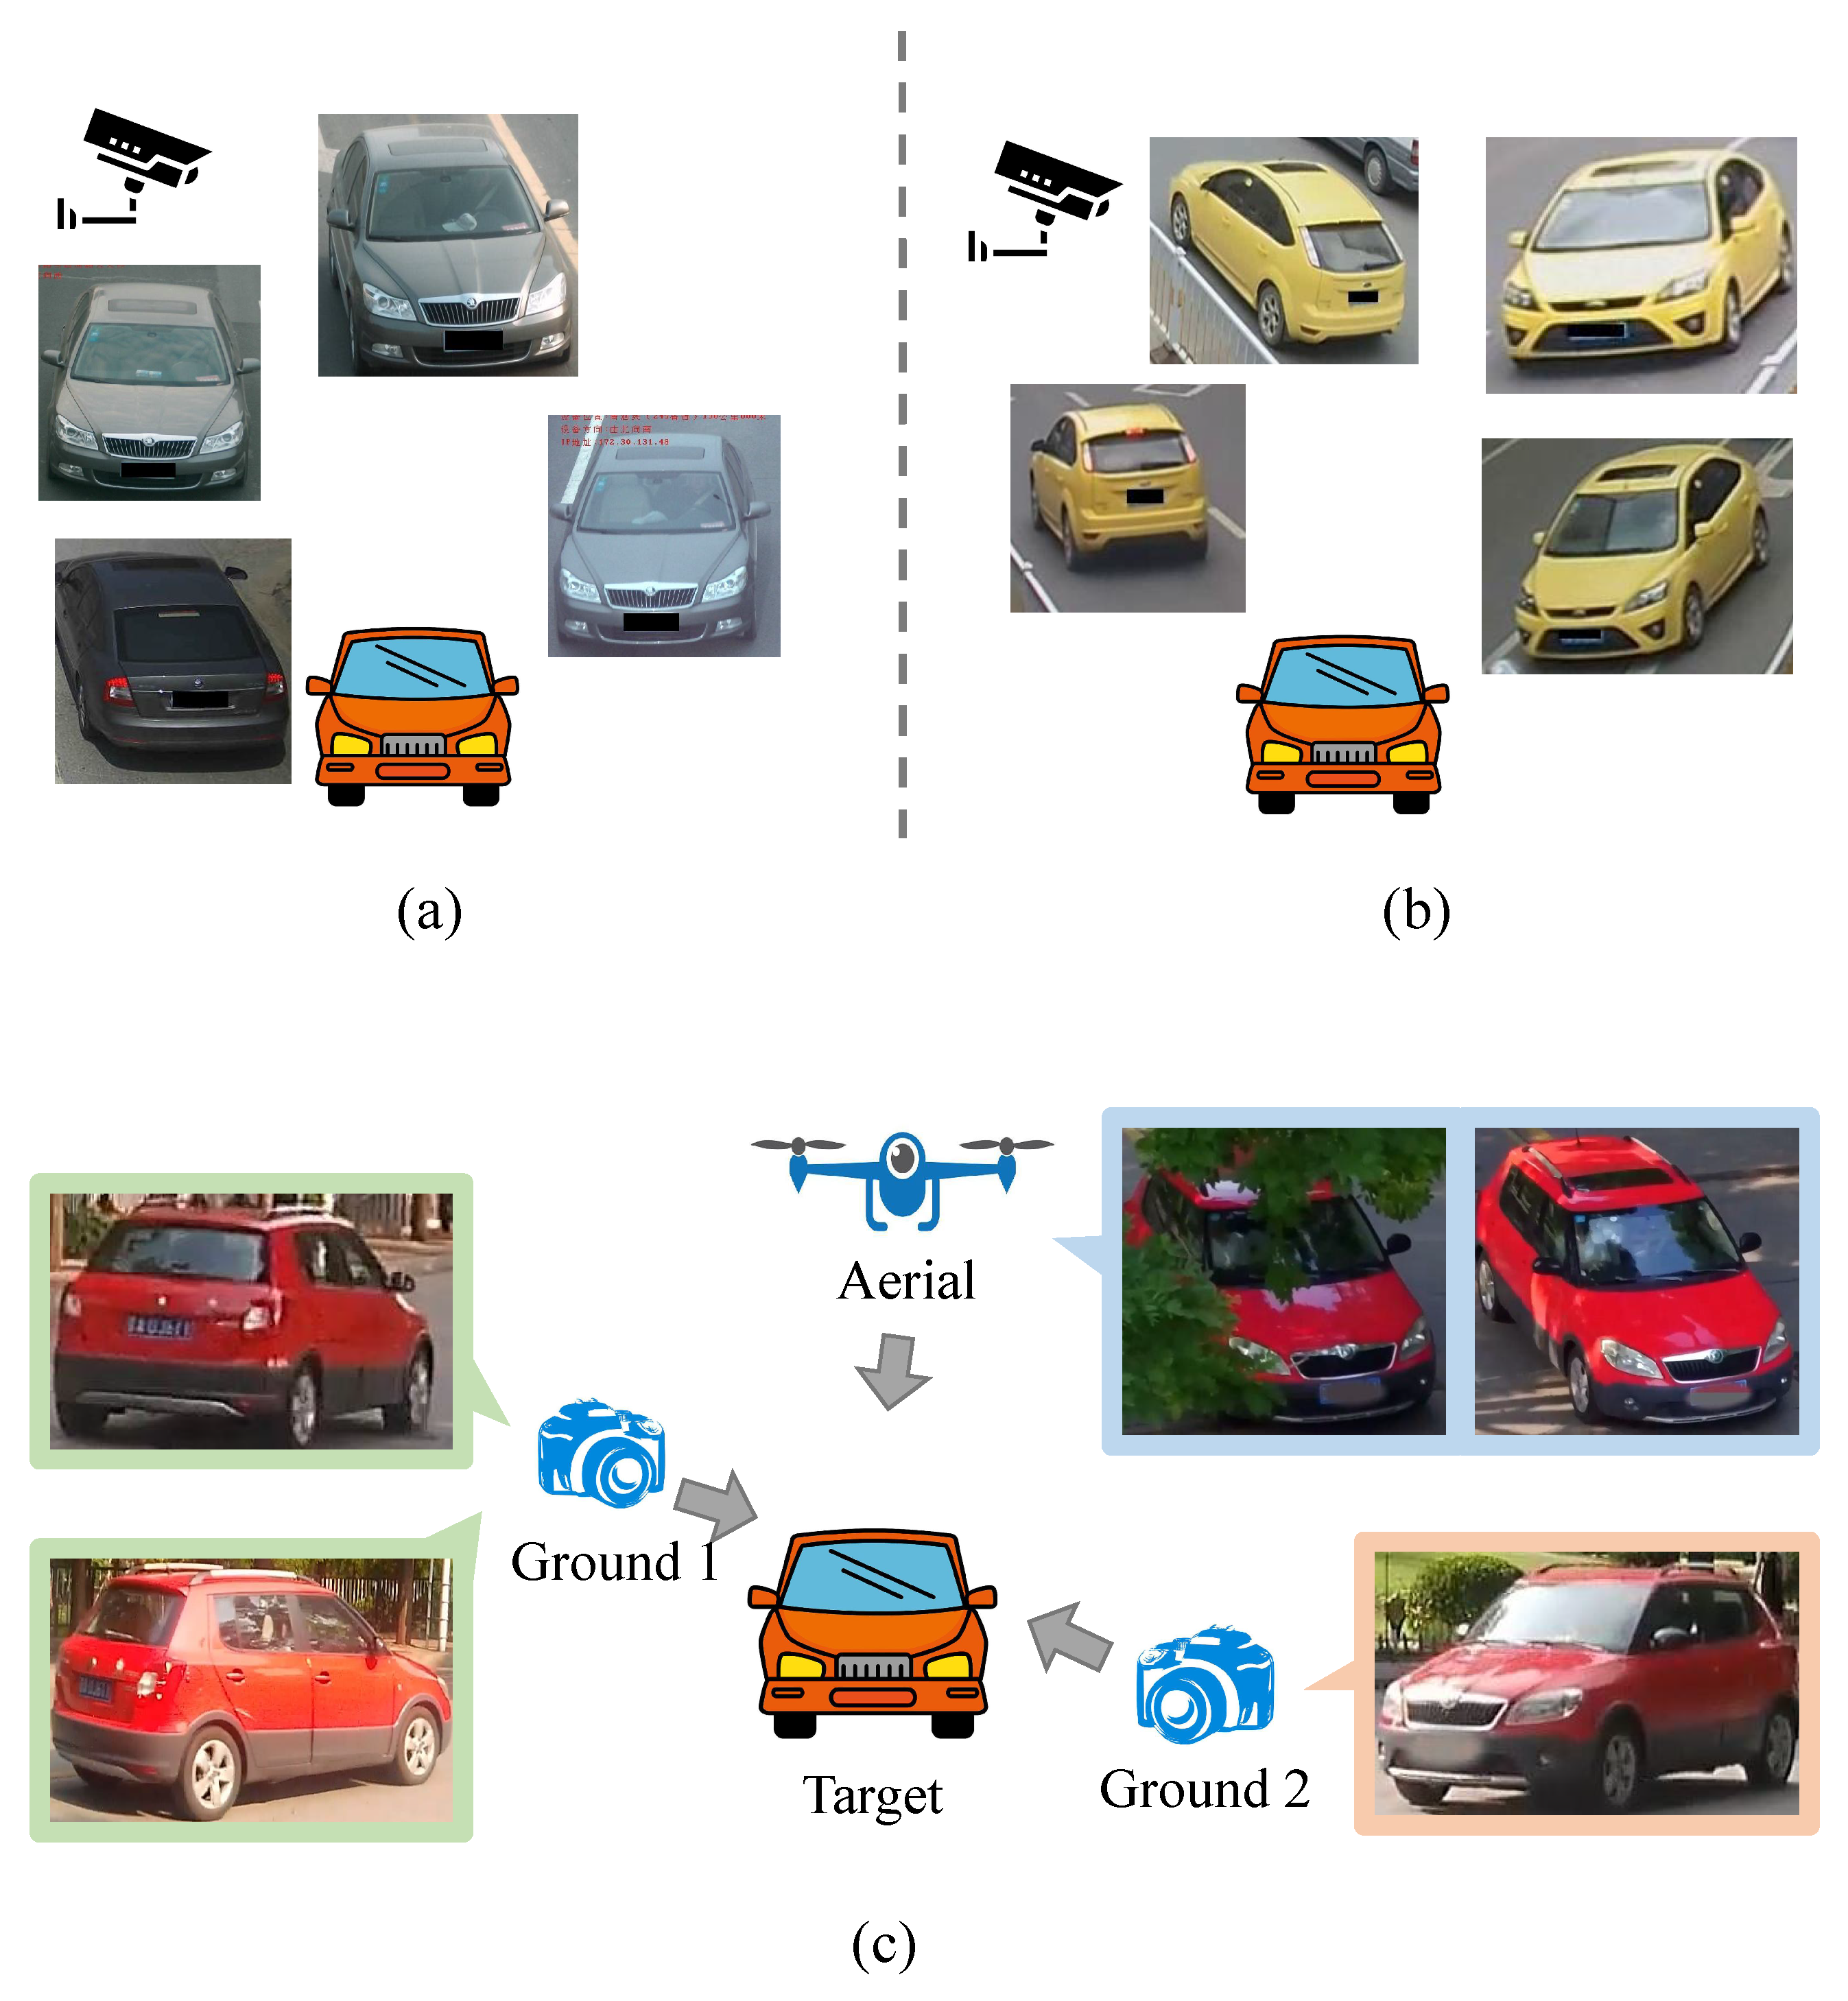
1. Introduction
2. Related Work
2.1. Vehicle Re-Identification
2.2. Vehicle Re-ID Datasets
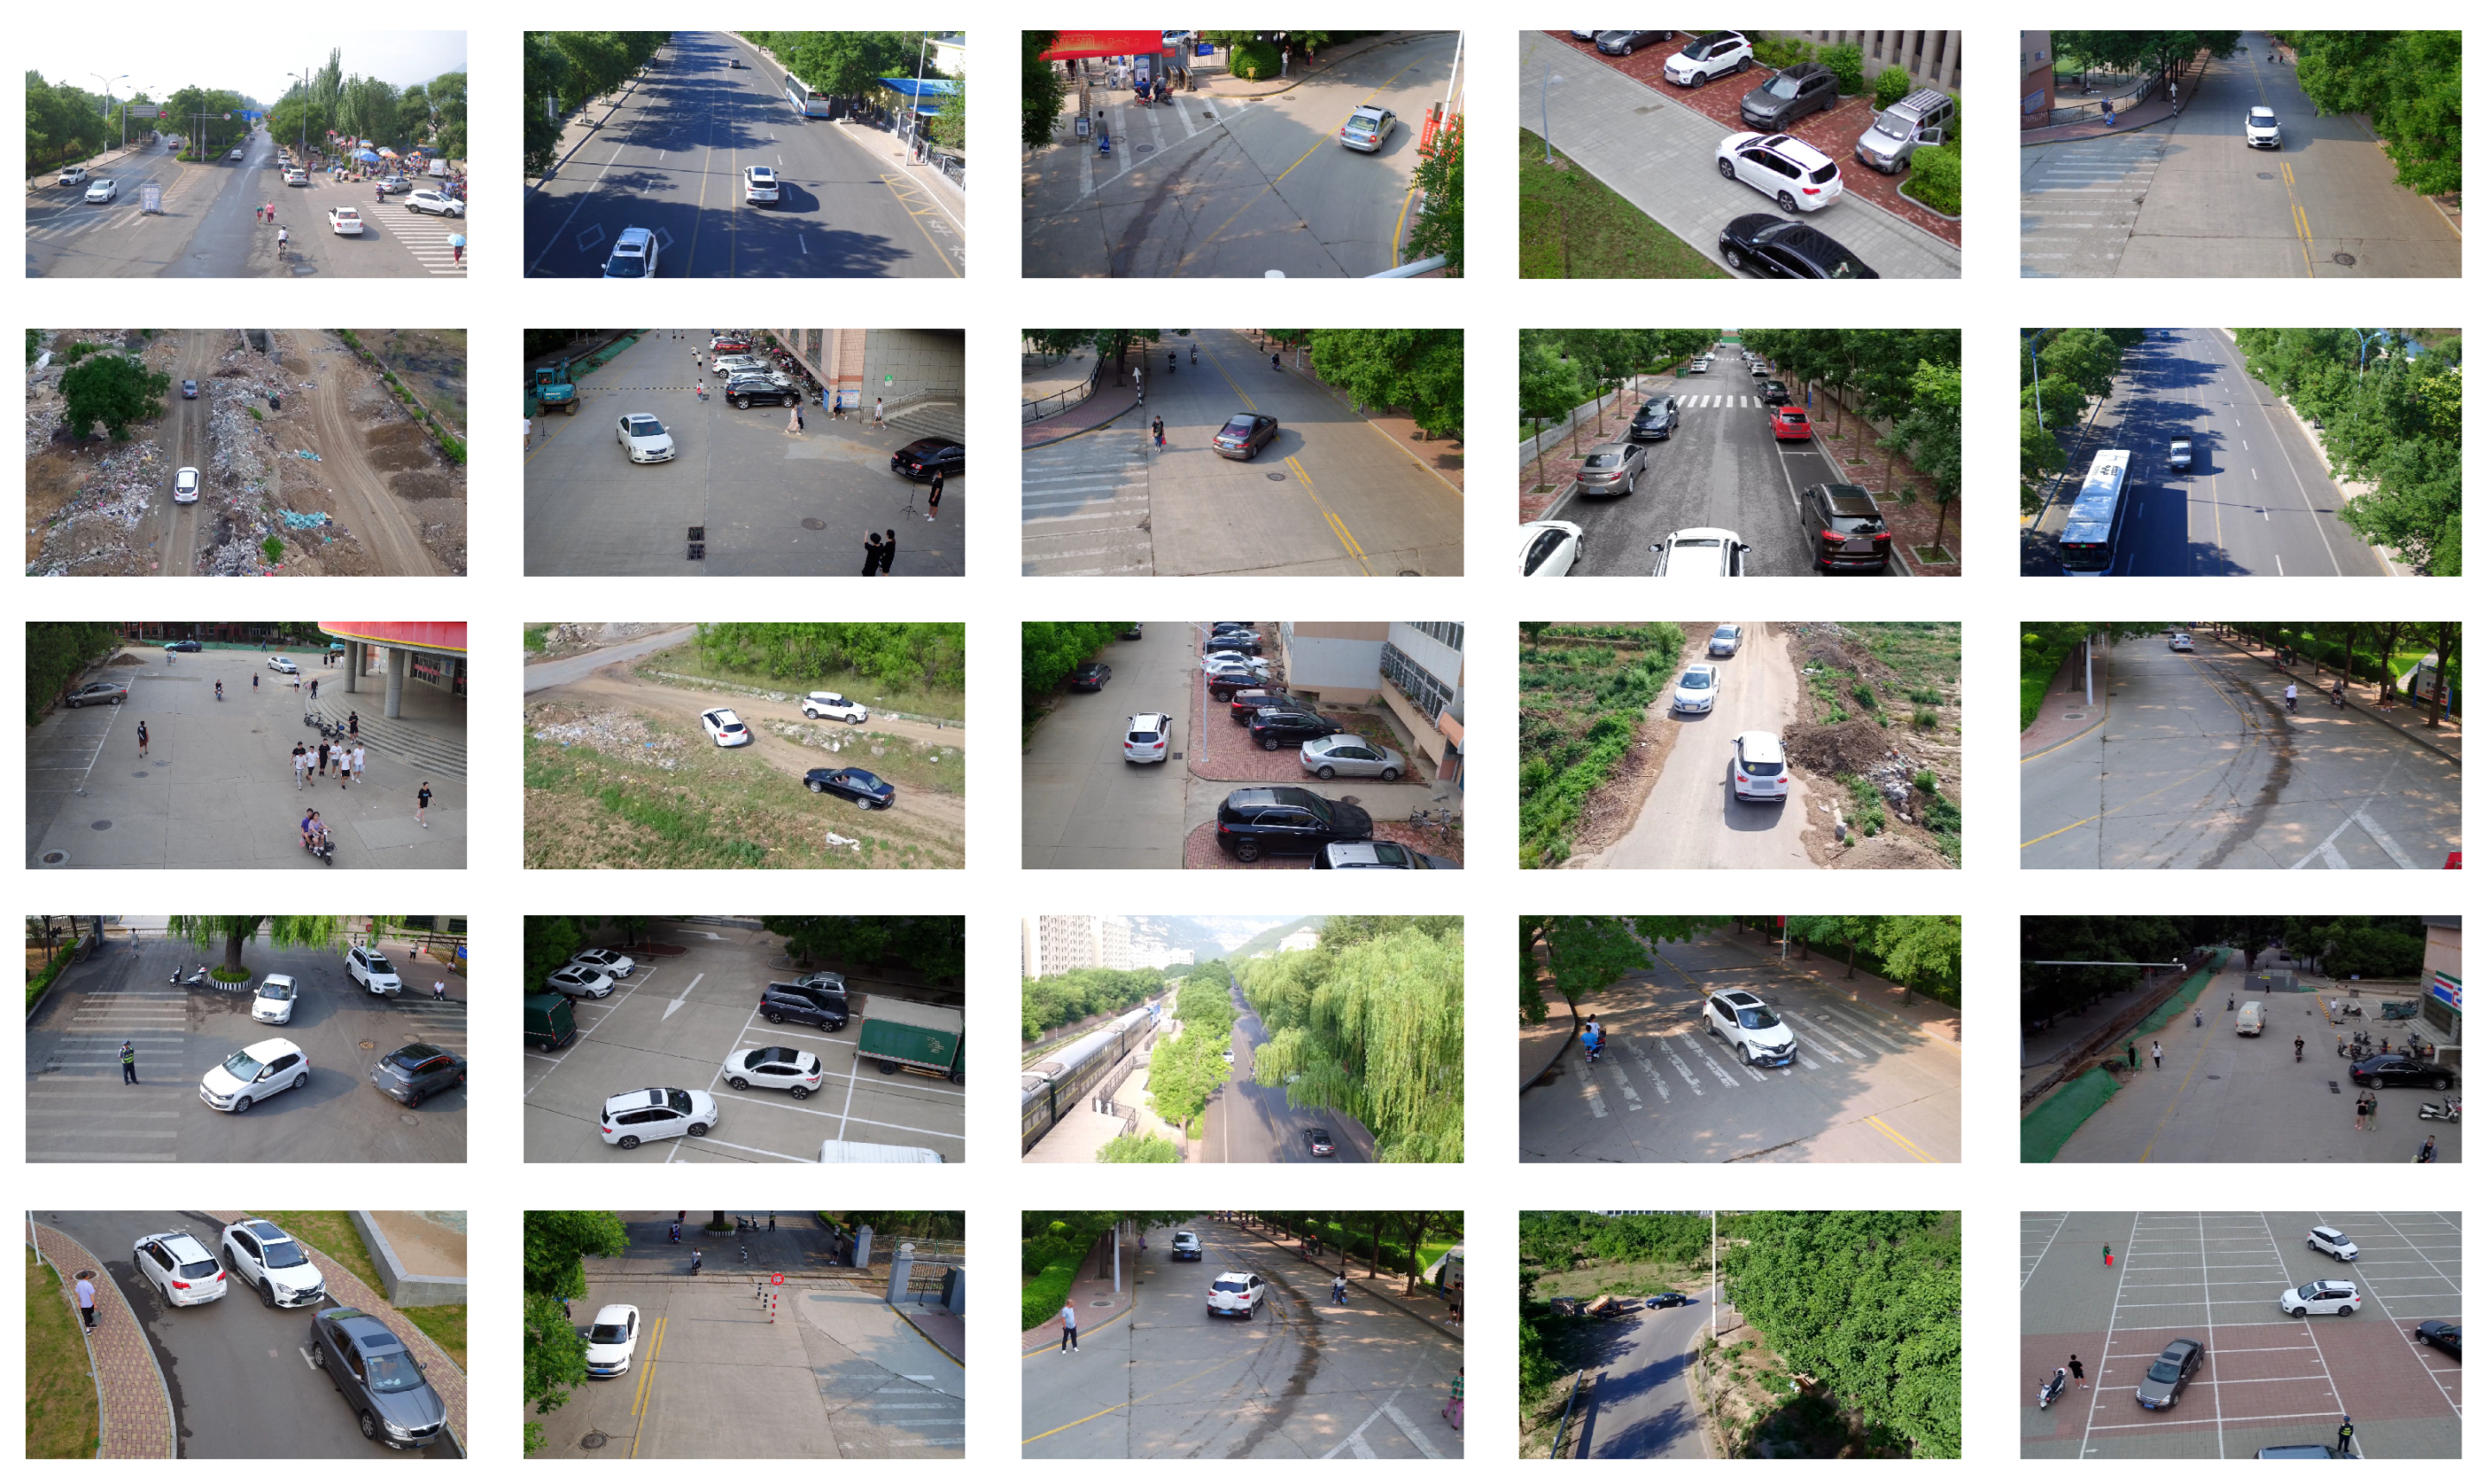
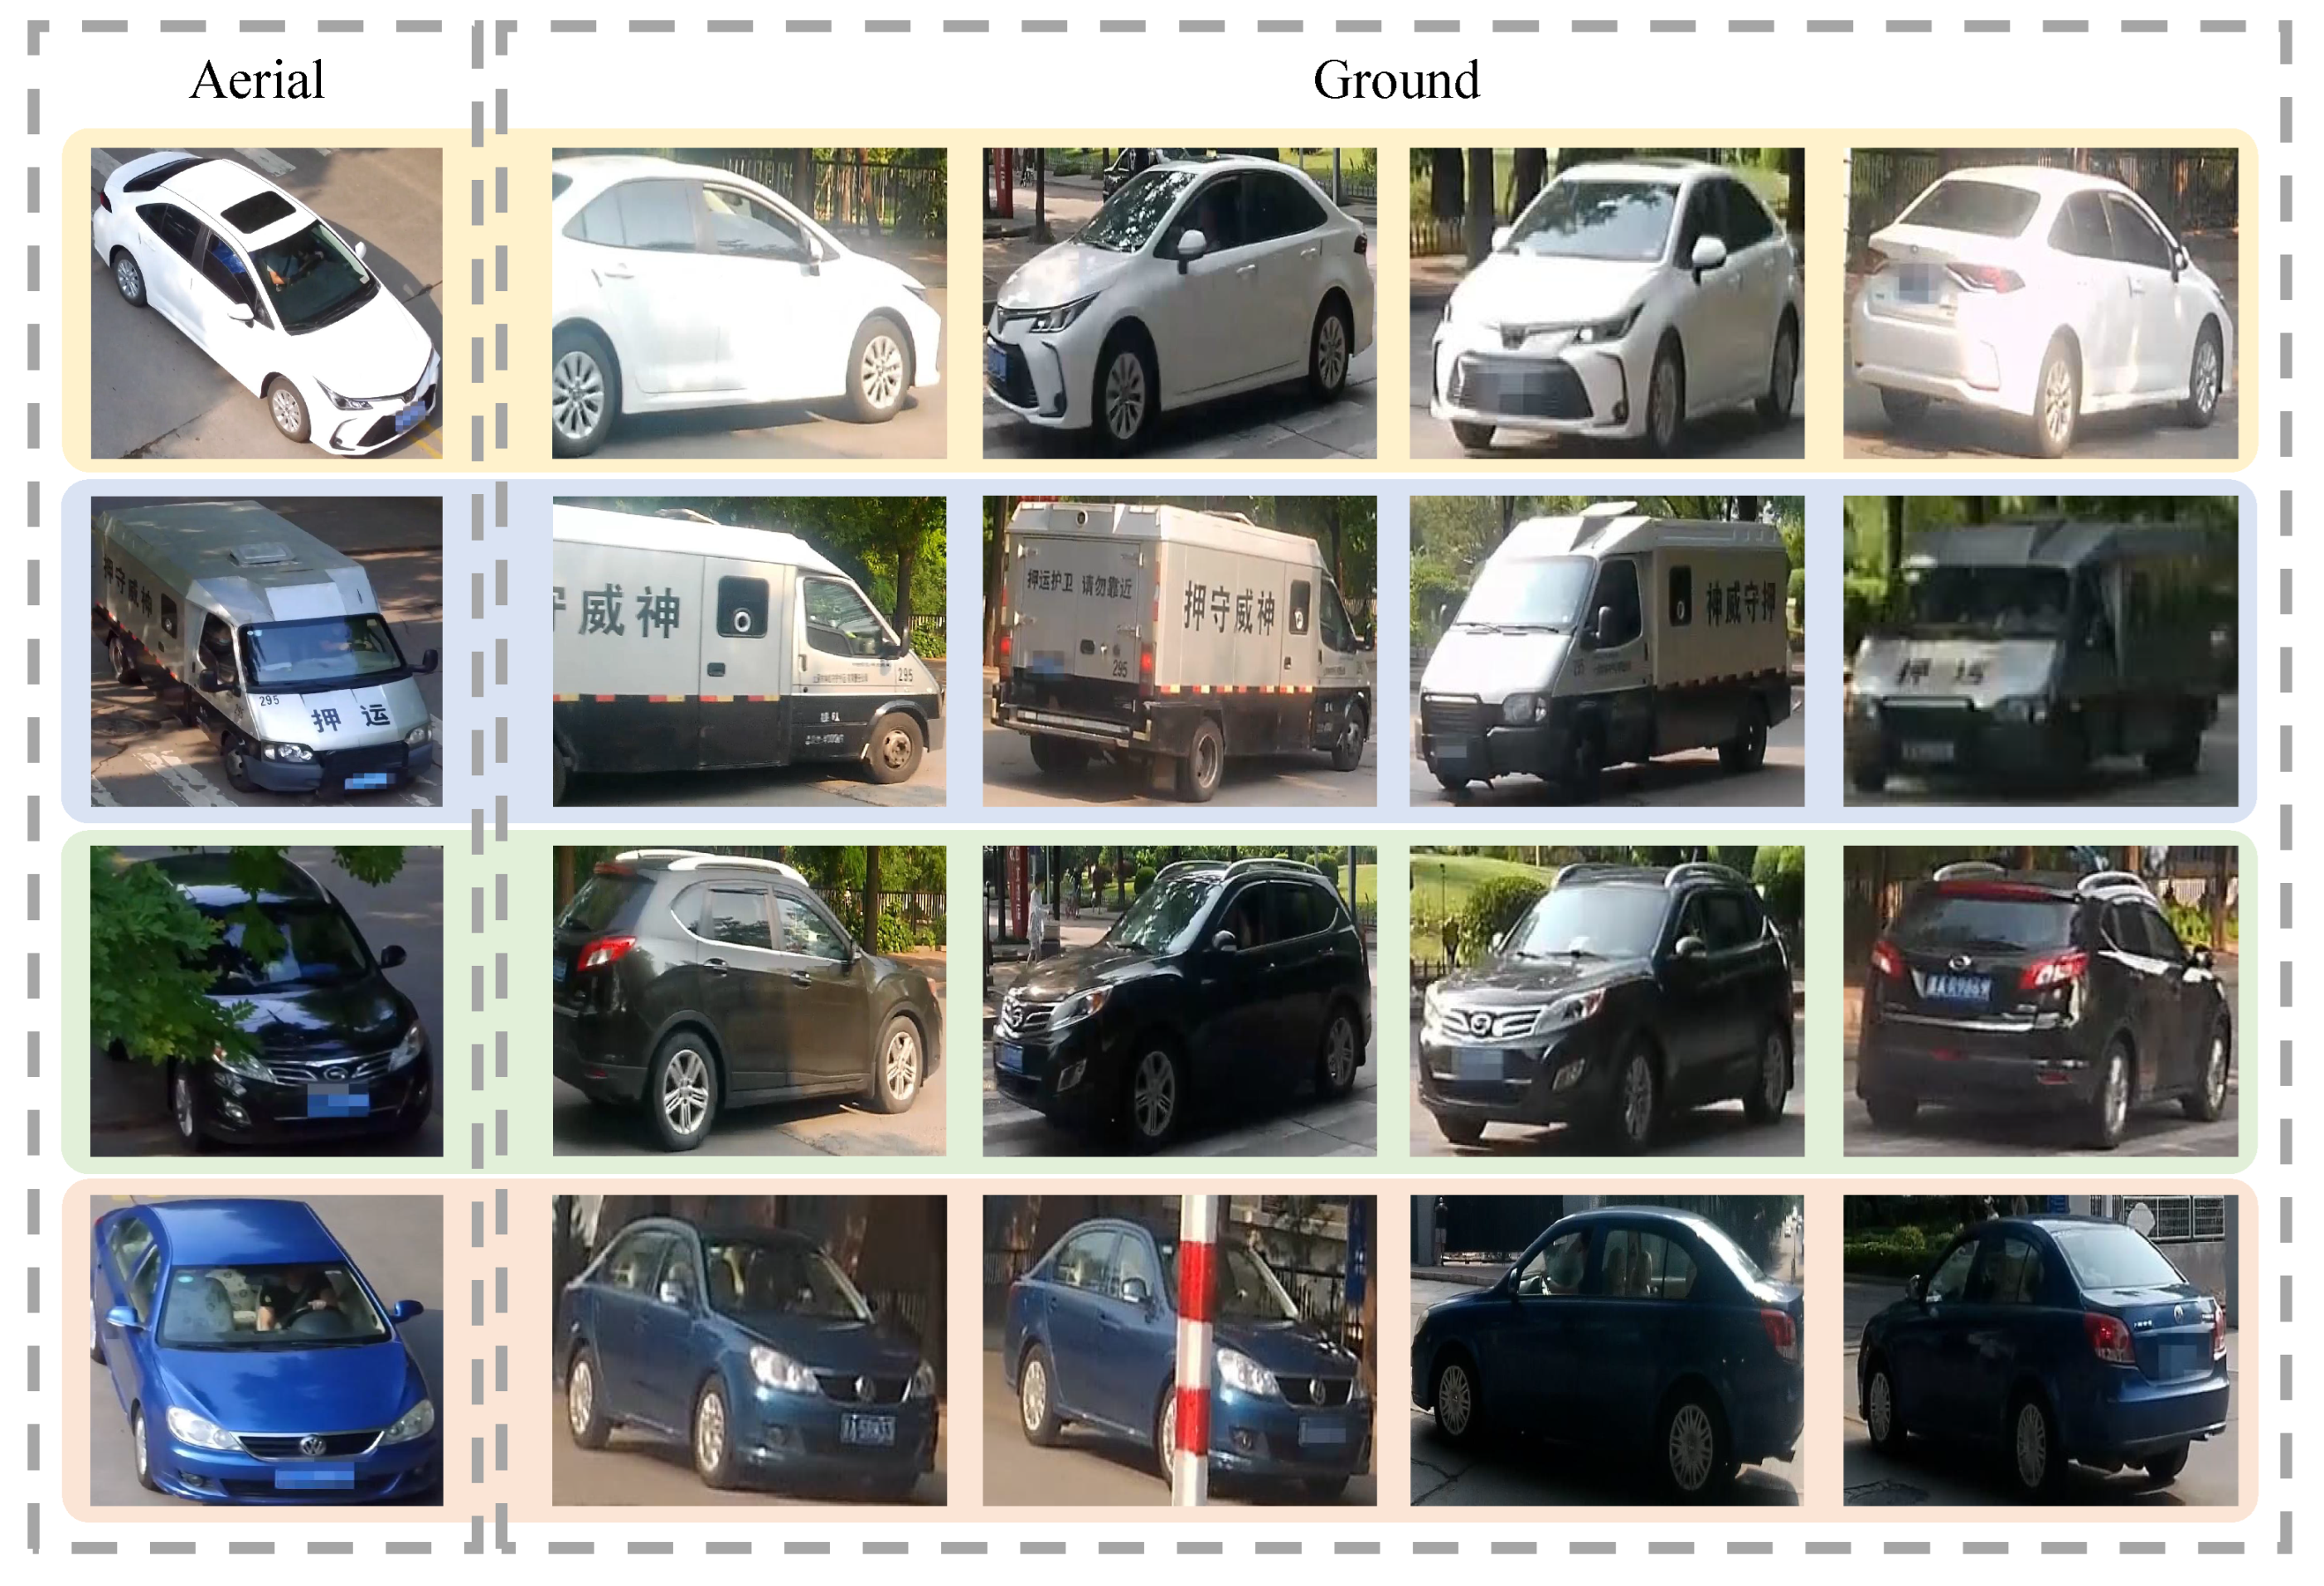
3. Cross View Dataset: AGID
4. The Proposed Method for AGID
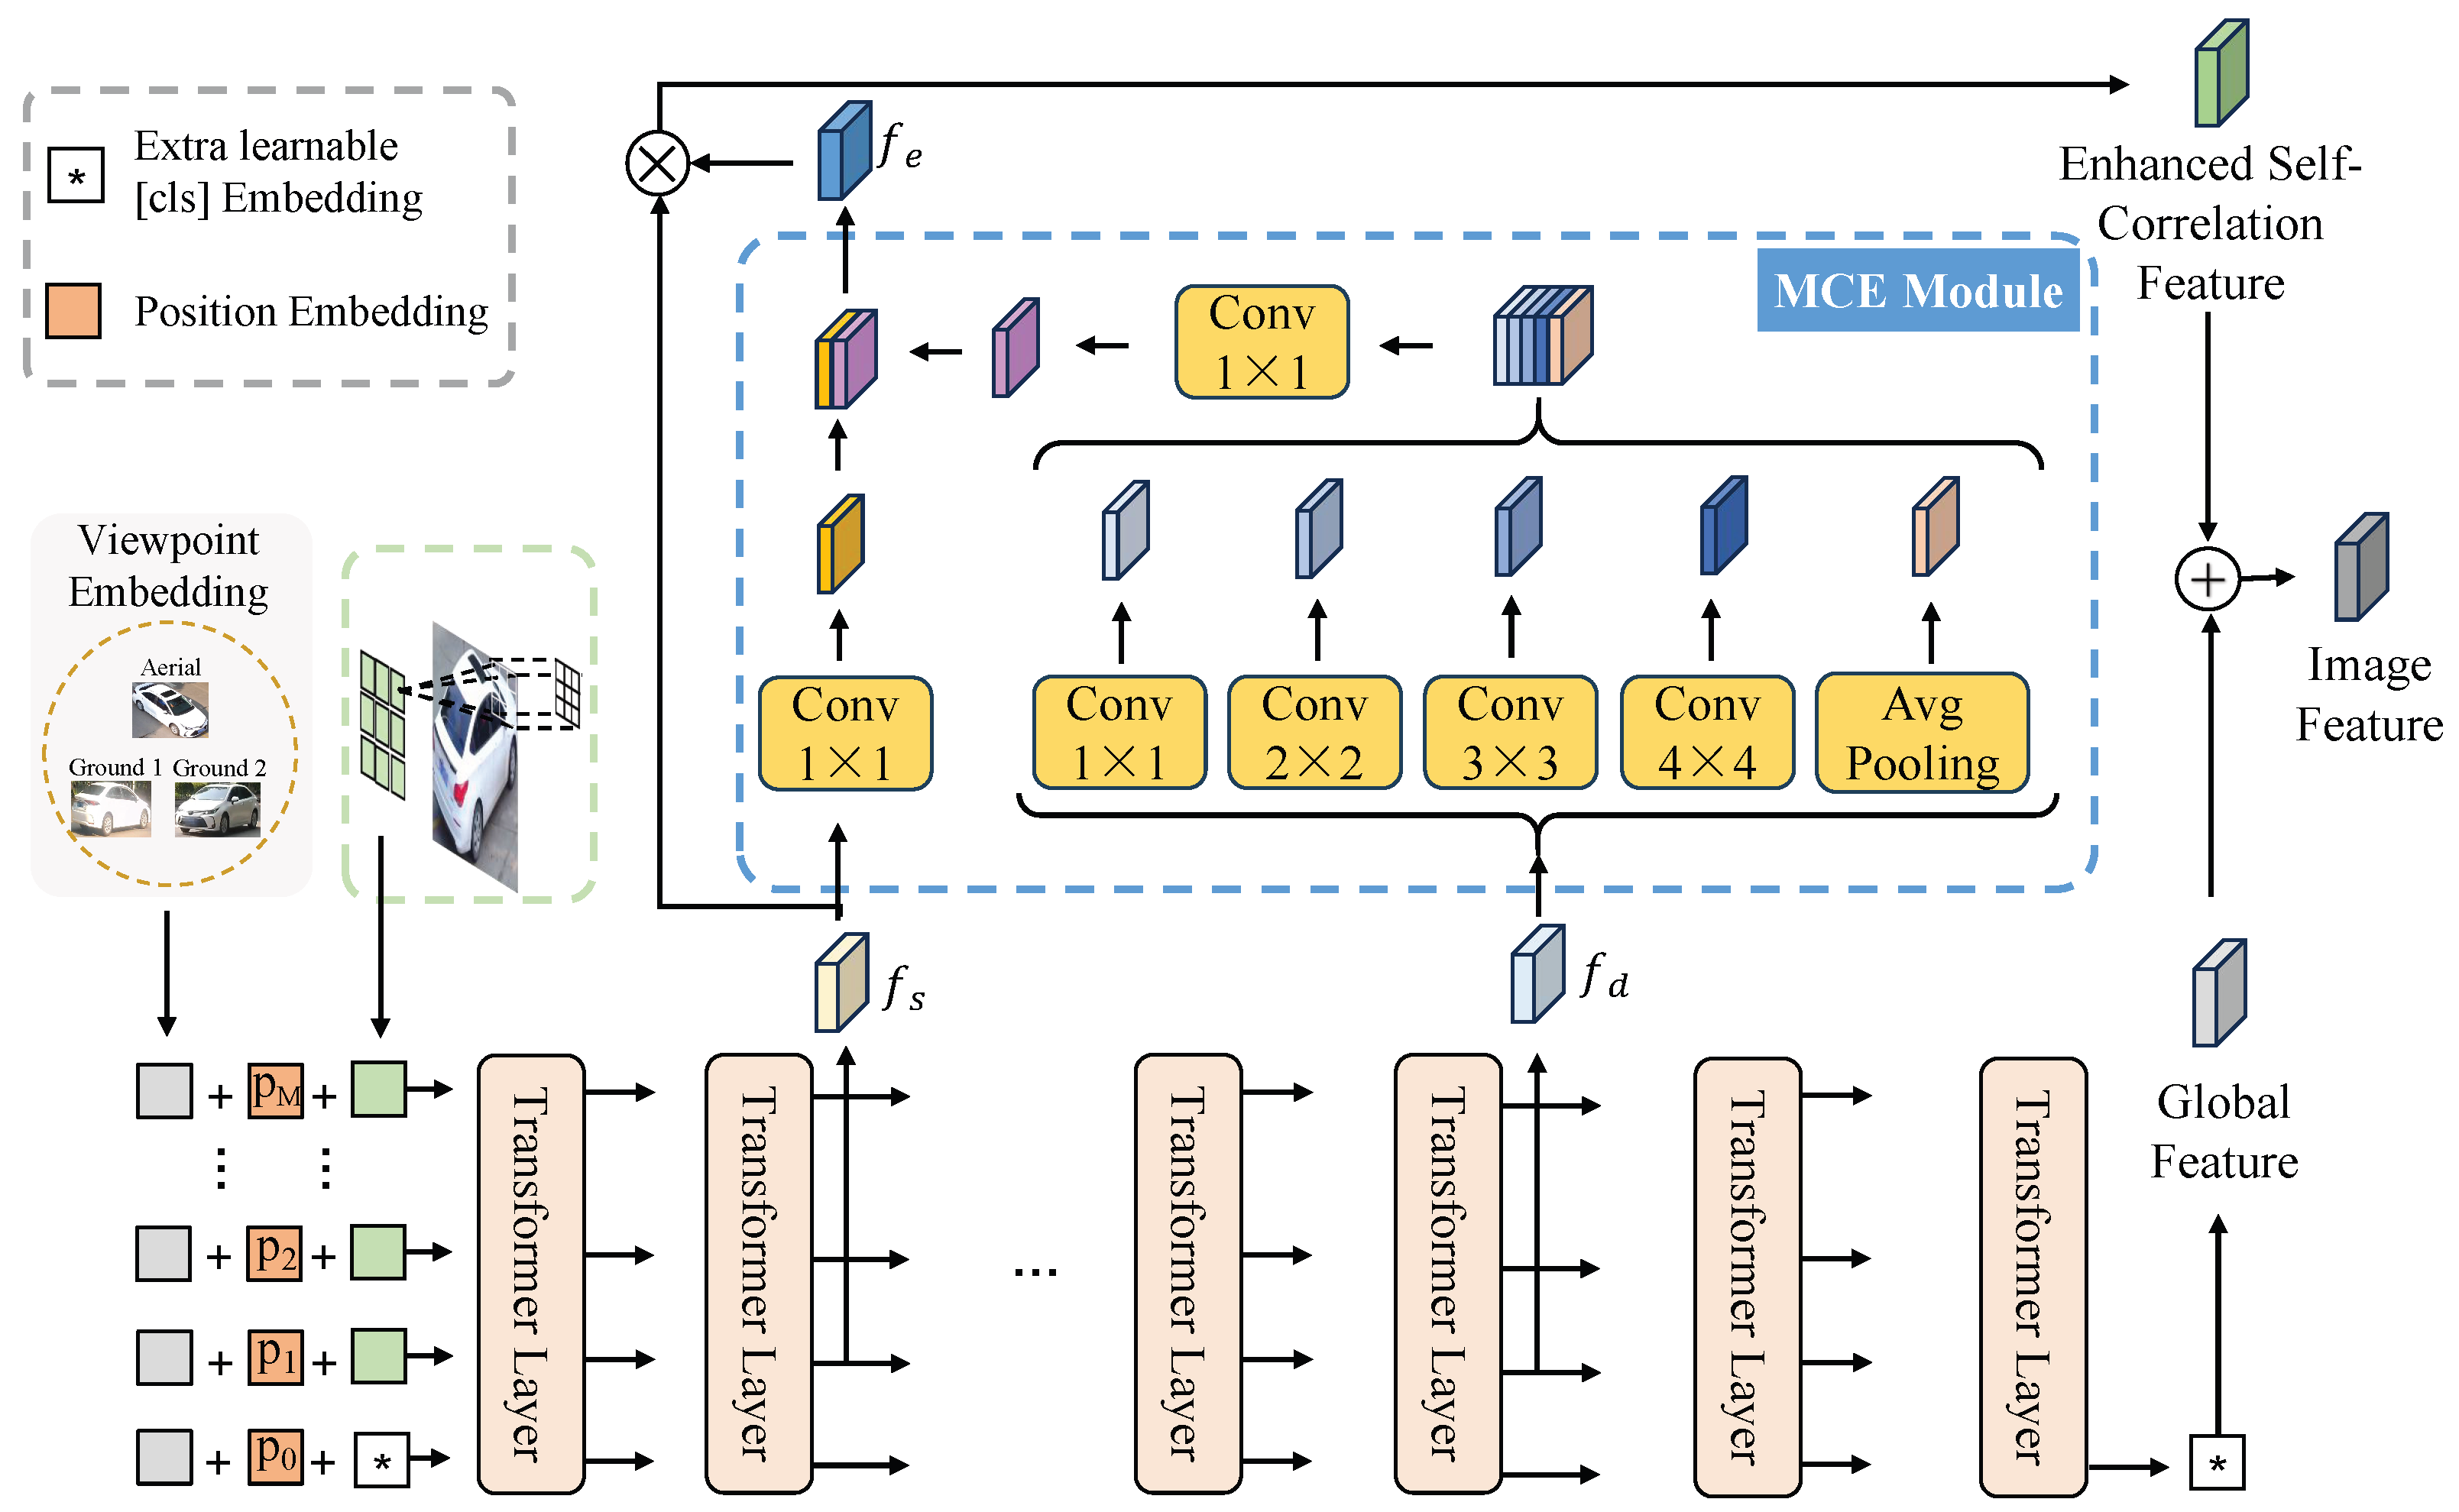
4.1. Overview
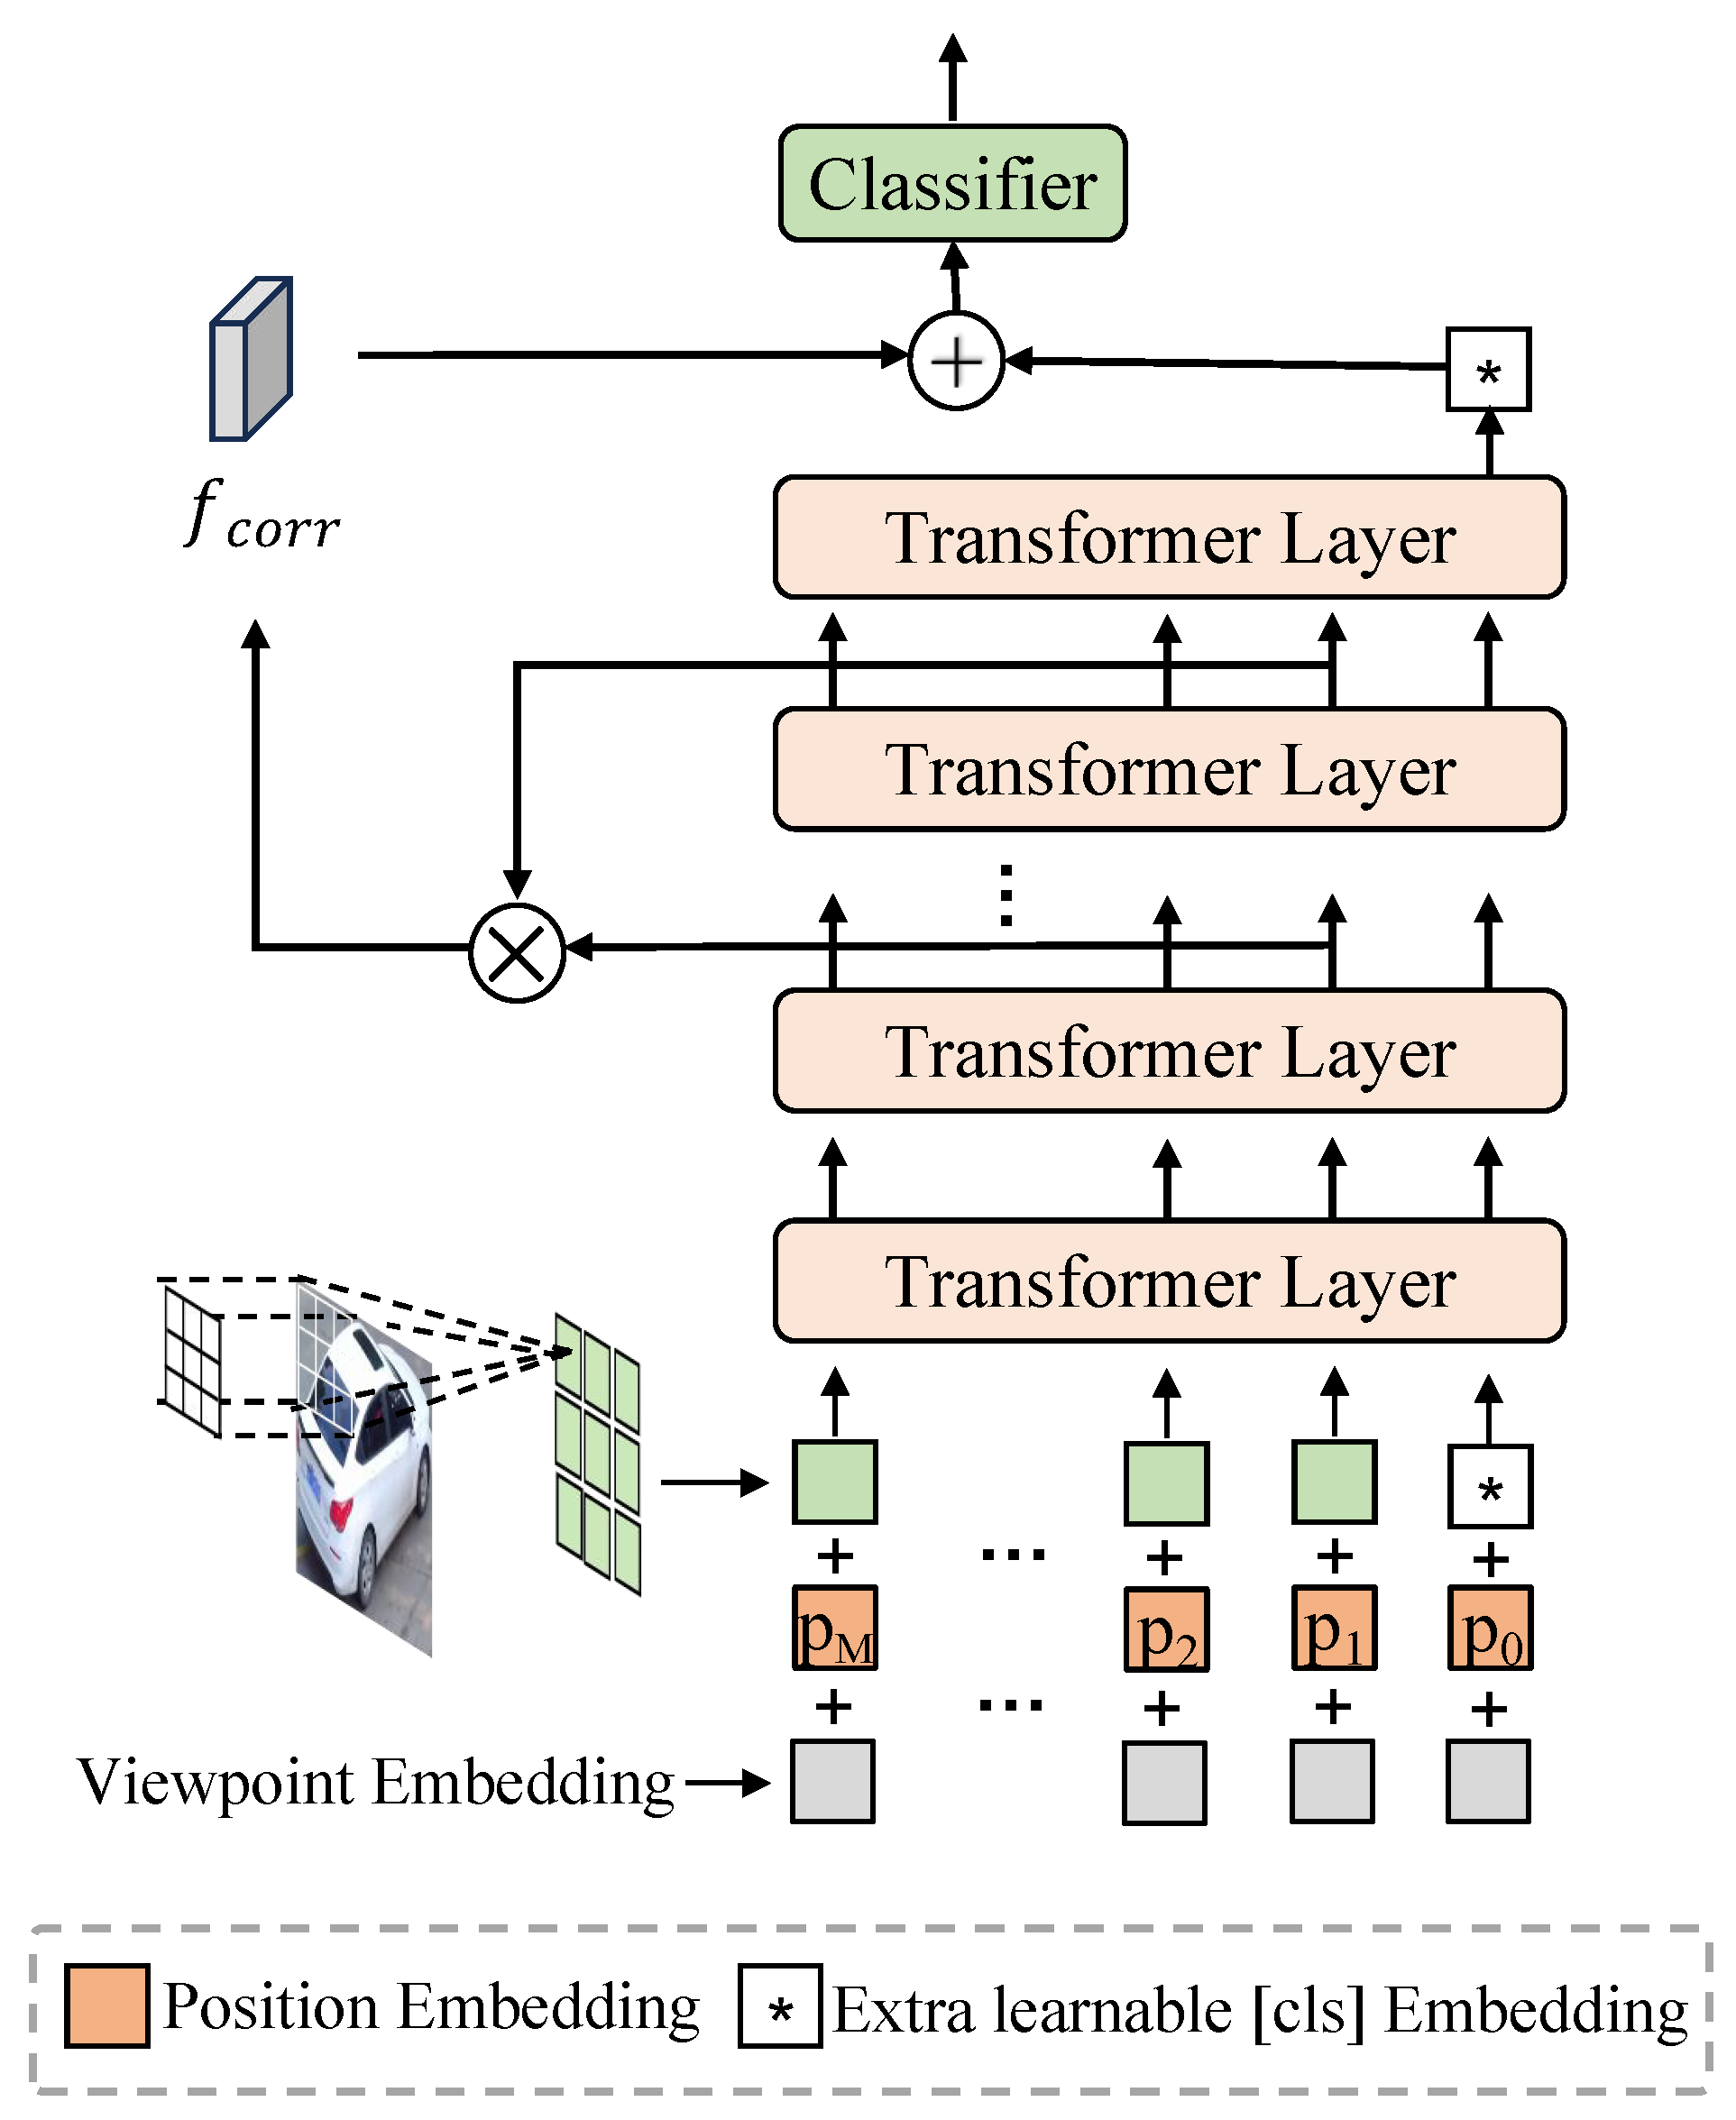
4.2. Self-Correlation Feature Computation Method
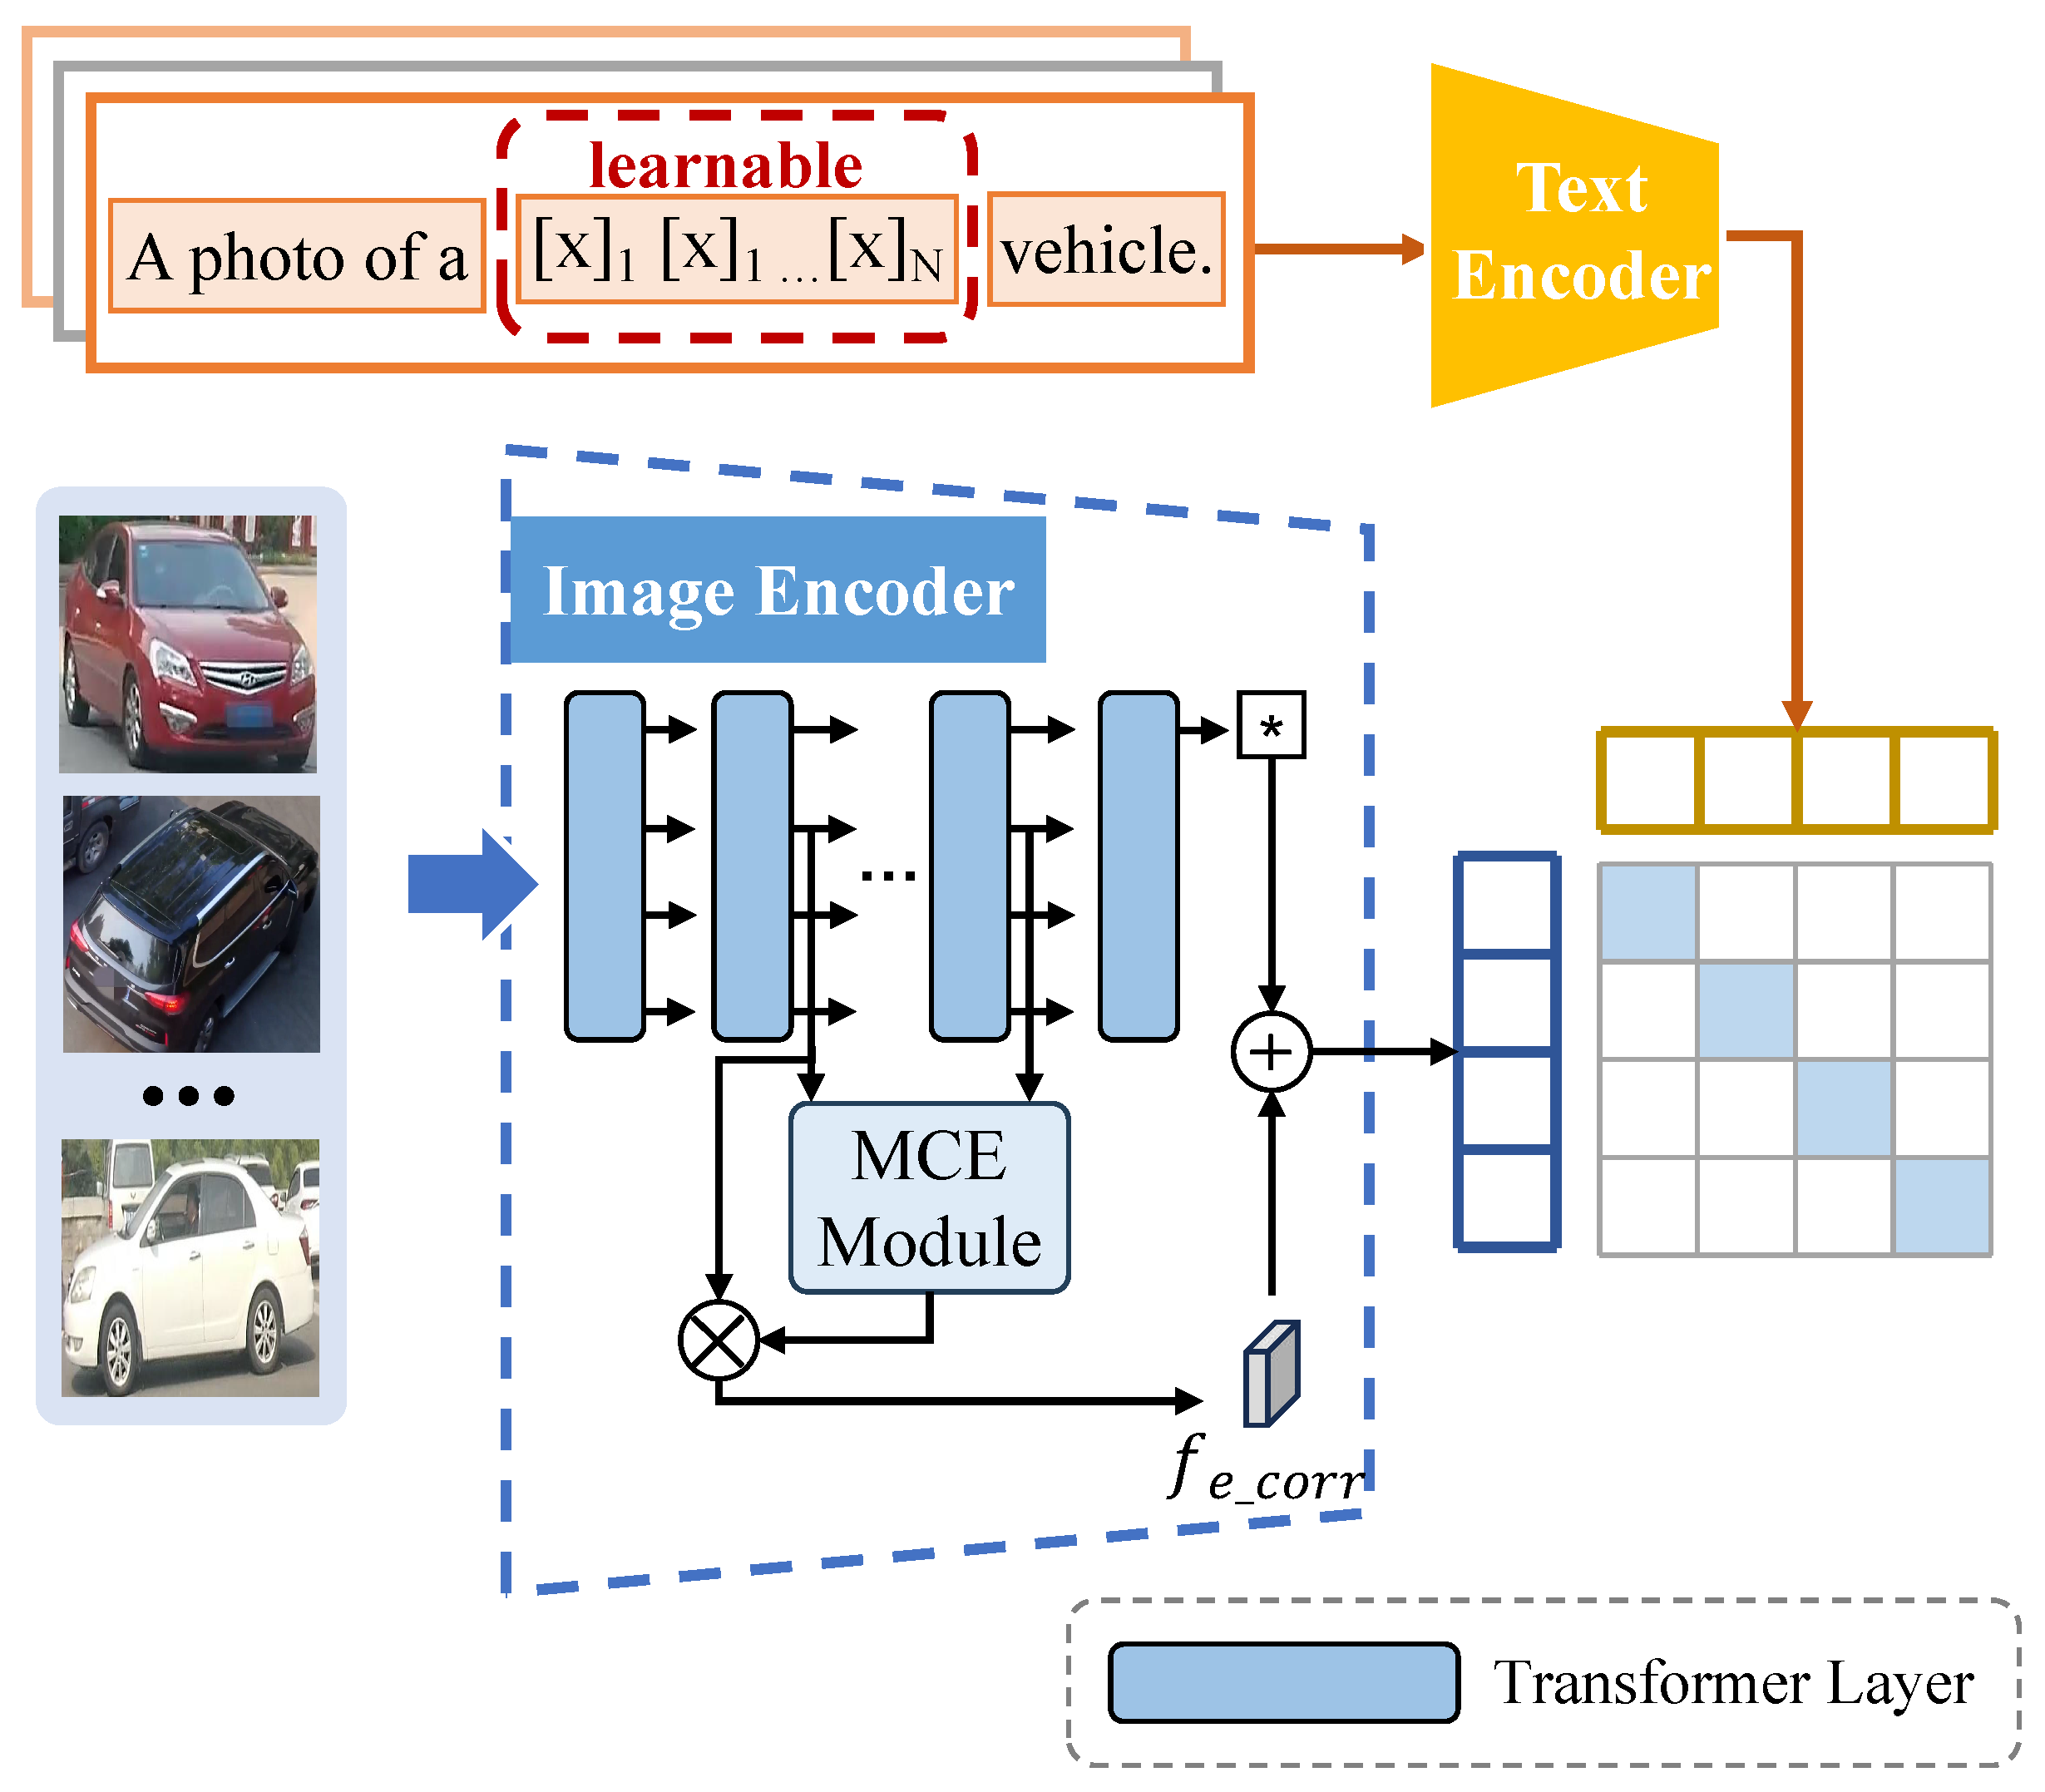
4.3. Multi-Scale Convolutional Enhancement Module
4.4. Overall Training
4.5. Computational Complexity
5. Experiments
5.1. Datasets
5.2. Implementation Details
5.3. Comparison on AGID Datasets
5.4. Comparison on General Re-ID Datasets
5.5. Ablation Studies and Analysis
5.5.1. Ablation Study of SFC and MCE
5.5.2. Visualization of Enhanced Self-Correlation Features
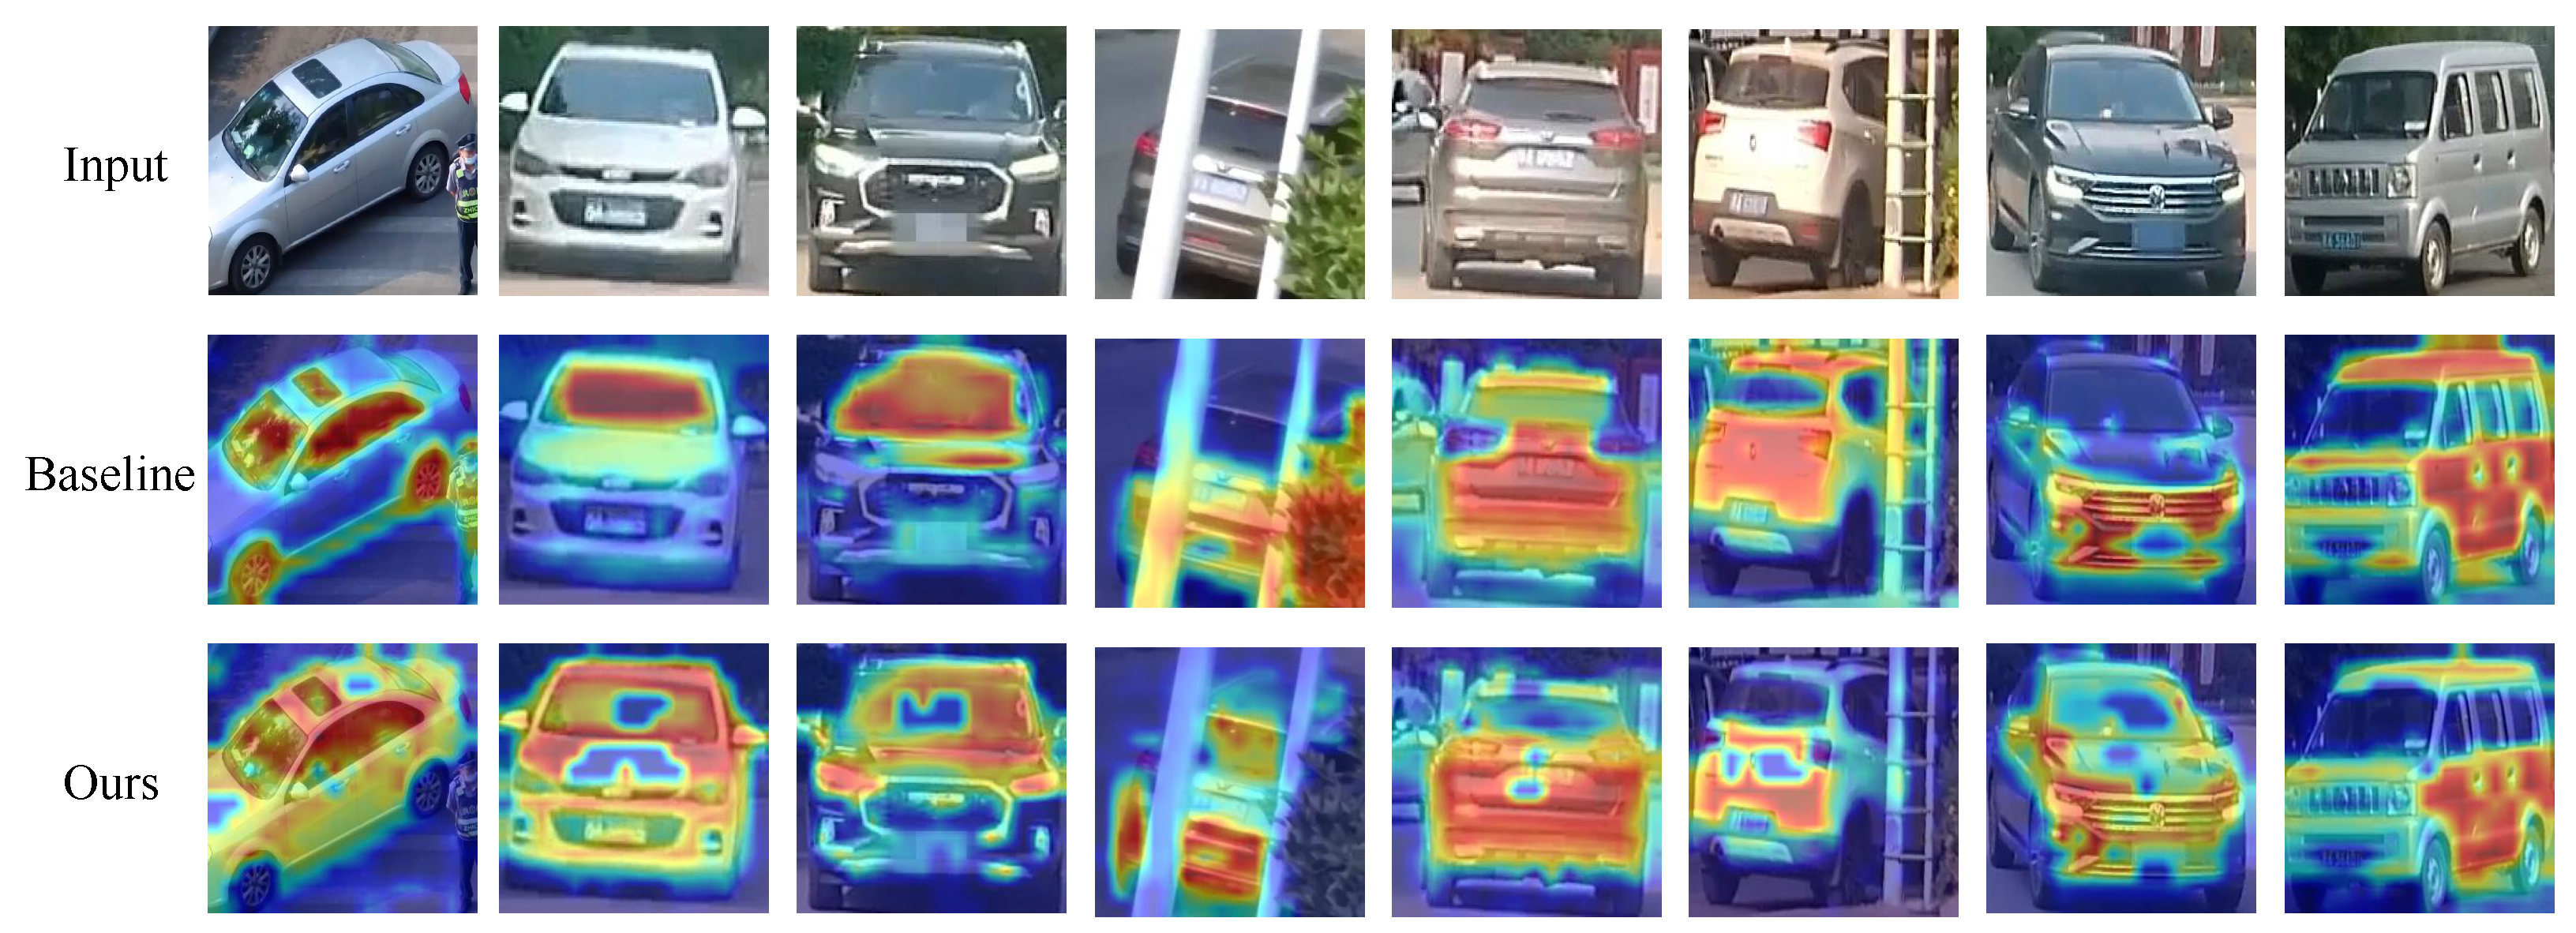
5.5.3. Visualization of Attention Maps
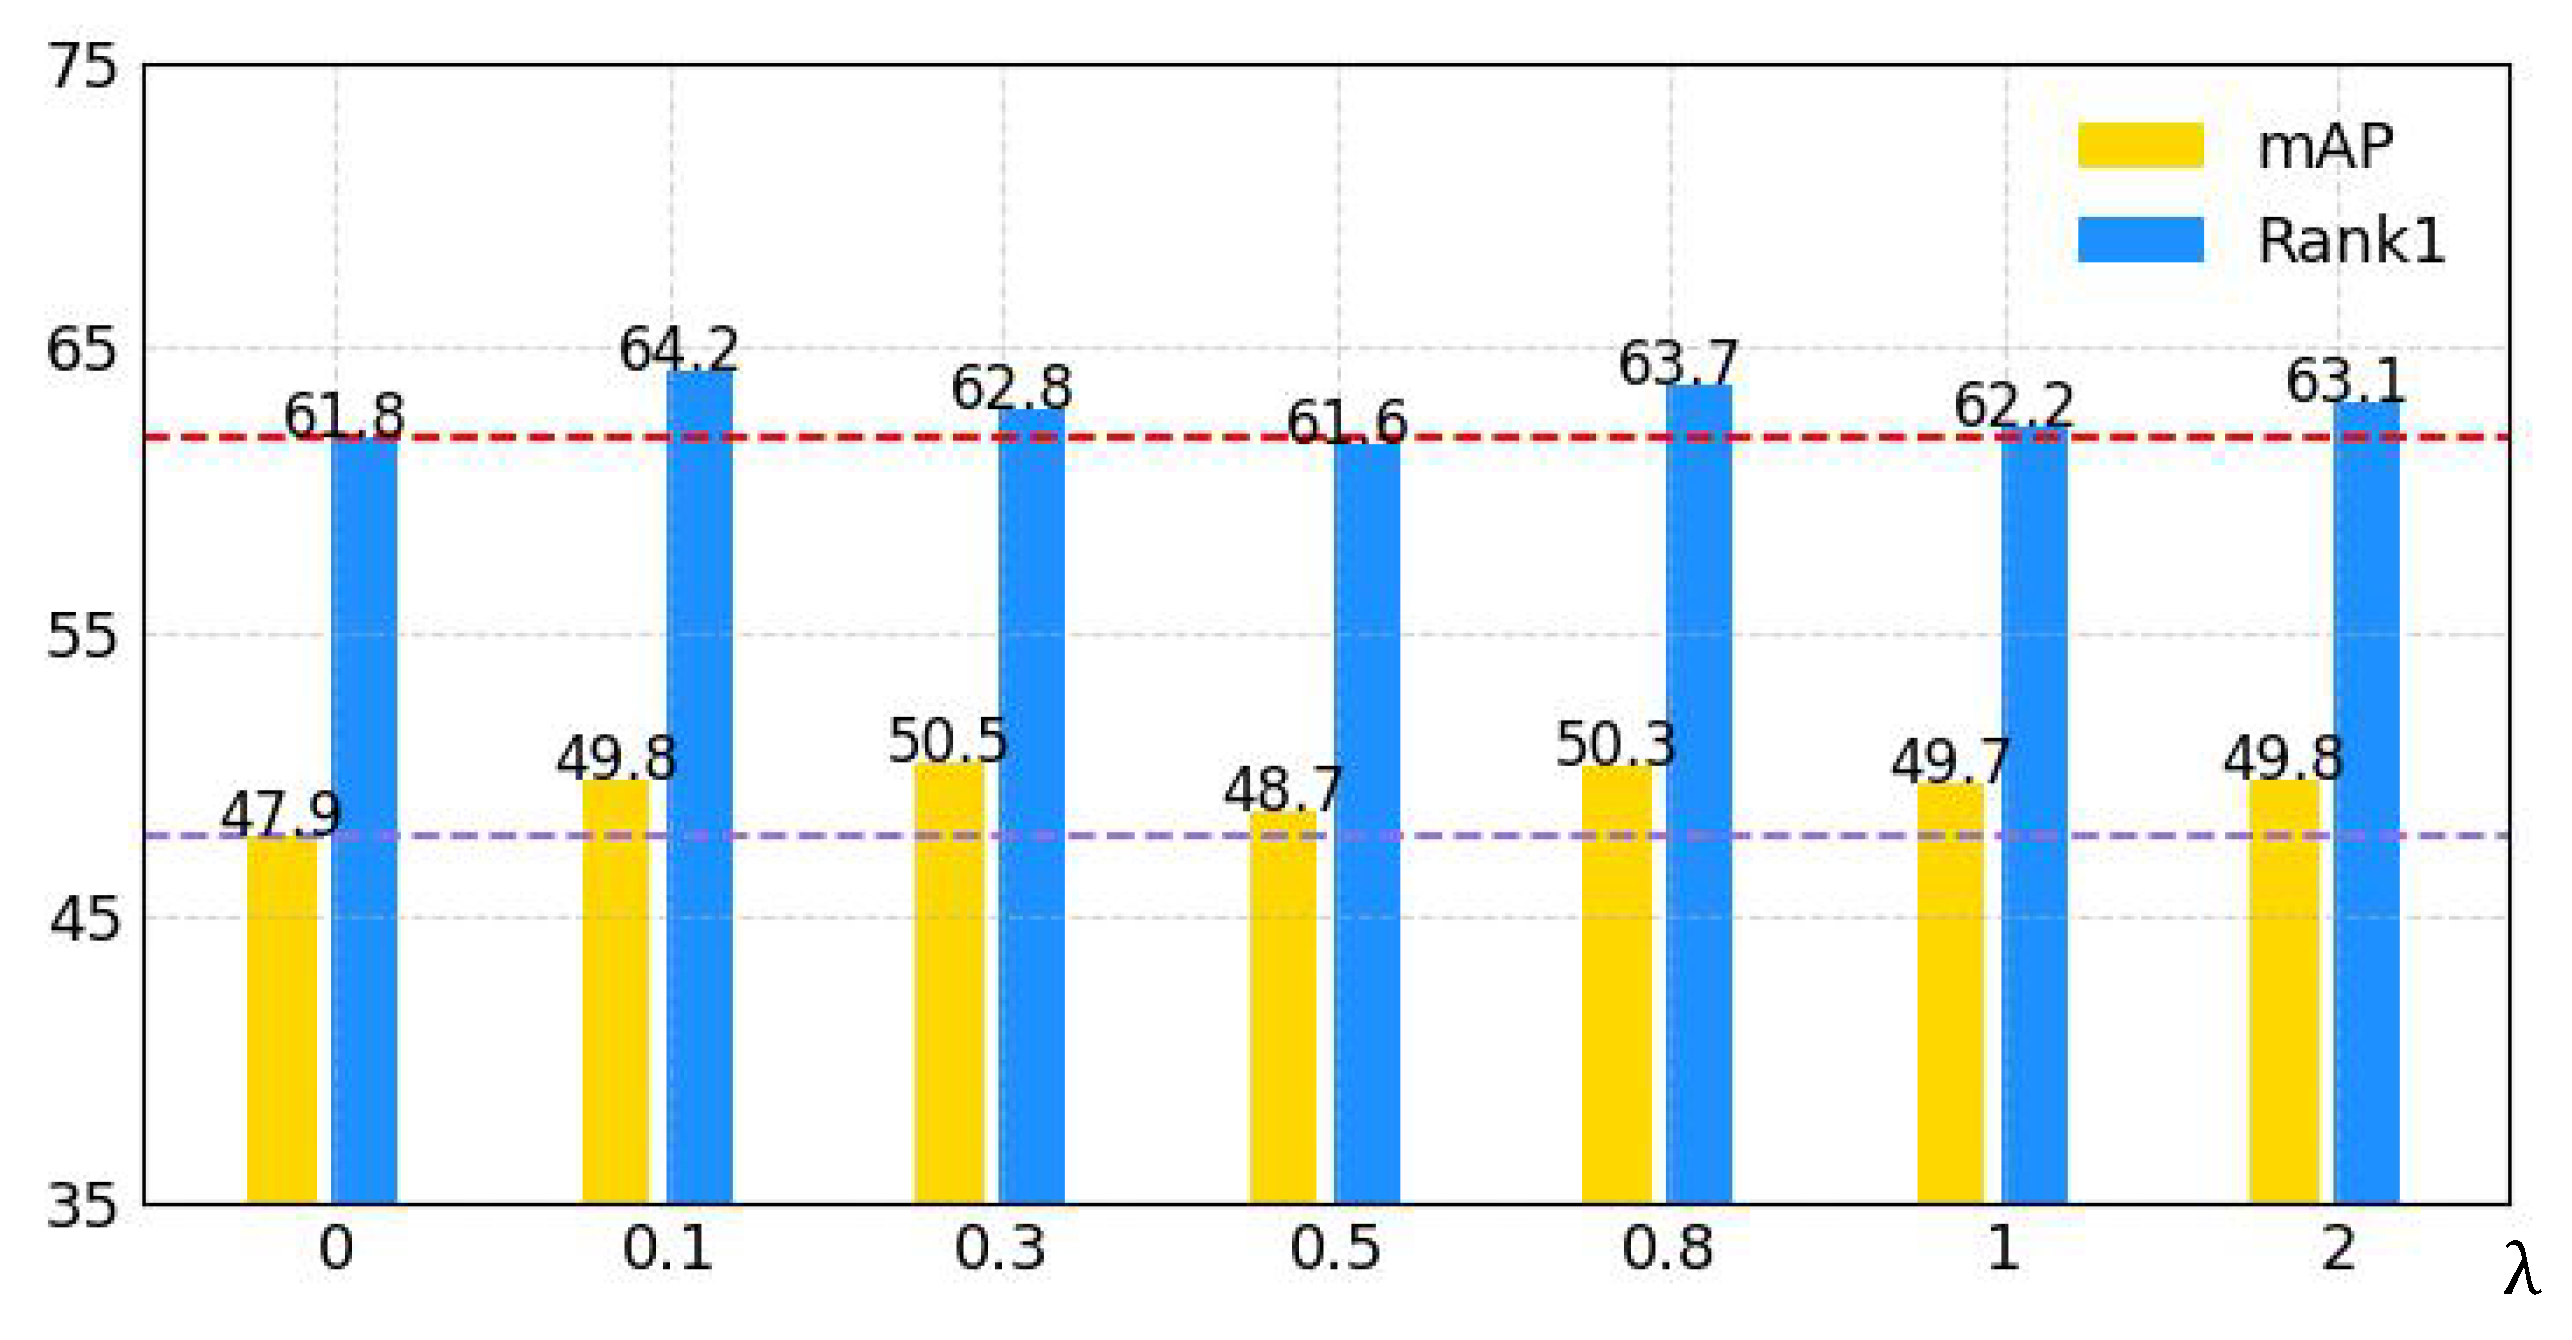
5.5.4. Ablation Study of
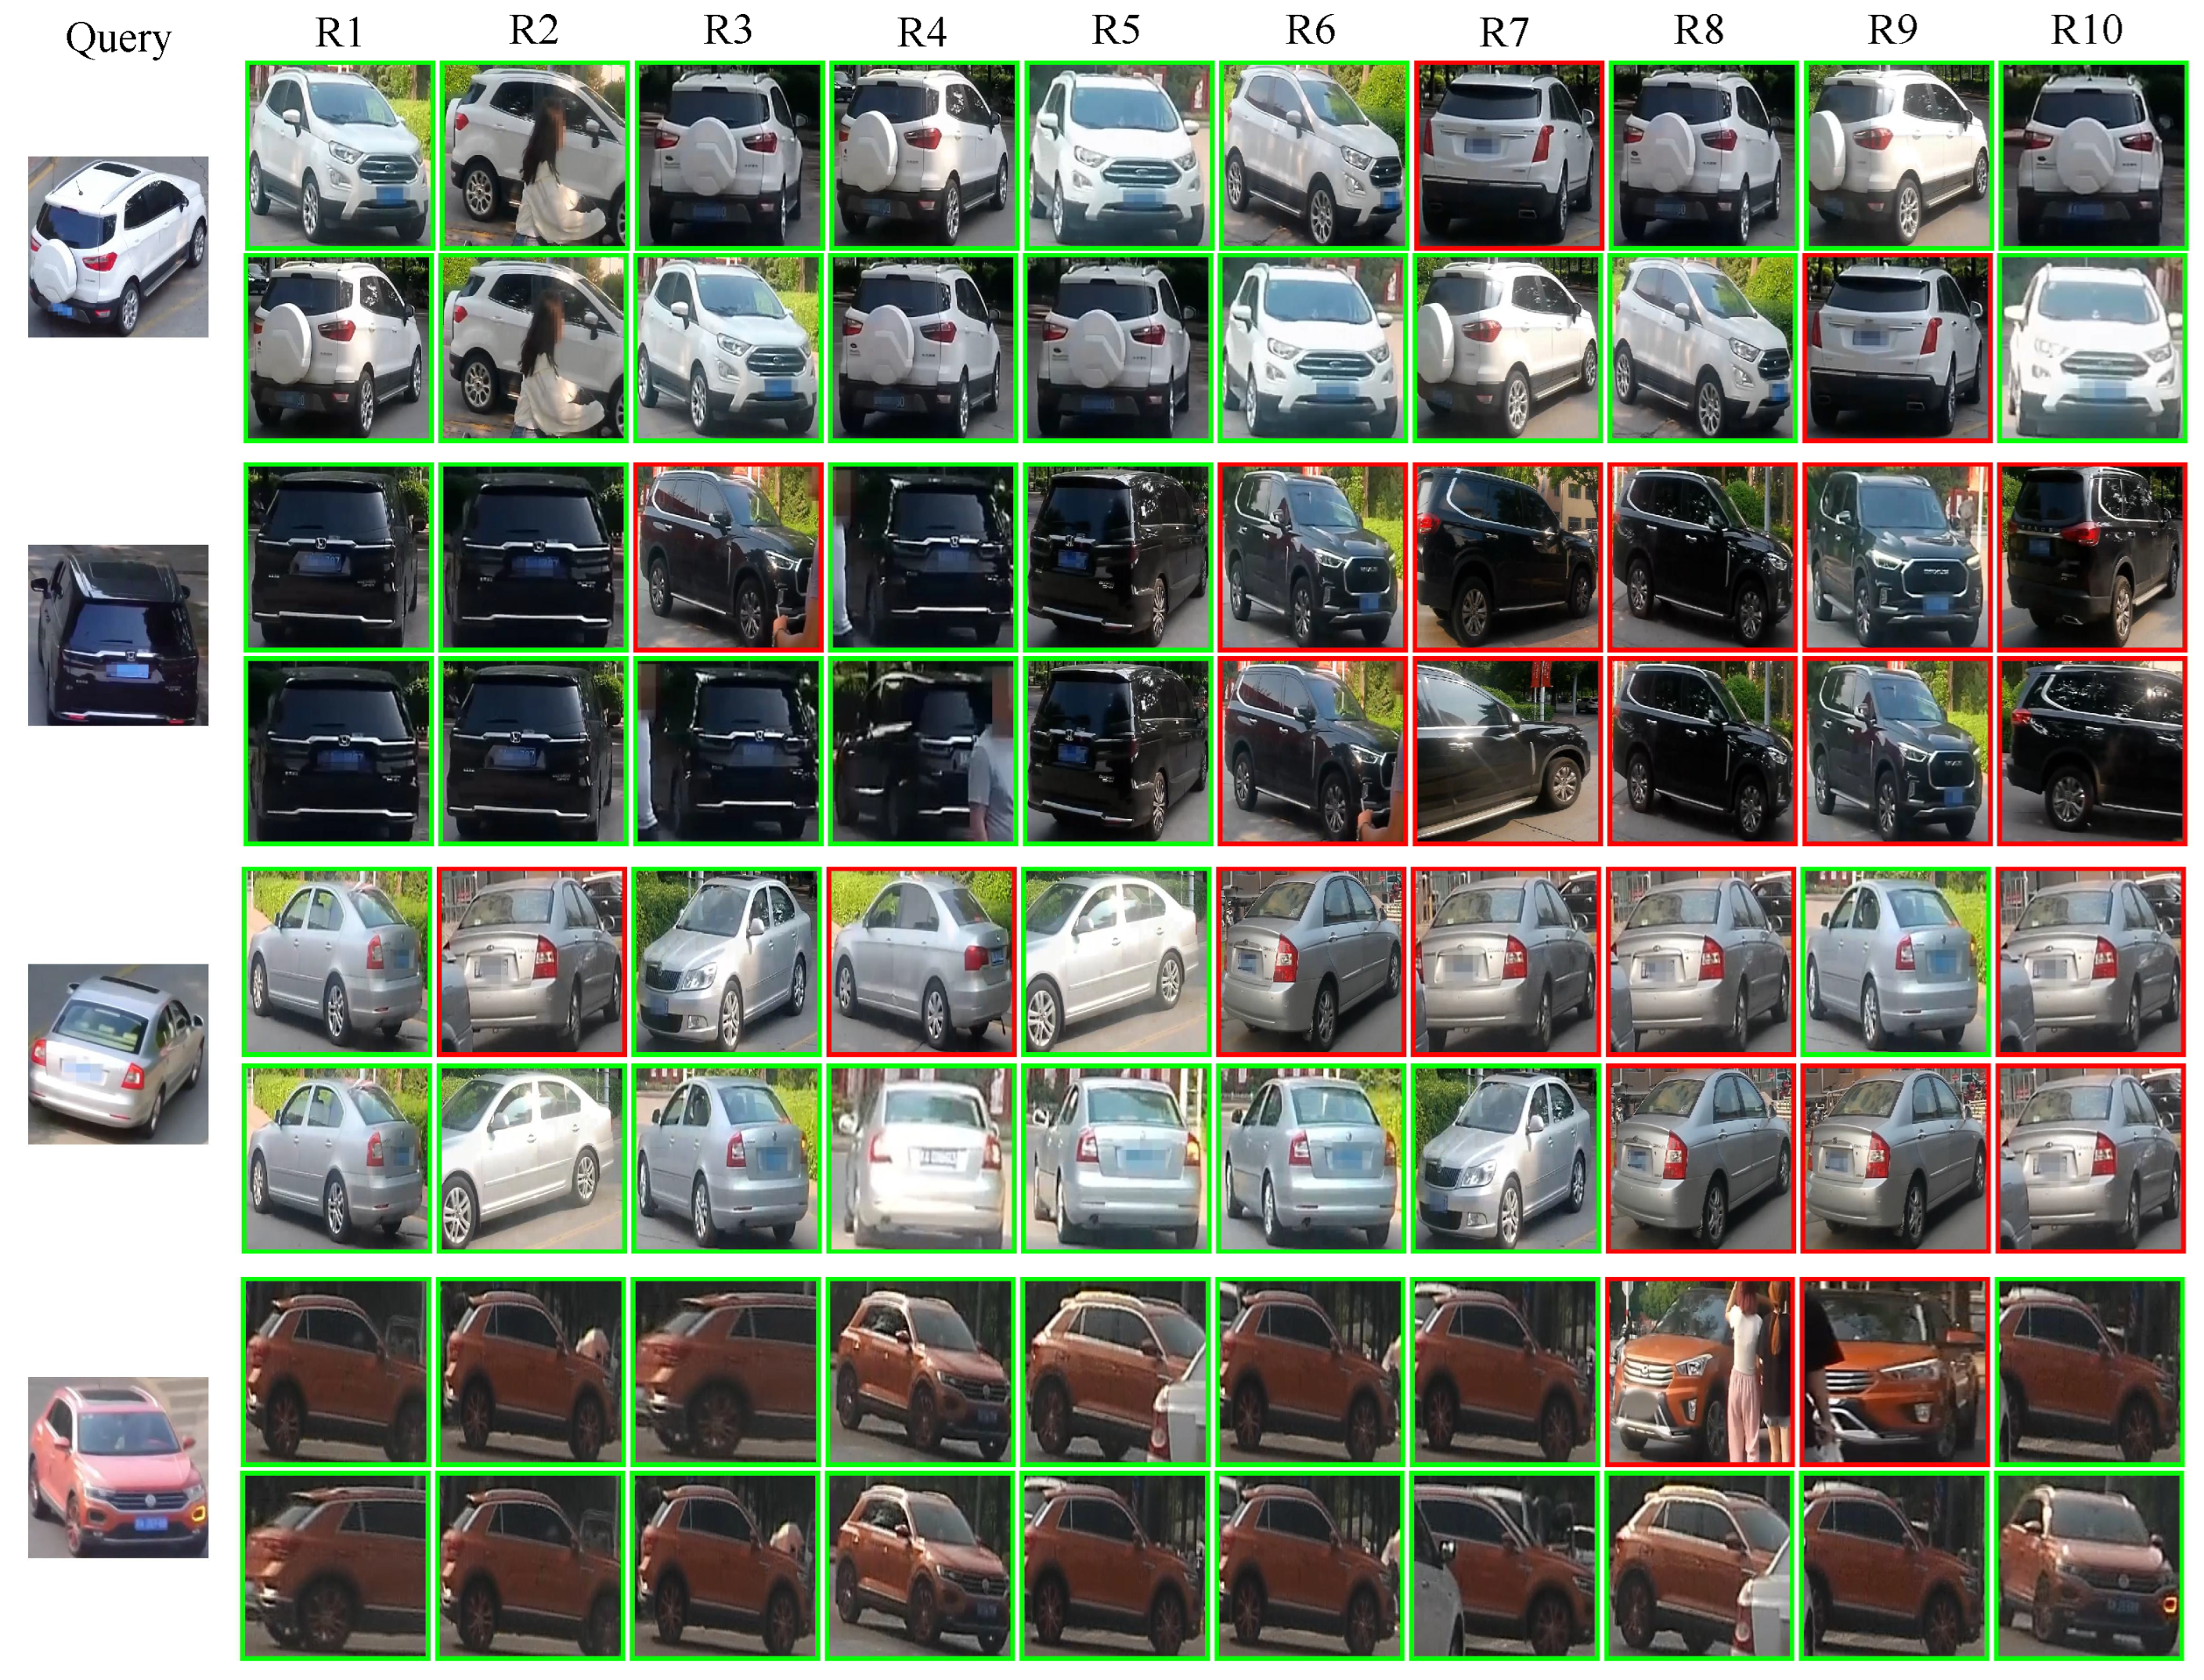
5.5.5. Visualization of Rank List
5.6. Computational Efficiency Analysis
6. Conclusions
Author Contributions
Funding
Data Availability Statement
Conflicts of Interest
References
- Shen, B.; Zhang, R.; Chen, H. An adaptively attention-driven cascade part-based graph embedding framework for UAV object re-identification. Remote Sens. 2022, 14, 1436. [Google Scholar] [CrossRef]
- Lu, M.; Xu, Y.; Li, H. Vehicle re-identification based on UAV viewpoint: Dataset and method. Remote Sens. 2022, 14, 4603. [Google Scholar] [CrossRef]
- Sheng, H.; Wang, S.; Chen, H.; Yang, D.; Huang, Y.; Shen, J.; Ke, W. Discriminative feature learning with co-occurrence attention network for vehicle ReID. IEEE Trans. Circuits Syst. Video Technol. 2023, 34, 3510–3522. [Google Scholar] [CrossRef]
- Guo, H.; Zhu, K.; Tang, M.; Wang, J. Two-level attention network with multi-grain ranking loss for vehicle re-identification. IEEE Trans. Image Process. 2019, 28, 4328–4338. [Google Scholar] [CrossRef]
- Zhou, X.; Zhong, Y.; Cheng, Z.; Liang, F.; Ma, L. Adaptive sparse pairwise loss for object re-identification. In Proceedings of the IEEE/CVF Conference on Computer Vision and Pattern Recognition, Vancouver, Canada, 18–22 June 2023; pp. 19691–19701. [Google Scholar]
- Gu, J.; Wang, K.; Luo, H.; Chen, C.; Jiang, W.; Fang, Y.; Zhang, S.; You, Y.; Zhao, J. Msinet: Twins contrastive search of multi-scale interaction for object reid. In Proceedings of the IEEE/CVF Conference on Computer Vision and Pattern Recognition, Vancouver, Canada, 18–22 June 2023; pp. 19243–19253. [Google Scholar]
- Yao, Y.; Gedeon, T.; Zheng, L. Large-scale training data search for object re-identification. In Proceedings of the IEEE/CVF Conference on Computer Vision and Pattern Recognition, Vancouver, Canada, 18–22 June 2023; pp. 15568–15578. [Google Scholar]
- Rao, Y.; Chen, G.; Lu, J.; Zhou, J. Counterfactual attention learning for fine-grained visual categorization and re-identification. In Proceedings of the IEEE/CVF International Conference on Computer Vision, Montreal, Canada, 11–17 October 2021; pp. 1025–1034. [Google Scholar]
- Zhang, C.; Yang, C.; Wu, D.; Dong, H.; Deng, B. Cross-view vehicle re-identification based on graph matching. Appl. Intell. 2022, 52, 14799–14810. [Google Scholar] [CrossRef]
- Yan, C.; Pang, G.; Wang, L.; Jiao, J.; Feng, X.; Shen, C.; Li, J. BV-person: A large-scale dataset for bird-view person re-identification. In Proceedings of the IEEE/CVF International Conference on Computer Vision, Montreal, Canada, 11–17 October 2021; pp. 10943–10952. [Google Scholar]
- Yu, Z.; Pei, J.; Zhu, M.; Zhang, J.; Li, J. Multi-attribute adaptive aggregation transformer for vehicle re-identification. Inf. Process. Manag. 2022, 59, 102868. [Google Scholar] [CrossRef]
- Lou, Y.; Bai, Y.; Liu, J.; Wang, S.; Duan, L. Veri-wild: A large dataset and a new method for vehicle re-identification in the wild. In Proceedings of the IEEE/CVF Conference on Computer Vision and Pattern Recognition, Long Beach, CA, USA, 16–20 June 2019; pp. 3235–3243. [Google Scholar]
- Li, H.; Chen, J.; Zheng, A.; Wu, Y.; Luo, Y. Day-Night Cross-domain Vehicle Re-identification. In Proceedings of the IEEE/CVF Conference on Computer Vision and Pattern Recognition, Seattle, Washington, USA, 17–21 June 2024; pp. 12626–12635. [Google Scholar]
- Liu, H.; Tian, Y.; Yang, Y.; Pang, L.; Huang, T. Deep relative distance learning: Tell the difference between similar vehicles. In Proceedings of the IEEE Conference on Computer Vision and Pattern Recognition, Las Vegas, NV, USA, 27–30 June 2016; pp. 2167–2175. [Google Scholar]
- Liu, X.; Liu, W.; Mei, T.; Ma, H. A deep learning-based approach to progressive vehicle re-identification for urban surveillance. In Proceedings of the European Conference on Computer Vision, Amsterdam, The Netherlands, 8–16 October 2016; pp. 869–884. [Google Scholar]
- Lin, T.Y.; Cui, Y.; Belongie, S.; Hays, J. Learning deep representations for ground-to-aerial geolocalization. In Proceedings of the IEEE Conference on Computer Vision and Pattern Recognition, Boston, MA, USA, 7–12 June 2015; pp. 5007–5015. [Google Scholar]
- Liu, L.; Li, H. Lending orientation to neural networks for cross-view geo-localization. In Proceedings of the IEEE/CVF Conference on Computer Vision and Pattern Recognition, Long Beach, CA, USA, 16–20 June 2019; pp. 5624–5633. [Google Scholar]
- Dudczyk, J.; Rybak, Ł. Application of data particle geometrical divide algorithms in the process of radar signal recognition. Sensors 2023, 23, 8183. [Google Scholar] [CrossRef]
- Sun, Z.; Nie, X.; Xi, X.; Yin, Y. CFVMNet: A multi-branch network for vehicle re-identification based on common field of view. In Proceedings of the 28th ACM International Conference on Multimedia, Online, 12–16 October 2020; pp. 3523–3531. [Google Scholar]
- Shen, F.; Zhu, J.; Zhu, X.; Xie, Y.; Huang, J. Exploring spatial significance via hybrid pyramidal graph network for vehicle re-identification. IEEE Trans. Intell. Transp. Syst. 2021, 23, 8793–8804. [Google Scholar] [CrossRef]
- Ye, M.; Chen, S.; Li, C.; Zheng, W.S.; Crandall, D.; Du, B. Transformer for object re-identification: A survey. Int. J. Comput. Vis. 2025, 133, 2410–2440. [Google Scholar] [CrossRef]
- He, S.; Luo, H.; Wang, P.; Wang, F.; Li, H.; Jiang, W. Transreid: Transformer-based object re-identification. In Proceedings of the IEEE/CVF International Conference on Computer Vision, Montreal, Canada, 11–17 October 2021; pp. 15013–15022. [Google Scholar]
- Qian, W.; Luo, H.; Peng, S.; Wang, F.; Chen, C.; Li, H. Unstructured feature decoupling for vehicle re-identification. In Proceedings of the European Conference on Computer Vision, Tel Aviv, Israel, 23–27 October 2022; pp. 336–353. [Google Scholar]
- Shen, F.; Xie, Y.; Zhu, J.; Zhu, X.; Zeng, H. Git: Graph interactive transformer for vehicle re-identification. IEEE Trans. Image Process. 2023, 32, 1039–1051. [Google Scholar] [CrossRef]
- Wei, R.; Gu, J.; He, S.; Jiang, W. Transformer-Based Domain-Specific Representation for Unsupervised Domain Adaptive Vehicle Re-Identification. IEEE Trans. Intell. Transp. Syst. 2022, 24, 2935–2946. [Google Scholar] [CrossRef]
- Zhu, H.; Ke, W.; Li, D.; Liu, J.; Tian, L.; Shan, Y. Dual cross-attention learning for fine-grained visual categorization and object re-identification. In Proceedings of the IEEE/CVF Conference on Computer Vision and Pattern Recognition, New Orleans, LA, USA, 19–24 June 2022; pp. 4692–4702. [Google Scholar]
- Shen, F.; Zhu, J.; Zhu, X.; Huang, J.; Zeng, H.; Lei, Z.; Cai, C. An efficient multiresolution network for vehicle reidentification. IEEE Internet Things J. 2021, 9, 9049–9059. [Google Scholar] [CrossRef]
- Shen, Y.; Xiao, T.; Li, H.; Yi, S.; Wang, X. Learning deep neural networks for vehicle re-id with visual-spatio-temporal path proposals. In Proceedings of the IEEE International Conference on Computer Vision, Venice, Italy, 22–29 October 2017; pp. 1900–1909. [Google Scholar]
- Wang, Z.; Tang, L.; Liu, X.; Yao, Z.; Yi, S.; Shao, J.; Yan, J.; Wang, S.; Li, H.; Wang, X. Orientation invariant feature embedding and spatial temporal regularization for vehicle re-identification. In Proceedings of the IEEE International Conference on Computer Vision, Venice, Italy, 22–29 October 2017; pp. 379–387. [Google Scholar]
- Zhou, Y.; Shao, L. Cross-view GAN based vehicle generation for re-identification. In Proceedings of the British Machine Vision Conference (BMVC), London, UK, 4–7 September 2017; Volume 1, pp. 1–12. [Google Scholar]
- Goodfellow, I.; Pouget-Abadie, J.; Mirza, M.; Xu, B.; Warde-Farley, D.; Ozair, S.; Courville, A.; Bengio, Y. Generative adversarial networks. Commun. ACM 2020, 63, 139–144. [Google Scholar] [CrossRef]
- He, K.; Zhang, X.; Ren, S.; Sun, J. Deep residual learning for image recognition. In Proceedings of the IEEE Conference on Computer Vision and Pattern Recognition, Las Vegas, NV, USA, 27–30 June 2016; pp. 770–778. [Google Scholar]
- Lin, T.Y.; Dollár, P.; Girshick, R.; He, K.; Hariharan, B.; Belongie, S. Feature pyramid networks for object detection. In Proceedings of the IEEE Conference on Computer Vision and Pattern Recognition, Honolulu, HI, USA, 21–26 July 2017; pp. 2117–2125. [Google Scholar]
- Dosovitskiy, A.; Beyer, L.; Kolesnikov, A.; Weissenborn, D.; Zhai, X.; Unterthiner, T.; Dehghani, M.; Minderer, M.; Heigold, G.; Gelly, S.; et al. An image is worth 16 × 16 words: Transformers for image recognition at scale. arXiv 2020, arXiv:2010.11929. [Google Scholar]
- He, B.; Li, J.; Zhao, Y.; Tian, Y. Part-regularized near-duplicate vehicle re-identification. In Proceedings of the IEEE/CVF Conference on Computer Vision and Pattern Recognition, Long Beach, CA, USA, 16–20 June 2019; pp. 3997–4005. [Google Scholar]
- Khorramshahi, P.; Peri, N.; Chen, J.C.; Chellappa, R. The devil is in the details: Self-supervised attention for vehicle re-identification. In Proceedings of the European Conference on Computer Vision, Online, 23–28 August 2020; pp. 369–386. [Google Scholar]
- Zhao, J.; Zhao, Y.; Li, J.; Yan, K.; Tian, Y. Heterogeneous relational complement for vehicle re-identification. In Proceedings of the IEEE/CVF International Conference on Computer Vision, Montreal, Canada, 11–17 October 2021; pp. 205–214. [Google Scholar]
- Liu, X.; Liu, W.; Mei, T.; Ma, H. Provid: Progressive and multimodal vehicle reidentification for large-scale urban surveillance. IEEE Trans. Multimed. 2017, 20, 645–658. [Google Scholar] [CrossRef]
- Liu, X.; Liu, W.; Ma, H.; Fu, H. Large-scale vehicle re-identification in urban surveillance videos. In Proceedings of the IEEE International Conference on Multimedia and Expo, Seattle, WA, USA, 11–15 July 2016; pp. 1–6. [Google Scholar]
- Li, Z.Y.; Gao, S.; Cheng, M.M. Sere: Exploring feature self-relation for self-supervised transformer. IEEE Trans. Pattern Anal. Mach. Intell. 2023, 45, 15619–15631. [Google Scholar] [CrossRef]
- Sun, B.; Yang, Y.; Zhang, L.; Cheng, M.M.; Hou, Q. Corrmatch: Label propagation via correlation matching for semi-supervised semantic segmentation. In Proceedings of the IEEE/CVF Conference on Computer Vision and Pattern Recognition, Seattle, WA, USA, 17–21 June 2024; pp. 3097–3107. [Google Scholar]
- Li, S.; Sun, L.; Li, Q. Clip-reid: Exploiting vision-language model for image re-identification without concrete text labels. In Proceedings of the AAAI Conference on Artificial Intelligence, Washington, DC, USA, 7–14 February 2023; Volume 37, pp. 1405–1413. [Google Scholar]
- Ye, M.; Shen, J.; Lin, G.; Xiang, T.; Shao, L.; Hoi, S.C. Deep learning for person re-identification: A survey and outlook. IEEE Trans. Pattern Anal. Mach. Intell. 2021, 44, 2872–2893. [Google Scholar] [CrossRef]
- Luo, H.; Gu, Y.; Liao, X.; Lai, S.; Jiang, W. Bag of tricks and a strong baseline for deep person re-identification. In Proceedings of the IEEE/CVF Conference on Computer Vision and Pattern Recognition Workshops, Long Beach, CA, USA, 16–20 June 2019. [Google Scholar]
- Wang, G.; Yuan, Y.; Chen, X.; Li, J.; Zhou, X. Learning Discriminative Features with Multiple Granularities for Person Re-Identification. In Proceedings of the 26th ACM International Conference on Multimedia, Seoul, South Korea, 22–26 October 2018; pp. 274–282. [Google Scholar]
- Qian, J.; Jiang, W.; Luo, H.; Yu, H. Stripe-based and attribute-aware network: A two-branch deep model for vehicle re-identification. Meas. Sci. Technol. 2020, 31, 095401. [Google Scholar] [CrossRef]
- Jin, X.; Lan, C.; Zeng, W.; Chen, Z. Uncertainty-aware multi-shot knowledge distillation for image-based object re-identification. In Proceedings of the AAAI Conference on Artificial Intelligence, New York Hilton Midtown, New York City, NY, USA, 7–12 February 2020; Volume 34, pp. 11165–11172. [Google Scholar]
- Chu, R.; Sun, Y.; Li, Y.; Liu, Z.; Zhang, C.; Wei, Y. Vehicle re-identification with viewpoint-aware metric learning. In Proceedings of the IEEE/CVF International Conference on Computer Vision, Seoul, South Korea, 27 October–2 November 2019; pp. 8282–8291. [Google Scholar]
- Chen, T.S.; Liu, C.T.; Wu, C.W.; Chien, S.Y. Orientation-aware vehicle re-identification with semantics-guided part attention network. In Proceedings of the European Conference on Computer Vision, Online, 23–28 August 2020; pp. 330–346. [Google Scholar]
- Zhang, X.; Zhang, R.; Cao, J.; Gong, D.; You, M.; Shen, C. Part-guided attention learning for vehicle instance retrieval. IEEE Trans. Intell. Transp. Syst. 2020, 23, 3048–3060. [Google Scholar] [CrossRef]
- Meng, D.; Li, L.; Liu, X.; Li, Y.; Yang, S.; Zha, Z.J.; Gao, X.; Wang, S.; Huang, Q. Parsing-based view-aware embedding network for vehicle re-identification. In Proceedings of the IEEE/CVF Conference on Computer Vision and Pattern Recognition, Online, 14–19 June 2020; pp. 7103–7112. [Google Scholar]
- Suprem, A.; Pu, C. Looking glamorous: Vehicle re-id in heterogeneous cameras networks with global and local attention. arXiv 2020, arXiv:2002.02256. [Google Scholar]
- He, S.; Luo, H.; Chen, W.; Zhang, M.; Zhang, Y.; Wang, F.; Li, H.; Jiang, W. Multi-domain learning and identity mining for vehicle re-identification. In Proceedings of the IEEE/CVF Conference on Computer Vision and Pattern Recognition Workshops, Online, 14–19 June 2020; pp. 582–583. [Google Scholar]
- Yan, C.; Pang, G.; Bai, X.; Liu, C.; Ning, X.; Gu, L.; Zhou, J. Beyond triplet loss: Person re-identification with fine-grained difference-aware pairwise loss. IEEE Trans. Multimed. 2021, 24, 1665–1677. [Google Scholar] [CrossRef]
- Yang, L.; Luo, P.; Change Loy, C.; Tang, X. A large-scale car dataset for fine-grained categorization and verification. In Proceedings of the IEEE Conference on Computer Vision and Pattern Recognition, Boston, MA, USA, 7–12 June 2015; pp. 3973–3981. [Google Scholar]
- Khorramshahi, P.; Kumar, A.; Peri, N.; Rambhatla, S.S.; Chen, J.C.; Chellappa, R. A dual-path model with adaptive attention for vehicle re-identification. In Proceedings of the IEEE/CVF International Conference on Computer Vision, Seoul, South Korea, 27 October–2 November 2019; pp. 6132–6141. [Google Scholar]
- Bai, Y.; Lou, Y.; Dai, Y.; Liu, J.; Chen, Z.; Duan, L.Y.; Pillar, I. Disentangled Feature Learning Network for Vehicle Re-Identification. In Proceedings of the International Joint Conference on Artificial Intelligence, Online, 7–15 January 2021; pp. 474–480. [Google Scholar]
- Wang, H.; Wang, Z.; Du, M.; Yang, F.; Zhang, Z.; Ding, S.; Mardziel, P.; Hu, X. Score-CAM: Score-weighted visual explanations for convolutional neural networks. In Proceedings of the IEEE/CVF Conference on Computer Vision and Pattern Recognition Workshops, Online, 14–19 June 2020; pp. 24–25. [Google Scholar]
- Gildenblat, J.; Contributors. PyTorch Library for CAM Methods. 2021. Available online: https://github.com/jacobgil/pytorch-grad-cam (accessed on 1 September 2024).


| Dataset | Identities | Aerial | Ground | Cross-View | Urban | Rural |
|---|---|---|---|---|---|---|
| VeRi [15] | 776 | ✓ | ✗ | ✗ | ✓ | ✗ |
| VehicleID [14] | 26,267 | ✓ | ✗ | ✗ | ✓ | ✗ |
| VERI-Wild [12] | 40,671 | ✓ | ✗ | ✗ | ✓ | ✗ |
| DN-Wild [13] | 2286 | ✓ | ✗ | ✗ | ✓ | ✗ |
| DN348 [13] | 348 | ✓ | ✗ | ✗ | ✓ | ✗ |
| AGID | 834 | ✓ | ✓ | ✓ | ✓ | ✓ |
| Method | Parameters (M) | Inference Time (ms/Batch) |
|---|---|---|
| Baseline | 102.7 | 1109.8 |
| Baseline + ESFC | 119.2 | 1191.2 |
| AGID | mAP | R1 | R5 | R10 |
|---|---|---|---|---|
| ResNet-50 [32] | 32.9 | 48.2 | 62.0 | 68.5 |
| AGW [43] | 38.1 | 54.1 | 66.8 | 72.5 |
| BoT [44] | 34.4 | 49.4 | 62.7 | 69.6 |
| MGN [45] | 42.2 | 57.6 | 71.6 | 78.3 |
| TransReID(stride16) [22] | 47.9 | 61.8 | 76.8 | 82.8 |
| TransReID(stride16) + ESFC | 50.3 | 63.7 | 76.4 | 83.3 |
| TransReID(stride12) [22] | 50.3 | 62.9 | 78.1 | 82.9 |
| TransReID(stride12) + ESFC | 51.4 | 65.2 | 79.0 | 84.6 |
| CLIP-ReID [42] | 54.2 | 66.9 | 81.8 | 87.2 |
| CLIP-ReID + ESFC | 54.4 | 69.0 | 82.9 | 88.2 |
| VeRi | VehicleID | |||
|---|---|---|---|---|
| Method | mAP | R1 | R1 | R5 |
| PRRe-ID [35] | 72.5 | 93.3 | 72.6 | 88.6 |
| SAN [46] | 72.5 | 93.3 | 79.7 | 94.3 |
| UMTS [47] | 75.9 | 95.8 | 80.9 | 87.0 |
| VANet [48] | 66.3 | 89.8 | 83.3 | 96.0 |
| SPAN [49] | 68.9 | 94.0 | - | - |
| PGAN [50] | 79.3 | 96.5 | 78.0 | 93.2 |
| PVEN [51] | 79.5 | 95.6 | 84.7 | 97.0 |
| SAVER [36] | 79.6 | 96.4 | 79.9 | 95.2 |
| CFVMNet [19] | 77.1 | 95.3 | 81.4 | 94.1 |
| GLAMOR [52] | 80.3 | 96.5 | 78.6 | 93.6 |
| MDIM [53] | 79.8 | 95.0 | - | - |
| CAL [8] | 74.3 | 95.4 | 82.5 | 94.7 |
| FIDI [54] | 77.6 | 95.7 | 78.5 | 91.9 |
| DCAL [26] | 80.2 | 96.9 | - | - |
| TransReID(stride16) [22] | 80.6 | 96.9 | 83.6 | 97.1 |
| TransReID(stride16) + ESFC | 81.5 | 97.0 | 85.8 | 97.5 |
| TransReID(stride12) [22] | 82.0 | 97.1 | 85.2 | 97.5 |
| TransReID(stride12) + ESFC | 82.1 | 97.7 | 85.7 | 97.4 |
| CLIP-ReID [42] | 83.3 | 97.4 | 85.3 | 97.6 |
| CLIP-ReID + ESFC | 83.0 | 97.6 | 85.4 | 97.8 |
| Small | Medium | Large | |||||||
|---|---|---|---|---|---|---|---|---|---|
| Methods | mAP | R1 | R5 | mAP | R1 | R5 | mAP | R1 | R5 |
| GoogleNet [55] | 24.3 | 57.2 | 75.1 | 24.2 | 53.2 | 71.1 | 21.5 | 44.6 | 63.6 |
| FDA-Net(VGGM) [12] | 35.1 | 64.0 | 82.8 | 29.8 | 57.8 | 78.3 | 22.8 | 49.4 | 70.5 |
| FDA-Net(Resnet50) [12] | 61.6 | 73.6 | 91.2 | 52.7 | 64.3 | 85.4 | 45.8 | 58.8 | 81.0 |
| AAVER [56] | 62.2 | 75.8 | 92.7 | 53.7 | 68.2 | 88.9 | 41.7 | 58.7 | 81.6 |
| DFLNet [57] | 68.2 | 80.7 | 93.2 | 60.1 | 70.7 | 89.3 | 49.0 | 61.6 | 82.7 |
| UMTS [47] | 72.7 | 84.5 | - | 66.1 | 79.3 | - | 54.2 | 72.8 | - |
| BoT [44] | 76.6 | 90.8 | 97.3 | 70.1 | 87.5 | 95.2 | 61.3 | 82.6 | 92.7 |
| HPGN [20] | 80.4 | 91.4 | - | 75.2 | 88.2 | - | 65.0 | 82.7 | - |
| PVEN [51] | 79.8 | 94.0 | 98.1 | 73.9 | 92.0 | 97.2 | 66.2 | 88.6 | 95.3 |
| SAVER [36] | 80.9 | 93.8 | 97.9 | 75.3 | 92.7 | 97.5 | 67.7 | 89.5 | 95.8 |
| TransReID [22] | 80.1 | 92.4 | 97.7 | 74.1 | 89.4 | 96.5 | 65.2 | 85.1 | 94.2 |
| TransReID + ESFC | 80.9 | 92.3 | 97.5 | 75.1 | 90.2 | 96.4 | 66.3 | 85.9 | 94.3 |
| Base | SFC | MCE | mAP | R1 | R5 | R10 |
|---|---|---|---|---|---|---|
| ✓ | 50.3 | 62.9 | 78.1 | 82.9 | ||
| ✓ | ✓ | 51.2 | 63.9 | 77.1 | 83.7 | |
| ✓ | ✓ | ✓ | 51.4 | 65.2 | 79.0 | 84.6 |
Disclaimer/Publisher’s Note: The statements, opinions and data contained in all publications are solely those of the individual author(s) and contributor(s) and not of MDPI and/or the editor(s). MDPI and/or the editor(s) disclaim responsibility for any injury to people or property resulting from any ideas, methods, instructions or products referred to in the content. |
© 2025 by the authors. Licensee MDPI, Basel, Switzerland. This article is an open access article distributed under the terms and conditions of the Creative Commons Attribution (CC BY) license (https://creativecommons.org/licenses/by/4.0/).
Share and Cite
Shang, L.; Min, C.; Wang, J.; Xiao, L.; Zhao, D.; Nie, Y. Aerial-Ground Cross-View Vehicle Re-Identification: A Benchmark Dataset and Baseline. Remote Sens. 2025, 17, 2653. https://doi.org/10.3390/rs17152653
Shang L, Min C, Wang J, Xiao L, Zhao D, Nie Y. Aerial-Ground Cross-View Vehicle Re-Identification: A Benchmark Dataset and Baseline. Remote Sensing. 2025; 17(15):2653. https://doi.org/10.3390/rs17152653
Chicago/Turabian StyleShang, Linzhi, Chen Min, Juan Wang, Liang Xiao, Dawei Zhao, and Yiming Nie. 2025. "Aerial-Ground Cross-View Vehicle Re-Identification: A Benchmark Dataset and Baseline" Remote Sensing 17, no. 15: 2653. https://doi.org/10.3390/rs17152653
APA StyleShang, L., Min, C., Wang, J., Xiao, L., Zhao, D., & Nie, Y. (2025). Aerial-Ground Cross-View Vehicle Re-Identification: A Benchmark Dataset and Baseline. Remote Sensing, 17(15), 2653. https://doi.org/10.3390/rs17152653