Abstract
Owing to the inherently lower sensitivity of microwave aperture synthesis radiometers (ASRs), Soil Moisture and Ocean Salinity (SMOS) satellite brightness temperature (TB) measurements exhibit significantly greater system noise than real-aperture microwave radiometers do. This paper introduces a novel noise mitigation method for the SMOS L1C multi-angle TB product. The proposed method develops a multi-angle sea surface TB relationship lookup table, enabling the mapping of SMOS L1C multi-angle TB data to any single-angle TB, thereby averaging to the measurements to reduce noise. Validation experiments demonstrate that the processed SMOS TB data achieve noise levels comparable to those of the Soil Moisture Active Passive (SMAP) satellite. Additionally, the salinity retrieval experiments indicate that the noise mitigation technique has a clear positive effect on SMOS salinity retrieval.
1. Introduction
Sea surface salinity (SSS) remote sensing plays a critical role in advancing our understanding of Earth’s oceanic and climatic systems [1]. The Soil Moisture and Ocean Salinity (SMOS) mission was the first to employ an L-band aperture synthesis radiometer (ASR) for the remote sensing of SSS [2]. By utilizing interferometric measurement principles, SMOS directly reconstructs two-dimensional brightness temperature (TB) images of the field of view (FOV) from visibility data. Each reconstructed TB image, referred to as a snapshot, represents a single measurement. Adjacent SMOS snapshots exhibit significant overlap, enabling multiple consecutive observations of each grid on Earth’s surface. Owing to varying incidence angles across different snapshots, SMOS uniquely measures the multi-angle TB at each grid location.
Compared with real-aperture radiometers, ASRs offer faster measurements, larger FOVs, and higher spatial resolutions. However, a thinning array results in significantly lower sensitivity for ASRs than real-aperture radiometers under the same integration time. The intensity of the systematic random thermal noise in radiometry is typically quantified by brightness temperature sensitivity. The sensitivity of a real-aperture radiometer can be calculated using the following formula:
As shown in Formula (1), represents the system noise temperature in Kelvin, denotes the equivalent receiving frequency bandwidth in Hz, and corresponds to the effective integration time in seconds. The sensitivity of SMOS is calculated using the following formula:
where ( = sinθcosϕ, = sinθsinϕ) represent the direction cosines coordinate of the pixel. Here, denotes the solid angle of the antenna, (, ) represents the normalized averaged antenna directional power gain function, which equals unity at boresight, and is the distance ratio between receivers (0.875 for SMOS). The expressions for and are given as follows:
Here, accounts for the window and redundancies in the baseline measurements, where W represents the window term for each baseline and R represents the redundancy level of that same baseline. accounts for the local oscillator factor, where f0 is the central frequency and f01 is the low-frequency component. By comparing Formulas (1) and (2), it is evident that the sensitivity of SMOS can be expressed as the product of the real aperture sensitivity and several multiplicative factors, whose combined effect is significantly greater than 1. Therefore, when the same system parameters (Tsys, B, and τ) are maintained, the sensitivity of SMOS is theoretically much worse than that of a conventional real-aperture radiometer. For example, the L-band real-aperture radiometer on the Soil Moisture Active Passive (SMAP) satellite achieves a sensitivity of approximately 1 K [3], whereas the SMOS reports sensitivities ranging from 2.6 K to 5 K [1].The variability in SMOS sensitivity is attributed to its dependence on the spatial cosine coordinates of the grid; sensitivity decreases as one approaches the edge of the FOV. Figure 1 illustrates the brightness temperature sensitivity for a randomly selected snapshot in the SMOS data. The lower sensitivity of SMOS results in more significant systematic random thermal noise in the SMOS TB data, referred to as the noise floor.
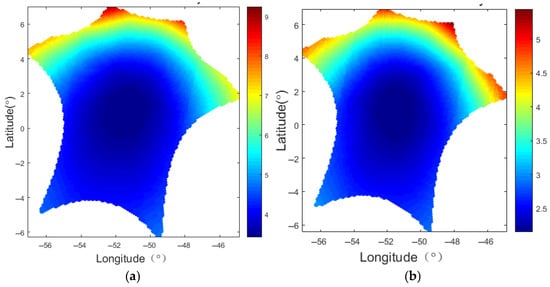
Figure 1.
SMOS snapshot pixel sensitivity; (a) X-polarization, (b) Y-polarization.
High-quality TB data are essential for achieving high-accuracy salinity retrievals. The ASR introduces significantly more complex error sources in the reconstruction of TB compared to conventional real-aperture radiometers. These error sources have varying impacts on SMOS TB images. The primary error sources include systematic spatial ripple [4], solar interference [5], residual radio-frequency interference (RFI) tails [6], land–sea contamination [7], and seasonal variations [8]. With the accumulation of operational experience, the SMOS Level-1 processor has evolved to version 7, incorporating advancements in data processing and calibration techniques. These improvements have effectively mitigated and corrected most errors and biases in SMOS TB. To address the spatial ripple, methods such as the Amplitude Mask [9] and Floor Error Mask (FEM) [10] have been proposed. The Pre-Distorted G-matrix (PDG) method leverages the Binomial Inverse Theorem to pre-distort a prior G-matrix, thereby reducing errors caused by antenna pattern differences [11]. The Gibbs methods employ initial guess-based techniques to decrease scene contrast, thus minimizing Gibbs ringing and spatial ripple effects caused by the land–sea transition [12]. An iterative optimization algorithm estimates the position of the dominant TB source within the Sun disc to correct solar radiation effects [13]. RFI sources are irregularly distributed, clustering in certain regions of the Earth, with multiple interferers often appearing simultaneously within the SMOS field of view. Various techniques for detecting, flagging, and correcting RFI sources continue to be developed and evaluated [14,15,16].
However, the issue of the inherent noise floor has not yet been adequately addressed in the current SMOS Level-1 processor. Therefore, although SMOS is able to provide rich measurement information with multi-angle TBs per grid, it cannot deliver sufficiently accurate sea surface TBs at any specific angle due to the high noise level. Although SMOS employs joint inversion of multi-angle TBs to ensure the accuracy of the salinity products, the question remains of whether multiple, less accurate TB datasets or single, highly accurate TB datasets yield better salinity retrievals. Moreover, SMOS’s inability to provide sufficiently accurate single-angle TB poses challenges for applications such as inter-calibration with SMAP or data assimilation.
In this paper, we propose a noise mitigation method for the SMOS L1C multi-angle TB product by leveraging the relationship between the sea surface TB and the incidence angle. Specifically, collocated forward modeling SMOS TB data are utilized to construct a multi-angle sea surface TB relationship lookup table. This lookup table enables the mapping of the SMOS L1C multi-angle TB to any single-angle TB, thereby facilitating noise suppression through averaging. The effectiveness of this noise mitigation method was validated by comparing the SMOS L1C TB with the SMAP TB and through salinity retrieval experiments.
This paper is structured as follows. Section 2 evaluates the noise level of the SMOS L1C TB through a comparative analysis with the SMAP TB. Section 3 details the noise mitigation method, specifically addressing the establishment of a multi-angle sea surface TB relationship lookup table. Section 4 provides the validation results from the processed SMOS TB. Finally, Section 5 summarizes the conclusions.
2. Evaluation of the Noise Level of SMOS TB
The payload of the SMOS mission, a microwave imaging radiometer with aperture synthesis (MIRAS), is a Y-shaped L-band ASR consisting of a total of 69 antenna and receiver units. MIRAS measures TB in snapshots, acquiring over 5000 snapshots per half-orbital (approximately 45 min) in both X and Y polarizations [17]. Global coverage is achieved through more than 70 half-orbits every three days. TB data in SMOS L1C-level products are stored in Icosahedral Snyder Equal Area (ISEA) grids on the Earth’s surface [18]. Figure 2 shows the ISEA grids for a single snapshot, depicting the projection of the extended alias-free FOV (EAFFOV) from spatial cosine coordinates (η, ξ) to latitude–longitude coordinates.
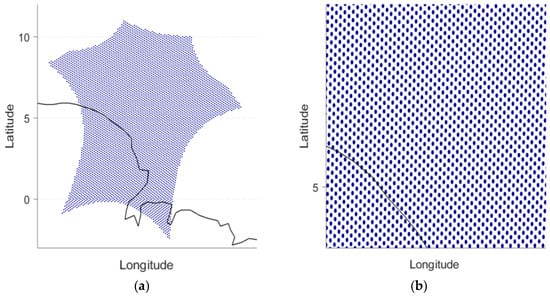
Figure 2.
The ISEA grids of a snapshot in the SMOS L1C data. (a) All ISEA grids, (b) an enlarged view. The black lines represents the boundary between land and sea, and the blue dot represents each pixel.
Adjacent SMOS snapshots exhibit significant overlap, enabling each ISEA grid to be observed by multiple consecutive snapshots at varying incidence angles. Consequently, the SMOS L1C product records the TB data measured across all angles for each ISEA grid [19]. Figure 3 illustrates the multi-angle sea surface SMOS L1C TB for an ISEA grid, where blue circles represent X-polarization and blue triangles represent Y-polarization. The relationship between the sea surface TB and incident angle clearly differs markedly between the X and Y polarizations. Specifically, the X-polarization TB decreases as the incident angle increases, whereas the Y-polarization TB increases with increasing incident angle.
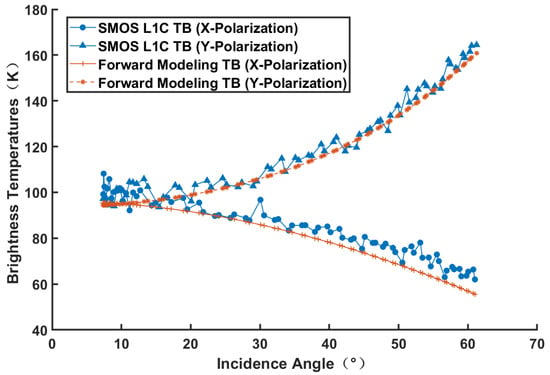
Figure 3.
The multi-angle sea surface SMOS L1C TB (blue) for an ISEA grid and the collocated forward modeling SMOS TB (red).
The red curves in Figure 3 represent the collocated forward modeling SMOS TB. The sea surface forward model utilizes FASTEM-5, with sea surface physical parameters derived from ECMWF auxiliary data and the L2 salinity product of SMOS. This SMOS TB forward process is consistent with the methodology described in Reference [20]. For both the X and Y polarizations, the trend of the forward modeling TB varying with the angle is highly consistent with the observations. However, the SMOS-observed TB exhibited significantly greater fluctuations, indicating considerable noise in the SMOS L1C multi-angle TB. Additionally, this comparison suggests that the model and sea surface physical parameters result in noticeable absolute errors between the forward modeling TB and the SMOS observations in Figure 3 (the root mean square error (RMSE) for X polarization is 7.40 K, and that for Y polarization is 4.68 K). Consequently, forward modeling of the TB cannot fully replace observational data.
We evaluated the noise level of the SMOS TB by comparing it with that of the SMAP TB product. Specifically, we selected the TOA TB data from the SMAP L1B product for comparison with the SMOS L1C TB, as both represent measurements at the top of the atmosphere. To ensure an accurate comparison, we first match the time and space of the two satellite data as closely as possible. The SMAP TB data were interpolated to the SMOS ISEA grid. The time difference between corresponding observations was ensured to be less than one hour. The comparison experiment was confined to oceanic regions, without applying additional filters for clear-sky conditions or wind speed. Prior to comparison, we also matched the incidence angles and polarizations of the SMOS and SMAP TB data. Since the SMAP radiometer measures a uniform incidence angle of 40° due to its conical scanning mode, we selected the SMOS TB incidence angle closest to 40° (within ±0.5°) for each grid. Additionally, because the SMOS L1C TB data have X and Y polarizations at the antenna reference frame, whereas the SMAP L1B TB data have H and V polarizations at the Earth surface reference frame, we performed polarization rotation on the SMOS L1C TB data to align them with the H and V polarizations of the SMAP L1B TB. For more details of polarization rotation, refer to Reference [20].
Figure 4 shows the comparison of the SMOS TB and SMAP TB after matching. The SMOS data originate from the half orbit on 2020-04-30T02:31, whereas the SMAP data are derived from the half orbit on 2020-04-30T02:17. The matched region spans latitudes from 30°N to 15°S and longitudes from 120°W to 140°W. Since the sensitivity of microwave radiometers can be estimated by the STD of measurement data obtained from a calibration source with a constant brightness temperature, we propose that the systematic noise level in the brightness temperatures of SMOS and SMAP can similarly be assessed by computing the STD of TB over an open ocean region at the same incidence angle. Observations of SMAP TB indicate that, over open ocean areas, where sea surface conditions are relatively stable, the variation in sea surface brightness temperature at a given incidence angle is typically minimal. This leads to a smooth and uniform TB distribution. Based on this phenomenon, the STD of TB at consistent incidence angles within a selected oceanic region is employed as a key quantitative indicator for evaluating the instrument’s noise level. In Figure 4, the STDs of the SMOS TBs for H and V polarizations are 4.14 K and 3.94 K, respectively, whereas those for SMAP TBs are 1.09 K and 1.15 K. These values are generally consistent with the theoretical sensitivities of SMOS (2.6 K to 5 K) and SMAP (~1 K), suggesting that this method is reasonable for approximately estimating the noise levels of both SMOS and SMAP brightness temperatures. The noise level of the SMOS TB is significantly greater than that of the SMAP TB.
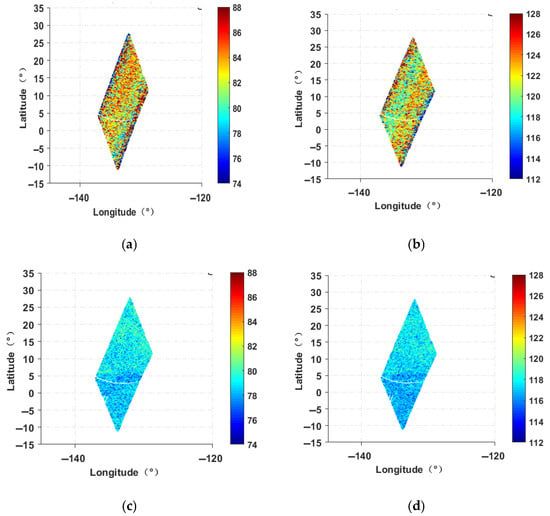
Figure 4.
Comparison of the SMAP TB and SMOS TB at a 40° incidence angle. (a) H-polarized SMOS TB, (b) V-polarized SMOS TB, (c) H-polarized SMAP TB, (d) V-polarized SMAP TB.
3. Methodology
As illustrated in Section 2, the SMOS L1C multi-angle TB has a significant noise level. The angular dependence of the L-band sea surface TB complicates noise reduction through simple averaging. Figure 3 shows that while absolute discrepancies remain between forward modeling and the observed TB, their trends with respect to angle changes are generally consistent. Furthermore, a comprehensive statistical analysis was conducted on a large dataset consisting of collocated forward modeling SMOS TBs and corresponding observations in order to quantify the consistency of their angular variation patterns through cosine similarity. The cosine similarity is computed as defined in Equation (5):
where represent the ith SMOS TB, denotes the ith collocated forward modeling TB, and is the total number of SMOS brightness temperatures. Cosine similarity is a mathematical way to measure how similar two sets of information are. In the simplest terms, it helps us understand the relationship between two elements by looking at the “direction” they are pointing in, rather than just comparing them based on their individual values. A cosine similarity value closer to 1 indicates a higher degree of similarity in the variation trends.
Using a randomly selected SMOS half-orbit dataset (orbit ID: 20200430T0231), we computed the cosine similarity for the fitted multi-angle TB curves across approximately 50,000 ISEA grids. The results are presented in Figure 5. Based on the probability distribution statistics of cosine similarity, for both X and Y polarizations, nearly all samples exhibit cosine similarities greater than 0.9, with over 90% exceeding 0.95. These findings indicate a high degree of consistency in the variation trends with respect to the incident angle. Such consistency serves as a prerequisite for achieving noise mitigation in SMOS L1C multi-angle brightness temperature data, as it indicates that the relative differences in forward modeling TB between any two incident angles are highly consistent with those actual SMOS TB measurements. Consequently, we propose that the SMOS L1C multi-angle TB can be mapped to a single-angle TB using the angular variation relationship derived from forward modeling TB. By averaging multiple measurements at the same angle, it is feasible to reduce noise and achieve a more accurate single-angle sea surface SMOS TB.
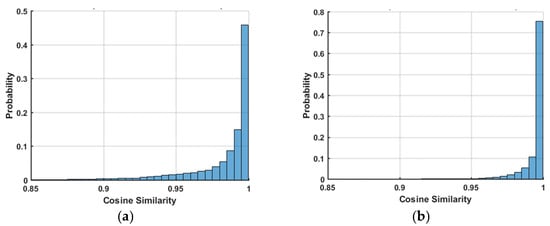
Figure 5.
Statistical analysis of the cosine similarity between the fitted curves of simulated and observed TBs as a function of incidence angle. (a) X-polarization, (b) Y-polarization.
In addition, Figure 6 presents a scatter plot comparing the actual SMOS TB measurements with the collocated forward modeling TB values used in Figure 5. The distribution of data points appears tightly clustered along a narrow band, indicating strong overall agreement between the two datasets. The correlation coefficients for X-polarization and Y-polarization are 0.9635 and 0.9889, respectively, further supporting the high consistency between the forward modeling TBs and the actual SMOS TB measurements.
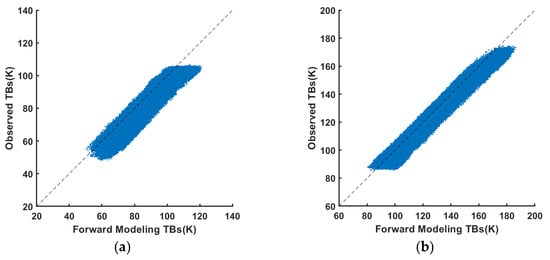
Figure 6.
Scatterplots of forward modeling TBs and observed TBs. (a) X-polarization, (b) Y-polarization. The dashed represents line the function y = x.
3.1. Multi-Angle Sea Surface TB Relationship Lookup Table
Since the multi-angle sea surface TB curve is influenced by the physical parameters of the sea surface, including temperature, salinity, and the wind field, it is necessary to gather extensive historical oceanic physical data and input these data into the sea surface forward model. This process will establish a comprehensive lookup table that represents the multi-angle sea surface TB relationships under diverse oceanic conditions. The detailed implementation procedure is outlined below:
1. Generate the input dataset necessary for constructing the multi-angle sea surface TB relationship lookup table. Each complete input record comprises SMOS observation parameters (e.g., incidence angle, azimuth angle, Faraday rotation angle, and geometric rotation angle) for a single observation grid, as well as ocean physical parameters (such as sea surface temperature (SST), SSS, wind speed, etc.). The ocean physical parameters are derived from the SMOS auxiliary data products, which interpolate the fifth generation of the European Centre for Medium-Range Weather Forecasts (ECMWF) reanalysis (ERA5) data onto the SMOS L1C data grids. Subsequently, the input dataset, in conjunction with the FASTEM-5 sea surface radiative transfer model, is utilized to calculate the multi-angle forward modeling TB. FASTEM-5 is the fifth version of the fast microwave radiative transfer model developed by the Met Office, U.K., designed for calculating the radiative and scattering properties of the ocean surface [21]. It has been extensively applied to forward calculations of sea surface radiation and data assimilation.
2. Polynomial fitting is applied to the multi-angle forward modeling TB, and sea surface TB data are calculated at 0.1° intervals from 0° to 70° via the fitted curve.
3. The slope of the fitting curve is calculated, and a statistical analysis is conducted on the deviation between the multi-angle TB data (from 0° to 70°) and the TB at a single angle (in this study, 40° is used as an example). The forward modeling TB, after being fitted and discretized, serves as the matching index in the lookup table, while the corresponding deviation is utilized as the TB correction value.
4. Owing to the high similarity among numerous historical ocean physical parameters, the presence of redundant TB curves in the lookup table decreases lookup efficiency. Consequently, it is necessary to remove these redundant curves by using cosine similarity as a metric for identifying such data.
Although ocean physical parameters are inherently variable, the calibration curve generally fluctuates within a stable range. This is because, under typical conditions, variations in sea surface physical parameters remain bounded. For instance, global SSS usually falls between 30 and 40 psu, while global SST spans approximately −2 °C to 30 °C. On one hand, this suggests that a significant amount of redundant data exist within the limited variation range of the calibration curve. On the other hand, it implies that the calibration curve can be effectively quantized. By eliminating as much redundant data as possible, only a relatively small lookup table is required, thereby optimizing the efficiency of the proposed method.
This study randomly selected 800,000 historical ocean physical parameters from the SMOS data products in 2020 for simulation. By adjusting the cosine similarity threshold, which serves as the redundancy determination metric, the size of the lookup table can be effectively controlled. The lookup table size is determined by evaluating the noise suppression performance on SMOS L1C TB. As illustrated in Figure 7, the size of the lookup table ranges from 2000 to 300,000 entries. Initially, as the number of entries increases, the STD of the SMOS L1C TB after noise mitigation decreases significantly. However, once the table size reaches approximately 50,000 entries, further expansion does not result in any noticeable improvement in noise mitigation performance.
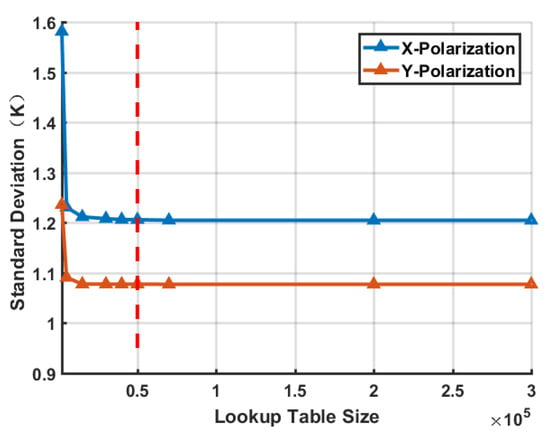
Figure 7.
The influence of lookup table size on the performance of SMOS L1C TB noise mitigation. The red dotted line represents the size of the lookup table is 50,000 entries.
After removing redundant data, a multi-angle sea surface TB relationship lookup table was generated, comprising approximately 50,000 entries. These entries cover high-, mid-, and low-latitude waters and offshore and nearshore regions, as well as the four major global ocean basins—the Pacific, Atlantic, Indian, and Arctic Oceans—ensuring comprehensive statistical sampling across diverse sea surface conditions. Furthermore, no additional cloud or rainfall filters were applied to the data in the lookup table, as L-band radiometers are largely insensitive to both liquid and frozen precipitation [22,23]. Figure 8 shows the lookup table for an incidence angle of 40°, where Panel (a) corresponds to X polarization and Panel (b) corresponds to Y polarization. The horizontal axis represents the incidence angle while the vertical axis indicates the brightness temperature values that require correction when sea surface brightness temperatures at various incident angles are mapped to an incident angle of 40°. Each curve in Figure 8 represents the TB correction values at various incidence angles under the specified historical ocean physical parameters.
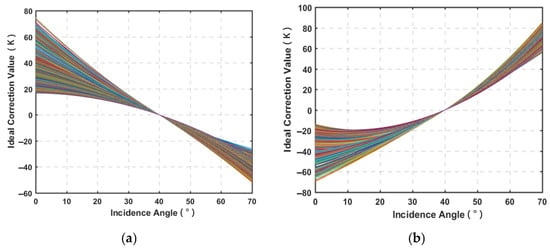
Figure 8.
The multi-angle sea surface TB relationship lookup table for 40°. (a) X-polarization, (b) Y-polarization.
3.2. Noise Mitigation of SMOS L1C TB
The steps of the SMOS L1C TB noise mitigation method, which is based on the multi-angle sea surface TB relationship lookup table, are as follows:
1. For the SMOS L1C TB data, the corresponding ECMWF auxiliary data and SMOS L2 SSS data are selected to calculate the collocated multi-angle forward modeling TB. For more details of the SMOS TB forward process, refer to Reference [20].
2. Fit the multi-angle forward modeling TB and calculate the TB values on the fitted curve at each incidence angle from 0° to 70° with an interval of 0.1°. The curve fitting employs a nonlinear statistical regression model as follows:
where represents the forward modeling TB; denotes incidence angle; and , , are the fitting coefficients.
3. Subsequently, the cosine similarity between the fitted continuous forward modeling TB and the discretized lookup table key values is employed as the matching criterion to retrieve the corresponding angle-specific TB correction values from the lookup table. These retrieved correction values are then applied to the SMOS L1C multi-angle TB to transform it into a single-angle TB (40° in this study).
4. The transformed single-angle TB data are averaged to obtain a noise-mitigated single-angle TB. Prior to averaging, outlier detection is performed via Formulas (7) and (8), and any abnormal TB data are removed [24].
4. Experimental Results and Analysis
4.1. Evaluation of Noise-Mitigated SMOS TB
The proposed noise mitigation method was applied to the 2020 SMOS TB data and compared with the corresponding SMAP TB data for verification, as described in Section 2. Figure 9 shows the processing results of a randomly selected half-orbital TB. Panels (a) and (b) show the raw 40° SMOS L1C TB images, Panels (c) and (d) display the processed 40° SMOS TB images, and Panels (e) and (f) present the SMAP TB images. The images in the left column correspond to H polarization, while those in the right column correspond to V polarization. A comparison of the TB images reveals that the noise in SMOS TB has been substantially diminished following noise mitigation processing. Compared to the raw SMOS TB, the processed SMOS TB distribution demonstrates enhanced smoothness, leading to a significant improvement in image quality and a marked increase in consistency with the SMAP TB.
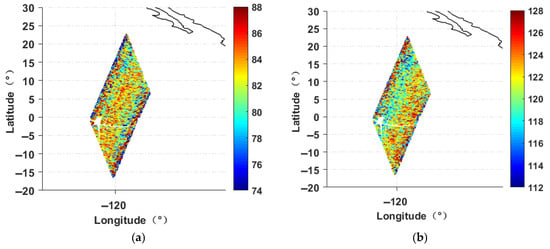
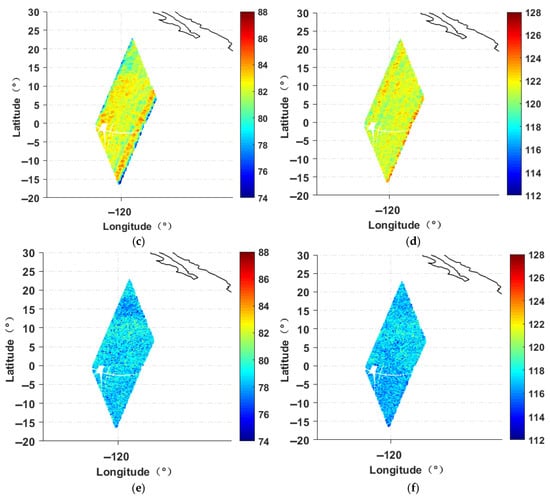
Figure 9.
Comparison of SMOS TB images and SMAP TB images at a 40° incidence angle. (a) H-polarization raw SMOS TB, (b) V-polarization raw SMOS TB, (c) H-polarization processed SMOS TB, (d) V-polarization processed SMOS TB, (e) H-polarization SMAP TB, (f) V-polarization SMAP TB. The black lines represents the boundary between land and sea.
Figure 10 presents the TB data shown in Figure 9 as one-dimensional profiles, further illustrating the variation characteristics of TB among the three datasets. It can be observed from the figures that, at a 40° incidence angle, the raw SMOS L1C TB data exhibit pronounced fluctuations, with an amplitude significantly larger than that of the SMAP TB data. After applying the noise mitigation process, the fluctuation amplitude of the SMOS TB is substantially reduced, leading to a much smoother profile overall. The variation level of the processed SMOS TB then becomes comparable to that of the SMAP TB. However, a systematic bias of approximately 4 K remains between the processed SMOS TB and the SMAP TB (for both H and V polarizations), which is primarily attributed to calibration differences between the two satellite instruments.
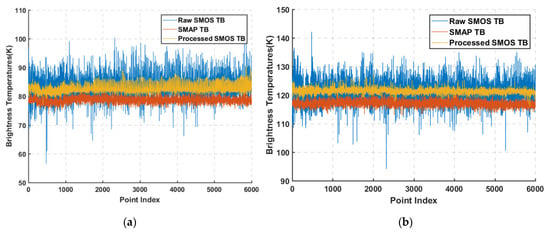
Figure 10.
Comparison of raw SMOS TB data, processed SMOS TB data, and SMAP TB data at a 40° incidence angle. (a) H-polarization, (b) V-polarization.
Table 1 presents the validation results based on additional randomly selected SMOS half-orbit datasets. The first row of the table corresponds to Figure 9 and Figure 10. Figure 11 presents a line chart that is plotted based on the statistical results provided in Table 1. For all test samples, the STDs of the processed SMOS TBs in both the H and V polarizations clearly have decreased by approximately 3 K compared with the raw SMOS TB, aligning closely with the STDs of the SMAP TB. This finding indicates that the noise level of the processed SMOS TB is comparable to that of the SMAP TB, thereby validating the effectiveness of the proposed noise mitigation method.

Table 1.
Standard deviation statistics.
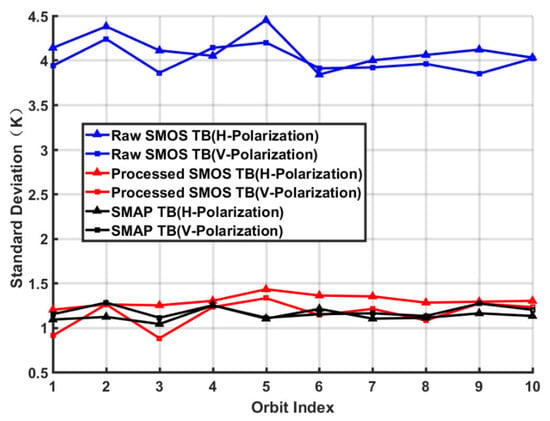
Figure 11.
Comparison of the STDs among the raw SMOS TB data, the processed SMOS TB data, and the SMAP TB data.
4.2. Salinity Retrieval Comparative Validation Experiment
To evaluate the impact of noise mitigation on the SMOS TB for salinity retrieval, a comparative validation experiment was conducted. The official algorithm adopted by SMOS L2 SSS products, the Levenberg–Marquardt algorithm [25], was utilized for salinity retrieval. To assess the accuracy of the retrieved salinity, reference truth values were obtained from the ISAS20_ARGO product data (ISAS: In Situ Analysis System), available on the official Argo website (https://argo.ucsd.edu/data/argo-data-products/, accessed on 16 March 2024) [26]. Initiated in 2000, the Argo float program aims to provide near-real-time observations of global ocean salinity, temperature, and current velocity. Initially, approximately 2000 floats were deployed globally, with an annual increase of approximately 800 floats. For this study, in situ salinity measurements from depths of 0.5 to 3 m provided by ISAS20_ARGO were selected as the reference data for validating the salinity retrieval.
First, SMOS TB and SMAP TB data that match the temporal and spatial characteristics of the Argo data are selected. The SSS is subsequently retrieved via the raw SMOS L1C multi-angle TB, processed SMOS single-angle TB, and SMAP TB. Finally, the retrieval results are compared with the ISAS20_ARGO data to evaluate the effect of noise mitigation by the SMOS TB on the salinity retrieval accuracy.
Figure 12 shows a comparison of the salinity retrieval results for a half-orbital TB, where Panel (a) shows the ARGO data, (b) presents the retrieval result from the processed SMOS TB, (c) displays the retrieval result from the raw SMOS L1C TB, and (d) shows the retrieval result from the SMAP TB. Table 2 and Table 3 summarize the absolute bias and RMSEs of the salinity retrieval results for multiple half-orbits of the SMOS and SMAP TB data relative to the ISAS20_ARGO salinity, with the first row of data corresponding to Figure 12. Figure 13a,b present line charts derived from the statistical results in Table 2 and Table 3, respectively. The statistical analysis demonstrates that the accuracy of salinity retrieval using the processed SMOS single-angle TB surpasses that of the raw SMOS L1C multi-angle TB. On average, the retrieval accuracy improved by approximately 22.2%, achieving performance comparable to that obtained using SMAP TB. These findings confirm the efficacy of the proposed noise mitigation method in improving salinity retrieval accuracy.
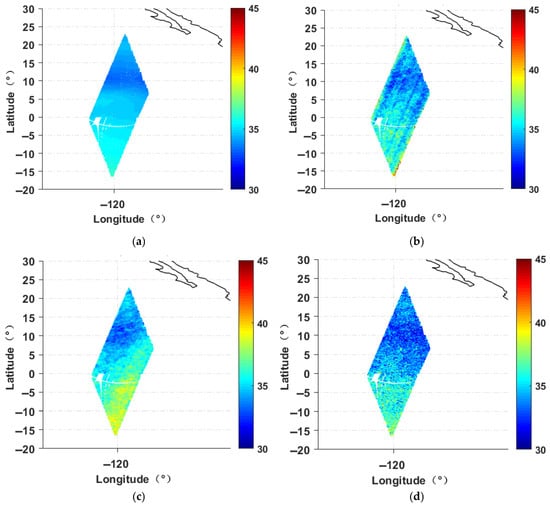
Figure 12.
Salinity retrieval results. (a) ISAS20_ARGO, (b) processed SMOS TB, (c) raw SMOS L1C TB, (d) SMAP TB. The black lines represents the boundary between land and sea.

Table 2.
Absolute deviation statistics.

Table 3.
Root mean square error statistics.

Figure 13.
Comparison of salinity retrieval results from SMOS brightness temperatures before and after noise mitigation and from SMAP brightness temperatures. (a) Bias, (b) RMSE.
5. Discussion
Forward models have a wide range of applications in remote sensing, such as assimilating satellite observations into numerical weather prediction models and supporting the retrieval and validation of satellite measurements. However, discrepancies often exist between the brightness temperatures observed by satellites and those simulated by forward models. These differences can arise from uncertainties in input physical parameters, inaccuracies in the forward model itself, and errors in the observational data. As a result, it is generally challenging to directly apply forward models for correcting errors in observed TB.
We found that for currently established sea surface emissivity models, such as FASTEM-5, although a notable discrepancy still exists between model-calculated and observed TB values, these models demonstrate a high degree of consistency in their variation trends with respect to incident angles at the L-band. This indicates that the relative differences in forward modeling TB between any two incident angles align closely with those observed in actual measurements. The SMOS L1C TB product provides multiple brightness temperature values at different incident angles per grid point, each associated with a relatively high noise level. Therefore, we propose leveraging the relative relationships among forward modeling TBs at various incident angles to map multi-angle SMOS L1C TB data onto any specified angle. Subsequently, by averaging the mapped TB values corresponding to the same target angle, random noise can be effectively mitigated, resulting in a single-angle SMOS sea surface TB product with enhanced accuracy.
The method is relatively straightforward: mathematically, it employs only the classical statistical regression model to fit the functional relationship between forward modeling TBs and incident angles. Theoretically, it relies solely on the well-established FASTEM-5 sea surface emissivity model. Nevertheless, this represents a successful attempt to enhance the quality of observed TBs through the use of a forward model, and it also introduces a novel and effective approach for mitigating TB noise in ASRs. As is widely recognized, system noise in microwave radiometer measurements is inherent and typically follows a Gaussian distribution, exhibiting no distinct temporal or spatial patterns. Few prior studies have managed to directly suppress such noise.
Of course, the proposed method remains highly dependent on the accuracy of both the forward model and the background field. It is essential to ensure a high degree of consistency in the variation trends of forward modeling TBs and observed TBs with respect to incident angle. Therefore, the method is currently limited to mitigating sea surface TB noise. For land surfaces, on one hand, the errors associated with the forward model and background field are larger; on the other hand, the relationship between TB and incident angle varies more complexly across different land surface types, making the method unsuitable for application in such cases.
6. Conclusions
The SMOS satellite, which is equipped with an ASR, is unique in its ability to provide multi-angle observed TB. However, the low sensitivity of ASR results in excessive system noise in the SMOS TB at each angle. Our analysis reveals that, while there remains a certain absolute error between the forward modeling sea surface TB and the actual SMOS observations, the relative variation trends of the forward modeling TB with respect to angles align well with those from actual observations. Consequently, we have developed a multi-angle sea surface TB relationship lookup table based on forward modeling TB data, which allows us to map the SMOS L1C multi-angle TB to any single-angle TB. By averaging these mapped values, we obtain a more accurate SMOS single-angle TB product with reduced noise. Comparisons with the SMAP TB data show that the noise level of the processed SMOS TB has been improved to match that of the SMAP. Additionally, this paper presents a comparative validation experiment for salinity retrieval. Preliminary results indicate that using the processed SMOS single-angle TB yields better accuracy in salinity retrieval than does using the raw SMOS L1C multi-angle TB. The noise mitigation method proposed here can be applied to reprocess the SMOS L1C multi-angle TB product, resulting in single-angle TB data with lower noise levels, thereby enhancing the performance of applications such as salinity retrieval, inter-calibration, and data assimilation.
Author Contributions
Investigation, K.C. and Q.Y.; methodology, K.C. and R.W.; conceptualization, J.G.; software, Q.Y.; validation, R.W. and J.C.; writing—original draft, K.C. and R.W.; writing—review & editing, J.G. All authors have read and agreed to the published version of the manuscript.
Funding
This research was supported by the National Natural Science Foundation of China (Grant Nos. 42275141, 62271218, and 42276183).
Data Availability Statement
The raw data supporting the conclusions of this article will be made available by the authors on request.
Acknowledgments
The authors thank the ECMWF for providing the ERA-5 reanalysis data.
Conflicts of Interest
The authors declare no conflicts of interest.
References
- Reul, N.; Grodsky, S.A.; Arias, M.; Boutin, J.; Catany, R.; Chapron, B.; D’AMico, F.; Dinnat, E.; Donlon, C.; Fore, A.; et al. Sea surface salinity estimates from spaceborne L-band radiometers: An overview of the first decade of observation (2010–2019). Remote Sens. Environ. 2020, 242, 111769. [Google Scholar] [CrossRef]
- Kerr, Y.H.; Waldteufel, P.; Wigneron, J.-P.; Delwartet, S.; Cabot, F.; Boutin, J.; Escorihuela, M.-J.; Font, J.; Reul, N.; Gruhier, C.; et al. The SMOS Mission: New Tool for Monitoring Key Elements ofthe Global Water Cycle. Proc. IEEE 2010, 98, 666–687. [Google Scholar] [CrossRef]
- Entekhabi, D.; Njoku, E.G.; O’neill, P.E.; Kellogg, K.H.; Crow, W.T.; Edelstein, W.N.; Entin, J.K.; Goodman, S.D.; Jackson, T.J.; Johnson, J.; et al. The Soil Moisture Active Passive (SMAP) Mission. Proc. IEEE 2010, 98, 704–716. [Google Scholar] [CrossRef]
- Camps, A.; Corbella, I.; Torres, F.; Duffo, N.; Vall-llosera, M.; Martin-Neira, M. The impact of antenna pattern frequency dependence in aperture synthesis microwave radiometers. IEEE Trans. Geosci. Remote Sens. 2005, 43, 2218–2224. [Google Scholar] [CrossRef]
- Khazaal, A.; Anterrieu, E.; Cabot, F.; Kerr, Y.H. Impact of Direct Solar Radiations Seen by the Back-Lobes Antenna Patterns of SMOS on the Retrieved Images. IEEE J. Sel. Top. Appl. Earth Obs. Remote Sens. 2017, 10, 3079–3086. [Google Scholar] [CrossRef]
- Oliva, R.; Daganzo, E.; Richaume, P.; Kerr, Y.; Cabot, F.; Soldo, Y.; Anterrieu, E.; Reul, N.; Gutierrez, A.; Barbosa, J.; et al. Status of Radio Frequency Interference (RFI) in the 1400–1427 MHz passive band based on six years of SMOS mission. Remote Sens. Environ. 2016, 180, 64–75. [Google Scholar] [CrossRef]
- Corbella, I.; Duran, I.; Wu, L.; Torres, F.; Duffo, N.; Khazaal, A.; Martin-Neira, M. Impact of correlator efficiency errors on SMOS land–sea contamination. IEEE Geosci. Remote Sens. Lett. 2015, 12, 1813–1817. [Google Scholar] [CrossRef]
- Martin-Neira, M.; Oliva, R.; Corbella, I.; Torres, F.; Duffo, N.; Durán, I.; Kainulainen, J.; Closa, J.; Zurita, A.; Cabot, F.; et al. SMOS instrument performance and calibration after six years in orbit. Remote Sens. Environ. 2016, 180, 19–39. [Google Scholar] [CrossRef]
- Torres, F.; Corbella, I.; Wu, L.; Duffo, N.; Gourrion, J.; Font, J.; Martin-Neira, M. Minimization of image distortion in SMOS brightness temperature maps over the ocean. IEEE Geosci. Remote Sens. Lett. 2011, 9, 18–22. [Google Scholar] [CrossRef]
- Anterrieu, E.; Suess, M.; Cabot, F.; Spurgeon, P.; Khazaal, A. An additive mask correction approach for reducing the systematic floor error in imaging radiometry by aperture synthesis. IEEE Geosci. Remote Sens. Lett. 2015, 12, 1441–1445. [Google Scholar] [CrossRef]
- Diez-Garcia, R.; Martin-Neira, M. Analysis and characterization of the reconstruction error in interferometric synthetic aperture imaging radiometers. In Proceedings of the 2014 13th Specialist Meeting on Microwave Radiometry and Remote Sensing of the Environment (MicroRad), Pasadena, CA, USA, 24–27 March 2014; pp. 141–146. [Google Scholar] [CrossRef]
- Khazaal, A.; Carfantan, H.; Anterrieu, E. On the reduction of the systematic error in imaging radiometry by aperture synthesis: A new approach for the SMOS space mission. IEEE Geosci. Remote Sens. Lett. 2009, 6, 47–51. [Google Scholar] [CrossRef]
- Khazaal, A.; Cabot, F.; Anterrieu, E.; Kerr, Y.H. A New Direct Sun Correction Algorithm for the Soil Moisture and Ocean Salinity Space Mission. IEEE J. Sel. Top. Appl. Earth Obs. Remote Sens. 2020, 13, 1164–1173. [Google Scholar] [CrossRef]
- Khazaal, A.; Cabot, F.; Anterrieu, E.; Soldo, Y. A kurtosis based approach to detect RFI in SMOS image reconstruction data processor. IEEE Trans. Geosci. Remote Sens. 2014, 52, 7038–7047. [Google Scholar] [CrossRef]
- Gao, Y.; Zhou, W.; Zhang, L.; Zhang, H.; Jin, R.; Li, Q. A Combined RFI Localization Algorithm of BT Image and Subspace Decomposition for Synthetic Aperture Interferometric Radiometer. IEEE Trans. Geosci. Remote Sens. 2023, 61, 1–11. [Google Scholar] [CrossRef]
- Shi, T.; Jin, R.; Ren, J.; Chen, K.; Huang, Q.; Li, Q. An Improved Method of Multiple RFI Intensity Estimation for Synthetic Aperture Interferometric Radiometer. IEEE Trans. Geosci. Remote Sens. 2024, 62, 1–12. [Google Scholar] [CrossRef]
- Corbella, I.; Torres, F.; Duffo, N.; González-Gambau, V.; Pablos, M.; Duran, I.; Martín-Neira, M. MIRAS Calibration and Performance: Results From the SMOS In-Orbit Commissioning Phase. IEEE Trans. Geosci. Remote Sens. 2011, 49, 3147–3155. [Google Scholar] [CrossRef]
- Zhao, T.; Shi, J.; Bindlish, R.; Jackson, T.J.; Kerr, Y.H.; Cosh, M.H.; Cui, Q.; Li, Y.; Xiong, C.; Che, T. Refinement of SMOS Multiangular Brightness Temperature Toward Soil Moisture Retrieval and Its Analysis Over Reference Targets. IEEE J. Sel. Top. Appl. Earth Obs. Remote Sens. 2014, 8, 589–603. [Google Scholar] [CrossRef]
- Carr, D.; Kahn, R.; Sahr, K.; Olsen, T. ISEA discrete global grids. Stat. Comput. Stat. Graph. Newsl. 1997, 8, 31–39. [Google Scholar]
- Chen, K.; Yang, Q.; Tian, Y.; Li, Q.; Jin, R. Mitigation of Land Contamination in SMOS L1C Brightness Temperature Data Based on Convolutional Neural Networks. IEEE J. Sel. Top. Appl. Earth Obs. Remote Sens. 2024, 17, 18666–18682. [Google Scholar] [CrossRef]
- Saunders, R.; Hocking, J.; Turner, E.; Rayer, P.; Rundle, D.; Brunel, P.; Vidot, J.; Roquet, P.; Matricardi, M.; Geer, A.; et al. An update on the RTTOV fast radiative transfer model (currently at version 12). Geosci. Model Dev. 2018, 11, 2717–2737. [Google Scholar] [CrossRef]
- Meissner, T.; Ricciardulli, L.; Manaster, A. Tropical Cyclone Wind Speeds from WindSat, AMSR and SMAP: Algorithm Development and Testing. Remote Sens. 2021, 13, 1641. [Google Scholar] [CrossRef]
- Knaff, J.A.; Sampson, C.R.; Kucas, M.E.; Slocum, C.J.; Brennan, M.J.; Meissner, T.; Ricciardulli, L.; Mouche, A.; Reul, N.; Morris, M.; et al. Estimating tropical cyclone surface winds: Current status, emerging technologies, historical evolution, and a look to the future. Trop. Cyclone Res. Rev. 2021, 10, 125–150. [Google Scholar] [CrossRef]
- Gutierrez, A.; Barbosa, J.; Almeida, N.; Catarino, N.; Freitas, J.; Ventura, M.; Reis, J.; Zundo, M. SMOS L1 processor prototype: From digital counts to brightness temperatures. In Proceedings of the 2007 IEEE International Geoscience and Remote Sensing Symposium, Barcelona, Spain, 23–28 July 2007; pp. 3626–3630. [Google Scholar] [CrossRef]
- Martínez, J.; Gabarró, C.; Turiel, A.; Catany, R. Arctic+ Salinity: Algorithm Theoretical Baseline Document; European Space Agency: Paris, France, 2020. [Google Scholar] [CrossRef]
- ISAS: Interpolated Fields of Salinity, Temperature and Dissolved Oxygen. Sextant, 2020. Available online: https://sextant.ifremer.fr/geonetwork/srv/api/records/5af9fe23-c18d-4a3e-a646-ea4ba9288d88 (accessed on 8 December 2024).
Disclaimer/Publisher’s Note: The statements, opinions and data contained in all publications are solely those of the individual author(s) and contributor(s) and not of MDPI and/or the editor(s). MDPI and/or the editor(s) disclaim responsibility for any injury to people or property resulting from any ideas, methods, instructions or products referred to in the content. |
© 2025 by the authors. Licensee MDPI, Basel, Switzerland. This article is an open access article distributed under the terms and conditions of the Creative Commons Attribution (CC BY) license (https://creativecommons.org/licenses/by/4.0/).