Abstract
On 28 December 2020, the area of the city of Petrinja was hit by two strong earthquakes of magnitudes 5.0 and 4.7 on the Richter scale, and the following day, 29 December 2020, the same area was hit by an even stronger earthquake of magnitude 6.2. It was one of the two strongest instrumentally recorded earthquakes that hit the territory of the Republic of Croatia in the last hundred years, and the strongest earthquake in the Banovina area after the great earthquake in 1909. Increased seismic activity in this area is caused by two vertical strike–slip faults, Pokupski and Petrinjski. This article aims to determine the displacements of the Earth’s crust caused by seismic activity in this area using GNSS measurements and InSAR techniques and comparing their results. Our study showed that horizontal coseismic displacements of 20 cm and more were limited to a radius of 20 km from the epicenter, with a maximum displacement of around half a meter. Considering the original plate tectonic movements of the region and the time elapsed since the previous earthquake of similar magnitude, the geodynamic movements of the Dinarides area are in substantial part sudden displacements associated with earthquakes.
1. Introduction
Earthquakes occur when the stress from the movement of the rock plates accumulates and, at some point, exceeds the material resistance of the rocks. The displacement along the fault line that accumulates from tectonic processes over decades or centuries occurs in a few tens of seconds or 1–2 min. For certain rock parameters, the displacement may be continuous: no earthquakes are detected. However, larger quakes all suggest that the rock physics parameters of the region are not likely to be ductile, but rather brittle, and thus intermittent.
The last time a quake of the magnitude of the studied 2020 Petrinja earthquake occurred in the region was in Zagreb in 1880 [1]. Although there were many small and medium earthquakes in the region, most of the sudden ground motions associated with earthquakes occur in conjunction with the highest magnitude events. In the present work, we therefore investigate how the displacements associated with the Petrinja earthquake, detected primarily by InSAR remote sensing technology and GNSS, compares with the plate tectonic movement accumulated over 140 years between 1880 and 2020 and not realized during the eventual ongoing displacement and smaller earthquakes. Figure 1 shows the relative horizontal intraplate velocities of the Pannonian basin for CERGN GNSS stations from Grenerczy et al. [2], Grenerczy et al. [3], and Bada et al. [4] (black arrows) with a rough estimation of the ground displacements between the two largest earthquakes in 1880 and 2020 (red arrows).
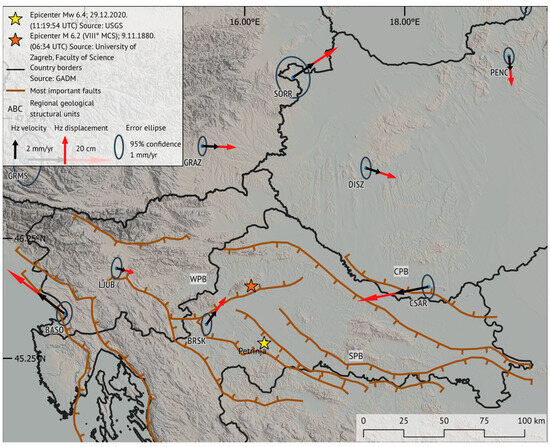
Figure 1.
Relative horizontal velocities of the CEGRN sites over the Pannonian basin (modified after Grenerczy et al. [2], Grenerczy et al. [3], and Bada et al. [4]) and a rough estimation of the ground displacements between the two largest earthquakes that occurred in the Zagreb and Petrinja regions in 1880 and 2020, respectively (red arrows). Black and red arrows are colinear and have the same anchor. Regional geological structural units denoted in the image are WPB (western Pannonian basin), CPB (central Pannonian basin), and SPB (southern Pannonian basin).
While it is typically assumed that earthquakes originate from a singular point referred to as the hypocenter, most of them result from motion along the fault plane [5].
During periods ranging from decades to millennia, stress accumulates in the rocks that separate the fault, and at some point, the amount of deformation exceeds the frictional forces preventing deformation. The fault ruptures, and rocks on both sides of the fault slide rapidly, while simultaneously, the accumulated stress is released. At the moment of rupture, an earthquake occurs. The seismic cycle refers to the observation of a particular part of the fault where earthquakes often occur and can be divided into three periods: inter-seismic, coseismic and post-seismic phases. During the inter-seismic phase, which makes up the majority of this cycle, aseismic movements can occur in the area around the fault. Immediately before the rupture, there is a pre-seismic phase that can be associated with smaller earthquakes (foreshocks). The earthquake itself is marked by a coseismic phase during which rapid motion on the fault generates seismic waves. During those few seconds of an earthquake, the displacement of the Earth’s crust in the area around the fault corresponds to millimeters that accumulate over hundreds of years. The post-seismic phase (aftershocks) occurs after an earthquake, and aftershocks can occur even years after the coseismic phase, followed by a calm phase until the next cycle [6].
On 29 December 2020 at 11:19 (UTC), the central Croatia area, primarily the Sisak-Moslavina county, was affected by an Mw 6.4 (ML 6.2) earthquake (Figure 2). That earthquake was the mainshock of a seismic sequence with the epicenter ~3 km west–southwest of the city of Petrinja at a depth of 10 km and ruptured the Pokupsko–Petrinja fault [7,8,9,10,11]. The highest intensity of the mainshock is estimated as VIII-IX° MCS [11,12,13,14,15,16]. The mainshock was preceded by two foreshocks on 28 December 2020, with magnitudes of Mb 5.2 and Mw 4.8 [7] (Figure 2). This event marks the strongest earthquake recorded in Croatia since the 1880 M ≈ 6.3 Zagreb earthquake [8,17]. It also marks the second largest seismic sequence to hit the central Croatian area in the span of nine months, after the Zagreb earthquake that occurred on 22 March 2020, with a mainshock of Mw 5.5 and the largest aftershock of Mw 4.9, between 4 and 7 km north–northwest of Zagreb [9]. Due to their shallow depths, these Petrinja earthquakes can be characterized as intraplate earthquakes of the Eurasia plate. The origin of the tectonic stress correlates with the kinematics of the Adriatic microplate due to its north–northeast motion and counterclockwise rotation relative to Eurasia [7].
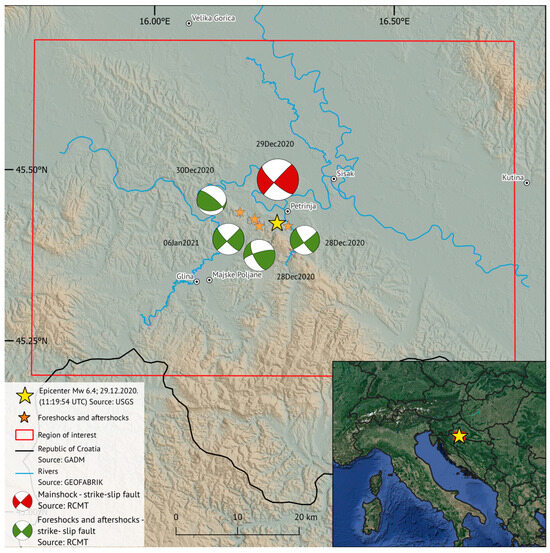
Figure 2.
The epicenters and lower-hemisphere projections of fault-plane solutions for mainshock (with comprehensive quadrants shaded in red) and foreshocks and aftershocks (with comprehensive quadrants shaded in green) are detailed in Table 1. All seismic events illustrated in Figure 2 exhibit characteristics of strike–slip faulting structure, except for the aftershock which occurred the day following the main event and induced a reverse fault rupture. Focal mechanism solutions are generated for earthquakes with moment magnitude exceeding 4.5.
In Figure 2, the focal mechanism solution derived from the European–Mediterranean Regional Centroid-Moment Tensors (RCMT) database (available at http://rcmt2.bo.ingv.it/, accessed on 10 January 2024) is depicted. The figure illustrates preceding foreshocks, the mainshock, and succeeding aftershocks occurring within one month after the mainshock. The main parameters associated with these seismic events are presented in Table 1.

Table 1.
Date, time of occurrence, hypocentral coordinates, magnitudes, and strike, dip, and rake parameters of foreshocks, mainshock and aftershocks. 1 Mainshock, 2 USGS [18], RCMT [19] and EMSC [20].
The earthquake caused extensive damage, especially in Sisak-Moslavina County, where the damage was estimated at EUR 4.8 billion, while the total damage from both the Zagreb and Petrinja earthquakes was estimated to be around EUR 16.5 billion [11,12]. There were at least seven casualties and dozens of injuries; most of the heavily damaged buildings (around 2902 based on OpenStreetMap and Copernicus reports) were in the cities of Petrinja, Sisak, and Glina [21]. As of the end of 2021, a result of the earthquake was the emergence of 122 new sinkholes and 49 historical cover-collapse sinkholes in the vicinity of the villages of Mečečani and Borojevići, approximately 20 km SE of the epicenter [13].
The earthquake in Petrinja has been the subject of multiple research studies. Some have focused on fault ruptures and sinkholes [9,10,13,14,16,22,23,24], while others have examined its effects on buildings and the economy [11,12,17,25]. A lot of the previous research has focused on techniques such as Interferometric Synthetic Aperture Radar (InSAR) [7,21,26,27,28,29] and the Global Navigation Satellite System (GNSS) [8,15,30].
This paper aims to determine the displacements of the Earth’s crust using GNSS measurements and InSAR techniques and comparing their results.
2. Geological Observations
Croatia lies in a seismically active region of the central Mediterranean, a well-known compressional area, which is represented by four geotectonic units on the coastal area spreading from the Eastern Alps and Dinarides to the Adriatic microplate and the Pannonian basin unit on the continent [15,22,29]. The Adriatic microplate is the greatest source of tectonic activity in the south-central area of Europe [31]. In his research work from 1972, Dan Peter McKenzie (1942–) was the first to propose the existence of the Adriatic microplate, observing the independent movement of that area in relation to the Eurasian and African tectonic plates. The Adriatic plate is part of the African plate system, with a small CCW rotation relative to its motion due to the Alpine collision [32,33,34]. Further research observed the movement of the marginal parts of the Adriatic microplate and showed that during earthquakes greater than magnitude M 5.5, there are extensions on the faults near the Apennines in the northeast–southwest (NE-SW) direction, and shortenings in Northern Italy in the N-S direction and in the Croatian and Albanian area in the NE-SW direction. The northeastern part of the microplate subducts under the south-eastern and eastern Alps and the north-western part of the Dinarides, and these results suggest the presence of a clockwise rotating microplate [35]. The Republic of Croatia is located on the area of reverse structures of the Dinarides, the Alps, and the Adriatic. Horizontal movements prevail among these structures, especially in the Alps and the northern part of the Dinarides (Figure 3).
GNSS-based motion studies reveal that the motion of the base stations on the Adriatic coast, i.e., in the SW foreground of the Dinarides Mountains, is northerly, with a rate of about 5 mm/year. In the NE foothills of the mountains, at the edge of the Pannonian basin, this movement is NE, of the order of 1–1.5 mm per year. The forces driving plate tectonic movements are considered to be constant over a time scale of 10–100 years, and we therefore assume that the validity of the GNSS motion survey data available from the mid-1990s can be extrapolated back to at least 150–200 years in the past, and that there would not be large discrepancies even if we had been able to measure the movements using today’s technology. Although this analysis has not yet been carried out in the region, the distortion of the triangulation data from conventional geodetic networks over such a time span is the only data that can be tested. Such studies carried out in the tectonically active and nearby Aegean region confirm this extrapolation there [36]. As we are talking about a colliding and convergent plate boundary, the region is tectonically characterized by thrust faulting and strike–slip-type faulting. The focal mechanism of the Petrinja quake also shows a strike–slip displacement.
The most seismically active areas are the vicinity of Zagreb, Rijeka, the southern Zadar area, parts of the Pannonian basin, and the area between Split and Dubrovnik. Recent scientific research has shown amplitudes of horizontal displacements greater than 3 mm/year for the most of the Dinarides area and the western Panonnian basin, greater than 4 mm/year for the area between Split and Dubrovnik, and for the southern Dalmatian islands higher than 7 mm/year [2,3,4,37,38,39].
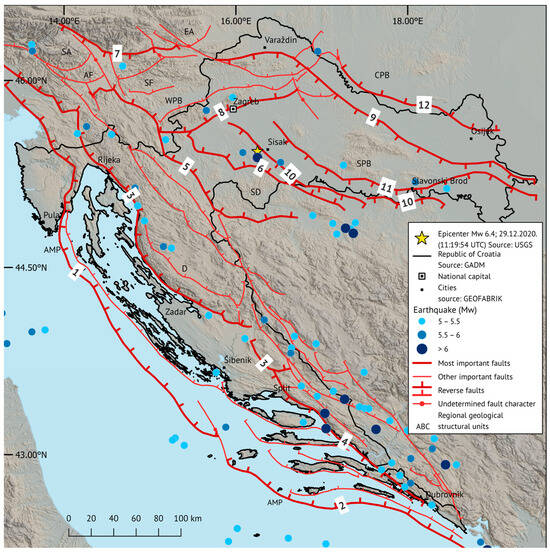
Figure 3.
Fault structures of the wider Croatian area (modified after Pavasović et al. [37]). Regional geological structural units denoted in the image are AMP (Adriatic unit), SA (Southern Alps), EA (Eastern Alps), AF (Prealps), SF (Sava faults), D (Dinarides), SD (Supradinarides), WPB (western Pannonian basin), CPB (central Pannonian basin), and SPB (southern Pannonian basin). The most important faults of the regional structural units: the Trieste–Učka–Vis fault (1), the Vis–South Adriatic fault (2), the Postojna–Rijeka–Vinodol–Velebit–Sinj fault (3), the Mosor–Biokovo–Dubrovnik fault (4), the Ljubljana–Karlovac–Slunj fault (5), the southern border fault of the Pannonian basin (6), the South Alpine fault (7), the Zagreb fault (8), the Peri-Adriatic fault and the Drava fault (9), the Sava fault (10), the Zagreb–Vinkovci fault (11), and the Barča–Baranja fault (12). The epicenters of earthquakes were obtained from the United States Geological Survey (USGS; available at https://www.usgs.gov/, accessed on 1 March 2023), span from 1900 until 2023, and depict earthquakes with a minimum magnitude of 5 Mw.
In the territory of the Republic of Croatia, the GPS technique was used to monitor tectonic shifts in two main geodynamic projects: the Croatian geodynamic project CRODYN and the Geodynamic Network of the city of Zagreb. CRODYN was launched with the aim of monitoring and recording the displacements of the Adriatic microplate based on GPS measurement campaigns [37]. The Geodynamic Network of the city of Zagreb was established in 1997 as the Basic Network of the City of Zagreb and was renamed to its current name in 2001 after the second series of measurements. The network was designed and established with 43 specially stabilized points so that they best represented geodynamic events in that area [40].
The area of the Mw 6.4 earthquake is characterized by two vertical faults (Figure 4). The Pokupsko fault extends along the northeastern edge of Hrastovička Gora in the NW-SE direction, while the Petrinja fault extends in the NE-SW direction [23,41]. The Pokupsko Fault, situated along the southwestern margin of the Sava basin, is one of the most thoroughly studied faults in the region. Although it is not the most active fault in north-western Croatia, it has experienced several destructive events [24]. Considered part of the Sava fault zone, it serves as the southwestern boundary fault of the Pannonian basin. Xiong et al. [24] suggests that this fault is likely part of the Sava fault zone, which is seen as an NE-dipping boundary normal fault zone along the SW margin of the Pannonian basin during the Neogene period. Currently, this fault zone is believed to be reactivated and inverted, accommodating dextral and reverse motions due to the present NE-SW-directed compression in the region.
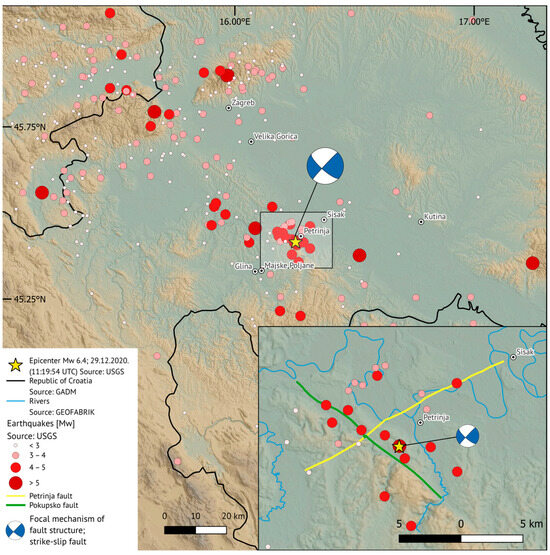
Figure 4.
Epicenters throughout history (1900–2023) within the broader Petrinja area are depicted. The Pokupsko and Petrinja faults have been modified based on the work of Fuček et al. [41].
There are no recordings of strong earthquakes before the 19th century [42]. In the 19th century and at the beginning of the 20th century, the Banovina area was affected by three moderate earthquakes: 18 December 1861 (Mw 5.4), 11 February 1883 (Mw 5.7), and on 8 October 1909 (Mw 5.7) [9]. The latter is one the most famous earthquakes in Croatian history. Based on the recording of that earthquake, the great Croatian scientist and geophysicist Andrija Mohorovičić (1857–1936) improved his knowledge of the mechanism of wave propagation through the ground near the earthquake epicenter and discovered the velocity discontinuity that separates the Earth’s crust from its mantle. In his honor, the discontinuity is named Mohorovičić’s discontinuity. That earthquake was followed by a series of more than 50 earthquakes, the strongest of which occurred on 29 January 1910 (M 5.3). In the last thirty years, until December 2020, the strongest earthquake to hit the area occurred in 1996 (M 4.5) [26].
3. Study Area and Data
The main objective of this article was to investigate ground surface displacement in the wider Petrinja area due to the 2020 earthquake that took place near Petrinja on 29 December, with the epicenter 2.5 km SW from Petrinja, 12 km SW from Sisak, and 15 km SE from Glina [18] (USGS; https://www.usgs.gov/, accessed on 1 March 2024). The study area is shown in Figure 5.
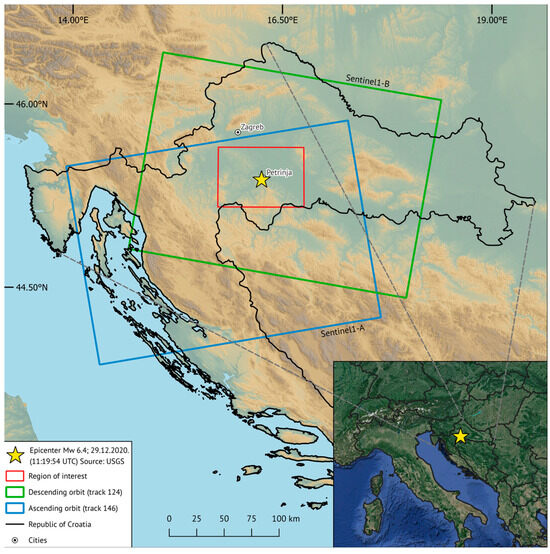
Figure 5.
Location of the study area and coverage of Sentinel-1 SAR data in the Petrinja region.
Two pairs of Interferometric Wide (IW) swath Single Look Complex (SLC) radar im-ages from the Sentinel-1A and Sentinel-1B satellites were used in this research (Table 2). VV polarized images were collected from both ascending and descending orbit with a 12-day revisit cycle. The Sentinel-1A satellite was launched in 2014 and is still active, while Sentinel-1B was launched in 2016 and was active until December 2021. Both satellites are under the control of the European Space Agency (ESA) and operate and were operating in the C-band (5.54 cm wavelength) with 4 possible acquisition modes (SM, IW, EW and WV). IW mode consists of three sub-swaths with a 250 km wide footprint of the Earth’s surface, and IW SLC radar images have a spatial resolution of 5 m × 20 m in the range and azimuth direction [43].

Table 2.
Interferometric pairs used in DInSAR processing of 6.4 Mw 29 December 2020 (mainshock), Petrinja earthquake. Bperp and Btemp represent perpendicular and temporal baseline used for DInSAR processing, respectively.
The short temporal baseline, defined by the short revisit cycle of Sentinel1 satellites (6 days for orbit and 12 days for the satellite), enables the acquisition of images with high coherence and produces more reliable results. The reason lies in the relatively low chance of changes in the Earth’s surface, as well as the mitigation of significant variations in the atmosphere and ionosphere.
4. Geodetic Coseismic Observations
4.1. DInSAR Processing
One pair of SLC Sentinel-1A images and one pair of SLC Sentinel-1B images were processed with the Interferometric synthetic aperture radar Scientific Computing Environment (ISCE) software (version 2.6.3) [44] to generate coseismic ascending and descending interferograms of the 2020 Petrinja earthquake. Coregistration of images was based on precise orbits and a 1 arc sec Shuttle Radar Topography Mission (SRTM) digital elevation model (DEM) [45]. The SRTM DEM was also used to remove flat-earth and topographic phase terms from the images and to geocode them. An adaptive power spectrum filter [46] with an alpha value of 0.9 was used to lower phase noise and to improve measurement accuracy and phase unwrapping. A multilook ratio of 14:4 was applied in both the range and azimuth directions to achieve approximately 50 m pixel posting of the geocoded interferograms. Subsequently, the wrapped interferograms underwent unwrapping using the minimum cost flow (MCF) SNAPHU algorithm [47] to remove the 2π moduli. Post-processing involved geocoding interferograms to the WGS84 (EPSG: 4326) coordinate system with the use of the SRTM DEM and the application of the Global Atmospheric Correction Online Service (GACOS) [48,49,50] for InSAR to mitigate tropospheric phase artifacts. Following this, a point at coordinates 45.73°N and 16.06°E in the WGS84 coordinate system (EPSG:4326) was chosen as a common unwrapping reference point. This reference point exhibited a coherence greater than 0.99 and was situated in the far field of the earthquake deformation zone, experiencing negligible displacement.
In Figure 6, wrapped interferograms of ascending and descending orbits are presented.
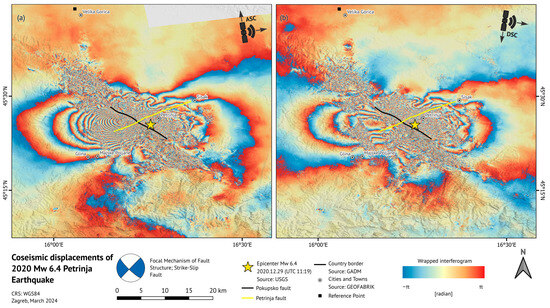
Figure 6.
Sentinel-1A and B wrapped interferograms of (a) ascending orbit (path 124) and (b) descending orbit (path 146).
The wrapped interferogram depicts variations in the distance between phase measurements taken during two satellite passes. These changes in distance can be understood as relative displacements wrapped within 2π moduli. Within the wrapped interferogram, relative displacements can be detected by counting interferometric fringes of the color scale, where each color scale transition (from blue to red) corresponds to half the wavelength of the satellite sensor (2.8 cm for the Sentinel-1 satellite). By counting fringes in Figure 6, one can detect ~36 cm displacements of the western Pokupsko fault plane towards the satellite and ~28 cm displacements of the eastern Pokupsko fault plane away from the satellite for the ascending orbit. For the descending orbit, ~16 cm displacements of the western Pokupsko fault plane away from the satellite and ~26 cm displacements of the eastern Pokupsko fault plane towards the satellite can be observed.
While some limited spatial displacements can be determined from wrapped interferograms, more intuitive and practical results can be obtained by unwrapping wrapped interferograms and converting angular units of the unwrapped phase data into metric scale.
The resulting map comprises LOS ground displacements, which can be either positive or negative, indicating uplift and motion towards the satellite or subsidence and motion away from the satellite, respectively.
As the image acquired on the earlier date was used as a leader in the InSAR process, negative values (purple color in the maps) of the LOS displacements denote a combination of subsidence and horizontal motion away from the sensor direction. On the other hand, green color indicates areas with positive values, representing a combination of uplift and horizontal motion towards the sensor.
In Figure 7, LOS displacement maps of both the ascending and descending orbit are presented. From the LOS displacements of the ascending orbit (Figure 7), it is observed that motion toward the satellite occurs in the north-western part of the Pokupsko fault with a maximum value of around 40 cm, while motion away from the satellite is observed in the south-eastern part of the Pokupsko fault with a maximum negative value of 27 cm. Less extreme values are detected on the map of descending LOS displacements, where a 18 cm north-western motion away from the satellite is detected in the western Pokupsko fault plane and south-eastern motion towards the satellite is detected in the eastern part of the Pokupsko fault with a maximum value of 28 cm.
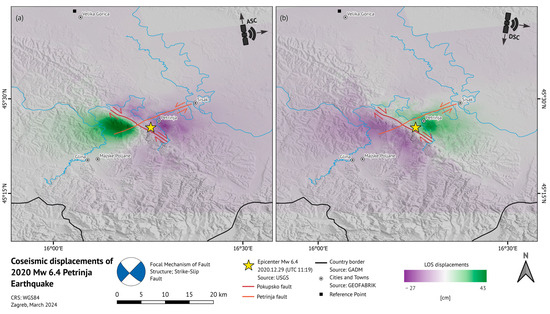
Figure 7.
Sentinel-1A and B LOS displacements of (a) ascending orbit (path 124) and (b) descending orbit (path 146). The common reference point used for phase unwrapping in post-processing is denoted as a black square. The apparent motion of the Pokupsko and Petrinja fault caused by the 2020 Petrinja earthquake is depicted, with fault structures modified after Fuček et al. [41].
It is noteworthy that the displacements obtained by summing interferometric fringes and multiplying by half the sensor wavelength are consistent with the derived LOS coseismic displacements.
The displacements with values of opposite signs can be derived from Figure 6 and are illustrated in Figure 7. The reason for this lies in the different observation geometries. A satellite in ascending orbit observes the Earth’s surface with a sensor oriented to the right (east in terms of cardinal directions), but when it observes the Earth’s surface in descending orbit, flying from north to south, following the “right-looking” convention, it will still sense the Earth’s surface to the right (west in terms of cardinal directions). Different observing geometries, among others, facilitate the correction of specific geometric errors in the images, like layover and foreshortening. Furthermore, observing the same area of the Earth’s surface with at least two different geometries enables the decomposition of 1D LOS displacements into 3D surface displacements.
4.2. GNSS Processing
CROPOS (Croatian Position System) is a national network of reference GNSS stations that enables the application of modern measurement methods and technologies in everyday surveying activities. The system allows for the determination of the coordinates of points across the entire territory of Croatia with the same accuracy, enabling the implementation of new cartographic projections and geodetic data for the area of Croatia. By networking multiple reference stations, external influences such as satellite orbit, ionosphere, troposphere, etc., which lead to limitations in the distance between the rover and the base station, are eliminated, and the problem of ambiguity resolution is resolved [51]. The current network solution of the CROPOS system consists of 56 stations, including neighboring countries to ensure better coverage in the peripheral areas of Croatia [52]. The reference frame of CROPOS is defined with respect to ETRF2000 (R05) by post-processing the measurement data of reference GNSS stations in ITRF2005 for 24 h sessions in GPS week 1503 for epoch 2008.83 with an average coordinate deviation of reference stations of 1.2 mm in the S-N direction (in geodetic latitude), 1.1 mm in the E-W direction (in geodetic longitude), and 3.4 mm in ellipsoidal height [53,54].
CROPOS has three services—the real-time differential positioning service (DPS), the real-time high-precision positioning service (VPPS), and the geodetic precise positioning service (GPPS)—and their differences are explained in Table 3 [54].

Table 3.
CROPOS services.
The GNSS field measurements within this article were performed using the CROPOS VPPS service. Each point was measured in two independent initializations spanning 30 epochs each (1 epoch = 1 second). The measurements were taken in two periods, the first one from January to April 2021 with a Trimble R8s receiver, and the second one during October and November 2021 with a two-frequential GEOMAX Zenith pro GPS device with an integrated antenna. Measurements were taken within the project of the Croatian State Geodetic Administration (CSGA) and by the authors at 289 permanent geodetic stations of the GNSS and trigonometric networks of lower order (Figure 8 and Figure 9).
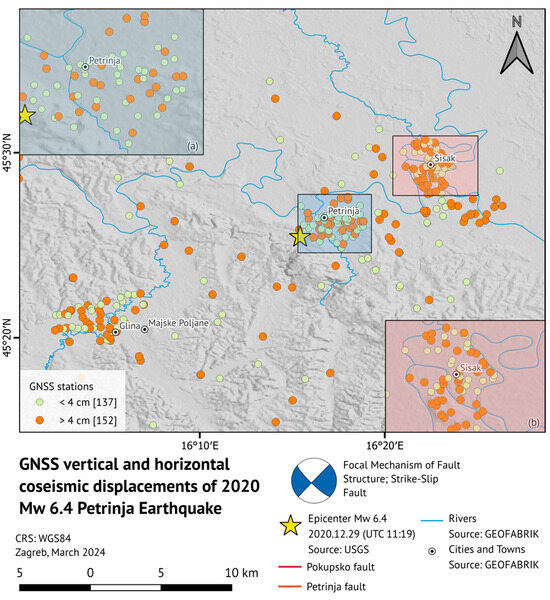
Figure 8.
The figure illustrates the total number of observed GNSS stations. Among the 289 points depicted, 137 stations exhibit both horizontal and vertical movements smaller than 4 cm (white circles). However, due to the uncertainties in GNSS observations, the aforementioned stations are deemed unsuitable for further processing. These stations are considered unsuitable for further processing. Consequently, observations from 152 GNSS points (orange circles) are chosen for further analysis in this study. (a) shows an enlarged area of Petrinja, while (b) shows an enlarged area of Sisak.
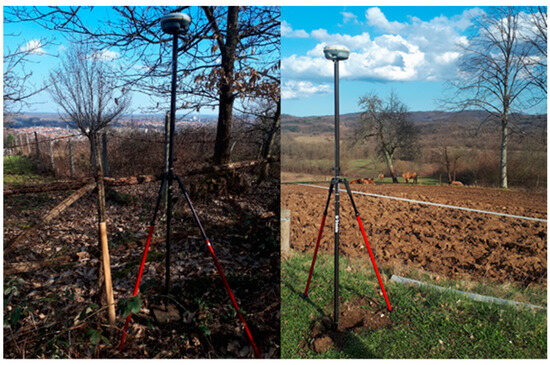
Figure 9.
Field measurements in the wider Petrinja area on 20 February 2021 (left) and in Drenovac Banski on 13 March 2021 (right). All stations of low-order GNSS and trigonometric networks that were observed are stabilized with concrete 20 cm × 20 cm × 60 cm columns with one underground center.
The usage of the CROPOS VPPS real-time service enables the direct conversion to Croatian official cartographic projection HTRS96/TM (EPSG:3765), that is, to plane (E, N) coordinates and normal–orthometric height, in the official Croatian height reference system, HVRS71 (EPSG:5610). The comparison of determined plane coordinates and heights with the official ones from the CSGA database gives independent GNSS coseismic displacements on measured points that can be compared to InSAR. In Table 4, statistical parameters of coordinate differences are given. Parameters , and indicate coordinate differences (), while indicates horizontal displacements. As said above, 137 stations with horizontal and vertical displacements smaller than 4 cm (threshold) were removed from further analysis due to the declared 3D accuracy of the CROPOS VPPS service. Statistics of 152 points are given in Table 5.

Table 4.
Statistical parameters of GNSS coseismic displacements on all points.

Table 5.
Statistical parameters of GNSS coseismic displacements after applying the threshold.
GNSS horizontal displacements, depicted with black arrows in Figure 10, follow the apparent right lateral strike–slip motion of the Pokupsko fault. Figure 10 indicates that the highest concentration of measurement stations is located around the three major cities in the area: Glina, Petrinja and Sisak. The data reveal that the greatest horizontal displacements occur in the Petrinja region, oriented towards the southwest, which correlates with the findings of Fuček et al. [41].
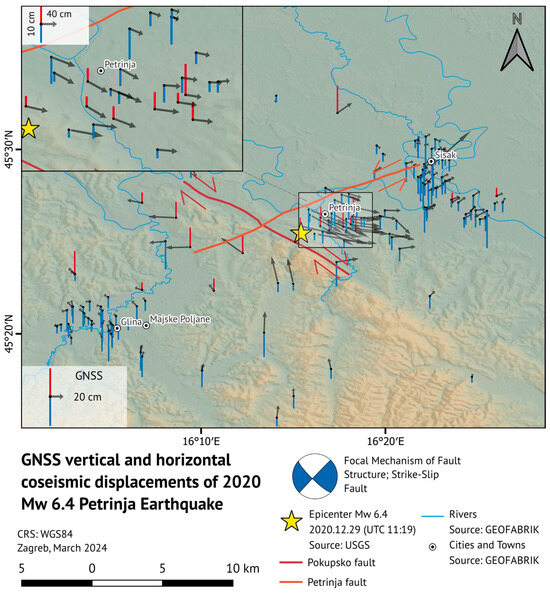
Figure 10.
GNSS-derived coseismic horizontal and vertical displacements. Black arrows and blue and red bars denote GNSS horizontal and vertical displacements, respectively. The apparent motion of the Pokupsko and Petrinja fault caused by the 2020 Petrinja earthquake is depicted, with fault structures modified after Fuček et al. [41].
5. Discussion
In the previous chapter, it was explained how InSAR is confined to LOS measurements from individual orbits and how LOS measurements portray a one-dimensional displacement along its line-of-sight direction. Such spatial displacements encompass vertical displacement, horizontal displacement in the north–south direction, and horizontal displacement in the east–west direction. The north–south component of horizontal displacement is frequently neglected due to its limited capability in detecting displacements in this direction, stemming from the near-polar satellite orbits. On the other hand, results of GNSS observations are three-dimensional coordinates along north, east, and up coordinate axes. To facilitate the comparison and analysis of InSAR and GNSS observations, it is necessary to either project GNSS observations to the satellite LOS direction or decompose InSAR LOS observations into horizontal and vertical planes.
By employing a combination of two independent acquisition modes, both horizontal and vertical displacements can be retrieved from InSAR LOS measurements. Figure 11 and Equation (1) indicate the relationship between the acquisition geometry (incidence angle (ϑ) and azimuth angle (α) of a satellite orbit) and the LOS measurements from ascending and descending orbits [55]:
where and denote horizontal east–west and vertical displacements. The horizontal north–south displacements are neglected in Equation (1) and hence in this research.
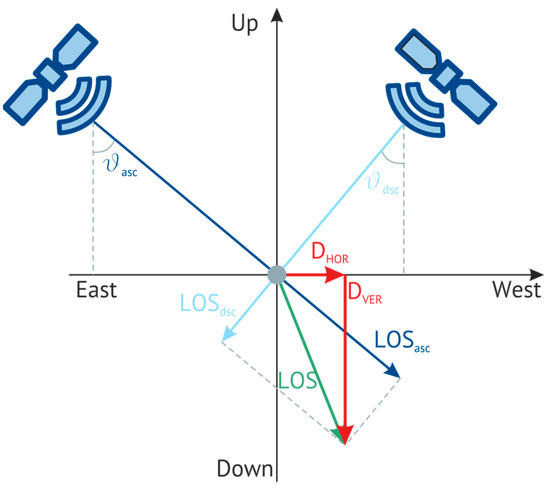
Figure 11.
Decomposition of LOS displacements into vertical and horizontal E–W components using radar images acquired in two independent acquisition geometries.
Figure 12 and Figure 13 depict the overlap of derived InSAR and GNSS coseismic horizontal east–west and vertical displacements caused by the 2020 Petrinja 6.4 Mw earthquake. It should be mentioned that out of 289 observed points, only 152 were considered for further analysis. The remaining points were discarded because they exhibit displacements that may arise due to measurement errors of the CROPOS system.
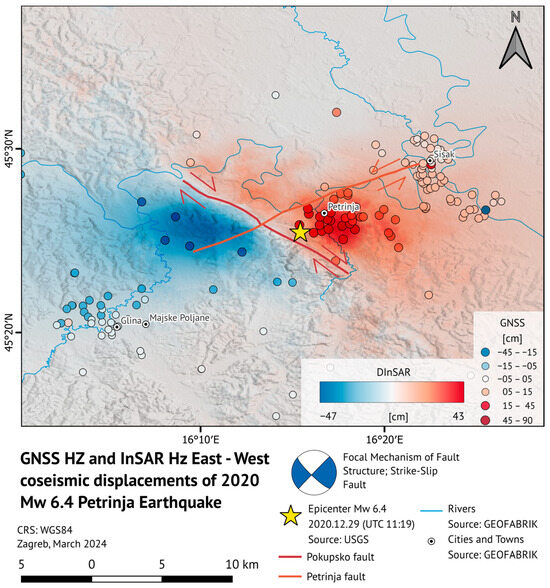
Figure 12.
The overlap of derived coseismic InSAR and GNSS horizontal motion in the east–west direction is illustrated. The apparent motion of the Pokupsko and Petrinja fault caused by the 2020 Petrinja earthquake is depicted, with fault structures modified after Fuček et al. [41].
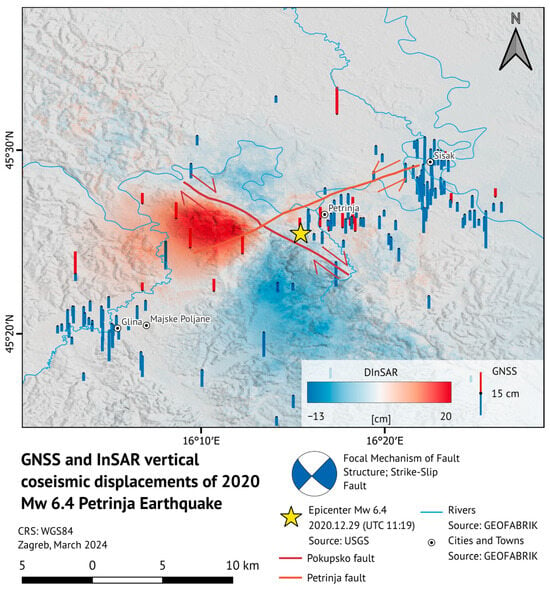
Figure 13.
The overlap of derived coseismic InSAR and GNSS vertical motion is illustrated.
From Figure 12, it is evident that in the north-west segment of the Pokupsko fault, GNSS and InSAR-derived displacements align closely within a few centimeters. Within this region, InSAR records a maximum westward motion of approximately 47 cm, whereas GNSS registers a maximum motion of about 45 cm to the west. Conversely, in the south-eastern section of the Pokupsko fault, proximate to the earthquake’s epicenter, InSAR and GNSS observations exhibit disparity. Here, the GNSS indicates maximum eastward movement of around 90 cm, whereas InSAR records a maximum motion of approximately 43 cm in the same direction. The reason for this disparity could be attributed to interferogram unwrapping, as the earthquake’s epicenter may cause decorrelation due to the significant coseismic fault movement.
Progressing eastward towards the city of Sisak, GNSS and InSAR motions converge. In the vicinity of Sisak, the GNSS records an eastern motion of approximately 10 cm, consistent with the approximate eastern motion detected using InSAR.
Around Glina and Majske Poljane, the InSAR-derived and GNSS-obtained results are consistent with a certain level of reliability. GNSS observations vary between 3 and 9 cm of displacement to the west, while InSAR displacements are around 7 ± 2 cm to the west.
It should be noted that in Figure 12, only east–west horizontal motion is analyzed, neglecting the horizontal north–south motion from both the GNSS and InSAR. However, in Figure 10, GNSS coseismic horizontal motion, comprising both east–west and north–south components caused by the earthquake, is depicted by arrows.
According to the geological map provided by the Croatian Geological Survey (HGI), the presence of the Pokupsko and Petrinja fault systems in the Petrinja region is indicated, as depicted in Figure 4, Figure 6, Figure 7, Figure 10, Figure 12 and Figure 13. These fault structures have been modified based on Fuček et al. [41]. Through a combination of extensive geodetic field surveys and the processing of Sentinel-1 data to generate deformation maps, the existence of the Pokupsko fault has been confirmed. However, regarding the Petrinja fault system, confirmation or denial of its existence could not be conclusively determined.
Figure 13 illustrates both GNSS- and InSAR-derived vertical motion, indicating agreement within a certain level of accuracy. Conversely, in the eastern Pokupsko fault plane, near the earthquake epicenter and Petrinja, InSAR predominantly indicates subsidence of around 2 cm, while GNSS records a combination of subsidence and uplift, with values reaching a maximum of 15 cm for subsidence and 8 cm for uplift. Around the cities of Sisak and Glina, InSAR does not detect significant vertical motion, with values varying from 2 cm of subsidence to 2 cm of uplift. On the other hand, in those areas, the GNSS detects subsidence with values ranging from 3 to 20 cm for both the Sisak and Glina regions. In the south-western part of the Pokupsko fault, InSAR detects subsidence with a rate of approximately 10 cm, albeit with limited confirmation or refutation from GNSS observations. Few GNSS stations in the region south of Petrinja (the southwestern section of the Pokupsko fault) illustrate subsidence of 6 ± 1 cm.
The north-western part of the Pokupsko fault exhibits an uplift of around 12 cm according to the results obtained from InSAR. Although this area is also characterized by a small number of GNSS stations, they show a high degree of correlation with InSAR measurements. GNSS measurements in that area indicate an uplift of that fault block at a level of about 13 cm.
6. Conclusions
With the development of the InSAR technique, it is possible to better understand seismology and understand and explore deformations of the Earth’s surface due to seismic activity. By using radar images before and after earthquakes, valuable data about surface displacement, fault geometry, and earthquake location can be obtained. The reliability of InSAR coseismic results can be supported by carrying out independent GNSS measurements.
For the first of our measurements, an interpretation revealed the InSAR coseismic displacements resulting from the Mw 6.4 Petrinja earthquake, utilizing two differential interferograms obtained and processed from the Sentinel-1 satellite mission. The second part focuses on GNSS observations, where particular emphasis should be placed on the largest number of GNSS observations collected around the areas of the cities of Petrinja, Sisak and Glina. GNSS measurements were carried out at several different time epochs in the months following the earthquake’s mainshock.
The integration of the GNSS and InSAR techniques highlights the complementary nature of the data, exhibiting a relatively high correlation and offering valuable insights into the geodynamic processes within the research area. While the results of GNSS measurements and InSAR processing have relatively high data correlation, discrepancies arise, particularly regarding vertical and east–west horizontal displacements near the earthquake’s epicenter. Such disparities are anticipated, given the potential impact of data decorrelation between interferograms. Furthermore, interferograms depict displacements until 4 January 2021 at the latest, while GNSS measurements were conducted at later stages; moreover, certain GNSS points were measured or remeasured up to 10 months post-earthquake, potentially affected by subsequent seismic activity not captured in interferometric images.
The maximum horizontal displacements caused by the Petrinja earthquake were about half a meter, with displacements exceeding 20 cm along the two affected geological structures, the Petrinja and Pokupsko faults, within 20 km of the epicenter. The maximum displacement values are roughly equivalent to the cumulative value of the 3.5 mm relative annual displacement of the Adriatic and Pannonian microplates over 140 years (Figure 1). Since the displacements occurred over only about half of the distance of about 45 km between Zagreb and Petrinja, it is assumed that displacements greater than 140 years have occurred in the immediate area affected by the earthquake since the last earthquake of this magnitude. However, even in this case, we can still say that a substantial part of the plate tectonic movement in the Dinarides region is related to sudden displacements and earthquakes.
Our work also shows that pure remote sensing (InSAR) and geodetic (GNSS) investigations provide important and mainly magnitude-interpretable data for the interpretation of the geophysical–geodynamic picture of the study area and for natural hazard assessment.
Author Contributions
Conceptualization, M.P. and D.B.; methodology, D.B. and A.B.; software, A.B.; validation, M.P. and D.B.; formal analysis, A.B. and G.T.; investigation, A.B. and D.B.; resources, A.B. and M.P.; data curation, A.B.; writing—original draft preparation, D.B., A.B., M.P. and G.T.; writing—review and editing, G.T.; visualization, A.B.; supervision, G.T. and M.P.; project administration, M.P. All authors have read and agreed to the published version of the manuscript.
Funding
This research received no external funding.
Data Availability Statement
Sentinel-1 SAR images are available through the Alaska Satellite Facility Vertex website (ASF; https://search.asf.alaska.edu/#/; accessed on 1 March 2024); topographic phase delay maps are available through the Generic Atmospheric Correction Online Service website (GACOS; http://www.gacos.net/; accessed on 4 March 2024); focal mechanism solutions are available at the U.S. Geological Survey (USGS; https://earthquake.usgs.gov/earthquakes/search/; accessed on 11 March 2024), European–Mediterranean Regional Centroid-Moment Tensors (RCMT; http://rcmt2.bo.ingv.it; accessed on 11 March 2024), Euro-Mediterranean Seismological Centre (EMSC; https://emsc-csem.org/; accessed on 11 March 2024); earthquake catalogs are available at the International Seismological Centre Global Instrumental Earthquake Catalogue (ISC-GEM; https://doi.org/10.31905/d808b825; accessed on 11 March 2024) and U.S. Geological Survey (USGS; https://earthquake.usgs.gov/earthquakes/search/; accessed on 11 March 2024) website; rivers, urban areas, and administrative borders are available at the GEOFABRIK (https://www.geofabrik.de/; accessed on 20 March 2024) and GADM (https://gadm.org/; accessed on 20 March 2024); and GNSS data are not public.
Acknowledgments
We express our gratitude for the invaluable access to GNSS data generously provided by the Croatian Geodetic State Administration, which enabled us to perform the most comprehensive investigation of the Petrinja earthquake sequence through the integration of GNSS and InSAR technologies.
Conflicts of Interest
The authors declare no conflicts of interest.
References
- Kozák, J.; Čermák, V. Zagreb (Agram) Earthquake, Croatia, 1880. In The Illustrated History of Natural Disasters; Springer: Dordrecht, The Netherlands, 2010; pp. 151–153. [Google Scholar] [CrossRef]
- Grenerczy, G.; Kenyeres, A.; Fejes, I. Present crustal movement and strain distribution in Central Europe inferred from GPS measurement. J. Geophys. Res. 2000, 105, 21835–21846. [Google Scholar] [CrossRef]
- Grenerczy, G.; Sella, G.; Kenyeres, A. Tectonic implications of the GPS velocity field in the northern Adriatic region. Geophys. Res. Lett. 2005, 32, 1–4. [Google Scholar] [CrossRef]
- Bada, G.; Grenerczy, G.; Tóth, L.; Horváth, F.; Stein, S.; Cloetingh, S.; Windhoffer, G.; Fodor, L.; Pinter, N.; Fejes, I. Motion of Adria and ongoing inversion of the Pannonian Basin: Seismicity, GPS velocities, and stress transfer. In Continental Intraplate Earthquakes: Science, Hazard, and Policy Issues; Geological Society of America: Boulder, CO, USA, 2007; pp. 243–262. [Google Scholar] [CrossRef]
- Kearey, P.; Klepeis, K.A.; Vine, F.J. Global Tectonics, 3rd ed.; John Wiley & Sons: Chichester, UK, 2009; p. 10. [Google Scholar]
- Stein, S.; Wysession, M. An Introduction to Seismology, Earthquakes and Earth Structure, 1st ed.; Blackwell Publishing: Malden, MA, USA, 2003; p. 217. [Google Scholar]
- Magyar, B. Coseismic DInSAR Analysis of the 2020 Petrinja Earthquake Sequence. Period. Polytech. Civ. Eng. 2022, 66, 990–997. [Google Scholar] [CrossRef]
- Henriquet, M.; Kordić, B.; Métonis, M.; Lasserre, C.; Baize, S.; Benedetti, L.; Spelić, M.; Vukovski, M. Rapid Remeasure of Densce Civilian Networks as a Game-Changer Tool for Surface Deformation Monitoring: The Case Study of the Mw 6.4 2020 Petrinja Earthquake, Croatia. Geophys. Res. Lett. 2022, 49, e2022GL100166. [Google Scholar] [CrossRef]
- Tondi, E.; Blumetti, A.M.; Čičak, M.; Di Manna, P.; Galli, P.; Invernizzi, C.; Mazzoli, S.; Piccardi, L.; Valentini, G.; Vittori, E.; et al. ‘Conjugate’ coseismic surface faulting related with the 29 December 2020, Mw 6.4, Petrinja earthquake (Sisak-Moslavina, Croatia). Sci. Rep. 2021, 11, 9150. [Google Scholar] [CrossRef]
- Baize, S.; Amoroso, S.; Belić, N.; Benedetti, L.; Boncio, P.; Budić, M.; Cinti, F.; Henriquet, M.; Jamšek Rupnik, P.; Kordić, B.; et al. Environmental effects and seismogenic source characterization of the December 2020 earthquake sequence near Petrinja, Croatia. Geophys. J. Int. 2022, 230, 1394–1418. [Google Scholar] [CrossRef]
- Vlašić, A.; Srbić, M.; Skokandić, D.; Mandić Ivanković, A. Post-Earthquake Rapid Damage Assessment of Road Bridges in Glina County. Buildings 2022, 12, 42. [Google Scholar] [CrossRef]
- Salaman, A.; Stepinac, M.; Matorić, I.; Klasić, M. Post-Earthquake Condition Assessment and Seismic Upgrading Strategies for a Heritage-Protected School in Petrinja, Croatia. Buildings 2022, 12, 2263. [Google Scholar] [CrossRef]
- Tomac, I.; Kovačević Zelić, B.; Perić, D.; Domitrović, D.; Štambuk Cvitanović, N.; Vučenović, H.; Parlov, J.; Stipčević, J.; Matešić, D.; Matoš, B.; et al. Geotehnical reconnaissance of an extensive cover-collapse sinkhole phenomena of 2020–2021 Petrinja earthquake sequence (Central Croatia). Earthq. Spectra 2023, 39, 653–686. [Google Scholar] [CrossRef]
- Šumanovac, F.; Pekaš, Ž. Modelling Cover-Collapse Sinkholes That Appeared after the M6.2 Petrinja Earthquake in Croatia Using Electrical Resistivity Tomography Data. Sustanability 2023, 15, 1124. [Google Scholar] [CrossRef]
- Bjelotomić Oršulić, O.; Varga, M.; Yalvac, S. Seismic Disturbances and Geodetic Effects: Unraveling the Impact of the Mw = 6.2 Petrinja Earthquake on the Croatian Positioning System CROPOS. Geosciences 2024, 14, 6. [Google Scholar] [CrossRef]
- Mihaljević, I.; Zlatović, S. Emabankments Damaged in the Magnitude Mw 6.4 Petrinja Earthquake and Remedation. Geosciences 2023, 13, 48. [Google Scholar] [CrossRef]
- Miranda, E.; Brzev, S.; Bijelic, N.; Arbanas, Ž.; Bartolac, M.; Jagodnik, V.; Lazarević, D.; MihalićArbanas, S.; Zlatović, S.; Acosta, A.; et al. StEER-EERI: Petrinja, Croatia December 29, 2020, Mw 6.4 Earthquake; Joint Reconnaissance Report; Designsafe-CI: Miami, FL, USA, 2021; Volume 1, pp. 1–13. [Google Scholar] [CrossRef]
- USGS. United States Geological Survey Earthquake Hazards Program. Available online: https://www.usgs.gov/programs/earthquake-hazards/earthquakes (accessed on 10 January 2024).
- RCMT. European-Mediterranean Regional Centroid-Moment Tensors. Available online: http://rcmt2.bo.ingv.it (accessed on 9 January 2024).
- EMSC. Euro-Mediterranean Seismological Centre. Available online: https://emsc-csem.org/ (accessed on 1 March 2024).
- Karimzadeh, S.; Matsouka, M. A Preliminary Damage Assessment Using Dual Path Synthetic Aperture Radar Analysis for the M 6.4 Petrinja Earthquake (2020), Croatia. Remote Sens. 2021, 13, 2267. [Google Scholar] [CrossRef]
- Pollak, D.; Gulam, V.; Novosel, T.; Avanić, R.; Tomljenović, B.; Hećej, N.; Terzić, J.; Stipčević, J.; Bačić, M.; Kurečić, T.; et al. The preliminary inventory of coseismic ground failures related to December 2020–January 2021 Petrinja earthquake series. Geol. Croat. 2021, 74, 189–208. [Google Scholar] [CrossRef]
- Bočić, N. Structural-geomorphological aspects of the Petrinja earthquake M6. 2 (Croatia)-preliminary considerations. Hrvat. Geogr. Glas. 2021, 83, 5–24. [Google Scholar] [CrossRef]
- Xiong, W.; Yu, P.; Chen, W.; Liu, G.; Zhao, B.; Nie, Z.; Qiao, X. The 2020 Mw 6.4 Petrinja earthquake: A dextral event with large coseismic slip highlights a complex fault system in northwestern Croatia. Geophys. J. Int. 2022, 228, 1935–1945. [Google Scholar] [CrossRef]
- Atalić, J.; Demšić, M.; Baniček, M.; Uroš, M.; Dasović, I.; Prevolnik, S.; Kadić, A.; Šavor Novak, M.; Nastev, M. The December 2020 magnitude (Mw) 6.4 Petrinja earthquake, Croatia; seismological aspects, emergency response and impacts. Bull. Earthq. Eng. 2023, 21, 5767–5808. [Google Scholar] [CrossRef]
- Markušić, S.; Stanko, D.; Penava, D.; Ivančić, I.; Bjelotomić Oršulić, O.; Korbar, T.; Sarhosis, V. Destructive M6.2 Petrinja Earthquake (Croatia) in 2020—Preliminary Multidisciplinary Research. Remote Sens. 2021, 13, 1905. [Google Scholar] [CrossRef]
- Achmad, A.R.; Lee, C. Surface Deformation Measurement of the 2020 Mw 6.4 Petrinja, Croatia Earthquake Using Sentinel-1 SAR Data. Korean J. Remote Sens. 2021, 37, 139–151. [Google Scholar]
- Zhu, S.; Wen, Y.; Gong, X.; Liu, J. Coseismic and Early Postseismic Deformation of the 2020 Mw 6.4 Petrinja Earthquake (Croatia) Revealed by InSAR. Remote Sens. 2023, 15, 2617. [Google Scholar] [CrossRef]
- Ganas, A.; Elias, P.; Valkaniotis, S.; Tsironi, V.; Karasante, I.; Briole, P. Petrinja Earthquake Moved Crust 10 Feet; Temblor: Redwood City, CA, USA, 2021. [Google Scholar]
- Bačić, Ž.; Šugar, D.; Nevistić, Z. Quick use of satellite and GI techonologies after earthquake—Petrinja 29.12.2020. In Proceedings of the 8th International Conference Contemporary Achievments in Civil Engineering, Subotica, Serbia, 22–23 April 2021; pp. 579–588. [Google Scholar]
- Caporali, A.; Aichhorn, C.; Becker, M.; Fejes, I.; Gerhatova, L.; Ghitau, D.; Gremerczy, G.; Hefty, J.; Krauss, S.; Medak, D.; et al. Geokinematics of Central Europe: New insights from the CERGOP-2/Environment Project. J. Geodyn. 2008, 45, 246–256. [Google Scholar] [CrossRef][Green Version]
- Horváth, F. Towards a mechanical model of the Pannonian Basin. Tectonophys 1993, 226, 333–357. [Google Scholar] [CrossRef]
- Faccenna, C.; Becker, T.; Auer, L.; Billi, A.; Boschi, L.; Brun, J.-P.; Capitano, F.A.; Funicello, F.; Horváth, F.; Jolivet, L.; et al. Mantle dynamics int he Meriterranian. Rev. Geophys. 2014, 52, 283–332. [Google Scholar] [CrossRef]
- Király, Á.; Faccenna, C.; Funicello, F. Subduction zones interaction around the Adria microplate and the origin of the Appenninic arc. Tectonics 2018, 37, 3941–3953. [Google Scholar] [CrossRef]
- Anderson, H.; Jackson, J. Active tectonics of the Adriatic Region. Geophys. J. Int. 1987, 91, 937–983. [Google Scholar] [CrossRef]
- Billiris, H.; Paradissis, D.; Veis, G.; England, W.; Featherstone, W.; Parsons, B.; Cross, P.; Rands, P.; Rayson, M.; Sellers, P.; et al. Geodetic determination of tectonic deformation in Central Greece from 1900 to 1988. Nature 1991, 350, 124–129. [Google Scholar] [CrossRef]
- Pavasović, M.; Đapo, A.; Marjanović, M.; Pribičević, B. Present Tectonic Dynamics of the Geological Structural Setting of the Eastern Part of the Adriatic Region Obtained from Geodetic and Geological Data. Appl. Sci. 2021, 11, 5735. [Google Scholar] [CrossRef]
- Hefty, J. Geo-kinematics of Central and South-East Europe resulting from combination of various regional GPS velocity fields. Acta Geodyn. Geomater. 2007, 148, 173–189. [Google Scholar]
- Porkoláb, K.; Broerse, T.; Kenyeres, A.; Békési, E.; Tóth, S.; Magyar, B.; Wesztergom, V. Active tectonics of the Circum-Pannonian region in the light of updated GNSS network data. Acta Geod. Geophys. 2023, 58, 149–173. [Google Scholar] [CrossRef]
- Pribičević, B.; Đapo, A. Analiza pomaka na Geodinamičkoj mreži Grada Zagreba iza različitih vremenskih epoha. Geod. List. 2016, 70, 207–230. [Google Scholar]
- Fuček, L.; Matičec, D.; Vlahović, I.; Oštrić, N.; Prtoljan, B.; Korbar, T.; Husinec, A. Basic Geological Map of the Republic of Croatia, Scale 1:50 000: Sheet Cres 2, (417/2); Croatian Geological Survey (Department of Geology): Zagreb, Croatia, 2012; ISBN 978-953-6907-26-7. [Google Scholar]
- Herak, D.; Herak, M.; Tomljenović, B. Seismicity and earthquake focal mechanisms in North-Western Croatia. Tectonophysics 2008, 465, 212–220. [Google Scholar] [CrossRef]
- ESA. European Space Agency. Available online: https://sentiwiki.copernicus.eu/ (accessed on 2 February 2024).
- Rosen, P.A.; Gurrola, E.M.; Agram, P.; Cohen, J.; Lavalle, M.; Riel, B.V.; Fattahi, H.; Aivazis, M.A.G.; Simons, M.; Buckley, S.M. The InSAR scientific computing environment 3.0: A flexible framework for NISAR operational and user-led science processing. In Proceedings of the IGARSS 2018—2018 IEEE International Geoscience and Remote Sensing Symposium, Valencia, Spain, 22–27 July 2018; pp. 4897–4900. [Google Scholar] [CrossRef]
- Farr, T.G.; Rosen, P.A.; Caro, E.; Crippen, R.; Duren, R.; Hensley, S.; Kobrick, M.; Paller, M.; Rodriguez, E.; Roth, L.; et al. The Shuttle Radar Topography Mission. Rev. Geophys. 2007, 45, 1–33. [Google Scholar] [CrossRef]
- Goldstein, R.M.; Werner, C.L. Radar interferogram filtering for geophysical applications. Geophys. Res. Lett. 1998, 25, 4035–4038. [Google Scholar] [CrossRef]
- Chen, C.W.; Zebker, H.A. Two-dimensional phase unwrapping with use of statistical models for cost functions in nonlinear optimization. J. Opt. Soc. Am. 2001, 18, 338–351. [Google Scholar] [CrossRef]
- Yu, C.; Penna, N.T.; Li, Z. Generation of real-time mode high-resolution water vapor fields from GPS observations. J. Geophys. Res. Atmos. 2017, 122, 2008–2025. [Google Scholar] [CrossRef]
- Yu, C.; Li, Z.; Penna, N.T. Interferometric synthetic aperture radar atmospheric correction using a GPS-based iterative tropospheric decomposition model. Remote Sens. Environ. 2018, 204, 109–121. [Google Scholar] [CrossRef]
- Yu, C.; Li, Z.; Penna, N.T.; Crippa, P. Generic atmospheric correction model for interferometric synthetic aperture radar observations. J. Geophys. Res. Solid Earth 2018, 123, 9202–9222. [Google Scholar] [CrossRef]
- Marjanović, M. CROPOS—Hrvatski pozicijski sustav. Ekscentar 2010, 12, 28–34. [Google Scholar]
- Ciprijan, M.; Marjanović, M.; Premužić, M. CROPOS—Status i razvoj sustava. In Zbornik Radova 4, Proceedings of the CROPOS Konferencije, Zagreb, Croatia, 22 May 2015; Hrvatsko Geodetsko Društvo i Državna Geodetska Uprava: Zagreb, Croatia, 2015; pp. 34–41. [Google Scholar]
- Pavasović, M.; Marjanović, M.; Bašić, T. Praćenje stabilnosti koordinata CROPOS stanica. In Zbornik Radova 3, Proceedings of the CROPOS Konferencije, Zagreb, Croatia, 24–25 October 2013; Hrvatsko Geodetsko Društvo i Državna Geodetska Uprava: Zagreb, Croatia, 2013; pp. 36–43. [Google Scholar]
- Marjanović, M.; Miletić, I.; Vičić, V. CROPOS—Prvih šest mjeseci rada sustava. In Zbornik Radova 1, Proceedings of the CROPOS Konferencije, Zagreb, Croatia 8–9 June 2009; Hrvatsko Geodetsko Društvo i Državna Geodetska Uprava: Zagreb, Croatia, 2009; pp. 15–21. [Google Scholar]
- Mora, O.; Ordoqui, P.; Iglesias, R.; Blanco, P. Earthquake Rapid Mapping Using Ascending and Descending Sentinel-1 TOPSAR Interferograms. Procedia Comput. Sci. 2016, 100, 1135–1140. [Google Scholar] [CrossRef]
Disclaimer/Publisher’s Note: The statements, opinions and data contained in all publications are solely those of the individual author(s) and contributor(s) and not of MDPI and/or the editor(s). MDPI and/or the editor(s) disclaim responsibility for any injury to people or property resulting from any ideas, methods, instructions or products referred to in the content. |
© 2024 by the authors. Licensee MDPI, Basel, Switzerland. This article is an open access article distributed under the terms and conditions of the Creative Commons Attribution (CC BY) license (https://creativecommons.org/licenses/by/4.0/).