You are currently on the new version of our website. Access the old version .
Remote SensingRemote Sensing
  • Article
  • Open Access

4 November 2021

A 3D Reconstruction Framework of Buildings Using Single Off-Nadir Satellite Image

,
,
and
1
College of Information and Communication Engineering, Harbin Engineering University, Harbin 150001, China
2
Key Laboratory of Advanced Marine Communication and Information Technology, Ministry of Industry and Information Technology, Harbin Engineering University, Harbin 150001, China
*
Author to whom correspondence should be addressed.
This article belongs to the Special Issue Object-Level Remote Sensing Image Information Extraction and Applications

Abstract

A novel framework for 3D reconstruction of buildings based on a single off-nadir satellite image is proposed in this paper. Compared with the traditional methods of reconstruction using multiple images in remote sensing, recovering 3D information that utilizes the single image can reduce the demands of reconstruction tasks from the perspective of input data. It solves the problem that multiple images suitable for traditional reconstruction methods cannot be acquired in some regions, where remote sensing resources are scarce. However, it is difficult to reconstruct a 3D model containing a complete shape and accurate scale from a single image. The geometric constraints are not sufficient as the view-angle, size of buildings, and spatial resolution of images are different among remote sensing images. To solve this problem, the reconstruction framework proposed consists of two convolutional neural networks: Scale-Occupancy-Network (Scale-ONet) and model scale optimization network (Optim-Net). Through reconstruction using the single off-nadir satellite image, Scale-Onet can generate water-tight mesh models with the exact shape and rough scale of buildings. Meanwhile, the Optim-Net can reduce the error of scale for these mesh models. Finally, the complete reconstructed scene is recovered by Model-Image matching. Profiting from well-designed networks, our framework has good robustness for different input images, with different view-angle, size of buildings, and spatial resolution. Experimental results show that an ideal reconstruction accuracy can be obtained both on the model shape and scale of buildings.

1. Introduction

For a long time, 3D building reconstruction technology based on remote sensing information has a wide range of application requirements in people’s livelihood [1] and military applications. At present, some building reconstruction work still relies on manual drawing or UAV surveying and mapping [2,3], which often costs a lot of time. Many researchers are devoted to exploring methods that use remote sensing information to automatically reconstruct 3D models [4,5,6]. Generally, based on the input data, the reconstruction methods commonly used can be classified into the following three categories. Firstly, the most common method is based on stereo matching [7], which uses two or multiple images that meet certain conditions, such as intersection angle, overlap, and base-to-height ratio, to reconstruct the entire scene. Secondly, a class of methods takes a segment of motion or a set of time series images as input, combining the Structure from Motion [8] (SfM) with Multi View System (MVS) to perform feature matching and generate the sparse or dense point cloud. Thirdly, a few researchers have proposed methods for building information extraction using the single image [9,10], which can get the height, contour, and floor area of buildings. To generate the complete 3D model, it is often necessary to utilize auxiliary reconstruction information such as the Digital Surface Model [11] (DSM). Nevertheless, such research can not meet the requirements of an accurate model shape and scale in the remote sensing reconstruction field, which still has great application limitations.
In recent years, satellite technology and imaging sensor technology have made significant progress, but remote sensing images data are still expensive and scarce in some areas. Finding multiple remote sensing images that can meet input conditions for traditional high-accuracy reconstruction methods in some regions is costly. Therefore, in this case, the advantages of 3D reconstruction using a single image are highlighted in terms of simplifying the data. It can offer a new possibility for reconstruction tasks. However, reconstructing water-tight mesh models with complete building shapes and size is a big challenge. The problems in single image reconstruction techniques are also apparent. Firstly, it is challenging to obtain strict geometric constraints from the single image due to the inability of the traditional methods to estimate the information of occluded parts accurately, which will cause reconstruction results containing incomplete geometric structures. Secondly, the images received from different satellites have different view-angles. The azimuth angle determines which parts of the building are occluded, and the elevation angle affects the size of the roof and facade in images, which are both essential for extracting geometric information. Thirdly, estimating the exact size of buildings is also an essential mission in the remote sensing field. Different image spatial resolutions, building size, etc., will increase the difficulty of estimating the exact size. In summary, solving the above problems is key to achieving single image reconstruction.
In this paper, we proposed a 3D Model Reconstruction framework of buildings (3DMR framework) that only uses the single off-nadir satellite image. The framework consists of three parts: Water-tight mesh model reconstruction network, model scale optimization network, and the restoration algorithm for reconstructed scenes. In the first part, based on the network structure of the Occupancy Network [12], we add the scale factor to improve the Scale-Occupancy-Network (Scale-ONet). It establishes mapping from 2D satellite images to 3D space, generating water-tight mesh models with accurate an shape and rough scale by using feature extraction capabilities of convolutional neural networks to replace the traditional 3D space solution process. Scale-ONet can adapt to the building with different sizes and images with multiple azimuth angles, elevation angles, and spatial resolutions. In the second part, the scale accuracy of reconstructed models from Scale-ONet is further improved by the proposed model scale optimization network (Optim-Net). The evaluation metrics with ground truth are promoted. In the last part, we design a Model-Image matching algorithm to place the independent reconstructed models in the same scene. The relative position relationships between buildings in the image and the azimuth angle of the buildings can be recovered accurately. Our framework takes both the model shape and model scale into account. While reducing the requirements for input data, our framework also enhances the application potential. The final reconstruction model can reach LoD2, a standard for characterizing the fineness of building models proposed by CityGML [13]. The significant contributions of this paper can be summarized as follows:
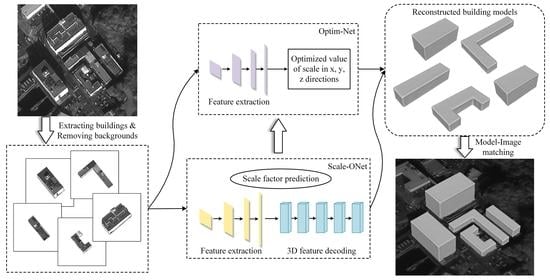
  • A 3D model reconstruction framework was proposed, which can generate water-tight mesh models from the single satellite image;
  • By setting the scale factor, Scale-ONet was proposed to reconstruct models from the single image, which has a different view-angle, size of buildings, spatial resolutions;
  • Optim-Net was proposed to optimize scale value in different directions and generate optimized building models with accurate scales.
This paper is organized as follows: Section 2 reviews some typical research related to the proposed framework. Section 3 elaborates on the structure of the proposed framework and the specific implementation of the improved network. In Section 4, experiments and analyses on different types of images verify the flexibility and robustness of our proposed framework. A comprehensive summary of the work is presented in Section 5.

3. Methodology

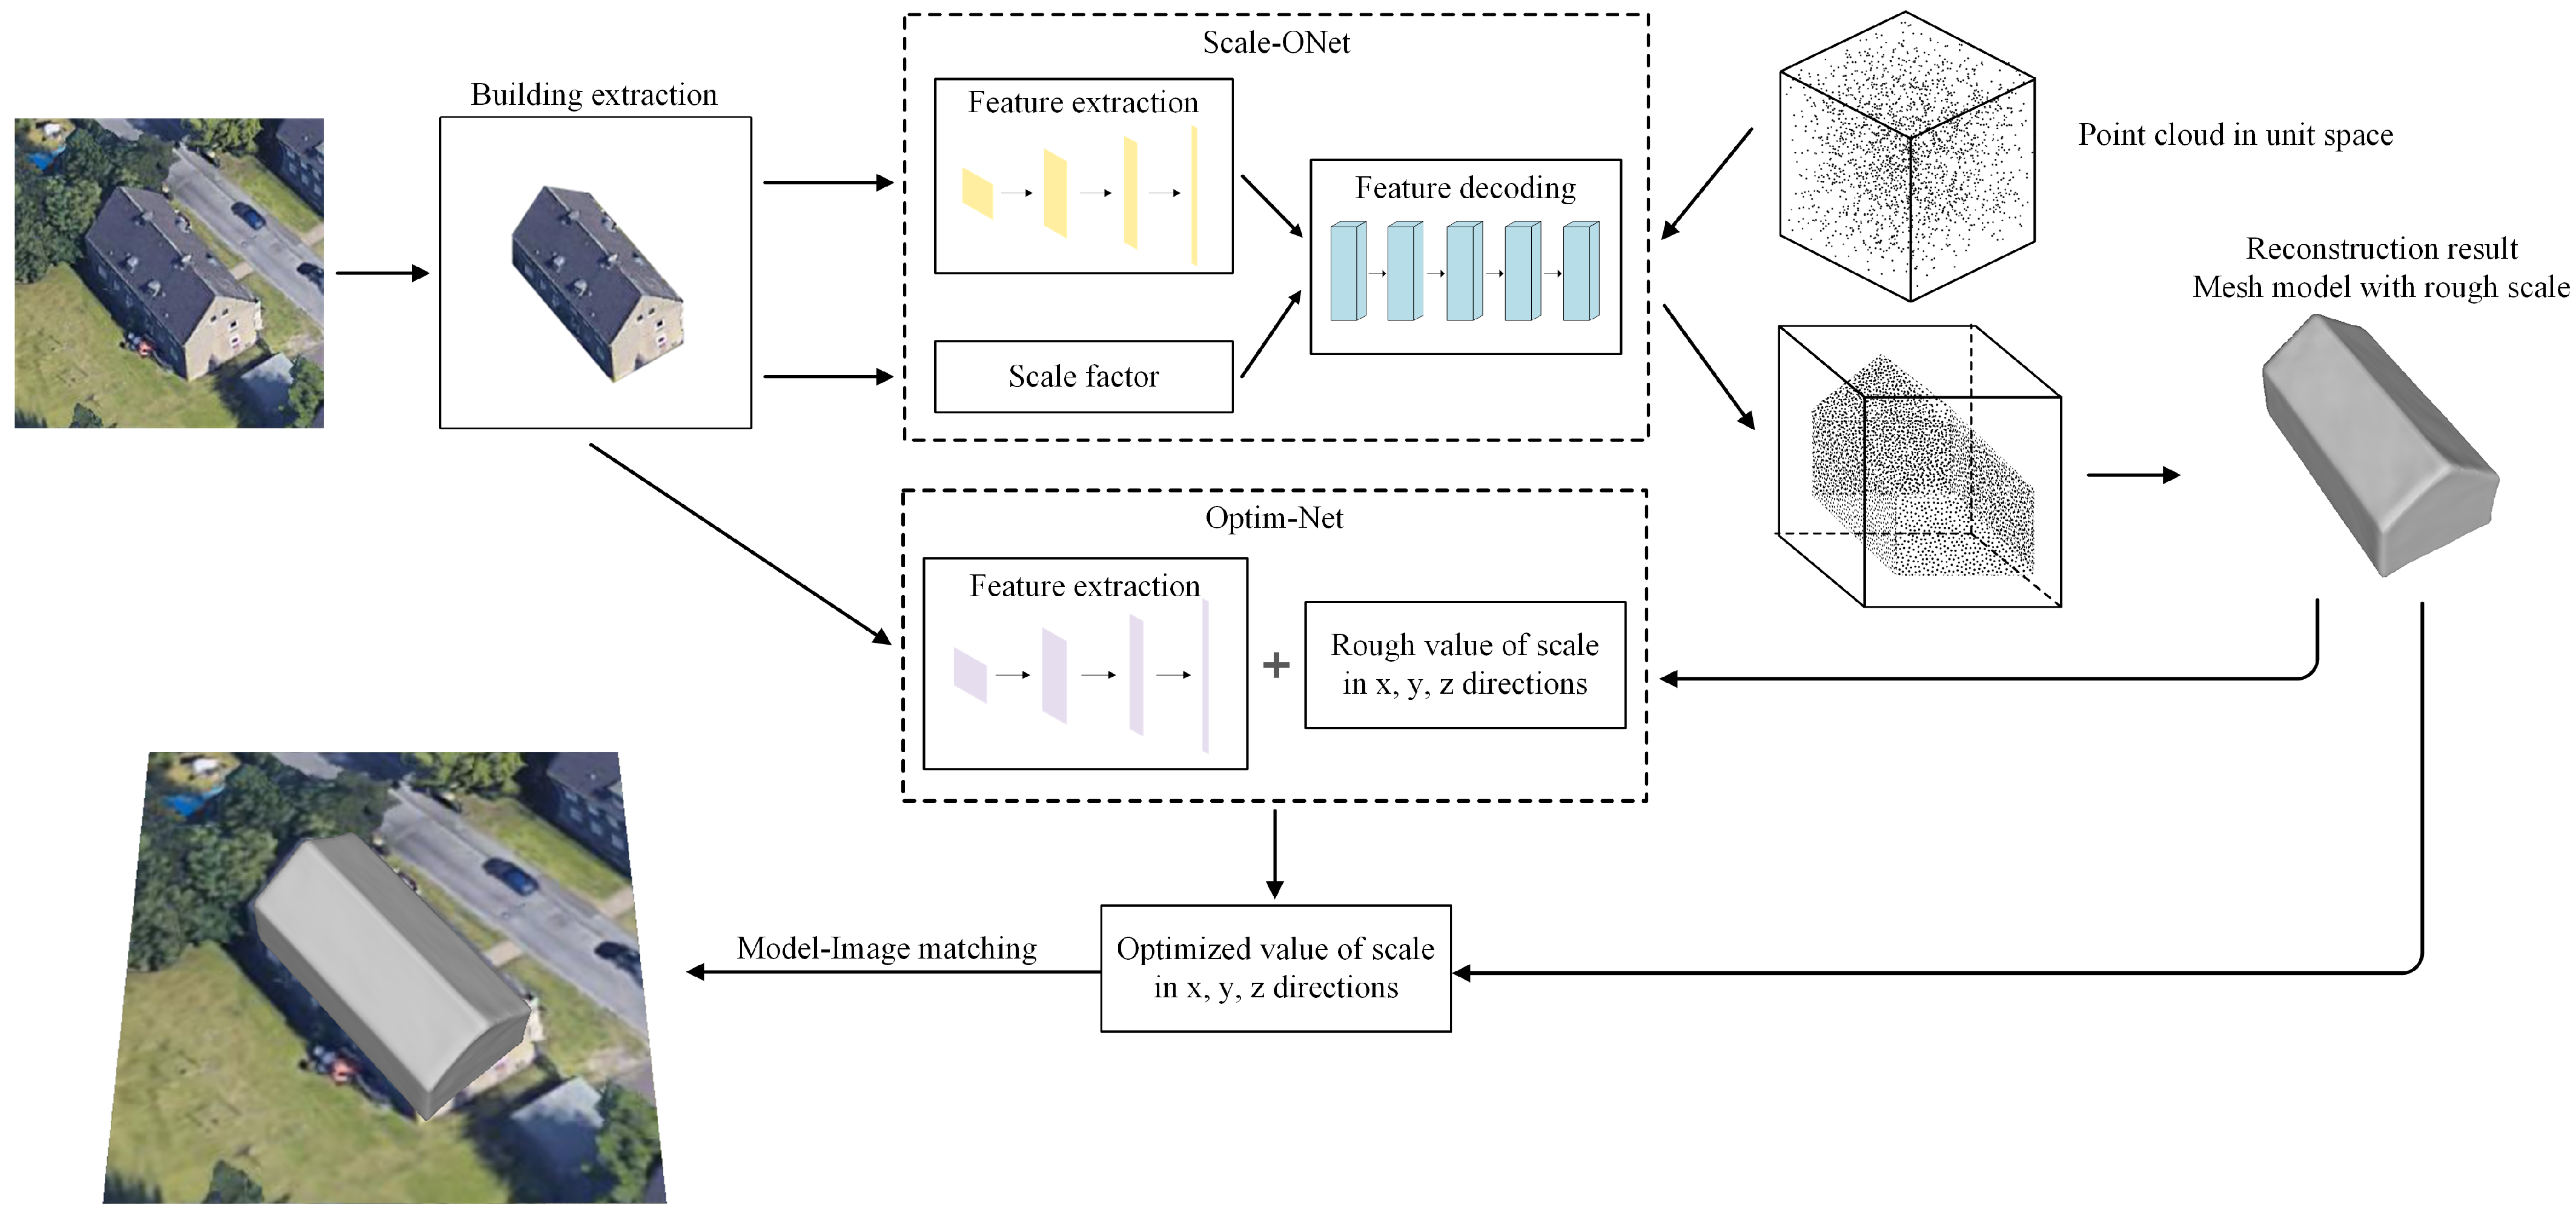
3.1. 3D Model Reconstruction Framework of Buildings

The 3DMR framework is divided into three parts. The main part is Scale-ONet, which reconstructs a complete building water-tight mesh model from the single off-nadir satellite image. The second part is Optim-Net, which optimizes the scale of these mesh models. The third part is the Model-Image matching algorithm, which can restore the entire scene. The structure of the framework is shown in Figure 1. Regarding the input data of networks, both the image and 3D mesh model are processed, whether in the training or testing stage. Since there is much interfering information in the image, apart from the buildings, when using a neural network for feature extraction, in order to reduce the influence of interfering information on the reconstruction result, the background in the original image needs to be removed. The mesh structure is chosen as the resulting form, which has good visual effects and can express more model details. In the proposed 3DMR framework, the scale factor s is added to the network to reconstruct the rough scale of building models, forming an improved Scale-Occupancy-Network (Scale-ONet). The network produces a 3D probability space, and all points in this space have a value, which indicates the probability that this point is inside the building model. Then the complete building model is extracted from this 3D space. After obtaining the complete building mesh model, the scale optimization network (Optim-Net) optimize the value of scale with this model in x, y, and z directions of the axis, using the features extracted from the corresponding image, the result model has a accurate building shape and scale.
Figure 1. Structure of 3D building reconstruction framework. The dotted boxes are the two main parts of the framework. Scale-ONet generates the building model from the input images and point clouds. Optim-Net optimizes the scale of the reconstructed model based on the original input images.

3.2. Scale-ONet

Scale-ONet makes full use of the available information for reconstruction in a single image. Meanwhile, in order to solve the key problem in the field of remote sensing reconstruction, we modified part of its training and testing strategy, and added the scale factor. Implementation details are introduced in this section.

3.2.1. Overall Structure

The network structure of Scale-ONet is shown in Figure 2. The encoder extracts the building features from the input image and feeds them into the decoder together with the coordinates of the point cloud in unit space. In the training stage, the point cloud is sampled randomly. In the test stage, the point cloud is sampled regularly to generate exquisite and accurate building mesh models. According to the structure of Scale-ONet, the mapping between input and output can be expressed by the following equation:
I s = F n D E ( i b ) , m = 1 M x m , I [ 0 , 1 ]
M = M C p I ( p | p τ )
where i is the input image and b is the background information. Encoder E extracts features from images, and decoder D predicts the probability of point x m , which is sampled randomly or regularly from the unit 1 space. F n indicates that the iteration is performed n times. The output I is a unit space, the value of each point in this space is a probability in 0–1. Then, I is scaled according to the factor s obtained by the decoder. Finally, the threshold τ distinguishes points whether in the models or not in I and the complete mesh model is generated by the Matching Cube algorithm. Affected by network adjustment, for learning the network parameters, the loss function is redefined. Its formula is as follows:
L B ( θ ) = 1 B i = 1 B j = 1 K L ( f θ ( p i j , x i ) , ( o i j , s i ) )
where B is the number of models in the training batch and K is the number of sampling points in the model. f θ is the mapping from 2D image to 3D probability space. The input p i j is the coordinates of points, x i is the features extracted from the input image. Outputs are the predicted occupancy probability and scale. o i j o ( p i j ) represents the true space occupation probability at p i j . For the sampling point cloud in the training sets, the values of points on the surface or inside the model are set to 1, while the values of points outside the model are set to 0, representing probabilities of 100% and 0%. The output values of points predicted by the decoder in Scale-ONet are continuous, in the 0–1. L ( · , · ) is the cross-entropy classification loss.
Figure 2. Structure of Scale-ONet convolutional neural network. The left dotted box is the feature extraction module. The right dotted box is the feature decoding module composed by five decoding blocks. The predicted scale factor s is used to adjust the size of the reconstructed model.

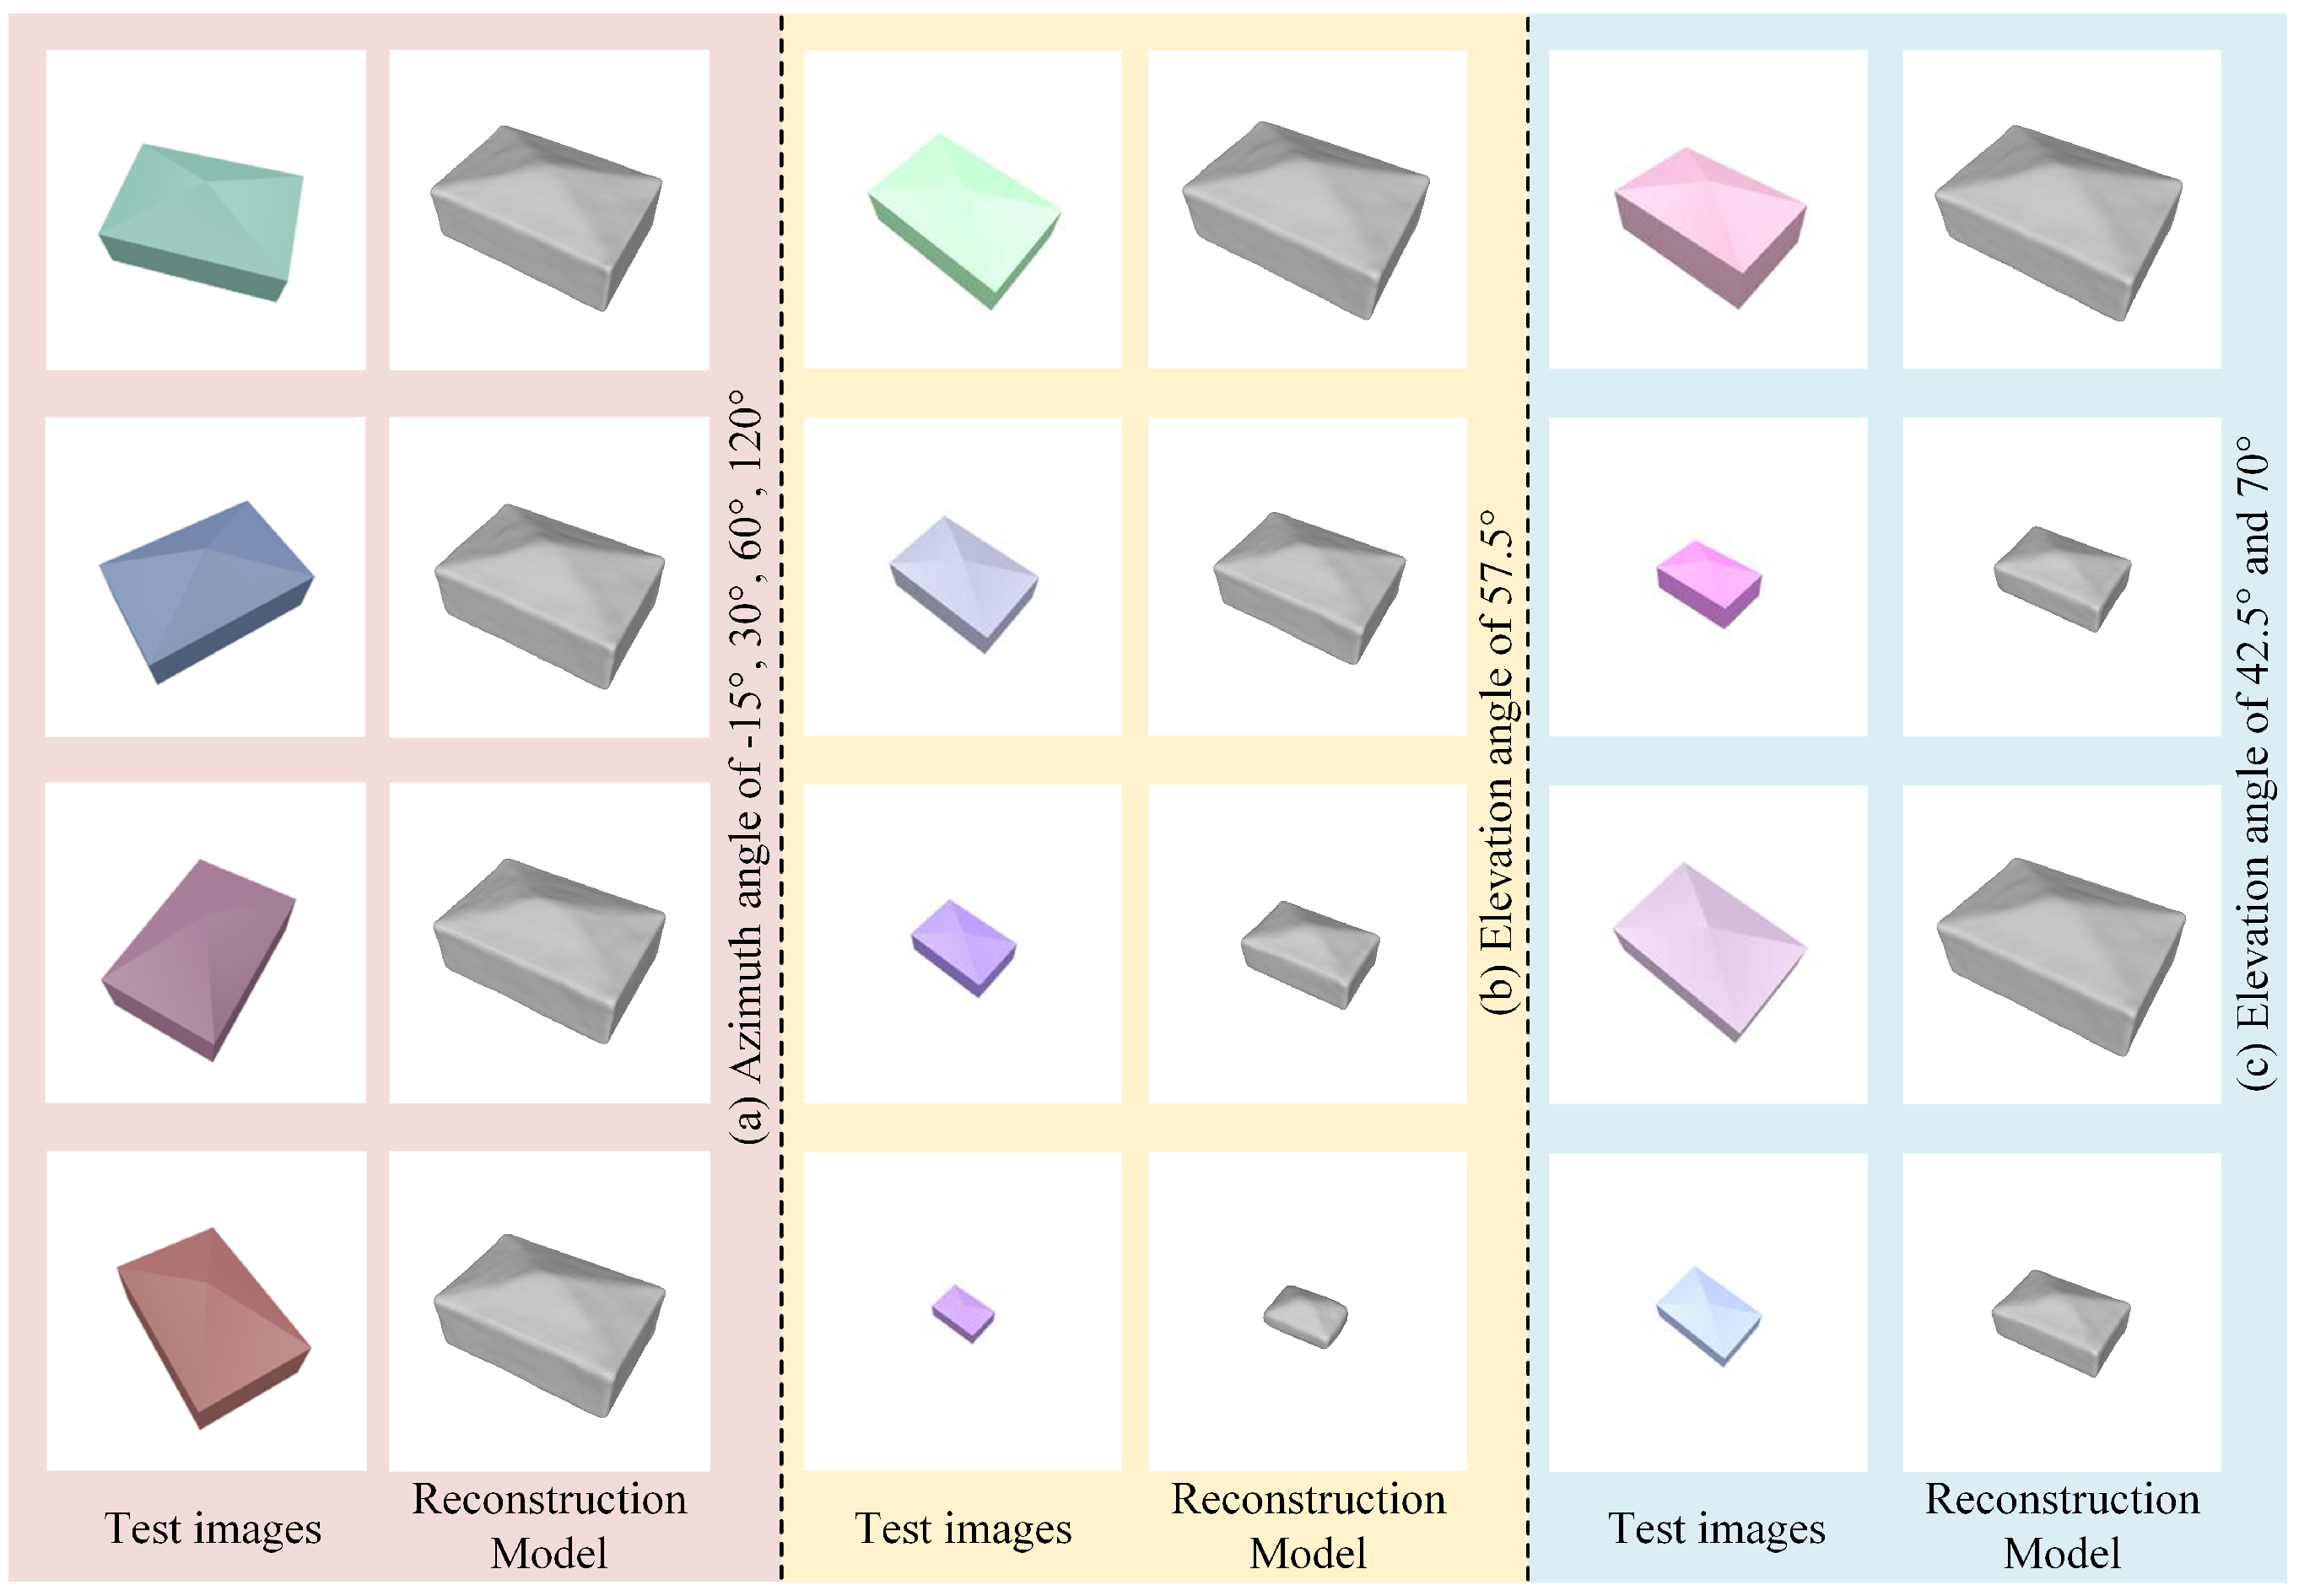
3.2.2. Solutions to the Problem of Diverse View-Angle

During the functioning of different satellites, the images acquired by the sensors have different azimuth angles and elevation angles due to the limitation of their orbits and flight attitude angles. For the types of buildings reconstructed in this research, the main features used for classification are reflected on the different roof structures and the outer contour of the building. Since the background information in the images are removed, the height of the building is mainly obtained from the facade. It should be noted that the orthophoto does not contain the facade information of the building and cannot predict accurate height values. Therefore, our framework uses off-nadir images as input. During the training process, to reduce the influence of different view-angles of the input image on the reconstruction result, the training dataset does not specify the imaging azimuth and elevation angle, so long as the images have clear roofs and facades. Profit from the generalization capabilities of the feature extraction network, it can adapt multitudinous view-angles of the input image and extract the complete features of the building.

3.2.3. Reconstruct Models of Diverse Size Buildings

In the remote sensing reconstruction assignment of the building, a vital mission is to predict an accurate size. ONet only focuses on targets’ shape, and all generated models are the same scale within the unit cube. In order to obtain the accurate size of the target building, it is necessary to use the pixel number and spatial resolution of the input image as prior information. When training Scale-ONet, the models in the training set are scales by actual ratio, and the scale of training models is 0–1. Meanwhile, all models are direction-normalized in advance for better training results, as shown in Figure 3. The relative scale factor of the reconstruction building is obtained through the feature extraction and decoding network. According to the above analysis, the current reconstruction model scale factor s is formed. The calculation process uses the following equation:
s = λ i × R a n g e ( log 2 ( p r / p t r t ) )
where λ i is the relative scale factor extracted by the network from the input image, and R a n g e is a function that calculates the scale range of models according to the ratio between training and test images. p , p t represent the number of length (or width) pixels in the test and training images, and r , r t are the remote sensing spatial resolution of the test and training images. After the decoder uses the feature vector to obtain the unit probability space, the shape of the reconstructed model and the ratio in x, y, and z directions are then determined. The scale factor s is a single value, by which the entire probability space can be scaled to the actual size. It settles the key problem that the reconstructed model has a real scale.
Figure 3. Axis direction of the model in training and test.

3.2.4. Adapt to Diverse Spatial Resolution of Images

The spatial resolution will significantly affect the quality of satellite images. Some important information for reconstruction will become blurred in low-resolution images, such as contours, the boundary between roofs and facades, etc. However, the encoder can extract building features well, Scale-ONet can obtain approximately consistent results in shape, whether using low-resolution and high-resolution images. In another aspect, the spatial resolution will affect the prediction of a building’s size. Therefore, in the training process, in order to ensure that the network can learn the proportional relationship between models, the training set needs to be composed of images with the same spatial resolution. In the test process, the building scale can be calculated by Formula (4), so accurate reconstruction can be achieved at multiple spatial resolutions.

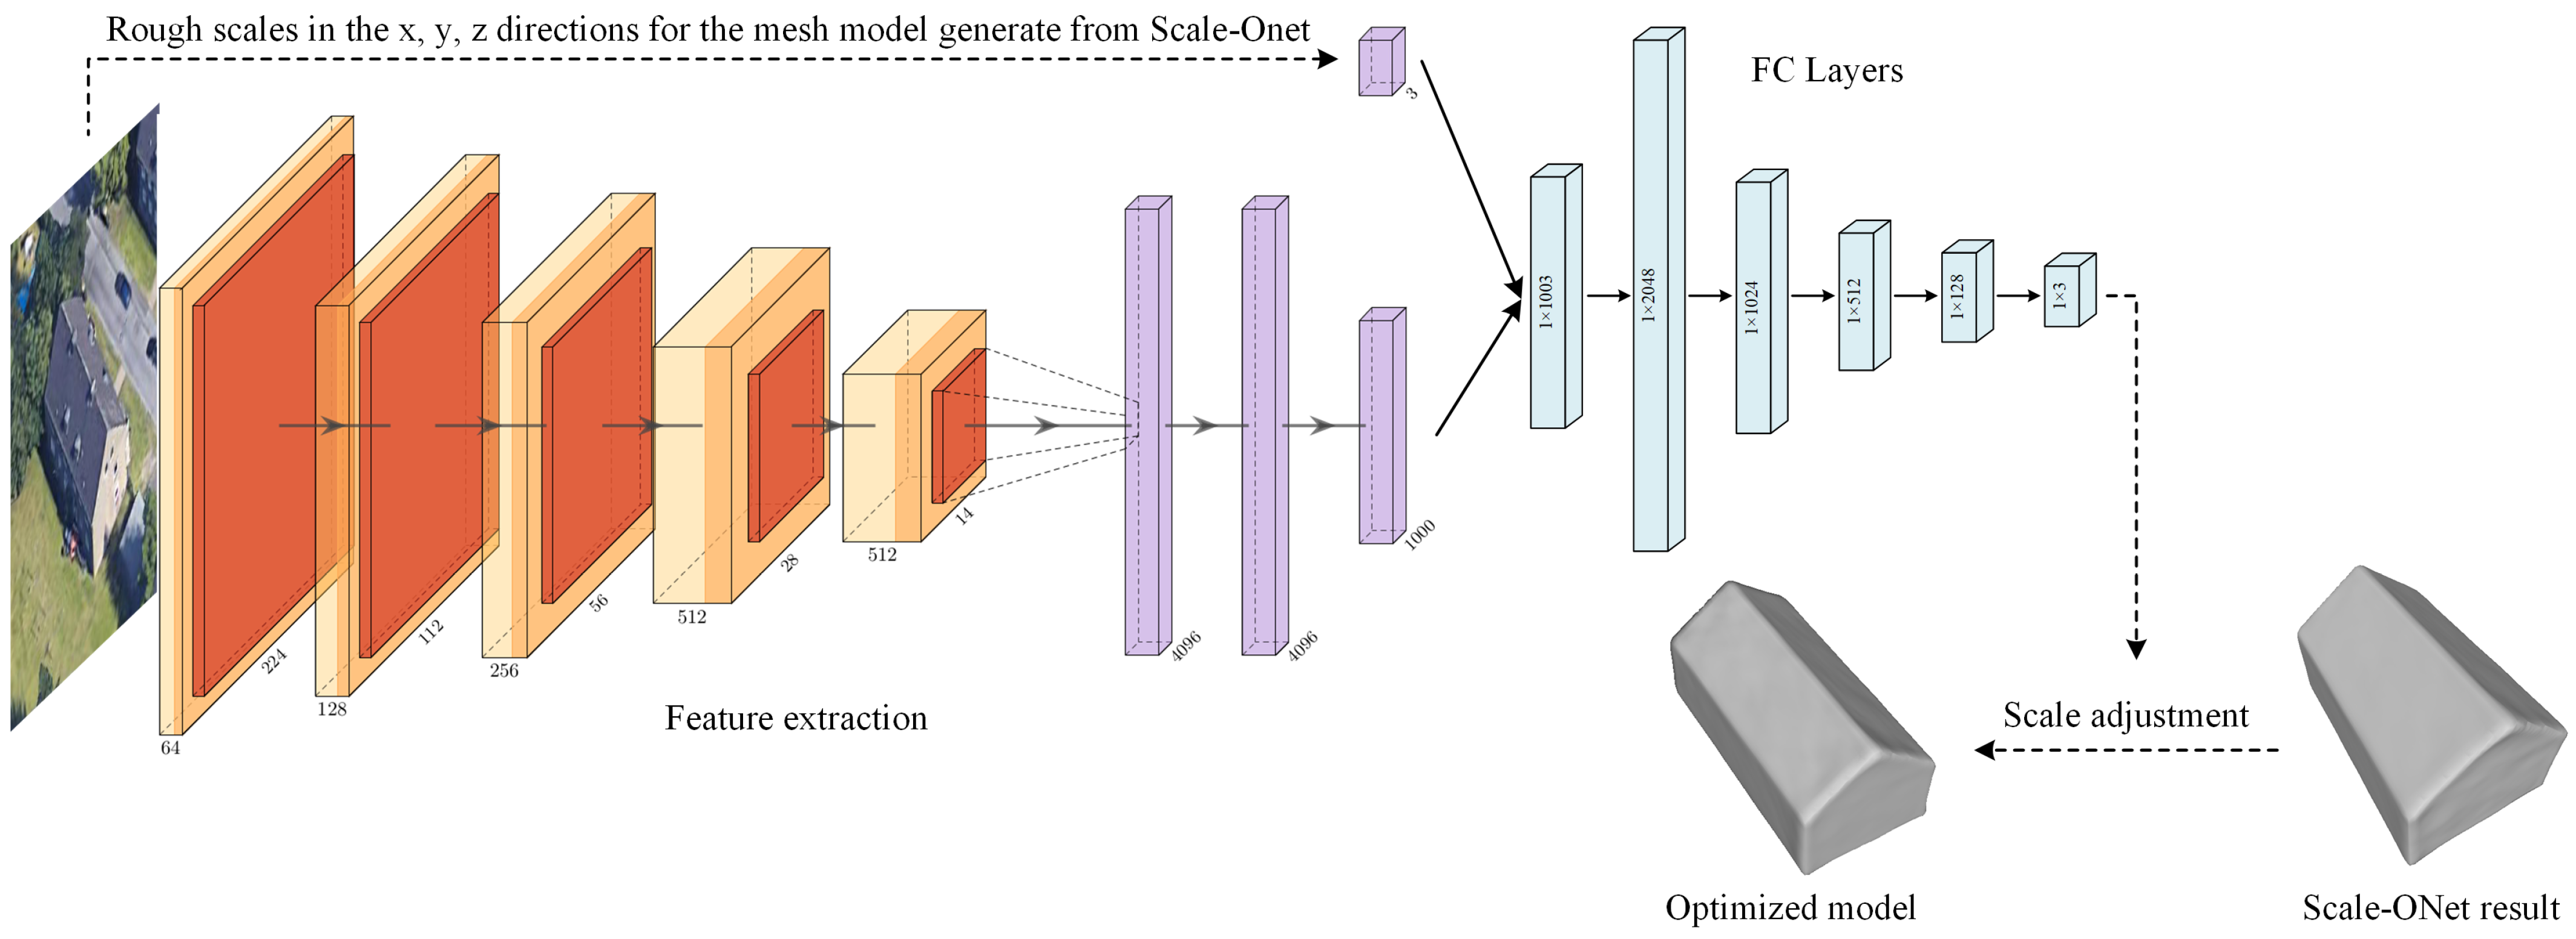
3.3. Model Scale Optimization Network

The 3D model reconstructed by Scale-ONet from the single image already has predicted scale, but there is still a certain disparity with real buildings. After analysis, the real remote sensing image has the following problems. The first one is that some remote sensing images are low quality. Affected by remote sensing images of different imaging quality, there are problems such as uneven edges, curved angles, and unclear edges and corners of the top surface and facade, which will affect the edge structure of the reconstructed model, resulting in inaccurate scales. Another problem is that, in the processing of generating models, a threshold needs to be set in the continuous probability space to distinguish the inside and outside of the predicted model. This operation causes the model to expand from the boundary, especially the height with the lowest prediction accuracy, so that the reconstructed model will be larger than its actual scale. The above reasons result in scale deviations with the reconstructed models. Thus, the Model Scale Optimization Network (Optim-Net) is proposed to reduce the error between the reconstructed model and the target. The network structure is shown in Figure 4.
Figure 4. Structure of model scale optimization network, which is composed of two parts: Feature extraction and a fully connected layer.
The center of the models is placed at the origin of the coordinate. The roof direction of the building is consistent with the positive y-axis of the coordinate, as shown in Figure 3. Optim-Net takes the reconstructed image and the scale value in x, y, and z axis directions with the mesh model generated by Scale-Onet as input, and directly outputs the optimized value. The Vgg16 network [49] is used as the feature extraction in this network structure, and the softmax layer is changed to a fully connected layer. After obtaining the 1000-dimensional feature vector, the vector is linked with the scale information, and passed through a multi-layer fully connected structure to generate a new predicted scale. Follow-up experiments prove the effectiveness of the network. The formula to describe the optimization process is as follows:
V x , V y , V z = f s f F E i b V ^ x , V ^ y , V ^ z
where f F E is the feature extraction network. ⊕ denotes a vector connection. V ^ x , V ^ y , V ^ z and V x , V y , V z are the value of scale before and after optimization, using f s .

3.4. Model-Image Matching Algorithm

After processing the aforementioned network, individual models are obtained for each building in the reconstructed area. Since the network needs to normalize the orientation angle for all the input and output models, the result meshes all have the same orientation angle. For the task of 3D reconstruction in the remote sensing field, it is important to recover the complete scene of the image area, i.e., to recover the relative position relationships between buildings and their own orientation angles. Model-Image matching algorithm is proposed in the 3DMR framework. When cropping the whole image into small slices, each building can be matched with its position. After acquiring the reconstructed model, it can be placed on the same scene according to this matching relationship. The relative position between the models is accurately recovered. Then, the models are rotated horizontally. When the overlap ratio is at a maximum between the orthographic projection of the models and the buildings in the image, the current model orientation angle is immobilized.

3.5. Evaluation Metrics

The 3DMR framework takes both the shape and scale into account, and two different evaluation metrics are used to evaluate the reconstruction results. The accuracy of the building reconstruction scale is calculated by Root Mean Square Error ( R M S E ), where x m , y m , z m are the values of scale with the model in the direction of the x, y, and z axis, using the following equation:
R M S E = 1 M m = 1 M [ | x m x ^ m | + | y m y ^ m | + | z m z ^ m | ] 2 .
The shape evaluation uses the Earth Mover’s Distance [50] ( E M D ) as the metrics, which is the minimum cost of normalization from one distribution to another, so it can be used to characterize the distance between two distributions:
d E M D ( S 1 , S 2 ) = min ϕ : S 1 S 2 x S 1 x ϕ ( x ) 2 .
In this formula, S 1 , S 2 respectively represent the reconstructed model and the ground truth model, and x represents the coordinates of points on the model surface. ϕ ( ) is the nearest neighbor matching used to find corresponding points from S 1 to S 2 . At first, both the reconstructed and ground truth models are placed at the origin of coordinates, and the direction of models is the same. Then, Poisson Surface Sampling is performed separately for the reconstructed and ground truth models to obtain the surface point cloud. We calculate the nearest point on the ground truth model as its corresponding point for each point on the reconstructed model. A smaller E M D means a higher accuracy of the model reconstruction shape.

4. Experiments

In this section, four parts of the experiment were designed. In the first part, the simulated dataset was mainly used to verify the adaptability of Scale-ONet for the different view-angle and sizes of buildings. The second part used two satellite datasets that have images including buildings with different shapes, sizes, and spatial resolutions to verify the robustness of Scale-ONet. The third part tests the model scale optimization network and proves that it can reduce the scale error. Finally, we show the complete reconstructed scene.

4.1. Data Preparation and Experimental Environments

We produced three datasets that consist of images and mesh models. The first one is a simulated dataset, which has a regularized model, images are rendered from models. The other two datasets are composed of off-nadir satellite images of Dortmund and Yokosuka and mesh models. Each model matched four images with different azimuth angles, one of which was the original image, and the other three used the idea of data enhancement, rotating the original image by 90°, 180°, and 270° to generate new images. According to the size of the buildings, all of these images are resized to a suitable size. The relevant parameters of three datasets are shown in Table 1, and we selected two typical areas shown in Figure 5. The production process of the dataset is as follows:
Table 1. Relevant parameters of the three datasets.
Figure 5. Sample of a dataset for network training and testing. The first row is the original remote sensing images. The second row is the individual building images extracted from the original images, after removing the background. The third row is the Ground Truth building mesh models drawn from the images. The fourth row is the images generated by the simulation.
  • Simulated dataset: 1150 models were drawn for the simulation experiment, with a regular scale and shape. We use the model rendering algorithm to render the drawn 3D models. Different simulation images are generated by setting parameters of the rendered lighting, color, and camera position;
  • Satellite images: We selected areas-of-interest from the original satellite image. Each building target in these areas is independently cropped into a square image. The background information in these square images was manually removed;
  • 3D mesh models: Most areas on Google Earth contain a “3D Buildings Photorealistic” layer, which has complete building structures. We picked building targets in Google Earth and obtained information on the structure and size of these buildings through measurement tools. We used model software to draw water-tight mesh models of these buildings, which have real and different shapes and scale.
In this paper, all experiments are carried out in the same environment. Network training and testing are under ubuntu 18.04. The hardware environment includes double Intel Xeon Silver 4210 CPUs and the GPU accelerating used single NVIDIA RTX 2080 Ti with 11 GB of memory.
The specific parameters of the two neural networks used in the experiments are as follows: (1) Scale-ONet, the batch size is 64, a Adam optimizer is used, the learning rate is set to 1 × 10 4 , and the epoch is 500. The number of points sampled from training models is 2048, and the resolution of the reconstructed model is 128 3 . (2) Optim-Net, the batch size is 16, the SGD optimizer is used, the learning rate is set to 1 × 10 4 , and the epoch is 2000.

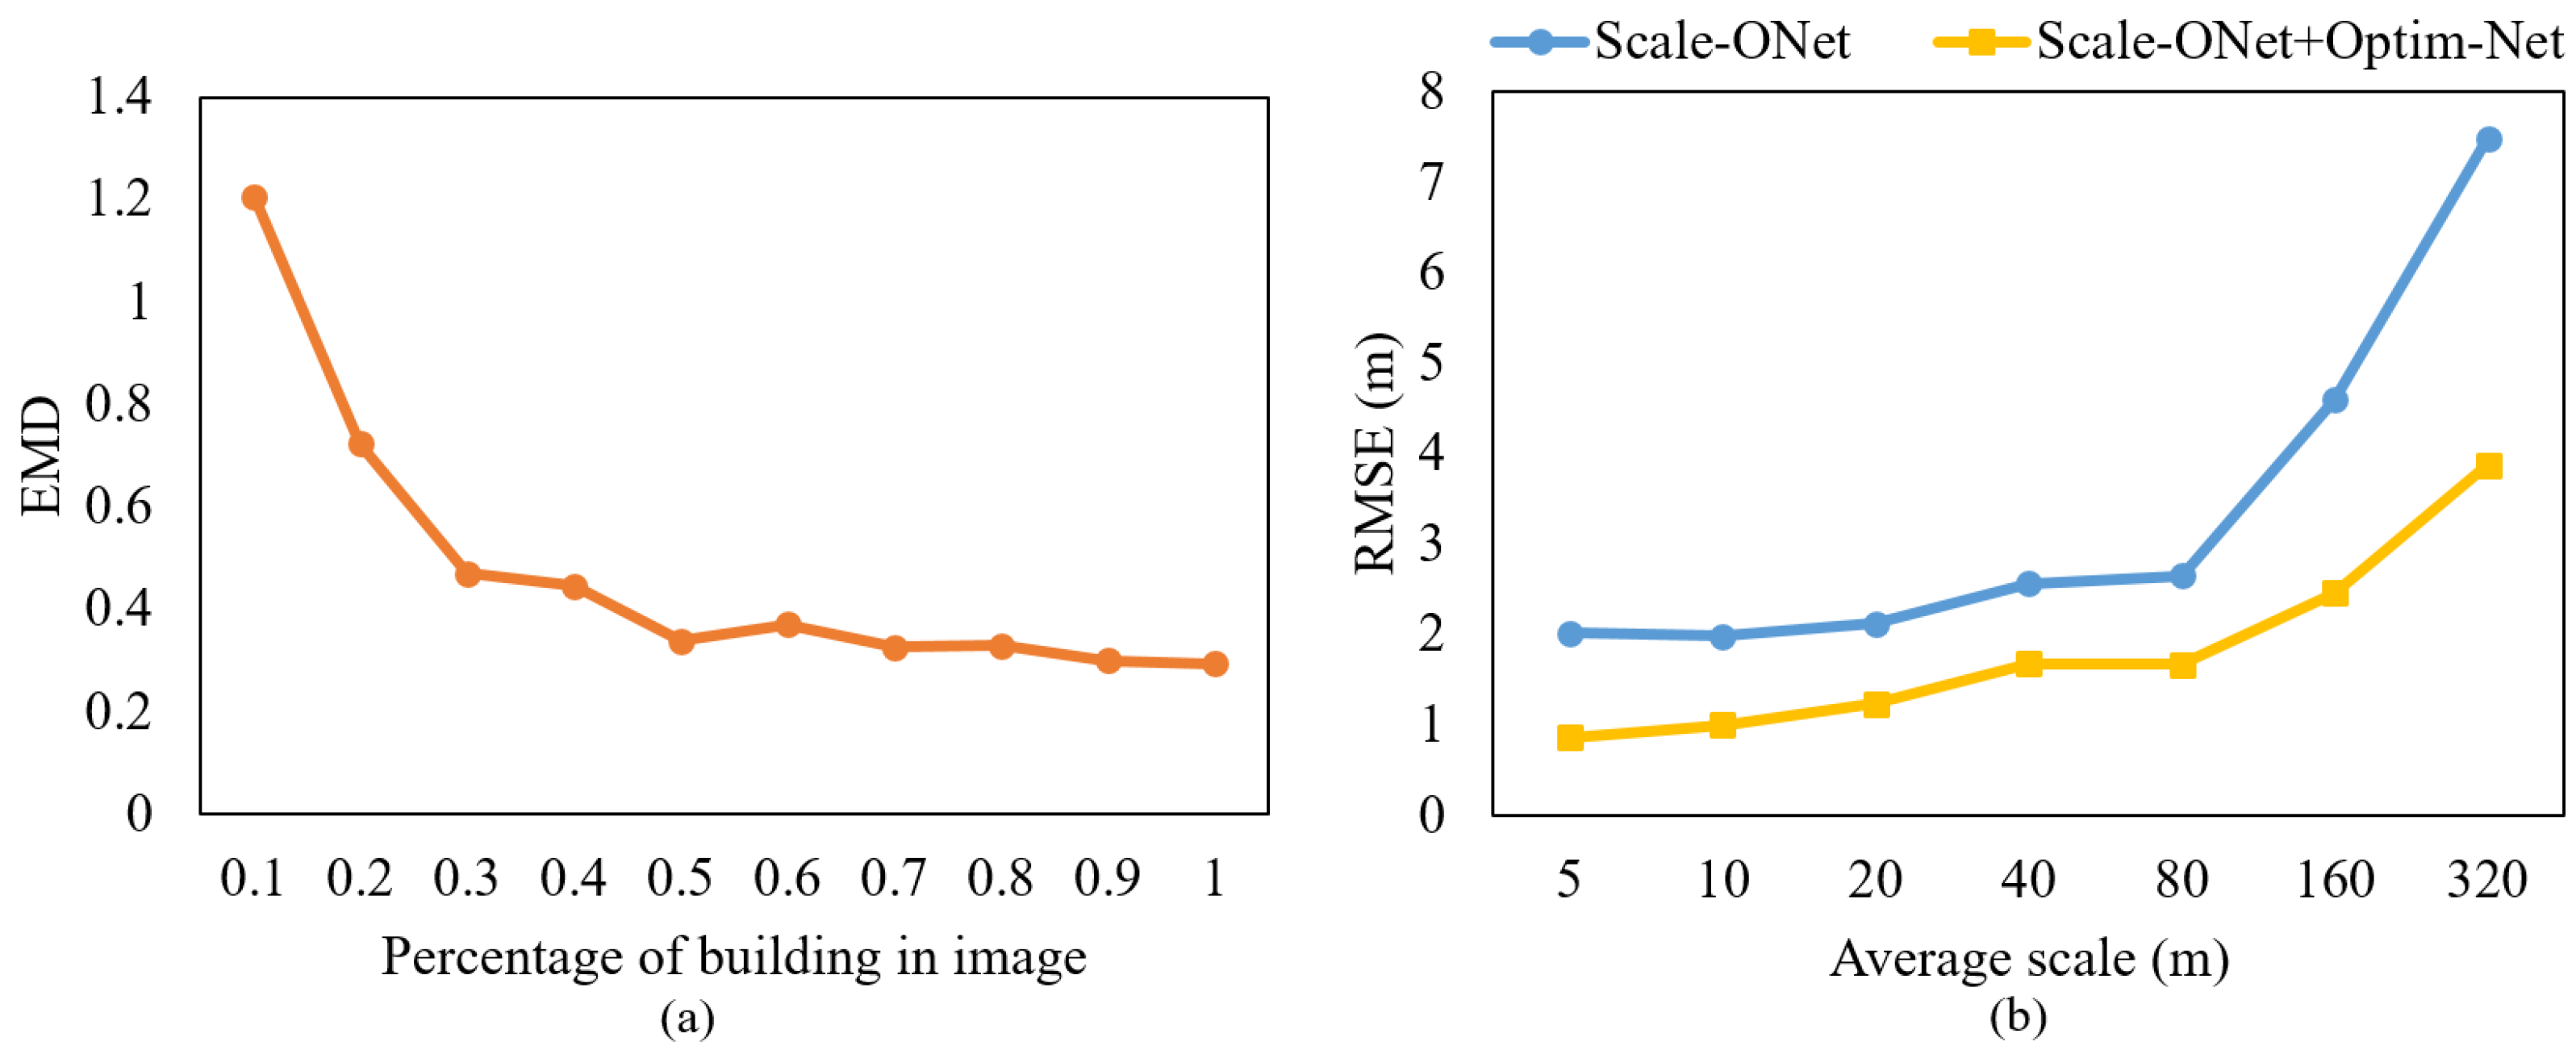
4.2. Simulation Experiment for Scale-ONet

Since we were unable to collect enough satellite images with an all view-angle, it cannot truly reflect the generalization ability of the reconstructed network. Meanwhile, simulated images of buildings with different sizes can test the accuracy of the network for scale prediction. So, we used the simulated images with a different view-angle and sizes of buildings to perform experiments. The models in the training set included a total of five sizes at 100 m, 80 m, 60 m, 40 m, and 20 m, which is the length in the z-axis direction. Moreover, the images were rendered with azimuth angles of 35°, 70°, 105°, and 140° and elevation angles of 35°, 50°, and 65°. The test set used different building sizes and a view-angle from the training set.
In the experiment, four typical types of buildings were tested, which are the pyramidal roof building, hipped roof building, gabled roof building, and flat roof building. Among them, the results of the pyramidal roof building are shown in Figure 6 and Table 2. The colors of buildings in test images were generated by random rendering. In Figure 6, the (a) is the result of reconstruction with multiple azimuths angles. The azimuth angle has little effect on the reconstruction quality from the subjective results, and we did not consume space to expound it. Figure 6b,c show the results of the tests at different elevation angles and different scales. Combining results in Figure 6 and Table 2, the proposed network is adaptable to a wide range of elevation angles. It accurately predicts the shape and size of the building from a single image. The quantitative results show that the average error of the reconstructed model is less than 2 m in length and height.
Figure 6. Simulation experiment results. (a) Reconstruction results at different azimuth angles. (b,c) Reconstruction results at different elevation angles and different sizes of buildings.
Table 2. Quantitaive test results in the simulation experiment.
However, it is adversely affected by the way the network generates the model. When using the same network to test two targets with vastly different scales, the larger model occupies more points, and the edges of the building can be reconstructed well. However, for example in the smallest model in Figure 6b, too-small buildings in the image can lead to information loss, and the few numbers of occupied points make the shape of the reconstructed model too smooth, not meeting the authenticity of the building. Moreover, the occupied probability space obtained from the network prediction is continuous, showing some error in the prediction results. The building meshes extracted from the space using the Matching Cube Algorithm are defective. The surfaces of meshes are uneven and the edges are small circular arcs rather than standard right or obtuse angle. Nevertheless, the experiments with simulation images verify the good generalization of the proposed network at different view-angles and different sizes of buildings.

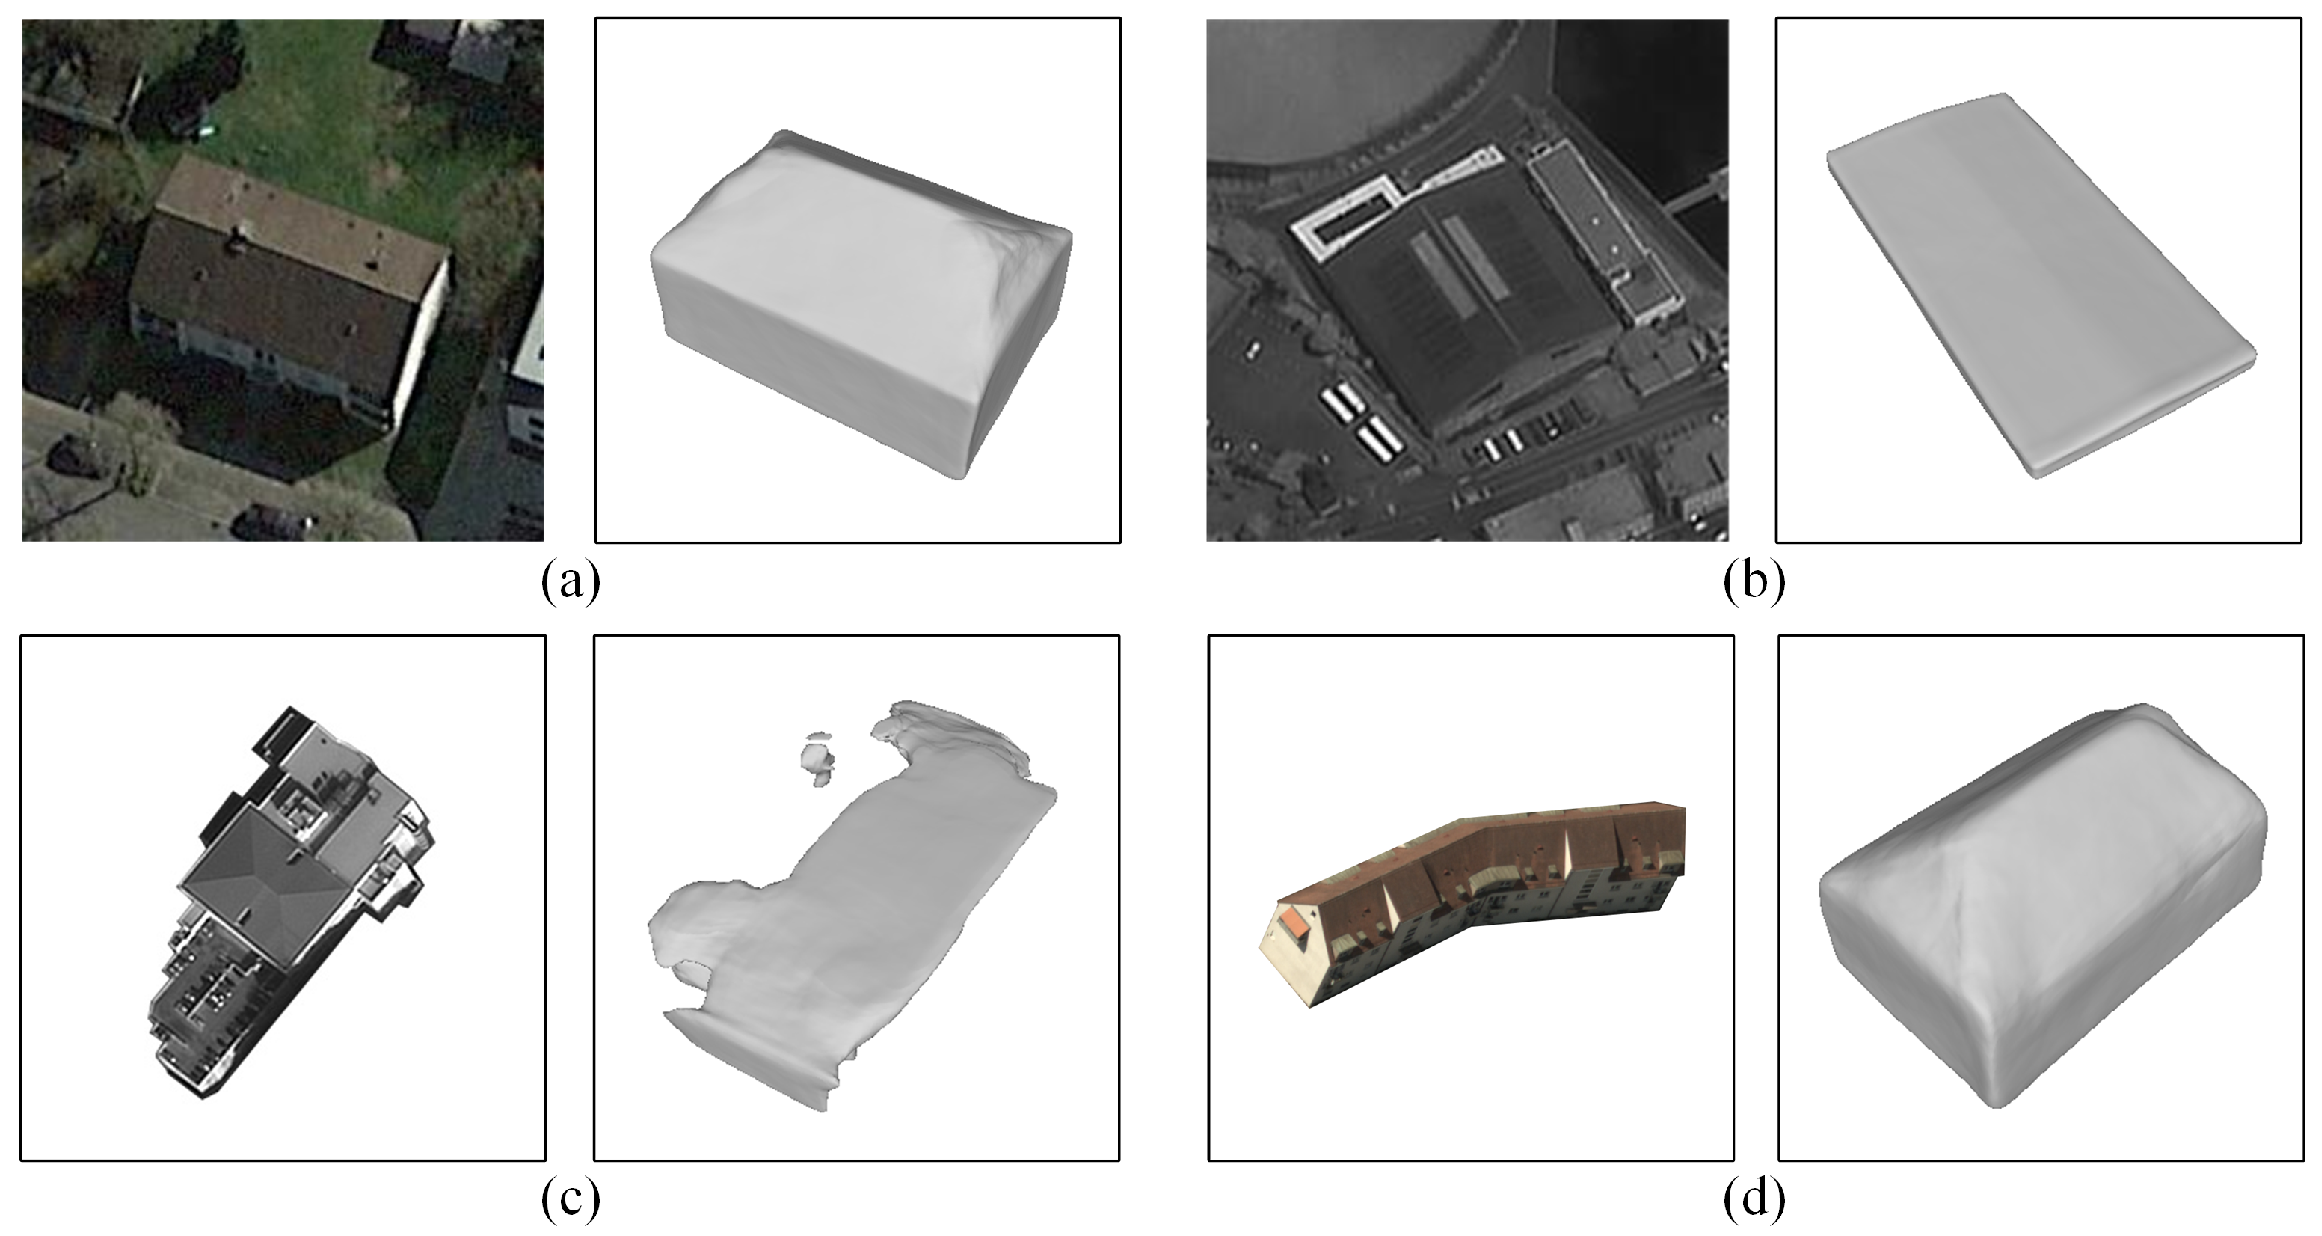
4.3. Real Remote Sensing Image Testing and Evaluation

Satellite images vary greatly in the spatial resolution and imaging quality of the acquired images according to the different sensors, which test the adaptability of the proposed network for various images. In this section, we performed a total of three sets of experiments. Firstly, to test whether Scale-ONet is affected by the different imaging quality, we tested a set of images from the Dortmund, taken at different times. Secondly, we tested different building targets, and also used this dataset of Dortmund, to verify that Scale-ONet can achieve building reconstruction with an accurate shape and rough scale. Thirdly, the dataset in the Dortmund is mainly captured in urban areas, where the buildings are mainly residential, and the main range of sizes is 7–20 m with a high spatial resolution. Therefore, in this experiment, we chose the dataset of Yokosuka, which is different. The images are mainly captured in the coastal area, and the buildings are mostly industrial buildings with a size range between 40–80 m and a moderate spatial resolution. Therefore, by testing this dataset, it is possible to verify whether Scale-ONet can obtain consistently good results with completely different data.

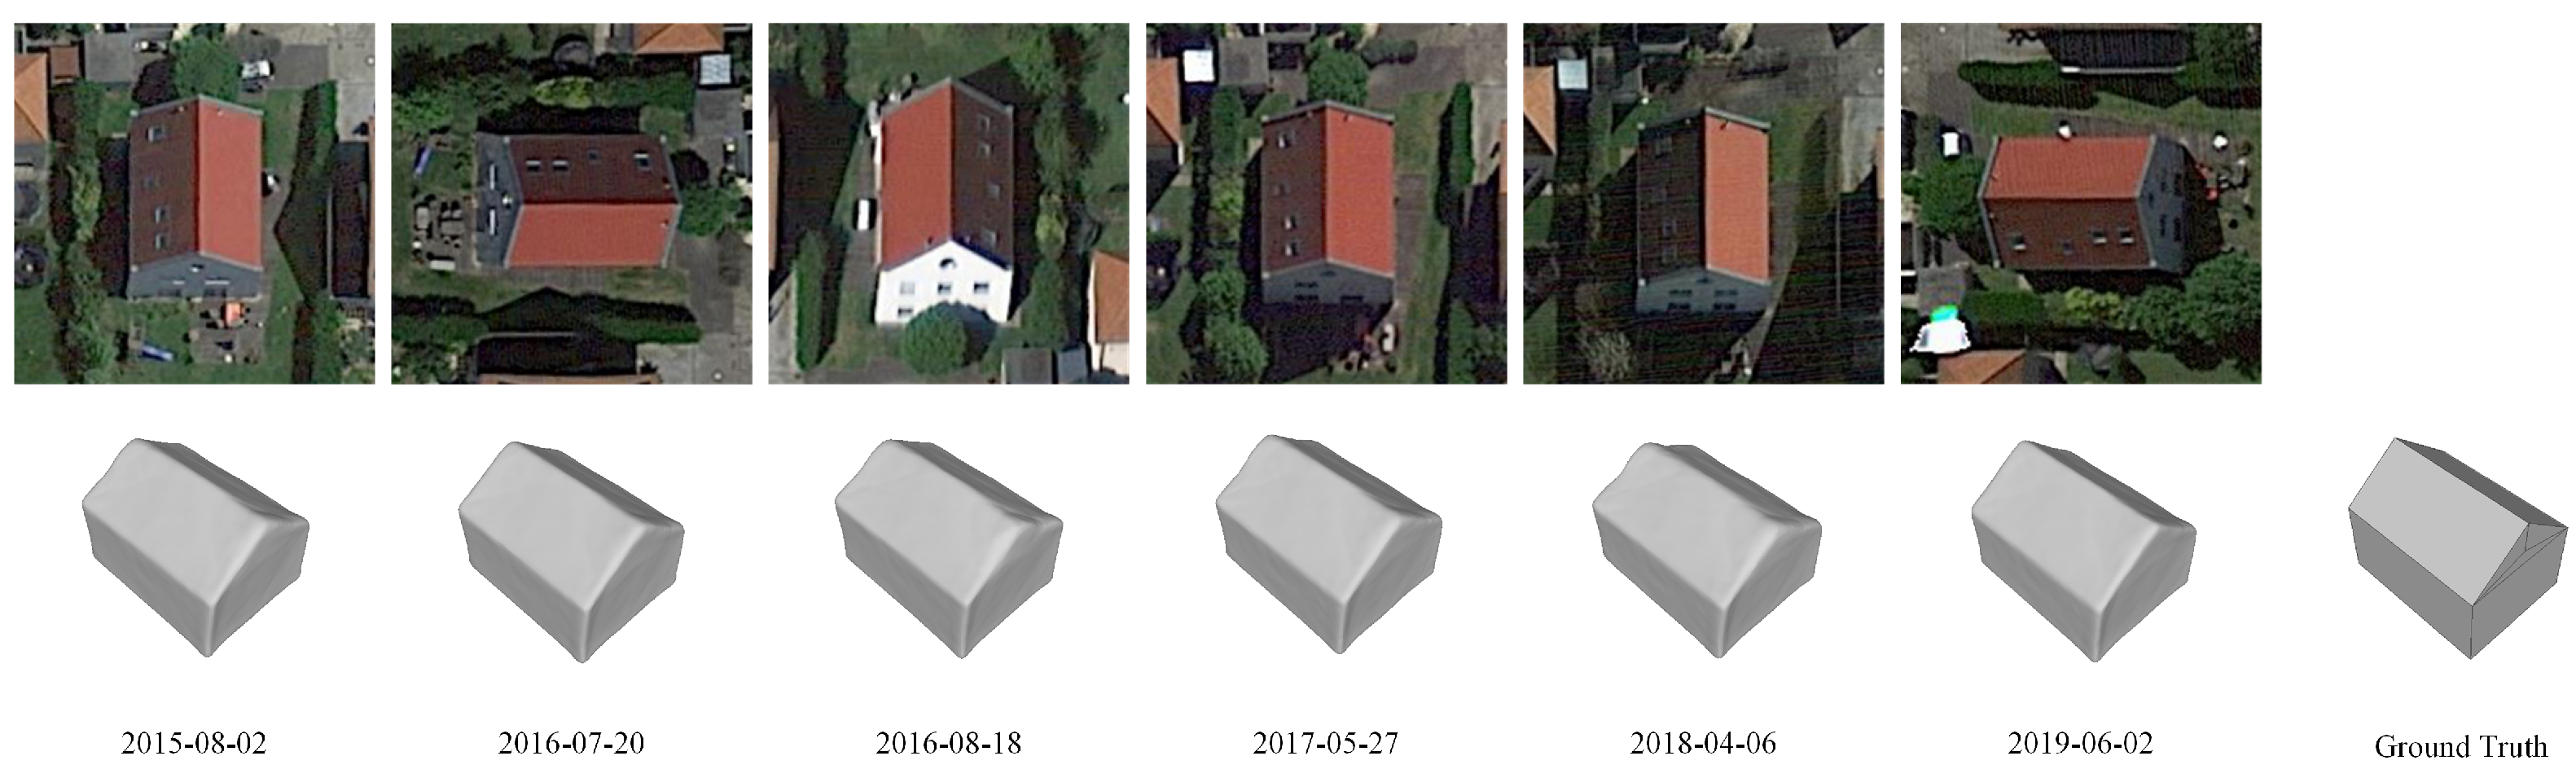
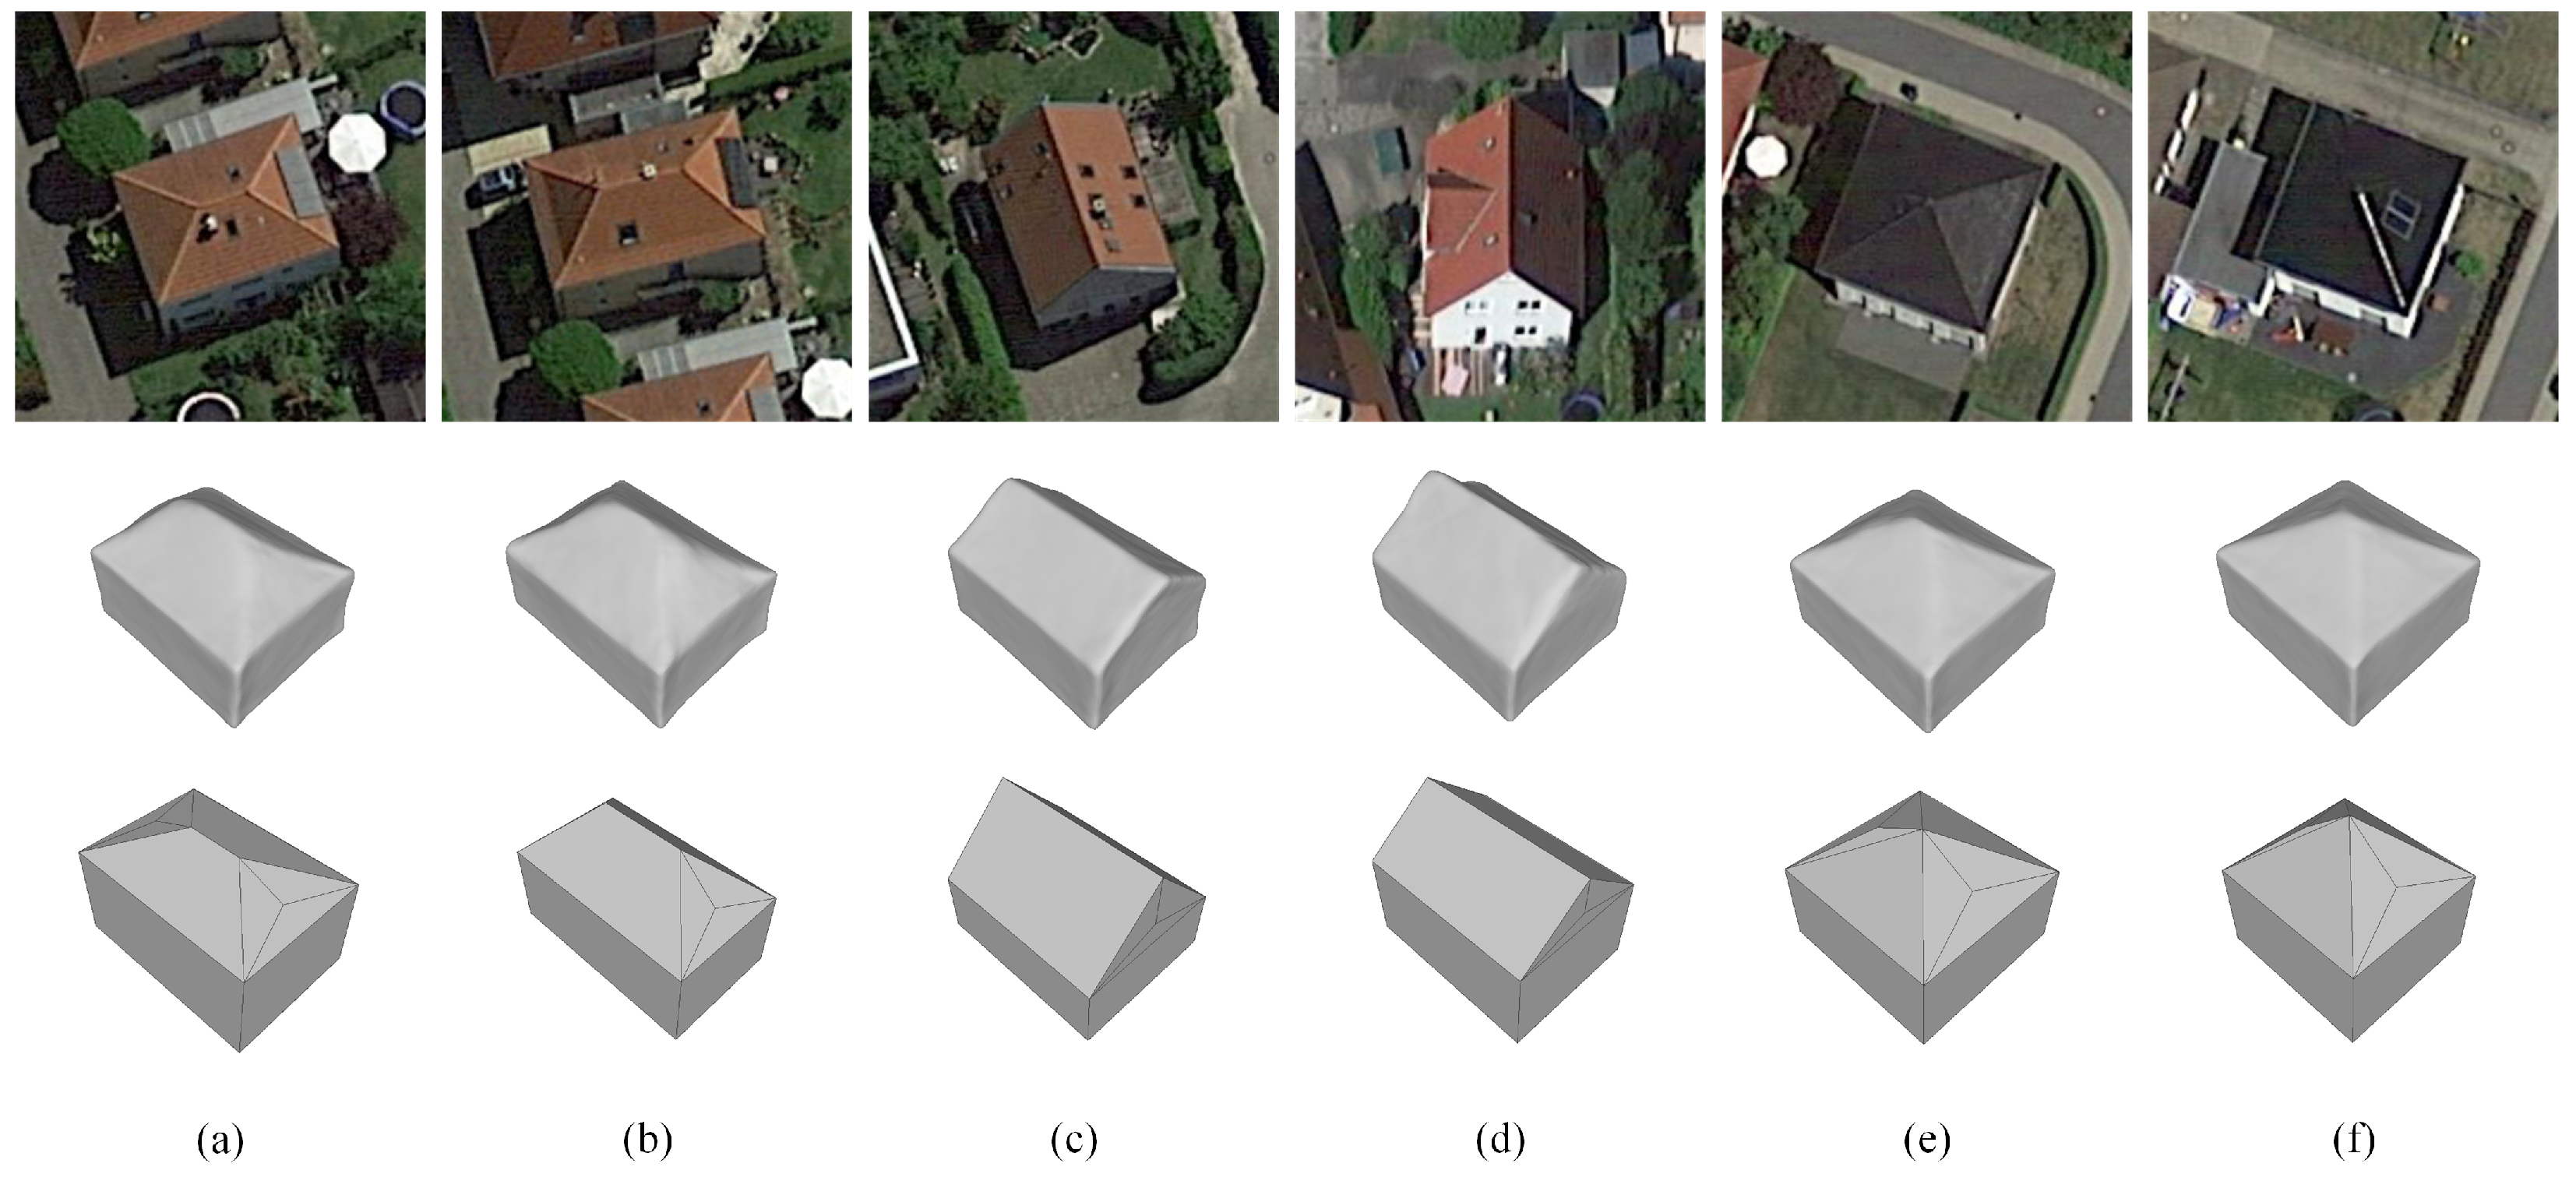
4.3.1. Satellite Images of the Dortmund

In this part, we used the dataset of the Dortmund area. The building styles in this area were mainly residential, whose main differences are on the roof structure. The specific characteristics of this dataset are in Table 1. A total of 105 sets of models and images were selected for training, and another 110 sets were used to test in this experiment.
In order to verify that the proposed framework can present broadly consistent and small error results when reconstructing different view-angles and imaging quality targets, we selected different time images of the same building for testing. The test result is shown in Figure 7. The imaging date is marked at the bottom. In this experiment, a total of six images of the gabled roof building was selected at different times. Diverse illumination, shadow, and imaging distortion did not affect the reconstruction result in general. From the quantitative evaluation results in Table 3, it can be summarized that the differences of images slightly affect the extraction of building information by the reconstruction network, both on shape accuracy and scale error. Consequently, from the results, nearly consistent models were obtained.
Figure 7. Reconstruction models using images with a different time phase. The first row shows the original images, and the second row shows the reconstruction results.
Table 3. Quantitaive experiment results using images with different times.
Reconstruction results of buildings with different shapes and scales are shown in Figure 8. We number each reconstruction target and calculate the E M D and R M S E values. In the calculation of E M D , the number of sampling points is 2000. The results are shown in Table 4. Real satellite images have complex environmental effects. Image distortion caused by the imaging sensor, unstable ambient light, similar but different view-angles, and other unfavorable factors lead to unclear textures and outlines of buildings. There are eaves in some houses in the selected area of this experiment, and there is a small number of obstructions around residential houses, resulting in incomplete building structures. The factors mentioned above are important reasons for the deterioration of reconstruction quality, but the proposed framework overcomes these challenges. As introduced in the methodology section, the threshold τ can determine the boundaries of the model in the probability space and thus affect the final shape. A larger threshold brings higher confidence and a more even surface of the reconstructed model, but the generalization of the network will be weakened. So we compare the E M D at threshold τ equal to 0.2, 0.5, and 0.95. According to the calculation, the best average value of E M D is 0.7681 when τ = 0.95 , the difference between the shape of the reconstruction model and the target is tiny. It is proved that roof structures with a pyramidal roof, hipped roof, gabled roof, etc. can be accurately reconstructed. The disadvantage is that the edges and corners of the top and sides of buildings are too smooth and do not conform to the characteristics of artificial features. Considering the accuracy of the building size, the average R M S E value is 2.0562 m, which is still within the acceptable range of reasonable error. Experiments show that the proposed framework can reliably reconstruct building models from remote sensing images with different view-angle, sizes of buildings, etc.
Figure 8. Reconstruction models using images with a different building roof. Buildings (af) are the six samples in the test set. The first row shows the original images, the second row shows the reconstruction results, and the third row shows the Ground Truth models.
Table 4. Quantitative experiment results using images with a different building roof. Building a–f are the same as in Figure 8. The bold numbers are the minimum E M D at different thresholds, which means the best reconstructed shape of buildings.

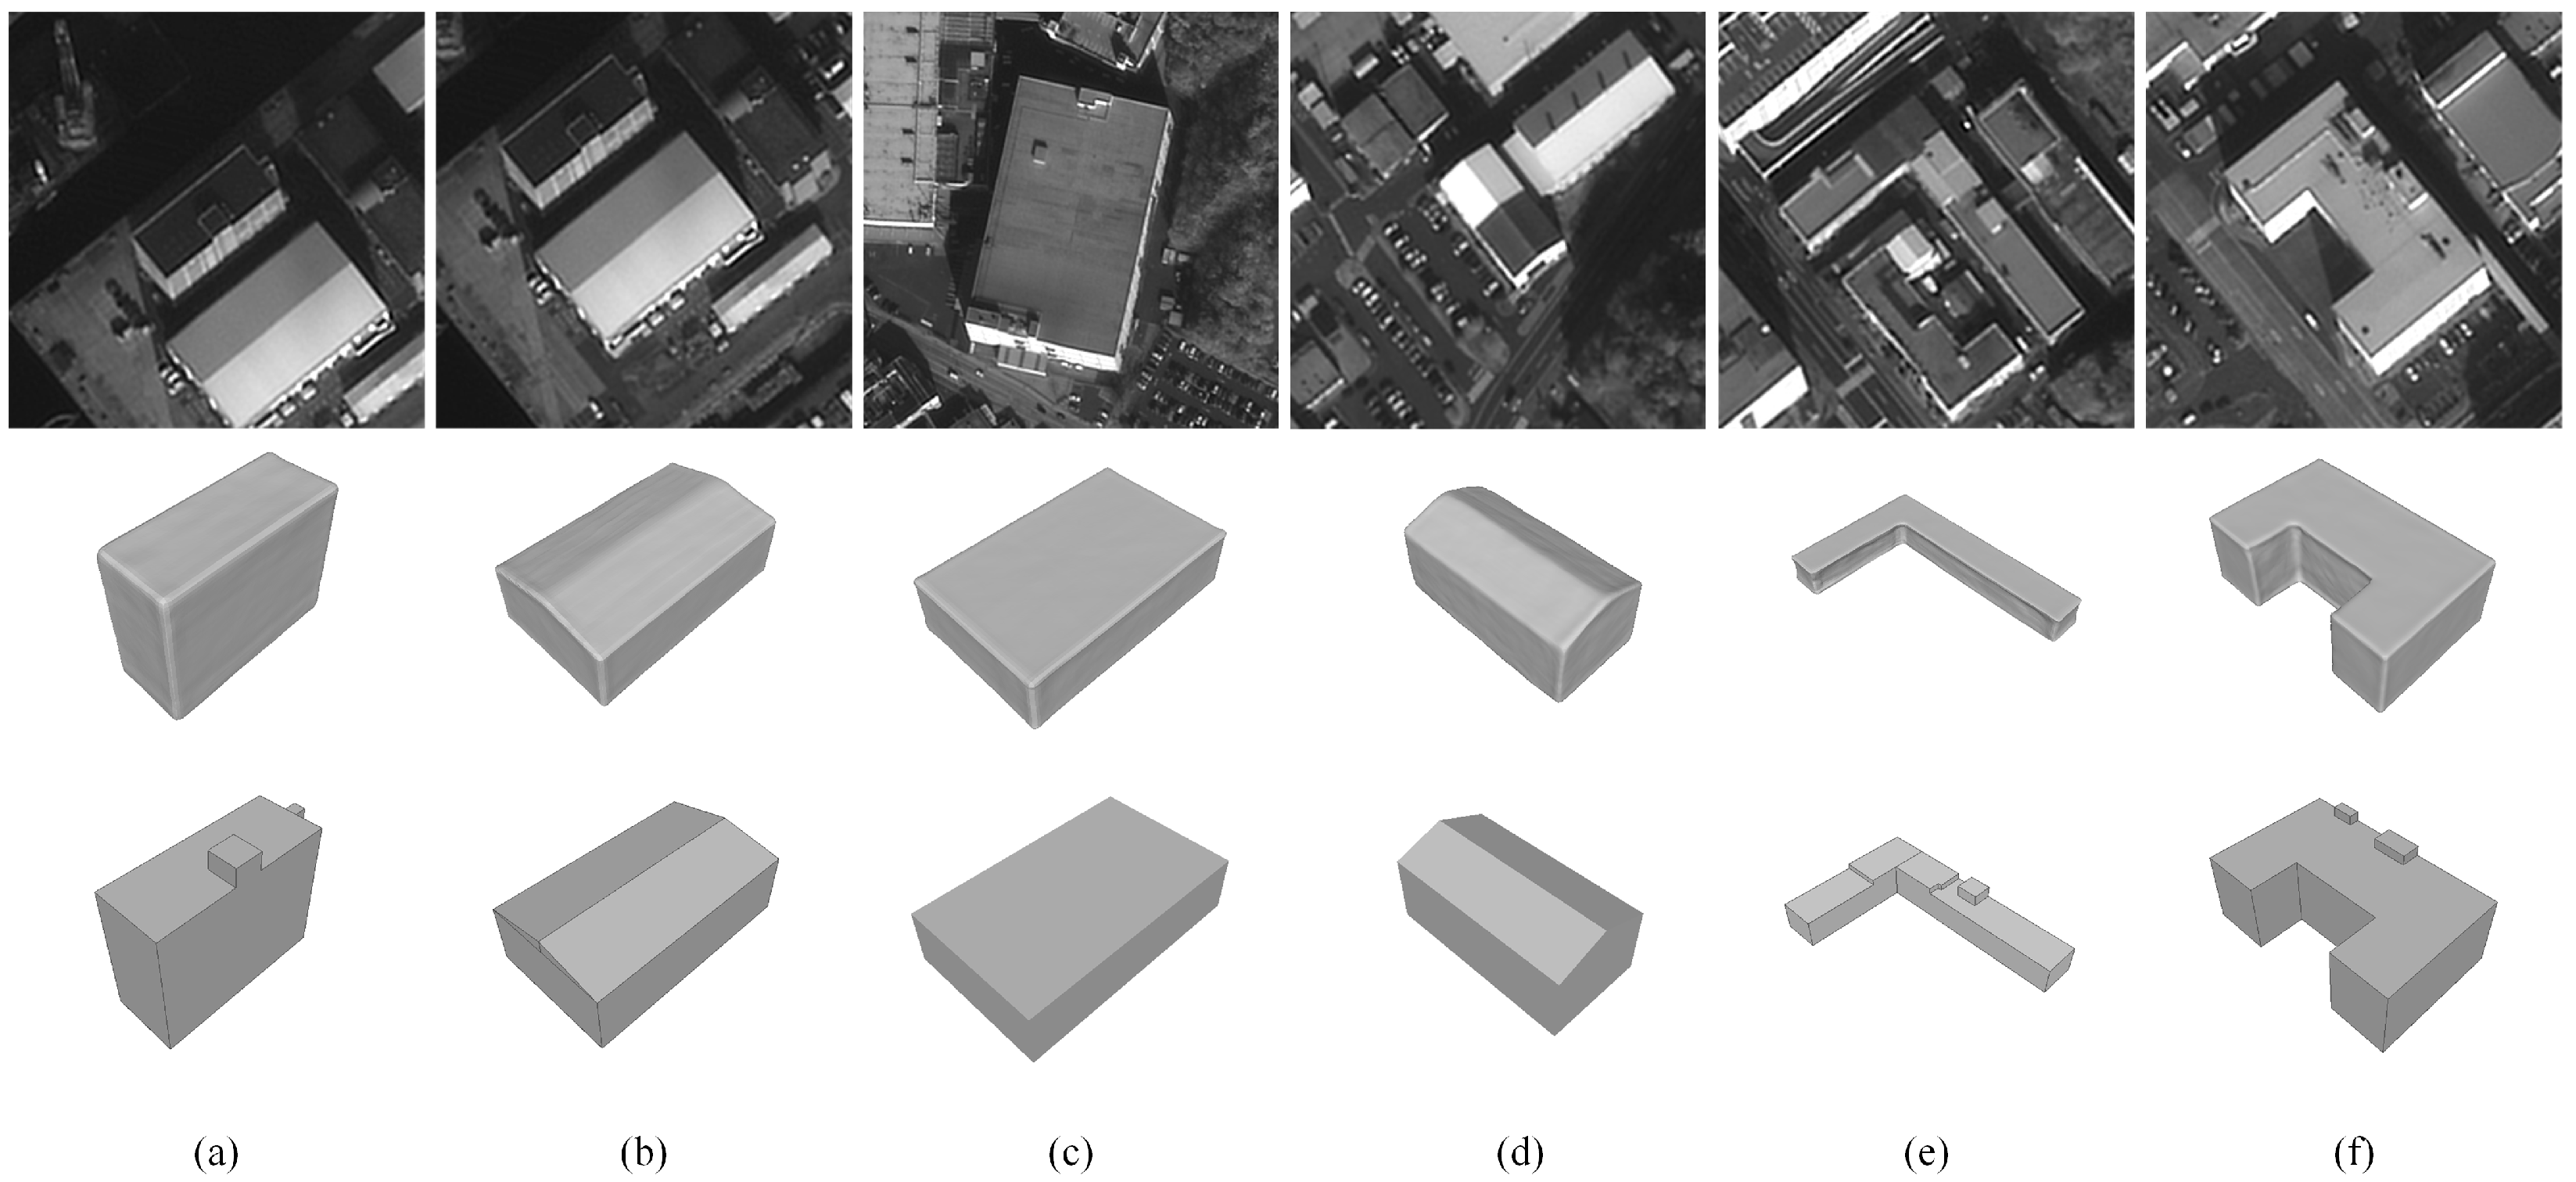
4.3.2. Satellite Images of the Yokosuka

In this experiment, we used the dataset of the Yokosuka area. The building styles in this area were mainly industrial buildings, which are different from the residential houses (mainly flat-topped buildings) in the previous section. Most of the differences are reflected in the plane structure of each building. The original images of this dataset are Panchromatic images (PAN). We converted the images into three-band RGB images to keep the data and network structure consistent. The specific characteristics of this dataset are in Table 1. A total of 223 sets of models and images were selected for training, and another 41 sets were used to test in this experiment.
Although in the process of drawing the real model, the small protrusions on the top of buildings were accurately drawn, the roof is adjusted to be flat to get the best results of neural network training. Consequently, the reconstruction results automatically ignore the complex structure on the top of buildings. The ground truth used for calculating the evaluation completes the models to ensure accuracy. From the reconstruction results shown in Figure 9, the proposed framework can accurately predict the plane structure of the buildings and provide models with good subjective results.
Figure 9. Reconstruction models using images of Yokosuka. Buildings (af) are the six samples in the test set. The first row shows the original images, the second row shows the reconstruction results, and the third row shows the Ground Truth models.
Table 5 shows the quantitative evaluation results. In terms of the shape of buildings, reconstructed mesh models can achieve the ideal results. The experiments also compared the E M D at different thresholds, reconstructed models have the best shape when the threshold is 0.95, and the average E M D value is 0.4593. In Figure 9, model (a,e,f) has multiple gradations on the roof of the real building model, and the reconstructed model does not restore this detail. The range of building sizes selected for this area in experiments is between 40–80 m, and the average R M S E value is 2.6523 m. Naturally, both subjective and objective results can demonstrate the good reconstruction ability of the proposed reconstruction framework on off-nadir satellite images.
Table 5. Quantitative experiment results using images of Yokosuka. Building a–f are the same as in Figure 9. The bold numbers are the minimum E M D at different thresholds, which means the best reconstructed shape of buildings.
By conducting the above two experiments, the performance of Scale-ONet is proven. It can reconstruct the building well from a single image with different spatial resolutions and building types. However, the results are opposite in two datasets when evaluating the model shape and building size. For the shape of models, the E M D calculated from the Yokosuka dataset is better than from the Dortmund dataset. Since the Yokosuka dataset has twice the training data as the Dortmund dataset, it has a better training effect. Conversely, for the prediction of building sizes, the R M S E calculated from the Dortmund dataset is better than from the Yokosuka dataset. Since the images in the Yokosuka dataset has a bigger spatial resolution and larger range of building sizes, when the network deviates, the error increases more significantly.
In Figure 10, some reconstructed models with poor reconstruction quality were shown. For images (a,b), we did not remove the background information. Influenced by this unfavorable factor, the ridge of reconstructed building model (a) has an inward tilt. The ratio in different directions of model (b) is inaccurate, although the shape is consistent with the image. These phenomena arise because the network does not distinguish well between the boundaries of the building and background. Also other buildings in the images interfere with the features extraction of the main building. (c,d) are examples of two models that do not fit the training data. The structure of the building in (c) is so complex that the network failed to reconstruct the complete mesh model. The building in (d) has a simple but a large aspect ratio structure and the building is not straight. In addition, the shape of the building reconstructed by the network does not match the real building. The above two types of buildings pose a great challenge to Scale-ONet. For such completely different data, the generalization of network for complex building shapes appears to be insufficient, and that still has some limitations. However it can be improved with the increase in the amount and diversity of training data.
Figure 10. Some reconstructed models with poor quality. (a,b) are the reconstruction results from the images with complete background. (c,d) are the reconstruction results with complex building shape.
Scale-ONet consumes a larger percentage of time in the model generation process. After generating the occupied probability space, the fineness of the generated models is determined by the resolution of the spatial division. The average times spent by Scale-ONet to reconstruct an individual model at different mesh resolutions are shown in Table 6. As the resolution increases, the consumption time increases rapidly.
Table 6. Time consumption of models with different resolutions generated by Scale-ONet.

4.3.3. Experiment for Optimizing Scale of Models

In this section, experiments tested the proposed model scale optimization network. The training process of Optim-Net needs reconstruction images, the scale values of reconstructed mesh models, and corresponding ground truth in the directions of the x, y, and z axis. For the input images, we use the same datasets as in Section 4.3, and ground truth is obtained from the model drawn corresponding to these images. We input these images into the trained Scale-ONet to obtain the corresponding reconstruction models with rough scale values. Furthermore, the reconstruction results in the previous section are selected as the test set to optimize. Since there is little difference between the results before and after optimization from the subjective results, only quantitative test results are given, as shown in Table 7.
Table 7. Quantitative experiment results with model scale optimization network. In Dortmund, building a–f are the same as in Table 4. In Yokosuka, building a–f are the same as in Table 5.
The most intuitive result brought by the model scale optimization network is the reduction of the R M S E value. In this test, the average reconstruction scale error of buildings is reduced by about 1.05 m and 1.15 m in two areas. Consequently, in assignments that have certain requirements for reconstruction scale accuracy, the model scale optimization network can improve the precision of the reconstruction framework well.
To verify the generalization capability of the 3DMR framework, it was tested in terms of both shape accuracy and scale accuracy. The results are shown in Figure 11. In figure (a), the horizontal axis indicates the relative scale in images of the reconstructed target. For Scale-ONet, as mentioned in Section 3.1, a probability space with a size of unit 1 is generated, which all models are extracted from it when generating the models. Models of different scales have different occupancy rates in this space. As the proportion decreases, the E M D value increases, which means that the gap between the model shape and real target increases. Nevertheless, in most ranges, Scale-ONet achieves good results. In figure (b), the two lines indicate the average scale error for buildings of different sizes with and without Optim-Net. As the reconstruction target scale keeps increasing, the R M S E value also keeps increasing, and the scale accuracy is in a desirable range when the size of the building does not exceed 100 m. The effectiveness of the Optim-Net can also be seen in Figure 11.
Figure 11. 3DMR framework generalization ability tests. (a) E M D with different occupancy percentage of building in image. (b) R M S E at different scales.

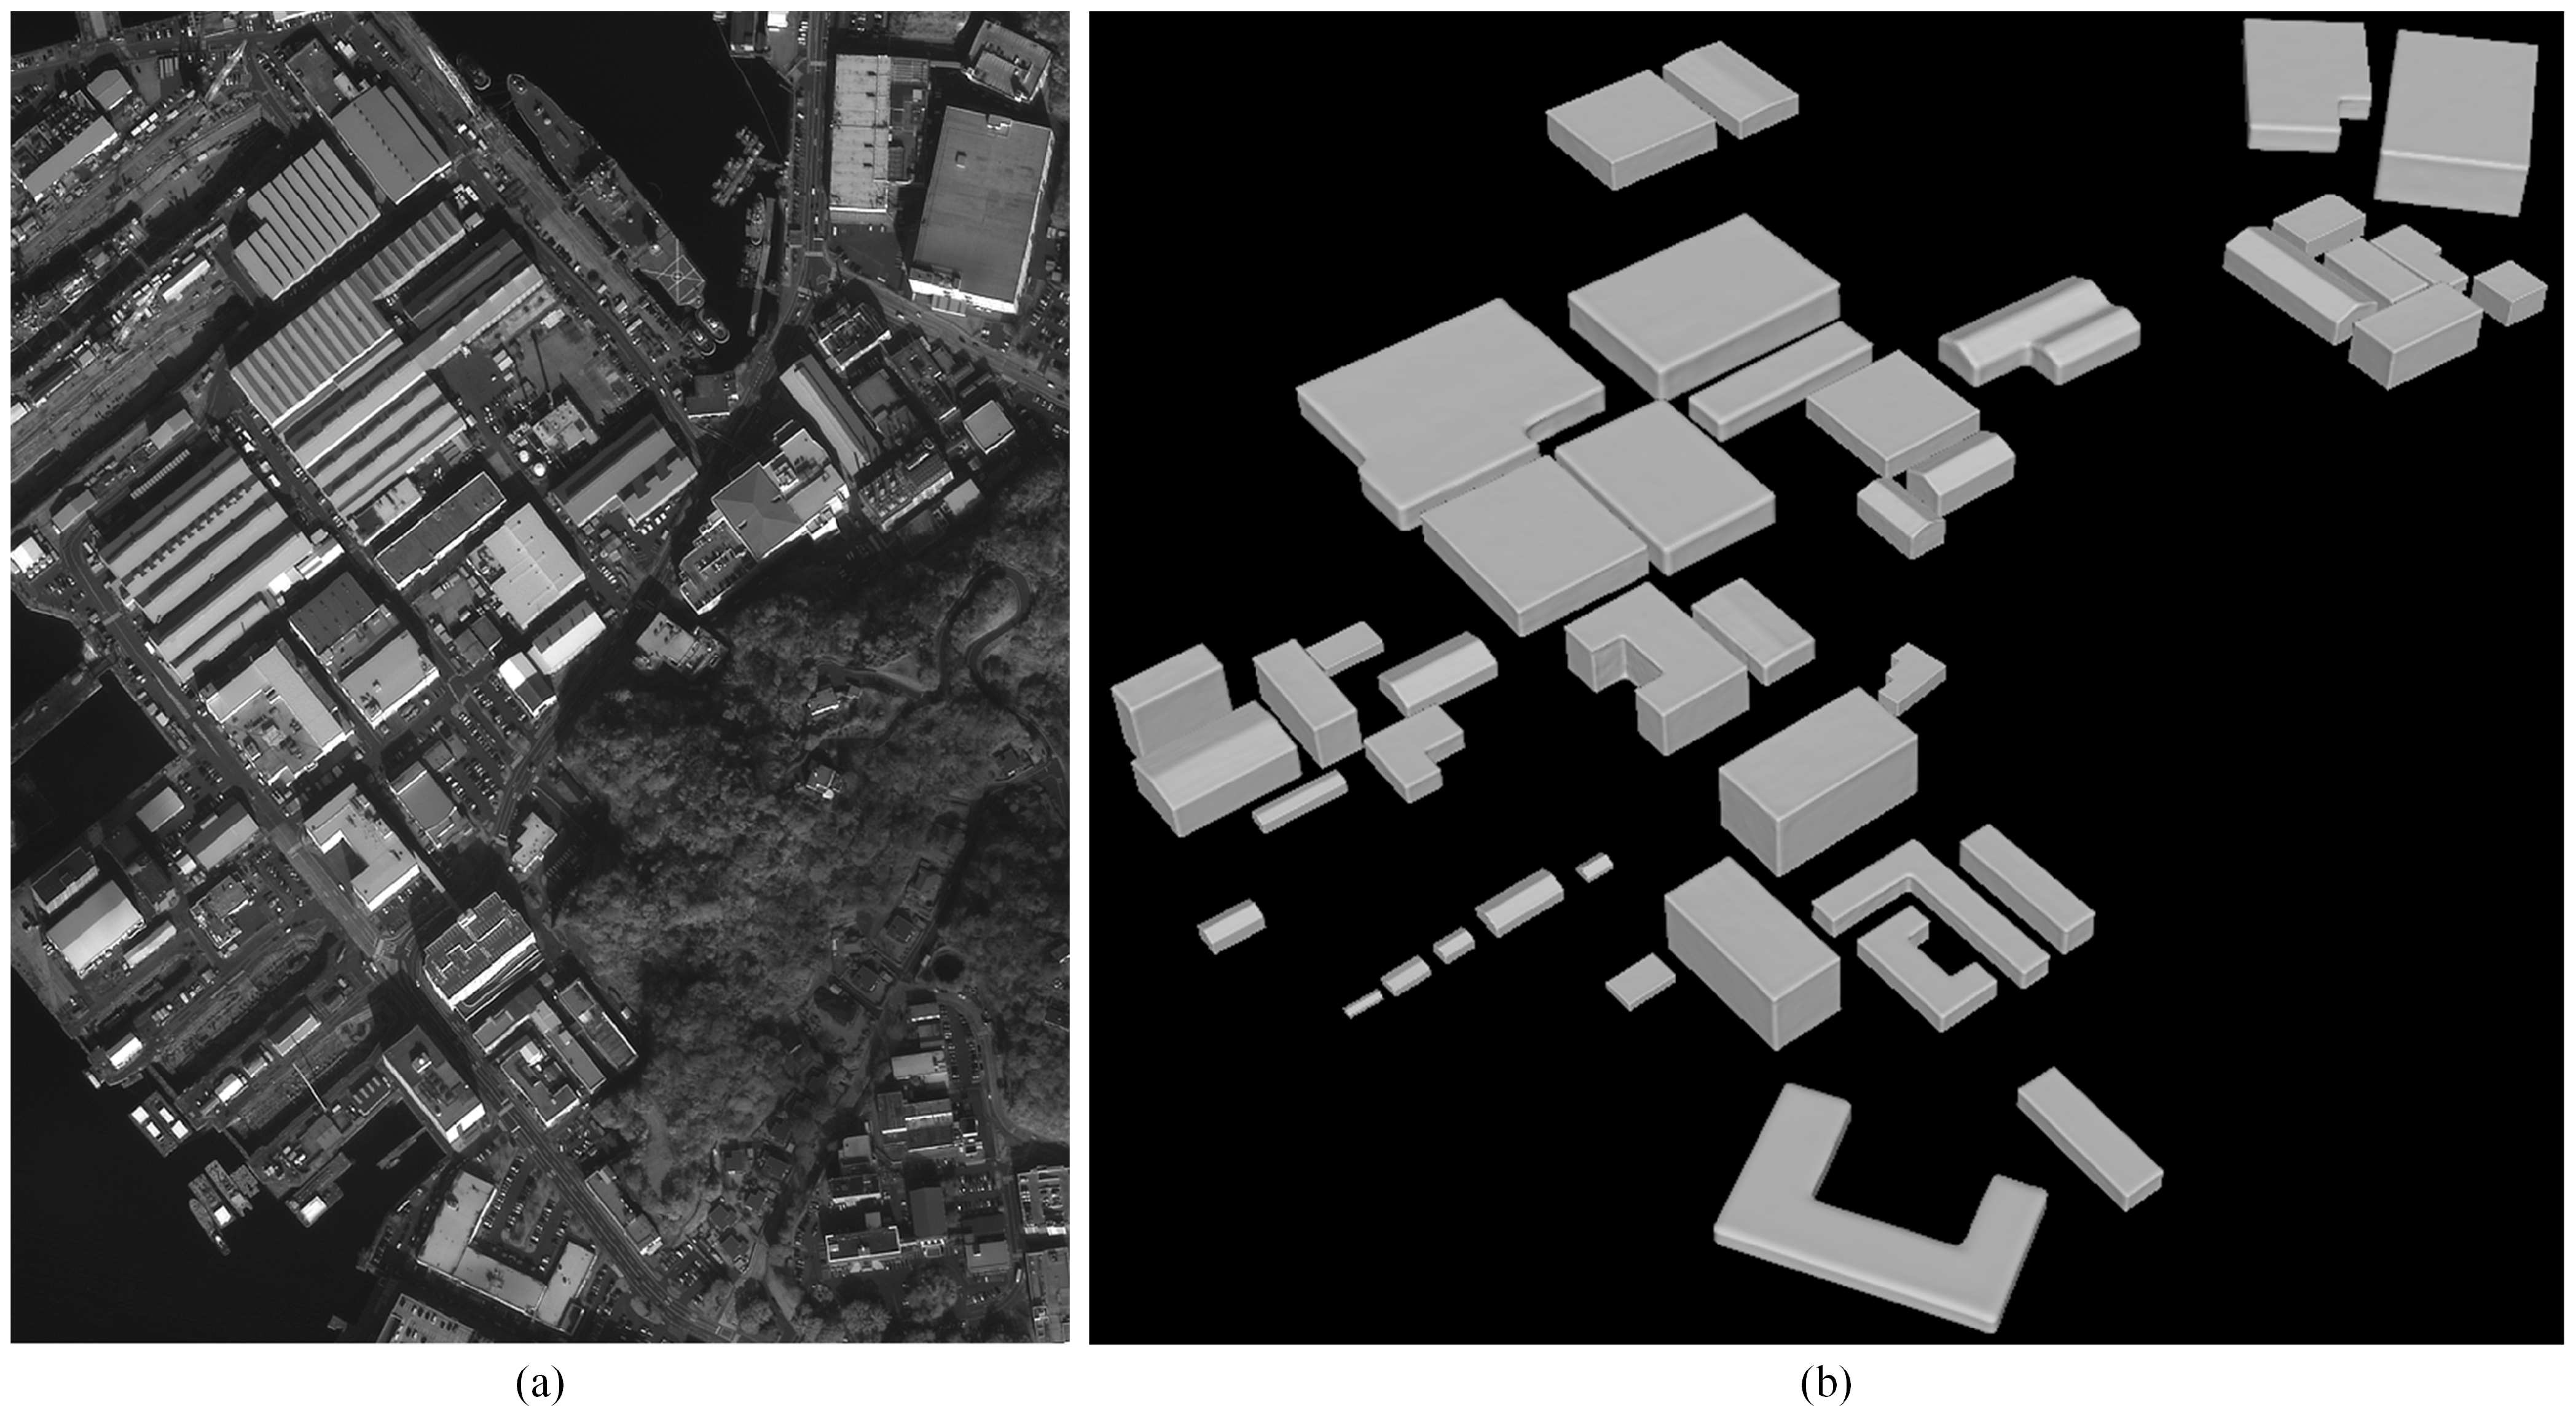
4.3.4. Restoration of Reconstruction Scenes

By the Model-Image matching algorithm, the reconstructed independent models are placed in the same scene. The position relationship between the models and the azimuth angle of the models can be accurately recovered. The 3DMR framework performs the reconstruction of complete scenes from a single off-nadir satellite image, as shown in Figure 12. In this chapter, we describe the datasets made for the experiment in detail and verify the Scale-ONet and the Optim-Net in the proposed framework. The performance of the Scale-ONet was detailed and comprehensively tested through simulation experiments, different time experiments, reconstruction experiments with different roof shapes, and panchromatic image reconstruction experiments with different building plane structures. Using only a single off-nadir satellite image, the network can accurately reconstruct images with different view-angles and imaging quality, which proves the wide applicability of the network. For the Optim-Net, the experimental results show that it has a very significant effect on the optimization of the reconstruction results, which can reduce the scale error generated by the reconstruction network and obtain a higher-precision reconstruction model.
Figure 12. Reconstruct scene recovery results. (a) is the original image, and (b) is the reconstructed scene.

5. Conclusions

In this paper, a novel 3D model reconstruction framework of buildings based on single off-nadir satellite image is proposed, which is mainly composed of three parts: A model reconstruction network named Scale-ONet, a model scale optimization network named Optim-Net, and a Model-Image matching algorithm for restoring reconstructed scenes. In the model reconstruction part, Scale-ONet can predict both the building shape and scale and generate a 3D model of the mesh structure. In the optimization part, we designed a simple and practical network structure to reduce the scale error of the mesh model generated from Scale-ONet. Finally, the algorithm placed these building models together and recovered a consistent scene with the real image area. Verified by experiment, the E M D value of the reconstructed model could be less than 1, and for the average scale error, the R M S E was equal to 2.06 m and 2.65 m in two areas, which could be optimized to about 1 m and 1.5 m by Optim-Net. The subjective results of the reconstructed model could reach a LoD2 level, meaning models have a complete and accurate roof structure and plane shape. Our framework could reconstruct models from a single off-nadir satellite image with different view-angles, sizes of buildings, and spatial resolutions. The result is water-tight mesh models with both accurate shapes and sizes. Although, the proposed framework had good generalization for different remote sensing images, it is still limited with complex building shapes, which is a challenging issue that requires more research and focus.
In the experiment part, we did not give corresponding comparative experiments. In the field of 3D building reconstruction using a single off-nadir satellite image, few studies highly relate to our framework. The single image reconstruction algorithm in computer vision does not pay enough attention to the view-angle and model scale, which cannot solve the key problem in remote sensing. Therefore, it is difficult to find similar types of methods for a fair comparison. Nevertheless, from the scope analysis in the remote sensing reconstruction field, the 3DMR framework we proposed does have advantages and actual value. The application of the proposed framework can greatly reduce the complex requirements of traditional reconstruction methods for input data. Only single satellite image is used to realize the reconstruction of the building, making the framework applicable to many scenarios where data acquisition is inconvenient.

Author Contributions

Conceptualization, C.Z. (Chunhui Zhao) and Y.Y.; methodology, Y.Y. and C.Z. (Chi Zhang); software, C.Z. (Chi Zhang); validation, N.S. and C.Z. (Chunhui Zhao); formal analysis, C.Z. (Chunhui Zhao); data curation, N.S.; writing—original draft preparation, C.Z. (Chi Zhang) and Y.Y.; writing—review and editing, Y.Y. and C.Z. (Chi Zhang); funding acquisition, C.Z. (Chunhui Zhao), Y.Y. and N.S. All authors have read and agreed to the published version of the manuscript.

Funding

This work was supported by the National Natural Science Foundation of China (No. 62071136, No. 61801142, No. 61971153, No. 62002083).

Institutional Review Board Statement

Not applicable.

Data Availability Statement

The satellite images used in experiments of the Dortmund and building scales are obtained from earth.google.com, accessed on 18 April 2021. The rest of the data was produced by ourselves which is not publicly available.

Conflicts of Interest

The authors declare no conflict of interest.

References

  1. Chen, R. The development of 3D city model and its applications in urban planning. In Proceedings of the 2011 19th International Conference on Geoinformatics, Shanghai, China, 24–26 June 2011. [Google Scholar]
  2. Zheng, X.; Wang, F.; Li, Z. A multi-UAV cooperative route planning methodology for 3D fine-resolution building model reconstruction. ISPRS J. Photogramm. Remote Sens. 2018, 146, 483–494. [Google Scholar] [CrossRef]
  3. Kuang, Q.; Wu, J.; Pan, J.; Zhou, B. Real-Time UAV Path Planning for Autonomous Urban Scene Reconstruction. In Proceedings of the 2020 IEEE International Conference on Robotics and Automation, Paris, France, 31 May–31 August 2020. [Google Scholar]
  4. Qin, R.; Huang, X.; Liu, W.; Xiao, C. Semantic 3D Reconstruction Using Multi-View High-Resolution Satellite Images Based on U-Net and Image-Guided Depth Fusion. In Proceedings of the 2019 IEEE International Geoscience and Remote Sensing Symposium, Yokohama, Japan, 28 July–2 August 2019. [Google Scholar]
  5. Yu, D.; Ji, S.; Liu, J.; Wei, S. Automatic 3D building reconstruction from multi-view aerial images with deep learning. ISPRS J. Photogramm. Remote Sens. 2021, 171, 155–170. [Google Scholar] [CrossRef]
  6. Qin, R. A Critical Analysis of Satellite Stereo Pairs for Digital Surface Model Generation and A Matching Quality Prediction Model. ISPRS J. Photogramm. Remote Sens. 2019, 154, 139–150. [Google Scholar] [CrossRef]
  7. Partovi, T.; Fraundorfer, F.; Bahmanyar, R.; Huang, H.; Reinartz, P. Automatic 3-D building model reconstruction from very high resolution stereo satellite imagery. Remote Sens. 2019, 11, 1660. [Google Scholar] [CrossRef] [Green Version]
  8. Jiang, S.; Jiang, C.; Jiang, W. Efficient structure from motion for large-scale UAV images: A review and a comparison of SfM tools. ISPRS J. Photogramm. Remote Sens. 2020, 167, 230–251. [Google Scholar] [CrossRef]
  9. Kim, T.; Javzandulam, T.; Lee, T. Semiautomatic reconstruction of building height and footprints from single satellite images. In Proceedings of the 2007 IEEE International Geoscience and Remote Sensing Symposium, Barcelona, Spain, 23–28 June 2007. [Google Scholar]
  10. Liasis, G.; Stavrou, S. Satellite images analysis for shadow detection and building height estimation. ISPRS J. Photogramm. Remote Sens. 2016, 119, 437–450. [Google Scholar] [CrossRef]
  11. Tack, F.; Buyuksalih, G.; Goossens, R. 3D building reconstruction based on given ground plan information and surface models extracted from spaceborne imagery. ISPRS J. Photogramm. Remote Sens. 2012, 67, 52–64. [Google Scholar] [CrossRef] [Green Version]
  12. Mescheder, L.; Oechsle, M.; Niemeyer, M.; Nowozin, S.; Geiger, A. Occupancy networks: Learning 3D reconstruction in function space. In Proceedings of the IEEE Conference on Computer Vision and Pattern Recognition, Long Beach, CA, USA, 16–20 June 2019. [Google Scholar]
  13. Kolbe, T.; Gröger, G.; Plümer, L. Citygml: Interoperable access to 3D city models. In Geo-Information for Disaster Management; Springer: Berlin/Heidelberg, Germany, 2005; pp. 883–899. [Google Scholar]
  14. Hu, H.; Zhu, Q.; Du, Z.; Zhang, Y.; Ding, Y. Reliable spatial relationship constrained feature point matching of oblique aerial images. Photogramm. Eng. Remote Sens. 2015, 81, 49–58. [Google Scholar] [CrossRef]
  15. Gerke, M.; Nex, F.; Jende, P. Co-registration of terrestrial and UAV-based images—Experimental results. Int. Arch. Photogramm. Remote Sens. Spat. Inf. Sci. ISPRS Arch. 2016, 40, 11–18. [Google Scholar]
  16. Gerke, M.; Nex, F.; Remondino, F.; Jacobsen, K.; Kremer, J.; Karel, W.; Huf, H.; Ostrowski, W. Orientation of oblique airborne image sets—Experiences from the ISPRS/Eurosdr benchmark on multi-platform photogrammetry. Int. Arch. Photogramm. Remote Sens. Spat. Inf. Sci. ISPRS Arch. 2016, 41, 185–191. [Google Scholar]
  17. Xie, L.; Hu, H.; Wang, J.; Zhu, Q.; Chen, M. An asymmetric re-weighting method for the precision combined bundle adjustment of aerial oblique images. ISPRS J. Photogramm. Remote Sens. 2016, 117, 92–107. [Google Scholar] [CrossRef]
  18. Galliani, S.; Lasinger, K.; Schindler, K. Massively parallel multiview stereopsis by surface normal diffusion. In Proceedings of the IEEE International Conference on Computer Vision, Santiago, Chile, 11–18 December 2015. [Google Scholar]
  19. Hu, H.; Chen, C.; Wu, B.; Yang, X.; Zhu, Q.; Ding, Y. Texture-aware dense image matching using ternary census transform. ISPRS Ann. Photogramm. Remote Sens. Spat. Inf. Sci. 2016, III-3, 59–66. [Google Scholar] [CrossRef] [Green Version]
  20. Wu, B.; Sun, X.; Wu, Q.; Yan, M.; Wang, H.; Fu, K. Building reconstruction from high-resolution multiview aerial imagery. IEEE Geosci. Remote Sens. Lett. 2015, 12, 855–859. [Google Scholar]
  21. Frommholz, D.; Linkiewicz, M.; Meissner, H.; Dahlke, D.; Poznanska, A. Extracting semantically annotated 3D building models with textures from oblique aerial imagery. Int. Arch. Photogramm. Remote Sens. Spat. Inf. Sci. ISPRS Arch. 2015, 40, 53–58. [Google Scholar] [CrossRef] [Green Version]
  22. Rothermel, M.; Gong, K.; Fritsch, D.; Schindler, K.; Haala, N. Photometric multi-view mesh refinement for high-resolution satellite images. ISPRS J. Photogramm. Remote Sens. 2020, 166, 52–62. [Google Scholar] [CrossRef]
  23. Yao, Y.; Luo, Z.; Li, S.; Fang, T.; Quan, L. MVSNet: Depth inference for unstructured multi-view stereo. In Proceedings of the 15th European Conference on Computer Vision, Munich, Germany, 8–14 September 2018. [Google Scholar]
  24. Wei, X.; Zhang, Y.; Li, Z.; Fu, Y.; Xue, X. DeepSFM: Structure from Motion via Deep Bundle Adjustment. In Proceedings of the 16th European Conference on Computer Vision, Glasgow, UK, 23–28 August 2020. [Google Scholar]
  25. Yao, Y.; Luo, Z.; Li, S.; Shen, T.; Fang, T.; Quan, L. Recurrent MVSnet for high-resolution multi-view stereo depth inference. In Proceedings of the IEEE Conference on Computer Vision and Pattern Recognition, Long Beach, CA, USA, 16–20 June 2019. [Google Scholar]
  26. Xiang, X.; Wang, Z.; Lao, S.; Zhang, B. Pruning multi-view stereo net for efficient 3D reconstruction. ISPRS J. Photogramm. Remote Sens. 2020, 168, 17–27. [Google Scholar] [CrossRef]
  27. Aguilar, M.; Del Mar Saldana, M.; Aguilar, F. Generation and quality assessment of stereo-extracted DSM from geoeye-1 and worldview-2 imagery. IEEE Trans. Geosci. Remote Sens. 2013, 52, 1259–1271. [Google Scholar] [CrossRef]
  28. Gu, Y.; Cao, Z.; Zhang, Y. Three-dimensional reconstruction of multiplatform stereo data with variance component estimation. IEEE Trans. Geosci. Remote Sens. 2014, 52, 4211–4226. [Google Scholar]
  29. Kim, S.; Rhee, S.; Kim, T. Digital surface model interpolation based on 3D mesh models. Remote Sens. 2019, 11, 24. [Google Scholar] [CrossRef] [Green Version]
  30. Izadi, M.; Saeedi, P. Three-dimensional polygonal building model estimation from single satellite images. IEEE Trans. Geosci. Remote Sens. 2012, 50, 2254–2272. [Google Scholar] [CrossRef]
  31. Haala, N.; Kada, M. An update on automatic 3D building reconstruction. ISPRS J. Photogramm. Remote Sens. 2010, 65, 570–580. [Google Scholar] [CrossRef]
  32. Alidoost, F.; Arefi, H.; Tombari, F. 2D image-to-3D model: Knowledge-based 3D building reconstruction (3DBR) using single aerial images and convolutional neural networks (CNNs). Remote Sens. 2019, 11, 2219. [Google Scholar] [CrossRef] [Green Version]
  33. Li, Z.; Xu, B.; Shan, J. Geometric object based building reconstruction from satellite imagery derived point clouds. Int. Arch. Photogramm. Remote Sens. Spat. Inf. Sci. ISPRS Arch. 2019, 42, 73–78. [Google Scholar] [CrossRef] [Green Version]
  34. Partovi, T.; Krauß, T.; Arefi, H.; Omidalizarandi, M.; Reinartz, P. Model-driven 3D building reconstruction based on integeration of DSM and spectral information of satellite images. In Proceedings of the 2014 IEEE International Geoscience and Remote Sensing Symposium, Quebec City, QC, Canada, 13–18 July 2014. [Google Scholar]
  35. Sirmacek, B.; Taubenböck, H.; Reinartz, P.; Ehlers, M. Performance evaluation for 3-D city model generation of six different DSMs from air- and spaceborne sensors. IEEE J. Sel. Top. Appl. Earth Obs. Remote Sens. 2012, 5, 59–70. [Google Scholar] [CrossRef]
  36. Awrangjeb, M.; Gilani, S.; Siddiqui, F. An effective data-driven method for 3-D building roof reconstruction and robust change detection. Remote Sens. 2018, 10, 1512. [Google Scholar] [CrossRef] [Green Version]
  37. Liu, C.; Krylov, V.; Kane, P.; Kavanagh, G.; Dahyot, R. IM2ELEVATION: Building height estimation from single-view aerial imagery. Remote Sens. 2020, 12, 2719. [Google Scholar] [CrossRef]
  38. Amirkolaee, H.; Arefi, H. Height estimation from single aerial images using a deep convolutional encoder-decoder network. ISPRS J. Photogramm. Remote Sens. 2019, 149, 50–66. [Google Scholar] [CrossRef]
  39. Smith, E.; Meger, D. Improved adversarial systems for 3d object generation and reconstruction. In Proceedings of the Conference on Robot Learning, Mountain View, CA, USA, 13–15 November 2017. [Google Scholar]
  40. Choy, C.; Xu, D.; Gwak, J.; Chen, K.; Savarese, S. 3D-R2N2: A unified approach for single and multi-view 3D object reconstruction. In Proceedings of the 14th European Conference on Computer Vision, Scottsdale, AZ, USA, 3–7 November 2014. [Google Scholar]
  41. Smith, E.; Fujimoto, S.; Meger, D. Multi-view silhouette and depth decomposition for high resolution 3D object representation. In Proceedings of the 32nd Conference on Neural Information Processing Systems, Montreal, QC, Canada, 2–8 December 2018. [Google Scholar]
  42. Wu, J.; Zhang, C.; Xue, T.; Freeman, W.; Tenenbaum, J. Learning a probabilistic latent space of object shapes via 3D generative-adversarial modeling. In Proceedings of the 30th Conference on Neural Information Processing Systems, Barcelona, Spain, 5–10 December 2016. [Google Scholar]
  43. Fan, H.; Su, H.; Guibas, L. A point set generation network for 3D object reconstruction from a single image. In Proceedings of the IEEE Conference on Computer Vision and Pattern Recognition, Honolulu, HI, USA, 21–26 July 2017. [Google Scholar]
  44. Wei, Y.; Liu, S.; Zhao, W.; Lu, J. Conditional single-view shape generation for multi-view stereo reconstruction. In Proceedings of the IEEE Conference on Computer Vision and Pattern Recognition, Long Beach, CA, USA, 16–20 June 2019. [Google Scholar]
  45. Deprelle, T.; Groueix, T.; Fisher, M.; Kim, V.; Russell, B.; Aubry, M. Learning elementary structures for 3D shape generation and matching. In Proceedings of the 33rd Conference on Neural Information Processing Systems, Vancouver, BC, Canada, 8–14 December 2019. [Google Scholar]
  46. Wang, N.; Zhang, Y.; Li, Z.; Fu, Y.; Liu, W.; Jiang, Y. Pixel2Mesh: Generating 3D Mesh Models from Single RGB Images. In Proceedings of the 15th European Conference on Computer Vision, Munich, Germany, 8–14 September 2018. [Google Scholar]
  47. Groueix, T.; Fisher, M.; Kim, V.; Russell, B.; Aubry, M. A Papier-Mache Approach to Learning 3D Surface Generation. In Proceedings of the IEEE Conference on Computer Vision and Pattern Recognition, Salt Lake City, UT, USA, 18–22 June 2018. [Google Scholar]
  48. He, K.; Zhang, X.; Ren, S.; Sun, J. Deep residual learning for image recognition. In Proceedings of the IEEE Conference on Computer Vision and Pattern Recognition, Las Vegas, NV, USA, 26 June–1 July 2016. [Google Scholar]
  49. Simonyan, K.; Zisserman, A. Very deep convolutional networks for large-scale image recognition. In Proceedings of the International Conference on Learning Representations, San Diego, CA, USA, 7–9 May 2015. [Google Scholar]
  50. Rubner, Y.; Tomasi, C.; Guibas, L. The earth mover’s distance as a metric for image retrieval. Int. J. Comput. Vis. 2000, 40, 99–121. [Google Scholar] [CrossRef]
Publisher’s Note: MDPI stays neutral with regard to jurisdictional claims in published maps and institutional affiliations.

Article Metrics

Citations

Article Access Statistics

Multiple requests from the same IP address are counted as one view.