


Abstract
Special economic zones (SEZs) are widely used to stimulate investment, employment, and industrial growth. Yet their contribution to sustainable regional development remains poorly measured. This is especially true in Kazakhstan, where zone-level assessment is largely absent from regional planning frameworks. This study addresses that gap. We construct a Regional Sustainable Development Index (RSDI) that integrates economic, social, and environmental indicators across nine Kazakhstani regions hosting active SEZs. Economic performance alone gives an incomplete picture. Omitting social and environmental dimensions distorts policy conclusions and masks structural imbalances. Our results reveal sharp differentiation across regions. In the Atyrau region, high investment volumes correspond closely with sustainability gains. This suggests structural coherence between zone operations and broader regional outcomes. The Pavlodar region presents a contrasting case. There, the leading driver of sustainability performance is not investment volume but the reduction of environmental pollution. This finding underscores why disaggregating sustainability components matters—the composite index alone is not sufficient. A comparison against official target indicators identifies both achievements and systematic shortfalls. Investment and employment targets are frequently decoupled: capital attraction does not reliably generate proportional job creation. The social dimension remains the weakest across most zones. Environmental governance shows formal recognition but limited implementation. The RSDI framework offers a practical diagnostic tool for public authorities. It makes imbalances visible before they become entrenched. Beyond Kazakhstan, the index provides a transferable instrument for resource-dependent emerging economies seeking to embed sustainability criteria into SEZ governance and regional planning.
1. Introduction
Special economic zones (SEZs) have become a globally recognized instrument of economic policy. States use them to attract foreign investment, stimulate employment, and accelerate industrial modernization. They also serve as tools for territorial rebalancing—concentrating resources where organic development is insufficient. The targeted deployment of zone-based incentives supports industrialization, clustering, and structural transformation at the regional level.
Economic zones operate under a special legal and tax–fiscal regime [1]. This regime grants investors significant preferences: reduced taxes, simplified administrative procedures, and guaranteed access to engineering and logistics infrastructure. These conditions stimulate the creation of new production facilities and encourage the localization of export-oriented enterprises [2]. By concentrating capital, knowledge, and human resources in delimited territories, SEZs accelerate socio-economic development both at the local and national level [3].
The real-world record of SEZs is more mixed. Success depends on institutional quality, management capacity, infrastructure provision, and strategic alignment with national and regional priorities [4,5]. In practice, performance varies widely across zones and contexts. This variation calls for critical reflection and empirical verification—not rhetorical endorsement.
In Kazakhstan, the development of territories with a special economic regime is a priority area of state policy. Starting in the 2000s, a system of special economic zones (SEZs) and industrial zones oriented towards the development of non-raw material sectors increasing export potential introducing innovations and industrializing regions was formed in the country. At the same time, despite active institutional support from the state and the steady expansion of the SEZ network, questions remain open about their actual effectiveness, the scale of their impact at the macro and meso levels as well as the associated social, economic and environmental effects.
Existing research focuses predominantly on the economic efficiency of SEZs—investment volumes, tax revenues, and export dynamics. The broader sustainability dimensions receive far less attention. Social outcomes such as employment quality and human capital development remain understudied. So do environmental parameters: pollution levels, resource use, and the adoption of green technologies. Institutional sustainability is similarly underexplored.
Despite an extensive bibliography on SEZs, systemic studies linking zone presence to sustainable regional development remain scarce. Three research questions motivate this study. First, to what extent do SEZs contribute to achieving sustainable development goals? Second, how does their impact vary across regions? Third, what institutional and economic factors enhance—or limit—this impact?
The purpose of this study is to conduct a comprehensive assessment of the impact of special economic zones (SEZs) operating across the regions of Kazakhstan on the sustainable development of regional socio-economic systems. Employing a regional composite sustainable development index as the primary analytical framework, the study examines the contribution of SEZs to balanced economic growth, improved social conditions, and reduced environmental risks. The findings are intended to inform the formulation of practical recommendations for strengthening state policy instruments in the domains of spatial development and investment stimulation.
Economic zones worldwide are categorized into several types. For example, Irish economic zones are defined as “industrial free zones” or “export free zones.” In the USA, they are called “foreign trade zones,” and in the PRC, “special economic zones” (in Shanghai—“free trade zone”). In Russia, there are four types of special economic zones: industrial-production type, technology-and-innovation type, tourist-recreational type, and port zones. In Kazakhstan they are referred to as special economic zones. In addition to this the country operates techno parks (stimulating scientific research and innovative activity), industrial parks, offshore zones, free trade zones and export processing zones. Each has its own specific goals and incentive tools, which makes it possible to adapt them to various economic tasks.
The goal of creating free economic zones, also known as special or particular zones, is to attract foreign investment aimed at developing the state’s economy and infrastructure. The variety of their types introduces their specifics into the definition of “economic zone.” For instance, the Kyoto Convention of 1973 notes a free zone as a part of a country’s territory where goods are considered to be outside the customs territory. A free economic zone can also be viewed as a harmonious combination of regional market and state instruments [6].
2. Literature Review and Hypotheses
Repushevskaya, O. A. and Shter, Ya A. [7] consider a free economic zone as a special category of economic territories with the most favorable conditions for entrepreneurial activity and for attracting and supporting investments in the region. According to Kachur O.V. and Rudakov S.I. [8], a special economic zone (SEZ) is an economic region created to increase the export of industrial goods and promote economic development, utilizing special incentives to reduce taxes, provide subsidies, and offer preferences. Sivash O.S. [9] clarifies that a special economic zone provides for reduced tax rates on profit, land and property as well as a reduction or complete exemption from customs duties. SEZs are capable of attracting both foreign and domestic investments because they offer businesses more favorable operating conditions [10]. Since SEZs are usually created in remote or underdeveloped regions, this contributes to the balanced economic development of the country and the reduction of regional disparities [11].
SEZs represent territories within a state where a special legal tax and economic regime is established for potential investors with the aim of developing specific sectors of the economy, stimulating innovations, increasing exports and promoting economic growth and regional development [12]. According to Repushevskaya O. A. and Shter Ya. A. [7], a special economic zone is a territory providing special preferences in the form of tax benefits, elimination of administrative barriers, and other incentive measures for projects aimed at developing production, export-oriented sectors of the economy, tourism, innovation, or regional development [13]. Following the norms of the Law of Kazakhstan “On Special Economic and Industrial Zones,” a special economic zone is a part of the republic’s territory with clearly defined borders and a special legal regime, the functioning of which results in the accelerated development of highly efficient, competitive industries, attraction of investments, introduction of new technologies into economic sectors and regions, and an increase in population employment. At the same time, the territorial approach considers the zone as a separate area with preferential conditions for all resident enterprises. The functional approach involves providing benefits for a specific type of activity regardless of location [14].
Goryachikh M.V. and Kravchenko L.A. [6] believe that the goals of creating SEZs include economic (attracting investments by creating preferential conditions, expanding foreign economic relations, etc.), scientific-technical (impetus for the dynamic development of lagging regions, technology transfer, innovations, etc.), and social (balanced regional development, new jobs, reducing unemployment, etc.). Following international practice, an SEZ is a common form of the modern international division of labor, which develops lagging regions (recipient regions) to the level necessary for their inclusion in trade and economic cooperation between regions and countries [15]. The existence of such zones enables the domestic market to meet its demand with high-quality products, introduces the latest scientific and technical developments into domestic production, increases employment, expands the country’s exports, enhances foreign exchange earnings, and creates opportunities for personnel training in accordance with international standards.
Generally, the practices of SEZs differ depending on the country and the characteristics of a particular SEZ. As world experience shows, with a correct and effective system for organizing SEZ activities, the inflow of investments into the country’s economy increases the competitiveness, indicators of the industrial sector improve, and positive dynamics are observed in the creation of new jobs and the growth of exported products [11].
In the work of Belousova S.N. and Trubin A.G. [16], the impact of a special economic zone on the socio-economic development of a region was assessed based on an analysis of the dynamics of the average annual number of people employed in the economy, the number of jobs, the total volume of investments and investments in the SEZ, the volume of gross regional product, the volume of revenue from the sale of goods and the amount of income, and tax revenue receipts. Koreva O.V. [17] adheres to similar indicators when analyzing the impact of SEZs on the sustainable development of a region, additionally considering the number of constructed and commissioned real estate and infrastructure projects, as well as the volume of customs payments. Kachur O.V. and Rudakov S.I. [8] used a narrower list of indicators, including the number of enterprises, the creation of new jobs, the volume of revenue, and tax receipts.
Damborsky M. [18] and others assessed the contribution of industrial zones to regional development by analyzing indicators such as export volume, wages of workers in industrial zones, and the contribution of industrial zones to the total number of jobs created in R&D, using a survey of 127 companies in the Czech Republic. Yeseul Hyun and Shree Ravi [19] cover information on 28 million firms located in territories where special economic zones (SEZs) are situated, considering indicators such as production and wages. Their research focuses on the impact of special economic zones (SEZs) on regional development in India, with a particular emphasis on socio-economic changes. Zeng D. Zh. [20] analyzes China’s and Africa’s experiences in creating special economic zones (SEZs) and their impact on economic development and sustainability by examining indicators such as GDP growth, exports, employment, income, and the generation of foreign direct investment.
Moberg, L. raises the issue of the political-institutional aspects of SEZ development in his study. He argues that zones often become effective when managed within a framework of clear rules, transparent procedures, and accountable governing bodies. Otherwise, there is a risk of corruption and isolation of the SEZ from the national economy, which reduces its sustainable effect [21]. In addition, the UNCTAD 2019 [22] report of World Investment Report Special Economic Zones presents a systemic assessment of the global state of special economic zones. By 2019 there were 5400 special economic zones functioning in 147 economies of the world. There is a trend of transition from the traditional model of zones to “next-generation SEZs,” which include sustainable development goals (SDGs), human capital development, support for small- and medium-sized businesses, and environmental protection [22].
At the same time, Roberta Arbolino’s work notes that European governments create special economic zones and other incentive territories either through comprehensive planning or by copying successful examples from different countries, either by borrowing foreign experience or by implementing based on impact analysis. The results show that ineffective copying of models from countries with stable economies and strong institutions is more often applied [23]. It is also worth noting the contribution of FIAS (Foreign Investment Advisory Service), presented in the report “Special Economic Zones: Performance, Lessons Learned, and Implications for Zone Development” (2008). The authors of this document emphasize that SEZs become successful in the presence of a favorable macro-economic environment, professional management, precise strategic positioning, and a focus on priority industries. They highlight the need for a systematic assessment of the impact of zones on regional development, encompassing not only economic but also social indicators, a position consistently advocated by the FIAS [24].
The 2008 study by Crittle and Akinci as well as the 2011 work by Farole and Akinci titled “Special Economic Zones Progress Emerging Challenges and Future Directions” examine the issues of zone development. SEZs act as a catalyst for business activity and require the simplification of administrative procedures to improve the investment climate. The success of their functioning depends significantly on strategic coordination with national and regional development priorities. When evaluating SEZs the authors emphasize the importance of jointly considering goals in the fields of employment ecology and economy because these results are interdependent [12].
Warr, P. (1989) [25] proposed a model in his classic work, “Export Processing Zones: The Economics of Enclave Industrialization” for assessing the economic effects of SEZs based on the multiplier effect on the local economy. Although the study is based on the analysis of special economic zones (SEZs) in Southeast Asian countries, the conclusions about the conditions for achieving a sustainable effect—availability of a skilled workforce, access to infrastructure, and a predictable regulatory framework—remain relevant and applicable to the Kazakhstan case.
Madani, D. (1999) [26] in the study “A Review of the Role and Impact of Export Processing Zones” emphasizes the dual nature of SEZs’ impact: on the one hand, they stimulate industrial development; on the other, they can lead to spatial and economic segregation if not integrated into the national financial system. Madani highlights that long-term success depends on the flexibility of SEZ policy and its ability to adapt to changes in global demand and internal challenges.
Finally, the OECD (2023) [27] in its report “The Role of Economic Zones in Regional Development” points out the growing role of SEZs in achieving the Sustainable Development Goals (SDGs), including gender equality, employment, inclusive growth and climate neutrality. The document emphasizes the need to create inclusive and green SEZs, including through the application of Sustainability Impact Assessment (SIA) mechanisms.
According to the authors of reports presented at a conference held at Kyushu University in Fukuoka in January 2015, special economic zones are geographical areas where economic, labor, tax, and other regulatory policies are more aligned with free-market principles compared to the rest of the country [28]. Jiaxin Li and others in their work analyzed the impact of SEZs on the participation of Chinese firms in global value chains (GVCs), as they strengthen firms’ positions in GVCs through increased productivity, reduced costs, and access to finance, especially for non-state, trading, and high-tech companies in coastal regions [29]. Irina Di Ruocco asserts that SEZs represent territories with special conditions for attracting investments and stimulating trade usually located near ports or state borders. Considering the creation of the SEZ in 2017 in the Campania region (southern Italy Mezzogiorno) she believes that this zone has become a model for supporting economic and territorial development. The article also analyzes SEZ strategies aimed at financial [30] and territorial sustainability, using a model based on macro-sectoral clusters and considering both economic and territorial indicators [31].
Johannes Gallé and others assessed the impact of special economic zones (SEZs) created in India on the local economy, based on data combining a census of firms and geodata of SEZs. They found that the creation of these zones contributed to employment growth in industry and services [32], with positive effects extending up to 10 km from the zones. Employment growth was accompanied by a decline in agricultural labor, particularly among women, indicating structural changes in the economy [33]. Tevin Tafese examined Vietnam’s role in GVCs, reflecting the growth in US market share and FDI inflows, and analyzed the impact of SEZs on the labor market as a channel for income growth and living standards, not only for the example of Vietnam but also supplementing the study with the impact of SEZs on employment in India and China [34]. Many other foreign researchers have studied the impact of special economic zones on regional development: Thomas Farole [35] examined the impact of SEZs on economic growth and social change in Africa; Jayanthakumaran Kankesu [36] analyzed the economic and social consequences of SEZ functioning; Akinci Gokhan and Crittle James assessed the impact of SEZs on employment and population welfare [24].
Synthesis and research gap: The reviewed literature reveals three convergent findings that shape the analytical framework of the present study. First, international evidence consistently demonstrates that SEZ effectiveness is conditional on institutional quality, strategic coordination with regional priorities, and the integration of economic, social, and environmental dimensions. Second, existing assessment frameworks predominantly capture the economic performance of SEZs—investment volumes, employment, exports—while systematically underweighting social and environmental outcomes. Third, recent work on “next-generation SEZs” explicitly links zone performance to the Sustainable Development Goals and calls for the integration of Sustainability Impact Assessment mechanisms, yet operationalizations of this integrated approach at the country level remain scarce. Recent literature increasingly employs quasi-experimental designs—most prominently the synthetic control method (SCM)—to evaluate the true causal impact of SEZs. Traditional evaluations often struggle to isolate a zone’s specific effects from broader economic trends. SCM addresses this by creating a data-driven counterfactual, showing what would have happened to a region without the SEZ. Li et al. [37] applied SCM to evaluate the Hainan free trade port, demonstrating a robust positive effect on new firm registrations. Hornok and Raeskyesa [38] applied synthetic control case studies across Indonesian provinces, finding that local income inequality tends to rise after an economic zone opens, although the average effect is relatively small and may be short-lived, masking large regional differences that suggest the distributional implications of SEZ policies depend heavily on local conditions. Similarly, Sa’dia and Fitrady [39] used SCM to assess the Sei Mangkei SEZ in North Sumatra, finding that the zone has not yet generated significant regional economic growth, a result that underscores how baseline local conditions shape zone outcomes. Phommachanh [40] applied advanced counterfactual estimators to nightlight data in the Lao PDR, finding precisely estimated positive effects on economic activity in SEZ host districts, albeit with a lag attributable to the absence of a unified legal framework during the early stages of zone policy. Collectively, these SCM-based studies highlight a crucial lesson: the true economic effectiveness of SEZs is highly uneven and deeply dependent on baseline local conditions. The present study does not employ SCM due to the absence of comparable control regions without SEZs in Kazakhstan’s administrative structure; instead, the RSDI framework provides a cross-sectional composite assessment of observed sustainability outcomes across all active zones.
For Kazakhstan specifically, no published study has constructed a composite regional sustainable development index that jointly measures SEZ contributions to all three pillars of sustainability. This study addresses that gap by developing a quantitative framework—the Regional Sustainable Development Index (RSDI)—that translates the conceptual integration advocated in the literature into a replicable empirical tool, and by applying it to a comprehensive dataset covering all active SEZs in Kazakhstan. The three sub-hypotheses formulated below directly derive from these theoretical priors: H1 tests the structural decoupling identified by Farole & Akinci; H2 tests the social underperformance documented across comparable emerging-economy contexts; and H3 tests the environmental governance gap highlighted in the OECD and UNCTAD reviews.
Based on the preceding in-depth literature review, the main research hypothesis (H) is formulated as follows: the functioning of special economic zones in Kazakhstan retains its potential to generate a consistent and balanced contribution to sustainable regional development, although the current relationship between investment activity, social outcomes and environmental indicators in these zones shows uneven structural coherence and regional disparities.
The hypothesis is further developed across three interrelated dimensions—economic, social, and environmental—from which the following specific sub-hypotheses are derived:
H1.
Higher investment volumes attracted by SEZs do not systematically translate into proportional employment growth, indicating that the economic model underlying zone operations is predominantly capital-intensive and structurally decoupled from labor market outcomes in host regions.
H2.
The social component of SEZ impact, measured through job creation and poverty reduction indicators, remains systematically underdeveloped relative to the economic component, consistent with the absence of explicit social targeting mechanisms in the design and governance frameworks of Kazakhstan’s special economic zones.
H3.
Despite the relatively high weight assigned to the environmental indicator in the construction of the sustainable development index, the environmental governance frameworks of Kazakhstan’s SEZs are structurally insufficient to translate formal compliance requirements into measurable improvements in regional sustainability outcomes, reflecting a systematic misalignment between declared environmental priorities and the actual incentive architecture governing zone operations.
3. Materials and Methods
During the research, comparative and retrospective analyses of the initial data were applied, as well as the method of index calculation of indicators. The comparative analysis helped to identify key differences and similarities in the dynamics of the studied processes, and the retrospective analysis allowed for the study of trends over a five-year period. The use of index calculation methods made it possible to obtain a comprehensive assessment of the changes. Until 2024, fourteen SEZs were developing in Kazakhstan (See Figure 1): from 2001 SEZ Astana new city (Astana city), from 2003 SEZ Seaport Aktau (Mangystau region) and SEZ Park of Innovative Technologies (SEZ PIT, Almaty city), from 2005 SEZ Ontustik (Shymkent city), from 2007 SEZ National Industrial Petrochemical Technopark (SEZ NINT, Atyrau region), and from 2011 SEZ Khorgos Eastern Gate (Zhetysu region), SEZ Saryarka (Karaganda region) and SEZ Pavlodar (Pavlodar region) [1].
Figure 1.
Spatial distribution of SEZs in Kazakhstan established up to and including 2025.
From 2012 was established SEZ Jibek Joly (Zhambyl region), from 2017 SEZ International Center for Boundary Cooperation Khorgos (SEZ ICBC Khorgos, Zhetysu region) and SEZ Astana Technopolis (Astana city), from 2018 SEZ Turan (Turkestan region), from 2019 SEZ Qyzyljar (North Kazakhstan region), from 2024 SEZ Alatau (Almaty region), from 2025 SEZ Aktobe (Akttobe region) and SEZ Qorqyt Ata (Kyzylorda region) [1]. Figure 2 presents the actual volumes of investments in the special economic zones of Kazakhstan for the years 2019–2023.
Figure 2.
Volume of investments in SEZs over the years of operation (in billion tenge).
The largest volume of investments is noted in SEZ NINT at 1360.9 billion tenge. It is followed by SEZ TURAN (527.8 billion tenge) and SEZ Astana new city (501.9 billion tenge). The smallest investment volumes were recorded for SEZ Alatau (23 billion tenge), SEZ ICBC Khorgos (32.5 billion tenge) and SEZ Qyzyljar (44.7 billion tenge). In order to analyze the current state of SEZ development, a comparison was made of the actual indicators and the target indicators enshrined in the normative legal acts on the creation of SEZs (See Table 1).
Table 1.
Target indicators of SEZ functioning 1.
At the same time, in some SEZs where target investment indicators were exceeded, a significant increase in jobs in SEZ Seaport Aktau is observed by 303.2 billion tenge and by 272 people, in SEZ PIT by 208.0 billion tenge and by 3991 people, and in SEZ NINT by 66.9 billion tenge and by 114 people. At the same time, in SEZ TURAN an almost complete achievement of planned indicators is noted as investments slightly exceeded the planned value by 2.2 billion tenge, and the number of participants and companies exceeded the planned indicator by only three units. It should also be noted that the number of residents in special economic zones in some cases increases even with an insufficient level of investment. Thus, in SEZ Pavlodar actual investments did not reach the level of the planned indicator by 93.1 billion tenge, but at the same time the current number of SEZ participants exceeded the expected number by 92 units.
In addition, the analysis of the table data showed that a significant excess of the number of enterprises is not always associated with the creation of a larger number of jobs. The number of participants in SEZ Ontustik significantly exceeded the planned value by 54 companies, while the number of jobs did not reach the target indicator, with a difference of 2178 jobs. Also, as a result of the analysis of Table 1, it was revealed that SEZs lagging behind planned investment values usually do not reach the plans for job creation: SEZ ICBC Khorgos less by 283.6 billion tenge and less by 2533 jobs, SEZ Jibek Joly less by 134.9 billion tenge and less by 1020 jobs, and SEZ Qyzyljar less by 130.3 billion tenge and less by 629 jobs.
Thus, for 14 SEZs of Kazakhstan, it is determined that investments and job creation are not always directly related because investment growth does not always lead to job growth, and conversely a lag in investments can be accompanied by an increase in the number of enterprises. The number of participants is also not always proportional to the volume of investments or the number of created jobs because an increase in the number of companies can be observed even with a lack of investment.
The qualitative observations drawn from the table can be substantiated and sharpened through a set of standard econometric measures applied to the deviations between planned and actual values across all three performance dimensions.
The first dimension of the analysis concerns investment performance. Regarding the investment indicators, the following picture of statistical deviation measures between planned and actual values emerges: mean planned value 331.54 billion tenge, mean actual value 262.17 billion tenge, mean deviation −69.37 billion tenge, standard deviation of deviations 303.32 billion tenge, MAE 166.01, RMSE 300.41, and coefficient of variation of planned values 143.6%. These figures indicate systematic underperformance at the aggregate level, yet the average conceals extreme internal dispersion. The standard deviation of deviations is nearly equal in magnitude to the mean planned value itself, and the coefficient of variation confirms that investment targets across zones are highly heterogeneous and poorly comparable. Individual outliers, most notably SEZ PIT (+1733.3% relative deviation) and SEZ Astana Technopolis (+1088.5%), distort the aggregate picture substantially. Six zones fell below plan, with SEZ ICBC Khorgos recording the deepest relative shortfall at −89.7%.
The second analytical dimension addressed is the number of participating companies. Regarding the participant number indicators, the following picture of statistical deviation measures between planned and actual values emerges: mean planned value 35.93 companies, mean actual value 49.36 companies, mean deviation +13.43 companies, standard deviation of deviations 27.82, MAE 18.29, RMSE 29.98, and coefficient of variation of deviations 77.4%. The positive mean deviation suggests that zones attracted more resident companies than planned, but the high dispersion indicators make this average unreliable as a summary statistic. SEZ Pavlodar (+475.0%) and SEZ Ontustik (+450.0%) are extreme outliers on the positive side, while SEZ Astana Technopolis (−75.0%) and SEZ Alatau (−50.0%) fell significantly short. Ten of 14 zones exceeded their participant targets, which superficially suggests success, but as the investment and employment data make clear, a higher number of residents does not translate predictably into capital or jobs.
The third analytical dimension addressed is employment creation. Regarding the employment creation indicators, the following picture of statistical deviation measures between planned and actual values emerges: mean planned value 2083.07 jobs, mean actual value 1690.64 jobs, mean deviation −392.43 jobs, standard deviation of deviations 1637.93, MAE 1035.57, RMSE 1626.40, and coefficient of variation of deviations 78.6%. These are the most concerning figures in the dataset. The average absolute planning error exceeds one thousand jobs per zone, which is a substantial margin in policy terms, and eight of 14 zones failed to meet their employment targets. The relative deviations range from −92.4% (SEZ Jibek Joly) and −83.0% (SEZ Astana Technopolis) to +146.8% (SEZ PIT), reflecting how heavily the distribution is shaped by a small number of extreme cases in both directions. On that basis, the cross-dimensional interpretation leads to the following conclusions. The coefficients of variation for deviations stand at 91.5% for investments, 77.4% for participants, and 78.6% for employment, all consistently exceeding the 75% threshold that signals high to very-high volatility in planning accuracy. This pattern is not random noise around a well-functioning average: it reflects the absence of a stable structural relationship between planned and actual outcomes across all three dimensions simultaneously. The planning framework for Kazakhstan’s SEZs appears to lack the predictive validity needed to serve as a reliable management instrument, and the econometric indicators presented here quantify what the qualitative reading of the table could only suggest.
Drawing on the data and analysis presented above, this study examines the impact of SEZs on sustainable regional development, specifically their contribution to economic, social, and environmental outcomes across Kazakhstan’s regions.
This study assesses the impact of SEZs through the construction of a regional sustainable development index, designed to capture the overall level of sustainable development across regions by integrating environmental, social, and economic dimensions. The index is calculated using an integral formula in which individual indicators are aggregated into a composite measure through the application of weight coefficients [41,42].
Formula (1) represents the Regional Sustainable Development Index (RSDI):
is the regional sustainable development index;
is the normalized indicator of the i-th parameter; is the weight coefficient reflecting the importance of the i-th parameter in the overall index; n is the total number of parameters considered in the index calculation.
To assess the relationship between the effectiveness of special economic zones (SEZs) and the sustainable development of a region, the following indicators are used, which collectively allow for an assessment of the impact of SEZs on sustainable regional development, considering not only economic but also social and environmental aspects (See Table 2).
Table 2.
Indicators for calculating the impact of SEZs on the socio-economic development of regions using the Regional Sustainable Development Index method 1 2024.
The indicators in Table 2 have different units of measurement and different scales. In order to bring them to a single scale, the normalization of the indicators was carried out using the min–max method [43].
is the value of the indicator for the region under consideration; and are minimum and maximum values of this indicator among all regions.
3.1. Rationale for Indicator Selection
The five indicators (X1–X5) were selected to capture the three dimensions of sustainable development (economic, social, environmental) at the regional scale at which SEZ effects can be realistically measured given data availability. Several methodological caveats apply to this selection and should be made explicit.
Economic indicators (X1—SEZ investment volume; X2—regional GRP growth before and after SEZ establishment) are directly attributable to SEZ activity, as SEZ investment data are reported by the designated government authority (Qazindustry) at the zone level. X2 isolates the SEZ contribution by comparing GRP trajectories before and after zone establishment.
Social indicators (X3—number of created jobs; X4—poverty level) present a more complex attribution problem. X3 is reported directly at the SEZ level and is therefore unambiguously zone-specific. X4, by contrast, is a regional indicator, and its attribution to SEZ impact is partial rather than causal. We retain X4 in the index because the declared social mission of Kazakhstan’s SEZs includes regional economic upliftment, and poverty reduction represents the institutional target against which this mission should be evaluated—even when direct causal attribution cannot be established.
The environmental indicator (X5—regional air pollution) similarly operates at the regional rather than zone-specific level. The link between SEZ activity and regional pollution is assumed on the grounds that SEZs concentrate industrial activity in delimited territories, but we acknowledge that this link is not definitively demonstrated by the data and would benefit from zone-specific environmental monitoring in future research. The use of air pollution as the sole environmental metric is a limitation imposed by data availability; a more comprehensive environmental assessment would ideally incorporate water quality, soil contamination, waste generation, carbon emissions, and ecosystem service valuation, as outlined in the future research agenda in Section 5.
Interpretation of the environmental indicator X5: The values of X5 in Table 2 represent absolute regional air pollution volumes (thousand tons) for the reference year 2024. In the context of the Kazakhstani planning framework, these values are interpreted as indicators of the current environmental burden borne by each host region, and Pavlodar’s high value (687.8 thousand tons) reflects the historically heavy industrial specialization of the region rather than a recent improvement. The reference in hypothesis H3 and in the discussion section to “reduction of environmental pollution” should therefore be understood as shorthand for the broader normative orientation of Kazakhstan’s environmental policy toward pollution reduction, not as a temporal reduction measure derived from the present dataset. A true measure of pollution reduction would require time-series data tracking pollution levels before and after SEZ establishment, which falls outside the scope of the current cross-sectional analysis and is identified as a priority for future research (see Section 5.1).
The exclusion of Astana city and Zhetysu region from the composite index calculation is motivated by the presence of two SEZs operating within each of these territories (SEZ Astana New City + SEZ Astana Technopolis; SEZ Khorgos Eastern Gate + SEZ ICBC Khorgos). In such cases, regional-level socio-economic and environmental indicators cannot be unambiguously attributed to the performance of any individual zone, introducing an aggregation bias that would distort comparative ranking. Descriptive indicators for these excluded regions are nevertheless retained in Table 1 for transparency. A robustness check that included aggregated data for Astana and Zhetysu (attributing regional outcomes proportionally to zone investment shares) did not alter the qualitative ordering of the top-performing regions. SEZ Alatau was also excluded from the index calculation as it was established only in 2024 and lacks sufficient operational history for meaningful assessment.
Weight coefficients for each normalized indicator are determined based on expert assessment (See Formula (3)).
3.2. Weighting Procedure and Sensitivity Analysis
The weight coefficients (ω1 = 0.32, ω2 = 0.34, ω3 = 0.02, ω4 = 0.02, ω5 = 0.30) were derived through a structured expert assessment procedure based on the Analytic Hierarchy Process (AHP) methodology proposed by Saaty (1990) [44]; See Appendix A. A panel of experts was convened, comprising senior specialists from the Republican Center for State Urban Planning and Cadastre, Committee for Construction and Housing and Communal Services, Ministry of Industry and Construction of the Republic of Kazakhstan, and from the L.N. Gumilyov Eurasian National University; See Appendix B. The panel composition covered all five domains represented in the index: regional development, economics, social and economic development, demography and social policy, and environmental protection. Each expert assessment derives pairwise comparisons between the five indicator groups using Saaty’s fundamental 1–9 scale [44].
The resulting pairwise comparison matrices were aggregated using the geometric mean, and priority vectors were extracted via the eigenvector method. The consistency of expert judgments was verified by computing the Consistency Ratio (CR) for each individual matrix; all matrices yielded CR < 0.10, confirming acceptable consistency per Saaty’s standard threshold.
The low weights assigned to indicators X3 (job creation) and X4 (poverty level)—0.02 each—reflect two methodological considerations. First, these indicators demonstrated the lowest discriminatory power across regions in preliminary sensitivity testing. Second, the expert consensus reflected the institutional reality that Kazakhstan’s SEZ governance framework does not currently incorporate explicit social targeting mechanisms, so the composite index was calibrated to capture the observed rather than the normative distribution of policy priorities. We acknowledge that this design choice has interpretive consequences: the near-zero social weights mean that the composite index captures the current institutional architecture of SEZ governance rather than an idealized sustainability benchmark. This limitation is explicitly addressed in Section 5.1 (Limitations).
To test the robustness of the index to alternative weighting schemes, a sensitivity analysis was conducted using three alternative weight configurations: (i) equal weights (ω = 0.20 for each indicator); (ii) a social-prioritized scheme (ω1 = 0.15, ω2 = 0.15, ω3 = 0.25, ω4 = 0.25, ω5 = 0.20); and (iii) a purely economic scheme (ω1 = 0.50, ω2 = 0.50, ω3 = ω4 = ω5 = 0). The regional ranking under each configuration is reported in Table 3.
Table 3.
Sensitivity analysis of the RSDI under alternative weighting schemes (regional rankings, 1 = highest).
The results demonstrate that the ordering of the top-performing regions is highly stable across weighting alternatives: Atyrau region and Almaty city occupy first or second place under all four schemes, and Mangystau region remains in third or fourth place throughout. The Spearman rank correlation between the original ranking and the equal-weights ranking reaches ρ = 0.933 (p = 0.0002), confirming strong ordinal agreement. The correlation with the economic-only scheme is also high (ρ = 0.800, p = 0.010), whereas the social-prioritized scheme produces a more divergent ordering (ρ = 0.583, p = 0.099), mainly because it elevates regions with high poverty-reduction scores (Turkestan, Shymkent). Pavlodar region is the most position-sensitive case: it ranks 4th under the economic-only scheme but 9th under equal and social-prioritized schemes, which directly reflects the interpretive point discussed in Section 5—its high index in the original specification depends critically on the 0.30 weight assigned to the environmental dimension. Overall, the sensitivity analysis confirms that the qualitative conclusions of the study are robust to the choice of weights, while cautioning that the composite index should be interpreted as a heuristic ranking tool rather than a precise cardinal measure, in line with best practice in the construction of sustainability composite indicators.
The weight coefficient shows what significance a specific indicator has within the overall index. The normalized values of the indicators and their weight coefficients are substituted into the formula of the Regional Sustainable Development Index, and the final sustainable development indices of the regions are calculated (See Table 4).
Table 4.
Calculation of final regional sustainable development indices.
The analysis of the sustainable development indices of the regions of the volume of investments in SEZs for the above-mentioned regions shows that the index values vary from 0 in the North Kazakhstan region to 1 in the Atyrau region. All sustainable development indices are of a low level, which indicates the presence of problems in one or several aspects of sustainable development.
At the same time, it is noted that the regional sustainable development indices characterizing the growth of the regional GRP before and after the creation of the SEZ have higher values relative to the previous index values, although here the values also vary from minus 0.0002 in the North Kazakhstan region to 0.9992 in the Atyrau region; at the same time, in some regions the index values approach 1: in the city of Almaty 0.8763, in the Mangystau region 0.5288, in the Pavlodar region 0.5089.
The values of the weights for these economic indicators (0.32 and 0.34) indicate that the creation of SEZs in these regions contributed to economic growth, but at the same time the current economic activity is insufficient for a high level of sustainable development. Only the Atyrau region shows sustainable growth, where the sustainable development index is equal to 1. The low weight of social indicators (0.02 each) and the low sustainable development indices for the number of created jobs and the poverty level generally indicate that SEZs did not provide a significant improvement in the social sphere, which is partially due to the limited creation of new jobs a small share of investments in the social ecosystem and various kinds of problems in the social sphere. Only the city of Almaty and the Turkestan region can have sustainable growth in this sphere. The high weight of the environmental indicator (0.3) reflects that regional sustainable development strategies pay attention to environmental aspects. However, despite this, the impact of SEZs on the environment requires careful monitoring to avoid negative consequences for the environment because according to this component of the sustainable development index across all regions only the Pavlodar region has a sustainable development index value equal to 1.
Thus, it is determined that the regional sustainable growth index allows for a comprehensive assessment of the sustainable development of regions where SEZs operate considering priorities and the balance between various components of the economic, social and environmental spheres. At the same time, for a more accurate determination of the factors that influenced sustainable development, it is necessary to use various methodologies and a deeper analysis and assessment of indicators of the regional economic development.
4. Results
Within the framework of the study, an integral index of regional sustainable development () was calculated for nine administrative-territorial units of Kazakhstan where special economic zones (SEZs) operate. The index was calculated based on normalized values of five key factors (X1–X5), reflecting the investment, social, environmental, and economic components of sustainability. A system of weights (ω), determined by expert assessment and statistical significance of the factors, was used to aggregate the indicators. Detailed results for each region are provided below.
Atyrau region demonstrated the highest value of the integral index ( = 0.7218). This is due to the maximum value for indicator X1 (volume of investments in SEZs)—1.000—which, combined with the highest factor weight ω1 = 0.32, provides the main contribution to the final index. An additional impact was made by indicator X2 (GRP growth) considering its high value (0.9992), due to its high weight (ω5 = 0.34). The values of X2–X5 were at a low level, which indicates the need to balance the social and environmental development of the region. Pavlodar region took second place in the sustainability integral index ( = 0.5105). The key driver was indicator X5 = 1.000 (reduction of air pollution), which is particularly significant with a weight of 0.30. There were moderately high values of X2 (0.5089), and the balance of the remaining factors ensures a high sustainability assessment.
Zhambyl region achieved a value of = 0.1106, mainly due to the maximum value of indicator X2 (accessibility of social services)—1.000—with a weight of ω2 = 0.34. X4 (poverty level reduction) was 0.4737 with a weight of ω2 = 0.02. The remaining parameters are at a low level (investments 0.0155, pollution 0.0372, jobs 0) which reflects structural one-sidedness and potential sustainability risks in case of changes in social dynamics. The Karaganda region showed an average index value of 0.2408 with an uneven distribution of factor values X1 = 0.1194, X2 = 0.0268, X3 = 0.1716, X4 = 0.0000 and X5 = 0.6334. The latter indicator, reflecting the environmental situation, is the highest and adds significance to the region’s sustainability. Despite relatively low values for investment and employment, the Karaganda region demonstrates potential for comprehensive development.
Almaty City received an integral index of 0.3742, with an extreme value of X3 (number of created jobs)—1.000. A high value is also observed for X2 = (0.8763). However, extremely low indicators for investments (X1 = 0.1332) and environmental parameters (X5 = 0.0257) significantly reduce the overall score. This indicates a high dependence of the region on the domestic labor market with a weak investment base and environmental challenges. Turkestan region reached = 0.2110, at the maximum value for X4 (1.000). This indicates the active development of investment projects and a relatively balanced social policy. However, the zero value of X5 and low economic dynamics (X2 = 0.1995) reduce the overall sustainability potential.
The Mangystau region with an index of 0.3095 demonstrated moderate values for all indicators. The highest values were recorded for X2 (0.5288) and X4 (0.7895); however, environmental and investment indicators remain at a low level. This may indicate the initial stage of comprehensive sustainability with a priority on employment and investment attraction. The North Kazakhstan region showed one of the lowest indices at minus 0.0215, caused by a zero value of X1 (investments), a negative X2 (GRP growth) and extremely low X3 (0.0433) and X5 (0.0502). Despite the moderate value of X4 (0.2807), it is not enough to compensate for the deficit of investment, economic and environmental components. The city of Shymkent demonstrated the lowest level of sustainability with 0.0904. The indicators in all directions turned out to be extremely low, especially ecology (X5 = 0.0030), social infrastructure (X2 = 0.2003) and investments (X1 = 0.0179). This indicates a high degree of imbalance and requires a reassessment of the role of SEZs in the city development strategy.
In general, among all factors the greatest influence on the sustainability index was exerted by X1 (investments) and X2 (social infrastructure), each of which has a weight of more than 0.30, and X4 (poverty level reduction), with a weight value of 0.02. Only three regions (Atyrau, Pavlodar regions and the city of Almaty) have a sustainability index above 0.35, which can be interpreted as relatively balanced development within the framework of the SEZ operation. In most regions there is an imbalance between factors when one or two indicators reach high values, but the rest remain critically low, which reduces the overall sustainability. The inclusion of social and environmental components in the index allows us to consider not only the economic effect but also the quality of the environment and life, which is especially important for assessing the long-term sustainability of SEZs.
The weight coefficients (0.32; 0.34; 0.02; 0.02; 0.30) show the relative influence of each indicator on the overall regional sustainable development index ():
- Coefficients 0.32 and 0.34 for X1 and X2 have the most significant weights, meaning that economic aspects play an important role in the sustainable development index of regions with SEZs. Achieving high rates of economic growth in regions is crucial. At the same time, development strategies must account for the indicators that show the effectiveness of SEZ functioning and conduct a more thorough selection of planned investment projects. High weight values imply an expectation that SEZs will give a significant impetus to the improvement of economic indicators in the future;
- Coefficients of 0.02 for X3 and X4 have the lowest weights, meaning they have low significance in the sustainable development index of regions with SEZs, which may indicate that the creation of SEZs does not always lead to immediate improvements in the social sphere. That is, jobs created within SEZs may not cover the needs of the entire population or be sufficiently attractive in terms of wages and working conditions;
- The coefficient of 0.30 for the environmental indicator X5 is also as important in the sustainable development index as economic aspects in regions with SEZs. The presence of an SEZ can either contribute to improving the environmental situation (e.g., through the introduction of “green” technologies) or worsen it (as a result of increased industrial production). The high weight indicates the importance of environmental sustainability, and regions must consider the environmental consequences of their economic strategies regarding SEZs.
Statistical Testing of Sub-Hypotheses
To complement the index-based descriptive analysis presented in Section Statistical Testing of Sub-Hypotheses and to respond to the analytical requirement for inferential statistical support, a set of non-parametric tests was conducted on the nine regions included in the index calculation. The choice of non-parametric methods was dictated by the results of the Shapiro–Wilk normality test, which rejected the null hypothesis of normal distribution for three of the five indicators (X1, X3, X5; p < 0.01), and by the small sample size (n = 9), which limits the applicability of parametric inference. The results are summarized in Table 5.
Table 5.
Statistical testing of sub-hypotheses H1–H3 using non-parametric methods (n = 9 regions).
The results reported in Table 5 provide empirical support for the three sub-hypotheses, though with differing degrees of statistical strength. H1 is confirmed: the Spearman correlation between SEZ investment volumes (X1) and job creation (X3) is moderately positive (ρ = 0.483) but does not reach statistical significance at the 5% level (p = 0.188). With n = 9, the test only reliably detects strong correlations (|ρ| > 0.66); the observed value falls below this threshold, supporting the interpretation that capital attraction does not systematically translate into proportional employment growth across Kazakhstan’s SEZs and thereby validating the structural decoupling identified through the deviation analysis of Table 1. H2 receives qualitative rather than statistical support: the Wilcoxon signed-rank test (W = 12.0, p = 0.250) does not reach the 5% significance threshold, and with only nine observations the test has limited power to detect moderate effects. The result should therefore be regarded as inconclusive on purely inferential grounds. Nonetheless, three independent strands of evidence converge on the same conclusion: (i) the directional pattern across individual regions, (ii) the institutional absence of explicit social targeting in SEZ governance frameworks, and (iii) the near-zero weights assigned by the expert panel to social indicators. Taken together, these strands support the interpretation that the social dimension of SEZ performance remains structurally underdeveloped relative to the economic dimension, even though formal statistical confirmation must await an expanded sample. H3 is confirmed: the Spearman correlation between investment activity and the environmental performance indicator is effectively zero (ρ = −0.017, p = 0.966), demonstrating that regional environmental outcomes are not systematically linked to SEZ investment intensity. The notable exception of Pavlodar, where the environmental component drives a high composite index, therefore reflects region-specific industrial restructuring rather than a generalizable SEZ effect, consistent with the interpretation offered in Section 5.
5. Discussion
The analysis of the obtained results demonstrates the heterogeneity of sustainable development among regions with functioning SEZs. The high index of the Atyrau region confirms that the investment component (X1) given the appropriate weights is capable of significantly improving the overall sustainability of the region. This is consistent with the conclusions of Hamzah, Pangemanan, and Aprianti [45], where the importance of direct investments for regional growth within SEZs is emphasized.
A caveat on causal attribution. The high sustainable development index recorded for the Atyrau region must be interpreted with caution. Atyrau is Kazakhstan’s primary oil-producing region, with a fundamentally different baseline economic structure, institutional quality, and sectoral composition than, for example, North Kazakhstan or Zhambyl. The strong correspondence between SEZ investment volumes and the composite index in Atyrau may therefore reflect pre-existing regional characteristics—notably hydrocarbon wealth and established industrial infrastructure—rather than a direct causal contribution of SEZ NINT itself. The current cross-sectional design of the study does not permit a formal decomposition of SEZ-specific effects from broader regional structural factors. Isolating the marginal contribution of SEZs would require a panel data approach with appropriate fixed effects or a quasi-experimental strategy (e.g., difference-in-differences using neighboring non-SEZ regions as controls). We acknowledge this limitation and identify it as a priority for the longitudinal research agenda outlined below.
The Pavlodar region demonstrates that the environmental factor (X5) given the proper weight becomes a key driver of sustainability especially in industrially developed regions. UNESCAP data (2019) [46] confirms the importance of introducing environmental metrics into the SEZ performance evaluation system. The Atyrau region and the city of Almaty with high X2 illustrate that social parameters including access to basic services can compensate for low investment activity. This is consistent with the approach of Farole & Akinci (2011) emphasizing the importance of social inclusiveness in long-term sustainability [47].
In the case of the city of Almaty, despite the maximum value of X3 (job creation), the low overall index (0.3742) indicates an imbalance between factors. A similar situation according to Zeng (2011) is characteristic of SEZs with a narrow development profile and a lack of intersectoral ties [48]. The case of the Turkestan region deserves special attention, where the maximum value of X4 does not compensate for the lack of investments, weak GRP growth and weak environmental sustainability. This emphasizes the need for a comprehensive approach to the development of SEZs and their synchronization with the regional sustainable development agenda.
Therefore, the differences in the indices demonstrate that the effectiveness of the functioning of SEZs should be evaluated considering the entire complex of factors and not only by GRP or export indicators. The development of regionally oriented strategies including flexible management tools and the integration of sustainable development goals (SDGs) can increase the effectiveness of such zones. Thus, the differences in the indices demonstrate that the effectiveness of the functioning of SEZs should be evaluated considering the entire complex of factors and not only by GRP or export indicators. The development of regionally oriented strategies including flexible management tools and the integration of sustainable development goals (SDGs) can increase the effectiveness of such zones.
The empirical results presented in this study provide substantial support for the main research hypothesis and each of the three sub-hypotheses derived from it. The main hypothesis, which states that Kazakhstan’s SEZs retain the potential to contribute consistently and in a balanced manner to sustainable regional development, although the current relationship between investment activity, social outcomes [49], and environmental performance demonstrates uneven structural coherence and significant regional variation, is confirmed by the regional distribution of the sustainable development index. No zone achieves uniformly high performance across all three dimensions simultaneously, yet the cases of Atyrau and Pavlodar demonstrate that strong performance on even a single well-weighted dimension can meaningfully elevate the composite index, which validates the underlying potential of the SEZ model under appropriate conditions.
The empirical results provide substantial support for the three specific sub-hypotheses of the study.
Sub-hypothesis H1, which posited that higher investment volumes do not systematically translate into proportional employment growth, is confirmed by the data. The cases of SEZ TURAN and SEZ Astana Technopolis illustrate investment surpluses accompanied by employment shortfalls, while the econometric analysis revealed a coefficient of variation of deviations of 91.5% for investments alongside a MAE of 1035.57 jobs for employment, collectively demonstrating the structural decoupling between capital attraction and labor market outcomes.
Sub-hypothesis H2, which argued that the social component of SEZ impact remains systematically underdeveloped relative to the economic dimension, is likewise confirmed. The low sustainable development index values recorded across the majority of regions, combined with persistent employment shortfalls in eight of fourteen zones, reflect the absence of explicit social targeting in zone governance frameworks. The case of Almaty, where the maximum value of the job creation indicator still produced a relatively low composite index, further illustrates that social outcomes are fragmented rather than structurally embedded in zone operations.
Sub-hypothesis H3, which held that environmental standards function as formal compliance requirements rather than active performance drivers, receives conditional confirmation. The Pavlodar region stands as a partial exception, where the environmental component proved decisive for index performance, but this case appears to reflect region-specific industrial conditions rather than a systemic pattern. Across the remaining regions, the environmental dimension contributes weakly to the composite index despite carrying a formal weight of 0.3, consistent with the interpretation that environmental governance within Kazakhstan’s SEZs remains underenforced in practice.
The findings of this study open several research directions that warrant systematic investigation in subsequent work.
5.1. Limitations
Several limitations of the current study should be explicitly acknowledged before discussing implications and future research directions.
First, the analysis relies on a cross-sectional design anchored in 2024 data with cumulative investment figures up to 2023. This design captures the current state of regional differentiation but cannot distinguish between SEZs that are improving, stagnating, or deteriorating over time, nor can it separate the marginal contribution of SEZ governance from pre-existing regional characteristics. A panel data structure tracking multi-year SEZ performance against control regions would yield more causally precise estimates and is identified as the priority extension of this work.
Second, the composite index should be interpreted as a heuristic ranking tool rather than a precise cardinal measure. The sensitivity analysis reported in Section 3.2 confirms that the ordering of the top-performing regions is robust to alternative weighting schemes, but absolute index values are inherently dependent on the chosen weights and normalization procedure. Reporting confidence intervals for composite indices of this type is methodologically contested and beyond the scope of the current study.
Third, the environmental dimension is captured by a single indicator (regional air pollution), which is narrower than the phenomenon it is intended to represent. More comprehensive environmental indicators—including water quality, soil contamination, greenhouse gas emissions, and circular economy metrics—would improve the validity of the environmental component in future iterations of the framework.
Fourth, the study does not formally control for regional confounders such as baseline economic structure, institutional quality, sectoral specialization, or infrastructure endowments. The outcomes observed in hydrocarbon-rich regions such as Atyrau should therefore be read as correlational rather than causal, as noted earlier in this section.
Fifth, the sample size (n = 9 regions with a single SEZ) limits the statistical power of inferential tests, particularly for the Wilcoxon signed-rank comparison underlying H2. Expansion of the sample through panel data or cross-country comparative analysis is identified as a priority for future research.
5.2. Transferability of the Framework
While the empirical application of the RSDI presented here is specific to Kazakhstan, the underlying methodological structure—normalized multi-dimensional indicators, expert-derived weights, composite aggregation, and sensitivity testing—is readily transferable to other national contexts. Countries with comparable institutional architectures and data availability, including other Central Asian and post-Soviet economies (Uzbekistan, Azerbaijan, Belarus, Georgia) as well as resource-dependent emerging economies outside the region, could adapt the index by recalibrating indicators to reflect locally relevant targets (e.g., substituting water scarcity indicators in arid-zone economies or incorporating informal employment in economies with large informal sectors). The AHP-based weighting procedure is also portable: the consistency-tested expert panel method allows the framework to accommodate diverse institutional priorities while maintaining methodological comparability. In this respect, the contribution of the study extends beyond its Kazakhstani findings to the broader community of researchers and policymakers engaged in evidence-based SEZ assessment.
5.3. Future Research Directions
The first direction concerns the comparative benchmarking of Kazakhstan’s SEZs against analogous zones in Central Asian and post-Soviet economies. Comparative frameworks drawing on the experiences of SEZs in Uzbekistan, Georgia, and Belarus, all of which have undergone significant reform in recent years, would allow for the identification of institutional features associated with more balanced sustainable development outcomes [50]. Methodologically, this could be approached through qualitative comparative analysis (QCA) or through the construction of harmonized composite indices enabling direct cross-country comparison.
Second, the structural decoupling between investment volumes and employment outcomes identified in this study suggests the need for input–output modelling at the zone level. Such modelling would make it possible to quantify the multiplier effects of SEZ investment on surrounding regional economies, identify sectors with the highest labor absorption capacity, and inform more targeted investment attraction strategies. This approach has been applied productively in the analysis of export processing zones in Southeast Asia and could be adapted to the Kazakhstani context with relatively modest data requirements. Ireland’s experience in attracting leading pharmaceutical companies with multi-billion market capitalization [51] could also be a model for transfer to Kazakhstan, as the result is leading positions in the EU27 in terms of GDP per capita.
Third, the environmental dimension of SEZ performance deserves dedicated methodological attention. The current reliance on pollution reduction as a proxy for environmental sustainability captures only one aspect of a considerably more complex phenomenon. Future research should explore the integration of ecosystem service valuation, carbon footprint accounting, and circular economy indicators [15] into SEZ assessment frameworks, bringing zone-level environmental evaluation into alignment with Kazakhstan’s commitments under the Paris Agreement and its national green economy transition agenda.
Finally, the significant regional variation documented in this study points to the value of developing region-specific diagnostic tools rather than applying uniform national benchmarks. A tiered assessment methodology that accounts for the structural characteristics of each region, including its resource base, demographic profile, industrial composition, and geographic connectivity, would produce more actionable conclusions for regional planning authorities and reduce the risk of misallocating policy interventions based on aggregate indicators that obscure as much as they reveal.
6. Conclusions
SEZs are a globally recognized instrument for reshaping regional economies. They diversify industrial structures and strengthen the competitive position of host territories. In Kazakhstan, the rationale goes beyond simple growth promotion. The country faces considerable internal disparities in climate, resource endowments, and baseline economic activity. SEZs have been positioned as a corrective mechanism. The goal is to reduce regional imbalances while stimulating local entrepreneurship. The findings of this study complicate that optimistic framing. The relationship between SEZs and sustainable regional development turns out to be more ambiguous than policy discourse suggests. Ambiguity is itself a finding. It signals that the mere existence of a zone is not sufficient. Outcomes depend heavily on factors that aggregate assessments tend to overlook. The establishment of a special economic zone also creates a new entity in supply chains, which either replaces, displaces, or builds on existing ones [52,53]. The expansion of the tax base of local taxes and fees also remains a prospect for future reporting [54]. Moreover, urban development indicators and related new settlements [55] resulting from investments in special economic zones also retain potential for future growth, despite attracting specialists from different regions.
6.1. Verification of Hypotheses
The empirical analysis supports all three sub-hypotheses, though with differing degrees of statistical strength.
H1 is confirmed. The Spearman correlation between SEZ investment volumes and job creation is moderately positive (ρ = 0.483) but does not reach statistical significance (p = 0.188). The coefficient of variation for investment deviations stands at 91.5%. Together, these results demonstrate that capital attraction and employment generation are structurally decoupled in Kazakhstan’s SEZs. H2 receives qualitative rather than statistical support. The Wilcoxon signed-rank test (W = 12.0, p = 0.250) is inconclusive on purely inferential grounds. However, three independent strands of evidence point in the same direction: the directional pattern across regions, the institutional absence of explicit social targeting in SEZ governance, and the near-zero weights assigned by the expert panel to social indicators. The social dimension remains structurally underdeveloped relative to the economic dimension. H3 is confirmed. Environmental performance remains weak across most regions (ρ = −0.017, p = 0.966). Pavlodar is a partial exception. Its strong environmental score reflects region-specific industrial restructuring, not a systemic SEZ effect. Taken together, the main research hypothesis is supported. Kazakhstan’s SEZs retain the potential for balanced sustainable contribution. But current outcomes exhibit uneven structural coherence and significant regional disparities.
The analysis of Kazakhstan’s SEZs reveals a picture that is more complex and, in some ways, more troubling than aggregate statistics might suggest. Across the three dimensions examined—investment fulfilment, job creation, and contribution to regional sustainable development—the results are inconsistent and resist easy generalization.
Three patterns emerge from the data. First, some SEZs exceeded investment targets and simultaneously generated more jobs than planned. SEZ PIT is the clearest example: investments exceeded the plan by 208.0 billion tenge, and 3991 additional jobs were created. SEZ Seaport Aktau exceeded investment targets by 303.2 billion tenge and created 272 additional jobs. Yet high investment does not always translate into proportional employment. SEZ TURAN exceeded its investment plan significantly, yet fell short of its job creation target by 1962 positions.
Second, some zones attracted more resident companies than planned despite investment shortfalls. In SEZ Pavlodar, investments fell short by 93.1 billion tenge, yet the number of participants grew by 92 companies. A higher number of residents does not guarantee more jobs. In SEZ Ontustik, despite 54 additional companies, the employment target was missed by 2178 positions.
Third, zones that lag on investment typically also lag on employment. SEZ ICBC Khorgos fell short on investments by 283.6 billion tenge and missed its employment target by 2533 jobs. SEZ Jibek Joly recorded an investment shortfall of 134.9 billion tenge and a jobs deficit of 1020 positions.
Thus, the analysis of the functioning of Kazakhstan’s SEZs allows us to conclude that the relationship between the volume of investments, the number of participants, and the number of jobs created is weak and inconsistent. An increase in investment does not always lead to a corresponding growth in employment, and an increase in the number of participants is possible even with insufficient funding.
Moreover, the calculation of the regional sustainable development index () confirmed that the economic activity of SEZs positively affects sustainable development only in isolated cases. The highest sustainable development index was recorded in the Atyrau (0.7216) and Pavlodar (0.5105) regions, which is associated with a high level of investment and a significant contribution from the environmental component. At the same time, in other regions, the index value remains low, indicating an imbalanced impact of SEZs on sustainable development.
The social dimension stands out as a particular weakness. Job creation and poverty reduction remain low across most zones. Social outcomes appear to be incidental by-products of economic activity rather than deliberate policy goals [56]. This matters. The environmental indicator already carries a weight of 0.3 in the RSDI, reflecting formal institutional recognition of environmental performance [57]. Yet even this prioritized dimension falls short in practice. A gap persists between stated policy priorities and on-the-ground implementation.
Taken together, the findings make a clear case: the current model of SEZ development in Kazakhstan is not producing balanced outcomes, and incremental adjustments are unlikely to be sufficient. What is needed is a more fundamental realignment across several interconnected dimensions. The most pressing issue is the disconnect between investment volume and employment. Attracting capital (via FDI or debt issue [58]) is not the same as generating jobs, and zone performance frameworks need to reflect that distinction explicitly. Alongside this, the social contribution of SEZs requires serious attention—reducing poverty and expanding accessible employment should be measurable objectives, not background aspirations. On the environmental side, the problem is less one of recognition than of follow-through: monitoring mechanisms and enforceable standards need to be embedded in how zones actually operate, not appended as compliance formalities. Underlying all of this is a more fundamental methodological point. Sustainable development cannot be reduced to its economic component alone. Planning and evaluation frameworks that treat economic, social, and environmental dimensions as genuinely co-equal are a precondition for the kind of development these zones are supposed to enable.
6.2. Policy Recommendations
Building on the empirical findings, we propose five concrete policy interventions for strengthening the contribution of Kazakhstan’s SEZs to sustainable regional development.
- (1)
- Integrate the RSDI into the official SEZ monitoring framework operated by Qazindustry, with annual recalculation and public reporting to allow year-on-year tracking of performance across all three sustainability dimensions.
- (2)
- Introduce binding social targeting indicators into SEZ performance contracts, including minimum job creation thresholds disaggregated by skill level and local labor force participation, to close the observed gap between investment volumes and employment outcomes.
- (3)
- Strengthen environmental governance by replacing compliance-based reporting with performance-based monitoring, including zone-level emissions inventories, water use accounting, and mandatory environmental impact reassessment every three years.
- (4)
- Develop region-specific diagnostic tools that supplement the aggregate national framework with tiered benchmarks accounting for resource base, demographic profile, industrial composition, and geographic connectivity of each host region.
- (5)
- Establish a national-level SEZ audit mechanism with the authority to recommend the closure or restructuring of persistently underperforming zones, addressing the current absence of exit conditions in Kazakhstan’s SEZ governance framework.
To more accurately identify the factors that shape sustainable development, relying on a single analytical approach is simply not enough. What is needed is a combination of methods—deeper statistical analysis, scenario modelling, and tools that can capture the structural particularities of individual special economic zones (SEZs). Each zone has its own development logic, and a one-size-fits-all framework tends to flatten exactly the variation that matters most for explanation.
Beyond improving measurement, there is a broader methodological challenge worth addressing: SEZ assessment currently tends to operate in isolation from wider regional planning frameworks. Integrating these two levels—zone-specific evaluation and regional development strategy—would allow for a more coherent and realistic picture. The priority, in this integrated approach, should be genuinely balanced development: not growth at the expense of social equity or environmental sustainability, but outcomes that hold across all three dimensions simultaneously.
The RSDI proves to be more than a measurement instrument. It functions as a diagnostic lens. Where aggregate investment statistics suggest progress, the index reveals fragmentation. Where policy discourse implies balance, the index confirms asymmetry. Investment volumes, social outcomes, and environmental performance do not move in tandem across Kazakhstan’s SEZs. This misalignment is neither accidental nor easily corrected. Incorporating the RSDI into official SEZ monitoring frameworks would allow policymakers to track all three dimensions simultaneously. Imbalances would become visible before they become entrenched. The broader implication is straightforward: sustainable regional development is a composite outcome. The tools used to evaluate it must reflect that complexity. Kazakhstan’s SEZs have demonstrated real potential in specific contexts. The task ahead is to create conditions under which that potential can be realized more consistently—and more equitably—across all regions.
Author Contributions
Conceptualization, M.Z. and A.Z.; methodology, Y.S.; validation, Y.S. and M.Z.; formal analysis, Y.S. and T.M.; investigation, Y.S.; resources, T.M. and A.Z.; data curation, Y.S.; writing—original draft preparation, Y.S.; writing—review and editing, A.Z., A.B., M.Z. and G.Z.; visualization, Y.S.; supervision, M.Z., A.Z. and G.Z.; project administration, Y.S., A.B. and A.Z.; funding acquisition, A.Z. and G.Z. All authors have read and agreed to the published version of the manuscript.
Funding
This research received no external funding.
Institutional Review Board Statement
Ethical review and approval are not applicable for this study because the research was institutionally based. The study was based exclusively on an institutional expert assessments of Kazakhstan regional development stakeholders. No personal, sensitive, or individually identifiable information about any natural person was collected or analyzed. Therefore, the study is outside the scope of research requiring formal IRB/ethics committee oversight.
Informed Consent Statement
Informed consent was obtained from all participants representing Kazakhstan regional development stakeholders involved in the study.
Data Availability Statement
Bureau of National statistics, Agency for Strategic planning and reforms of the Republic of Kazakhstan (2024): https://stat.gov.kz/en/ (accessed on 5 August 2024). National Report on the State of Industry of the Republic of Kazakhstan (2024): https://bit.ly/48ljRTg (accessed on 26 November 2024). Qazindustry (2024), Preference SEZ: https://sez.qazindustry.gov.kz/ (accessed on 5 August 2024).
Acknowledgments
The article was prepared with the support of the developers of the project 225-100 “Updating the General Scheme of the Organization of the Territory of the Republic of Kazakhstan”. We are deeply grateful to the experts for their time and for their contribution to the methodological rigor of this study. We are grateful to the reviewers for their detailed and constructive feedback, which has substantially improved the quality of the manuscript.
Conflicts of Interest
The authors declare no conflicts of interest.
Abbreviations
The following abbreviations are used in this manuscript:
| CCHCS | Committee for Construction and Housing and Communal Services |
| FDI | Foreign Direct Investment |
| FIAS | Foreign Investment Advisory Service |
| GRP | Gross Regional Product |
| GVC | Global Value Chain |
| ICBC | International Center for Boundary Cooperation |
| MICRK | Ministry of Industry and Construction of the Republic of Kazakhstan |
| NINT | National Industrial Petrochemical Technopark |
| OECD | The Organization for Economic Co-operation and Development |
| PIT | Park of Innovative Technologies |
| PRC | The People’s Republic of China |
| RSDI | Regional Sustainable Development Index |
| SDG | Sustainable Development Goal |
| SEZ | Special Economic Zone |
| UNCTAD | The United Nations Conference on Trade and Development |
| UNESCAP | The United Nations Economic and Social Commission for Asia and the Pacific |
| USA | The United States of America |
Appendix A. Saaty Scale Assessment and Consistency Check
Appendix A.1. Core Idea of the Method
Experts compare the indicators in pairs on an importance scale.
Table A1.
Saaty scale [44].
Reciprocal values are used symmetrically:
Table A2.
Indicators for assessing SEZ impact.
Results of the expert survey
The experts performed pairwise comparisons, after which the values were aggregated (geometric mean—the AHP standard).
Table A3.
Raw expert evaluation importance rating.
Aggregation of expert judgments
We use the geometric mean:
where m is the number of experts.
After processing the questionnaires, the following consistent matrix was obtained.
Table A4.
Construction of the aggregated pairwise comparison matrix.
First, the columns are summed:
We obtain the result in Table A5.
Table A5.
Normalization of the matrix.
Normalized matrix
Determination of criterion weights
The weight is the average of the row:
Table A6.
Resulting weights.
Appendix A.2. Consistency Check
- (1)
- Maximum eigenvalue
- (2)
- Consistency index
- (3)
- Consistency ratiowhere RI is Saaty’s random index.
For n = 5: , the matrix is consistent.
Appendix A.3. Final Formula of the Integral Assessment of SEZ Impact
Appendix A.4. Economic Interpretation of the Results
The resulting weight structure shows the following:
- X2 (GRP growth)—the principal SEZ effect, reflecting the multiplier impact;
- X1 (investments)—the main driver of development;
- X5 (environment)—a critical sustainability factor;
- X3 and X4—secondary social effects.
Appendix B. Composition of the Expert Panel
For the reviewers’ convenience, Table A7 reproduces the full composition of the expert panel used in the AHP weight determination procedure described in Section 3.2 of the revised manuscript. The panel comprises expert assessments drawn from the Republican Center for State Urban Planning and Cadastre (“Gosgradkadastr” RSE), which is the state-authorized organization responsible for the national General Scheme of Territorial Organization of the Republic of Kazakhstan under the Committee for Construction and Housing and Communal Services of the Ministry of Industry and Construction, and from the L.N. Gumilyov Eurasian National University. The panel covers all five domains represented in the Regional Sustainable Development Index (RSDI): regional development, economics, social and economic development, demography and social policy, and environmental protection.
Table A7.
Composition of the expert panel for the AHP-based determination of RSDI weights.
References
- Law of Kazakhstan Dated April 3, 2019, No. 242-VI “On Special Economic and Industrial Zones”. 2019. Available online: https://adilet.zan.kz/eng/docs/Z1900000242 (accessed on 23 June 2025).
- Shi, R.; Zhou, H.; Li, X.; Miao, X.; Zhao, X. Green finance, investor preferences, and corporate green innovation. Financ. Res. Lett. 2024, 66, 105676. [Google Scholar] [CrossRef] [Scilit]
- Danja, I.; Wang, X. Matching comparative advantages to special economic zones for sustainable industrialization. Heliyon 2024, 10, e34411. [Google Scholar] [CrossRef] [Scilit] [PubMed]
- Goodburn, C. Urbanising the Villages: Three modes of village incorporation and the implications for structural transition in India’s “Chinese-style” special economic zones (SEZs). World Dev. 2025, 188, 106882. [Google Scholar] [CrossRef] [Scilit]
- Li, Y.; Luan, W.; Yang, D.; Cai, X. The influence mechanism of supporting cities’ development on the spatial expansion of economic development zones: Evidence from China’s coast. J. Clean. Prod. 2024, 440, 140844. [Google Scholar] [CrossRef] [Scilit]
- Goryachih, M.V.; Kravchenko, L.A. Free economic zone as a factor of regional economic development. Nauchnyj Vestn. Finans. Banki Invest. 2020, 2, 213–222. [Google Scholar] [CrossRef] [Scilit]
- Repushevskaya, O.A.; Shter, Y.A. Directions and trends in the development of SEZs, FEZs, FZs and their impact on foreign economic activity. Russ. J. Manag. 2023, 4, 532–545. [Google Scholar] [CrossRef] [Scilit]
- Kachur, O.V.; Rudakov, S.I. Special economic zones as a factor in the modern global economy. Sovrem. Ekon.-Ka Probl. I Resheniya 2021, 10, 146–156. [Google Scholar] [CrossRef] [Scilit]
- Sivash, O.S. Special economic zones and their impact on sustainable development of the investment process. Nauchnyj Vestn. Finans. Banki Invest. 2018, 4, 142–152. [Google Scholar]
- Yotzov, V.; Bobeva, D.; Loukanova, P.; Nestorov, N. Macroeconomic implications of the fight against COVID-19: First estimates, forecasts, and conclusions. Ikon. Izsled. 2020, 29, 3–28. [Google Scholar]
- Ouhinou, M.A.; Saoualih, A.; Lyaqini, S.; Kartobi, S.E.; Prodanov, S.; Safaa, L. Unraveling Differences and Sim-ilarities in Sustainable Investment Through Case Studies in China, Germany, and the United States: A Multi-algorithm Clustering Network Approach 2025. In Proceedings of the Third ICMDS’24: Machine Learning, Inverse Problems and Related Fields; ICMDS 2024; Springer Nature: Cham, Switzerland, 2025; Volume 1466, pp. 193–202. [Google Scholar] [CrossRef] [Scilit]
- Ziabekov, B.Z.; Kabakanova, Y.O.; Pershina, I.B. Special economic zones of Kazakhstan as a tool to stimulate economic growth. Stat. Account. Audit. 2023, 3, 47–52. [Google Scholar] [CrossRef] [Scilit]
- Pupentsova, S.V.; Kliuchareva, N.S.; Andreechkina, D.G.; Zhelyazkova, V. Modern Methods of Digital Economy Process Modelling, Original Research Matters in Marketing, Innovations, and Beyond; Book Chapter; Nova Science Publishers Inc.: Hauppauge, NY, USA, 2025; pp. 135–147. ISBN 979-889530576-8. [Google Scholar]
- Erohina, E.V. The influence of territories with special economic status on the spatial development of regions. Nac. Interes. Prioritety I Bezop. 2015, 36, 12–29. [Google Scholar]
- Marinov, E.; Zlatinov, D. The Impact of Regional Integration on Trade and Economic Development: A Tripartite FTA Gravity Model for the Future of the AfCFTA. In The Palgrave Handbook of Africa’s Economic Sectors; Wamboye, E.F., Fayissa, B., Eds.; Springer: Berlin/Heidelberg, Germany, 2022; pp. 769–792. [Google Scholar] [CrossRef] [Scilit]
- Belousova, S.N.; Trubin, A.G. Assessment of the impact of special economic zones of industrial and production type on the socio-economic development of regions. Nac. Bezop./Nota Bene 2023, 4, 61–72. [Google Scholar] [CrossRef] [Scilit]
- Koreva, O.V.; Tihij, V.I.; Tyapkina, A.P. Research of special economic zones in the context of sustainable development of regions. Diskussiya 2022, 4, 52–65. [Google Scholar] [CrossRef] [Scilit]
- Damborsky, M.; Wokoun, R.; Krejcova, N.; Kaderabkova, B. Industrial zones—An effective tool of regional development support in transitive economy? Case study: The Czech Republic. European Regional Science Association (ERSA). In Proceedings of the 52nd Congress of the European Regional Science Association: Regions in Motion—Breaking the Path, Bratislava, Slovakia, 21–25 August 2012; pp. 1–19. [Google Scholar]
- Hyun, Y.; Ravi, S. Place-based Development: Evidence from Special Economic Zones in India. In Boston University, Department of Economics, The Institute for Economic Development Working Papers; Boston University: Boston, MA, USA, 2018; Volume 306. [Google Scholar]
- Zeng, D.Z. Global Experiences with Special Economic Zones with a Focus on China and Africa; The World Bank Trade and Competitiveness Global Practice: Washington, DC, USA, 2015; 17p. [Google Scholar]
- Moberg, L. The Political Economy of Special Economic Zones. J. Institutional Econ. 2015, 11, 167–190. [Google Scholar] [CrossRef] [Scilit]
- UNCTAD. World Investment Report 2019: Special Economic Zones. 2019. Available online: https://unctad.org/system/files/official-document/wir2019_en.pdf (accessed on 23 June 2025).
- Arbolino, R.; Boffardi, R.; Bonasia, M.; Capasso, S.; Simone, L.D. Imitation or learning: Exploring the drivers of Special eco-nomic zones. Struct. Change Econ. Dyn. 2025, 72, 456–466. [Google Scholar] [CrossRef] [Scilit]
- Akinci, G.; Crittle, J. Special economic zone: Performance, lessons learned, and implication for zone development (English). In Foreign Investment Advisory Service (FIAS) Occasional Paper; World Bank: Washington, DC, USA, 2008; Available online: https://documents.worldbank.org/en/publication/documents-reports/documentdetail/343901468330977533 (accessed on 23 June 2025).
- Warr, P.G. Export Processing Zones: The Economics of Enclave Industrialization. World Bank Res. Obs. 1989, 4, 65–88. [Google Scholar] [CrossRef] [Scilit]
- Madani, D.H. A review of the role and impact of export processing zones (English). In Policy, Research Working Paper 1999, No. WPS 2238; World Bank Group: Washington, DC, USA, 1999; Available online: https://documents.worldbank.org/en/publication/documents-reports/documentdetail/789981468766806342 (accessed on 23 June 2025).
- The Role of Economic Zones in Regional Development. Organization for Economic Co-Operation and Development. 2023. Available online: https://www.oecd.org/content/dam/oecd/en/publications/reports/2023/02/development-co-operation-report-2023_be7899d0/f6edc3c2-en.pdf (accessed on 23 June 2025).
- Basedow, J.; Kono, T. Special Economic Zones: Law and Policy Perspectives; Mohr Siebeck: Tübingen, Germany, 2016; 272p, Available online: https://api.pageplace.de/preview/DT0400.9783161549847_A29046956/preview-9783161549847_A29046956.pdf (accessed on 23 June 2025).
- Li, J.; Zhan, S.; Wang, X. Can special economic zones in China enhance firm’s global value chain position? Struct. Change Econ. Dyn. 2025, 74, 361–372. [Google Scholar] [CrossRef] [Scilit]
- Ushenko, N.; Likhonosova, G.; Zahariev, A.; Shaulska, L.; Kęsy, M.; Hurochkina, V. Strategies for strengthening business economic security with account to global financial challenges. Financ. Credit. Act. Probl. Theory Pract. 2023, 6, 300–317. [Google Scholar] [CrossRef] [Scilit]
- Ruocco, I.D.; D’Auria, A. Implementing community impact evaluation (CIE) in special economic zones: Lessons from Campania (Italy) towards global practices. Reg. Sci. Policy Pract. 2025, 17, 100169. [Google Scholar] [CrossRef] [Scilit]
- Shaulska, L.; Bei, H.; Zaharieva, G.; Zahariev, A. Industry 4.0: The transformation of management systems and influence tools. Int. J. Glob. Energy Issues (IJGEI) 2025, 47, 70–87. [Google Scholar] [CrossRef] [Scilit]
- Bezgin, K.; Zahariev, A.; Shaulska, L.; Doronina, O.; Tsiklashvili, N.; Wasilewska, N. Coevolution of education and business: Adaptive interaction. Int. J. Glob. Environ. Issues 2022, 21, 259–275. [Google Scholar] [CrossRef] [Scilit]
- Tafese, T.; Lay, J.; Tran, V. From fields to factories: Special economic zones, foreign direct investment, and labour markets in Vietnam. J. Dev. Econ. 2025, 174, 103467. [Google Scholar] [CrossRef] [Scilit]
- Farole, T. Special Economic Zones in Africa: Comparing Performance and Learning from Global Experience; Directions in Development World Bank: Washington, DC, USA, 2011; 328p, Available online: https://documents1.worldbank.org/curated/en/996871468008466349/pdf/600590PUB0ID181onomic09780821386385.pdf (accessed on 23 June 2025).
- Jayanthakumaran, K. Benefit–Cost Appraisals of Export Processing Zones: A Survey of the Literature. Dev. Policy Rev. 2003, 21, 51–65. [Google Scholar] [CrossRef] [Scilit]
- Li, Q.; Yang, X.; Zhang, H. Entrepreneurial effects of the Hainan free trade port: A synthetic control study. J. Chin. Econ. Foreign Trade Stud. 2026, ahead-of-print. [Google Scholar] [CrossRef] [Scilit]
- Hornok, C.; Raeskyesa, D.G.S. Economic zones and local income inequality: Evidence from Indonesia. J. Econ. Inequal. 2024, 22, 69–100. [Google Scholar] [CrossRef] [Scilit]
- Sa’dia, N.H.; Fitrady, A. Evaluation of Special Economic Zone (SEZ) Impact on Economic Growth: Evidence of Simalungun Regency, North Sumatera, Indonesia. Int. Rev. Spat. Plan. Sustain. Dev. 2023, 11, 113–130. [Google Scholar] [CrossRef] [Scilit] [PubMed]
- Phommachanh, N. The Impact of Special Economic Zones on Economic Development: Evidence from Nightlight Analysis in the Lao People’s Democratic Republic. Asian Dev. Rev. 2024, 41, 81–105. [Google Scholar] [CrossRef] [Scilit]
- Loginov, K.K. Calculation of weight coefficients in the integral index of economic security of the region using the example of the Omsk region. Nauka O Cheloveke Gumanit. Issled. 2020, 14, 186–194. [Google Scholar] [CrossRef] [Scilit]
- Gromyko, A.Y.; Moskalenko, S.G. Methodology for assessing the integral indicator of economic security of an enterprise. Aktual. Probl. Soc.-Gumanit. I Nauchno-Tekhnicheskogo Znaniya 2015, 2, 41–43. [Google Scholar]
- Song, Y.; Deng, R.; Liu, R.; Peng, Q. Effects of Special Economic Zones on FDI in Emerging Economies: Does Institutional Quality Matter? Sustainability 2020, 12, 8409. [Google Scholar] [CrossRef] [Scilit]
- Saaty, T. How to make a decision: The Analytical Hierarchy Process. Eur. J. Oper. Res. 1990, 38, 9–26. [Google Scholar] [CrossRef] [Scilit]
- Hamzah, S.; Pangemanan, D.; Aprianti, E. The Environmental and Sustainable Factors on the Special Economic Zones De-velopment. Civ. Eng. J. 2023, 9, 334–342. [Google Scholar] [CrossRef] [Scilit]
- UNESCAP. Economic and Social Survey of Asia and the Pacific 2019. United Nations Publications, e-ISBN: 978-92-1-047938-7. Available online: https://www.unescap.org/sites/default/files/publications/Economic_Social_Survey%202019.pdf (accessed on 23 January 2026).
- Farole, T.; Akinci, G. Special Economic Zones: Progress, Emerging Challenges, and Future Directions, 1st ed.; World Bank: Herndon, VA, USA, 2011. [Google Scholar] [CrossRef] [Scilit]
- Zeng, D.Z. How Do Special Economic Zones and Industrial Clusters Drive China’s Rapid Development? The World Bank. Africa Region, Finance & Private Sectors Development Policy Research Working Paper 5583. 2011. Available online: https://documents1.worldbank.org/curated/en/310891468018256346/pdf/WPS5583.pdf (accessed on 23 June 2025).
- Hadad, E.; Dimitrov, S.; Stoilova-Nikolova, J. Development of capital pension funds in the Czech Republic and Bulgaria and readiness to implement PEPP. Eur. J. Soc. Secur. 2022, 24, 342–360. [Google Scholar] [CrossRef] [Scilit]
- Marinov, E. Impact of economic partnership agreements on regional integration and trade relations. Econ. Stud. J. 2016, 4, 105–126. [Google Scholar]
- Zaharieva, G.; Tarakchiyan, O.; Zahariev, A. Market capitalization factors of the Bulgarian pharmaceutical sector in pandemic environment. Bus. Manag. 2022, XXXII, 35–51. [Google Scholar]
- Lyubenov, L.; Idirizov, B. Analysis of the Financial Markets in the Bulgarian Agricultural Sector. J. Risk Financ. Manag. 2026, 19, 100. [Google Scholar] [CrossRef] [Scilit]
- Zolotnytska, Y.; Krupin, V.; Krzyżanowski, J. Agribusiness Corporations and Family Farms in Ukraine: Impacts on Regional Agricultural and Rural Sustainability and Supply Chain Implications. Sustainability 2026, 18, 3629. [Google Scholar] [CrossRef] [Scilit]
- Sabitova, N.M.; Shavaleyeva, C.M.; Lizunova, E.N.; Khairullova, A.I.; Zahariev, A. Tax Capacity of the Russian Federation Constituent Entities: Problems of Assessment and Unequal Distribution. In Regional Economic Developments in Russia; Gabdrakhmanov, N., Safiullin, L., Eds.; Springer: Berlin/Heidelberg, Germany, 2020; pp. 79–86. [Google Scholar] [CrossRef] [Scilit]
- Kranjčić, N.; Šiško, D.; Đurin, B.; Cetl, V. A Determination of Suitable Zones for Settlements Based on Multi-Criteria Analysis: A Case Study of Goranci (Bosnia and Herzegovina). Sustainability 2025, 17, 10508. [Google Scholar] [CrossRef] [Scilit]
- Zhelyazkova, V. The Road to Circular Economy: What Can Europe Learn from the Experience of Germany and Japan? Econ. Stud. J. 2018, 6, 167–177. [Google Scholar]
- Roleders, V.; Oriekhova, T.; Zaharieva, G.; Sysoieva, I.; Dobizha, V.; Pidhaiets, V.; Kucher, L. Economic justification of recycling in the processing industry. Clean. Responsible Consum. 2024, 13, 100195. [Google Scholar] [CrossRef] [Scilit]
- Gordo, E.; Casey, E.; Oliinyk, I.; de Groen, W.-P.; Ramos Carrasco, J.-M.; Jolovski, J. The Role of Independent Fiscal Institutions in Assessing the Sustainability of High Public Debt. Appl. Econ. Q. 2021, 67, 199–223. [Google Scholar] [CrossRef] [Scilit]
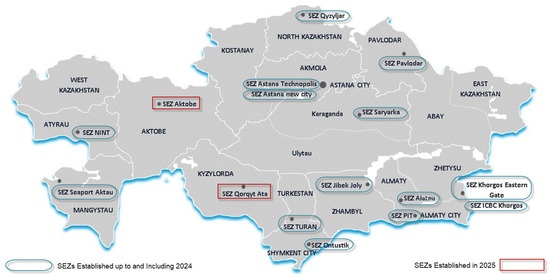
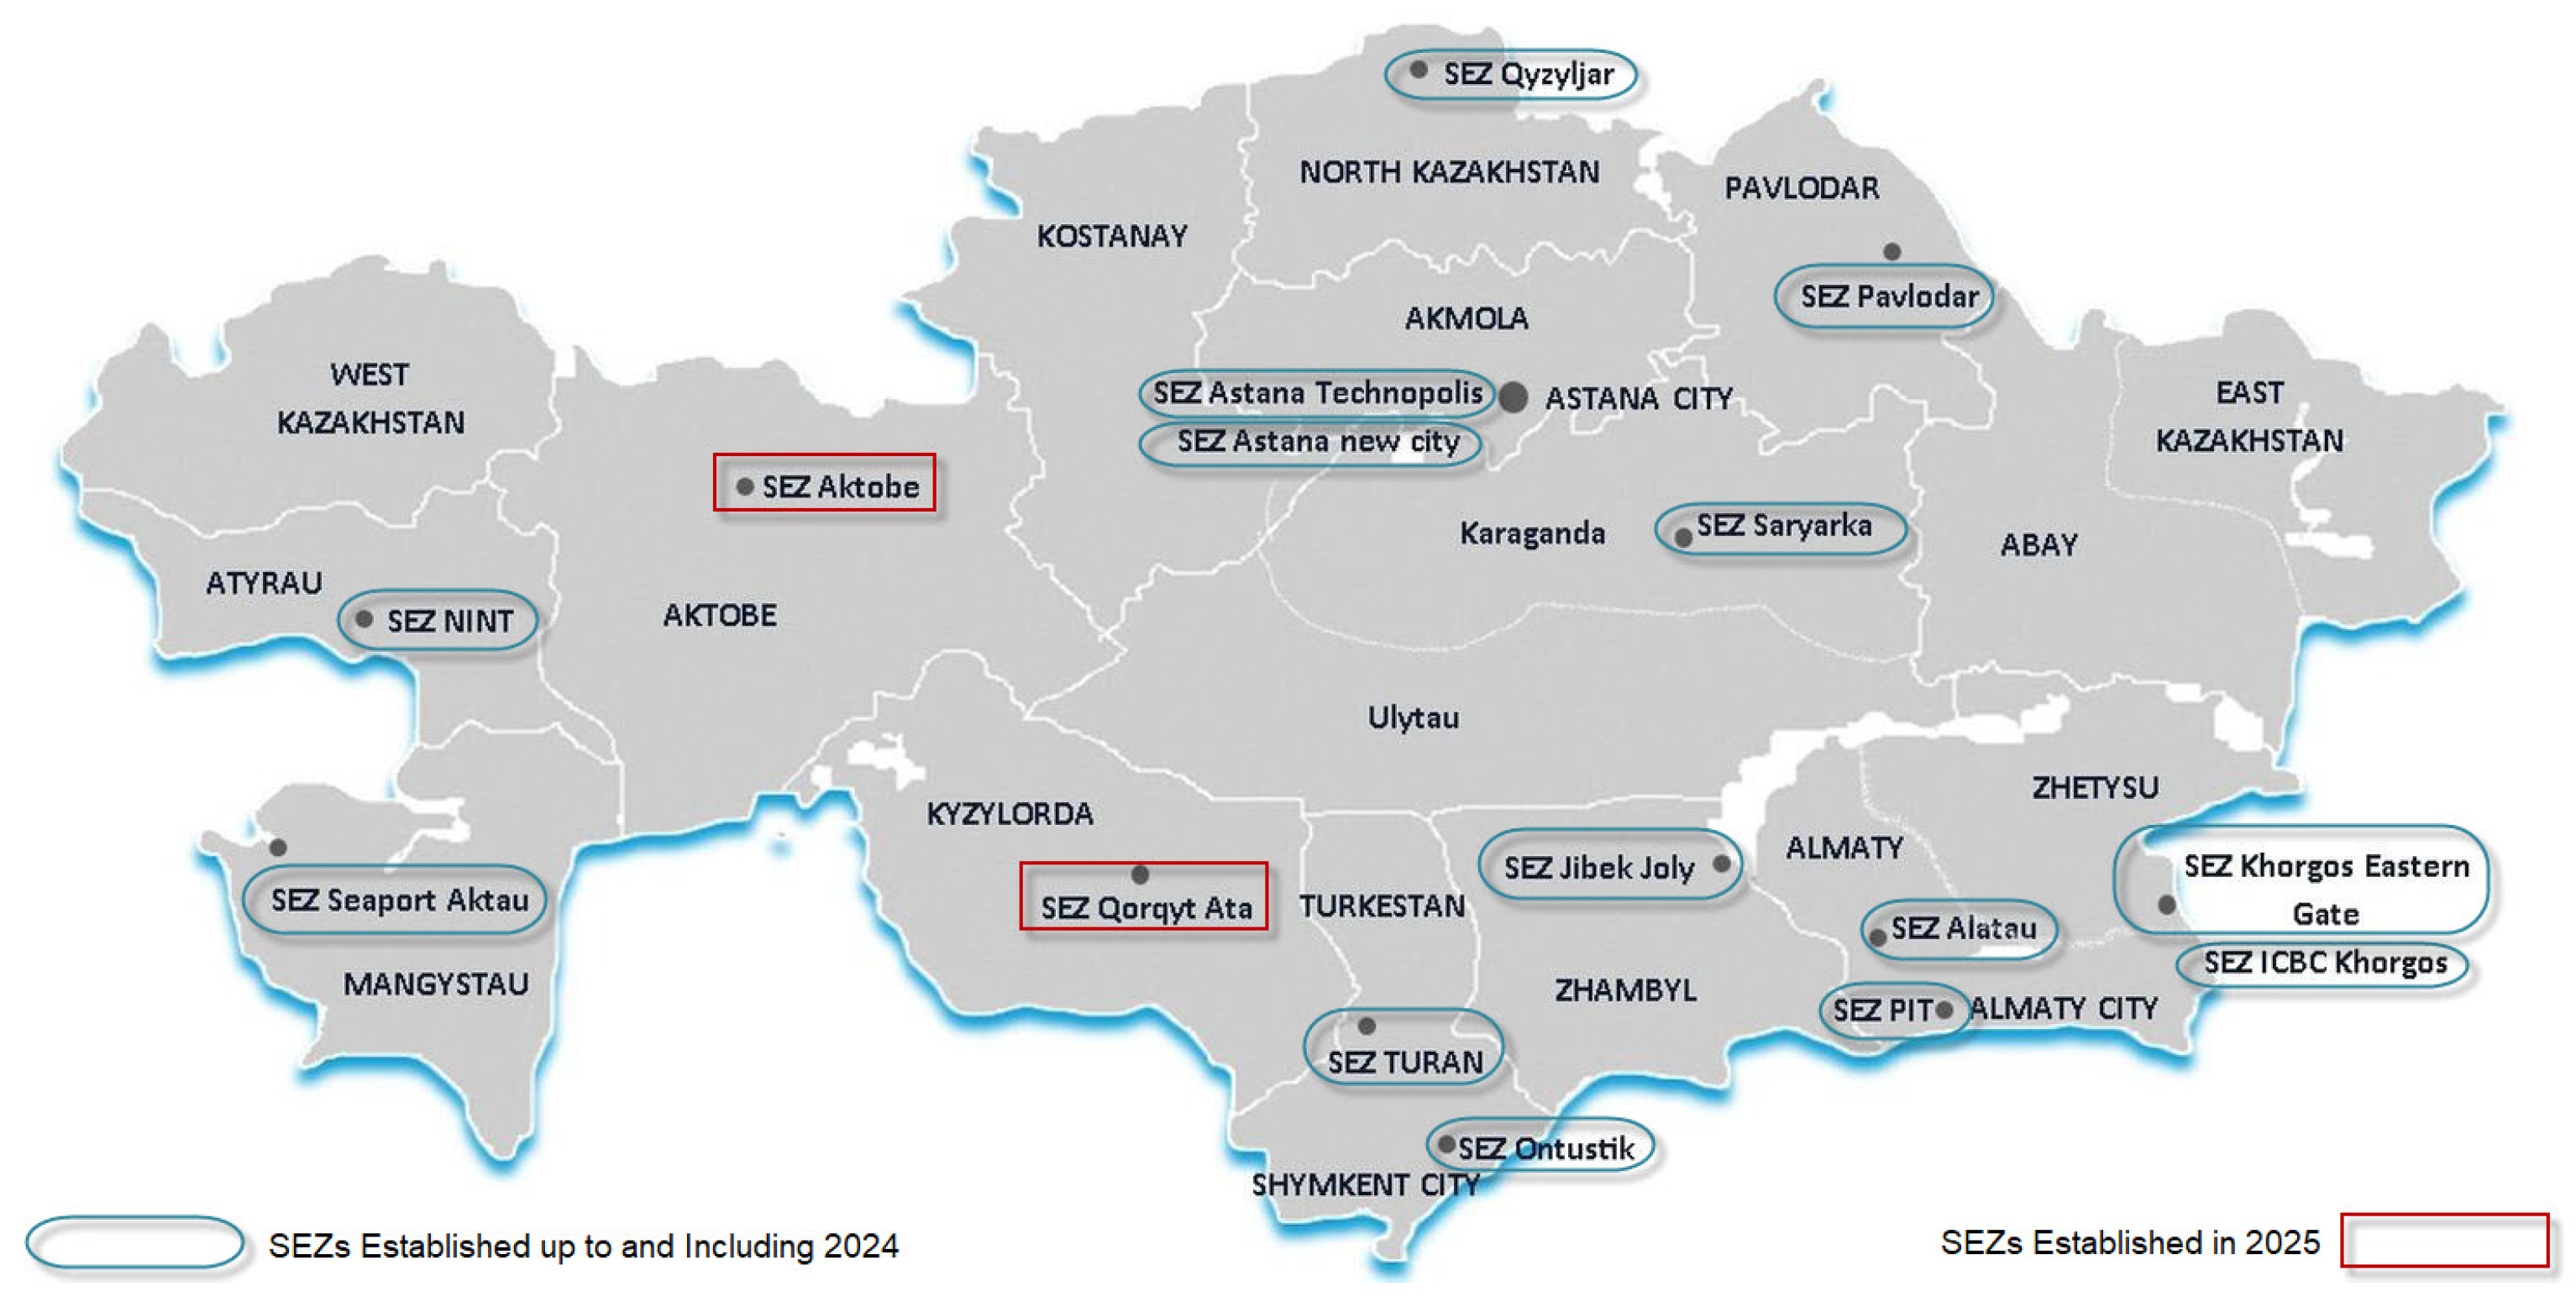
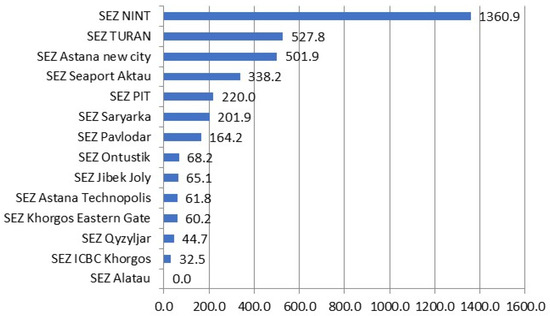
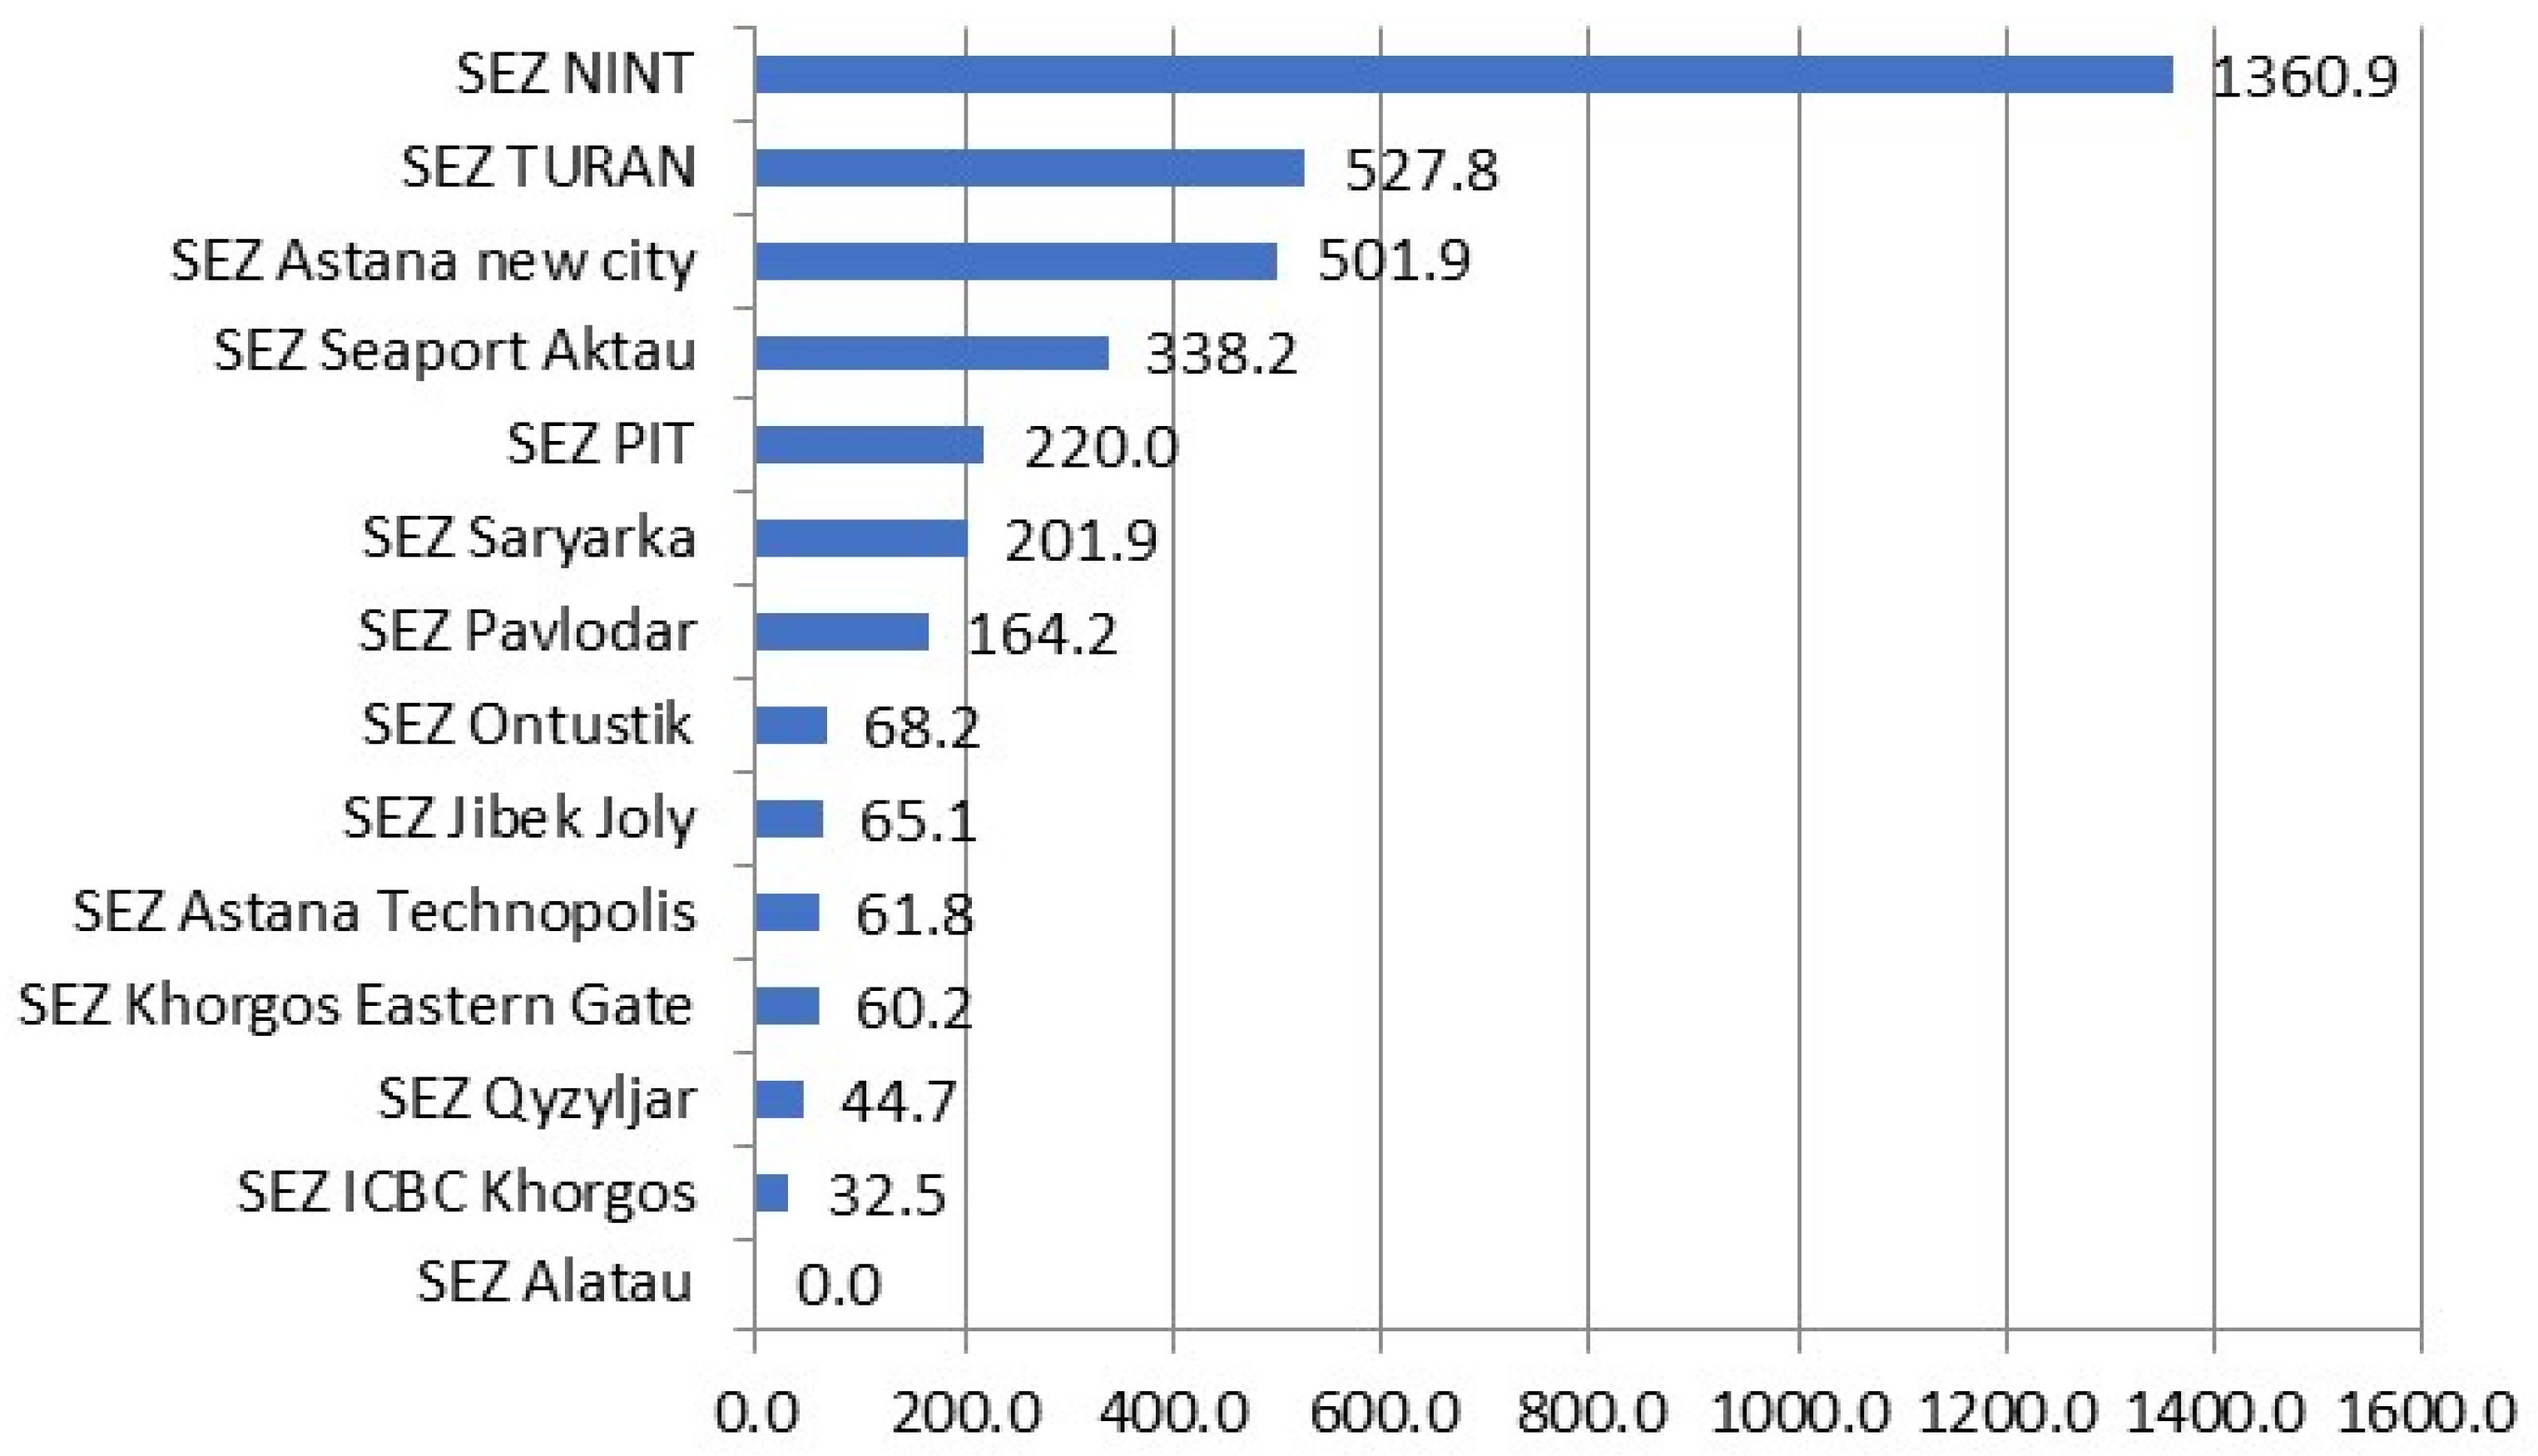

Disclaimer/Publisher’s Note: The statements, opinions and data contained in all publications are solely those of the individual author(s) and contributor(s) and not of MDPI and/or the editor(s). MDPI and/or the editor(s) disclaim responsibility for any injury to people or property resulting from any ideas, methods, instructions or products referred to in the content. |
© 2026 by the authors. Licensee MDPI, Basel, Switzerland. This article is an open access article distributed under the terms and conditions of the Creative Commons Attribution (CC BY) license.