


Abstract
This study examines the evolving structural relationship between capital networks and technological trajectories in China’s artificial intelligence (AI) industry from 2018 to 2023. Using a network-based analytical framework, we integrate venture capital co-investment data with patent-text semantic similarity measures to assess the structural association between financial connectivity and technological distribution patterns. Technological diversity is quantified using text-embedding techniques and Shannon entropy, while Quadratic Assignment Procedure (QAP) models are employed to evaluate inter-network alignment between capital ties and technological similarity. The results indicate a progressively strengthened capital–technology coupling accompanied by increasing technological convergence within the industrial network. Robustness checks across multiple similarity thresholds confirm the stability of these structural associations. Quadrant-based analysis identifies a persistent asymmetry between technologically distinctive but financially peripheral firms and highly central yet technologically homogeneous actors. Robustness analysis further suggests a “robust yet fragile” network configuration characterized by resilience to random disturbances but vulnerability to hub-targeted shocks. Collectively, the findings illuminate the structural implications of capital–technology interdependence for industrial sustainability. From a sustainability perspective, maintaining structural diversity alongside capital coordination is essential for preserving adaptive capacity in rapidly evolving innovation ecosystems. Excessive alignment between financial networks and dominant technological paradigms may enhance short-term efficiency but constrain long-term evolutionary flexibility.
1. Introduction
In the contemporary digital economy, artificial intelligence (AI), as a representative general-purpose technology, exhibits a distinct pattern of co-evolution with financial capital. The trajectory of the AI industry is shaped not only by the internal dynamics of technological paradigms but also by the resource allocation functions of financial capital [1]. Capital provides essential liquidity to firms while influencing the direction of technological evolution through information signaling and network coordination mechanisms. In recent years, China’s AI sector has experienced a transition from diversified technological exploration toward increasing structural convergence [2]. Against this backdrop, it becomes important to examine how the structural characteristics of capital networks shape the distribution of technological activities and what implications this coupling may have for long-term industrial sustainability.
Evolutionary economics conceptualizes industrial change as a dynamic process of technological variation, selection, and retention. Existing studies have primarily examined either the scale effects of financial development [3,4], or the endogenous evolution of technological trajectories [5,6]. As technological paradigms become increasingly complex, research attention has shifted toward the co-evolutionary “finance–technology” framework [7,8]. Capital networks formed through syndication often display small-world properties [9] which may influence firms’ technological search boundaries and strategic positioning, potentially contributing to industry-level convergence dynamics. However, these studies tend to see capital and technology as running in parallel, not as systems that are structurally coupled. So, they leave a key question largely unanswered: how does the topology of capital networks influence technological diversity across different levels, and through that, affect long-term industrial resilience?
Despite these advances, ambiguity remains regarding how industrial sustainability should be conceptualized and empirically assessed in the context of capital–technology interdependence. This study distinguishes between two interrelated yet potentially conflicting dimensions: robustness and adaptability. Robustness refers to the system’s ability to maintain performance stability within established technological paradigms, operationalized here through network attack simulation indicators. Adaptability denotes the capacity to preserve sufficient technological diversity to enable paradigm shifts under disruptive conditions, operationalized through Shannon entropy derived from patent-text semantic embeddings. The two dimensions are not inherently complementary: structural configurations that enhance coordination efficiency may simultaneously compress the variation space necessary for long-term adaptation. Drawing on Grabher’s (1993) “weakness of strong ties” argument [10], it can be inferred that while high clustering in capital networks may enhance short-term coordination efficiency, excessive structural embeddedness may narrow the space for technological variation. Efficiency gains achieved under high convergence may therefore involve trade-offs with long-term adaptive capacity, particularly in the context of discontinuous technological shifts such as generative AI. Such trade-offs may give rise to network configurations characterized by high short-term robustness but reduced adaptive flexibility, a pattern this study refers to as “robust yet fragile” structural coupling. The central mechanism examined in this study can be stated succinctly: as capital co-investment networks become denser and more centralized, information flows among investors grow more homogeneous, narrowing the range of technological opportunities that receive funding; this progressive alignment between financial ties and technological trajectories compresses the ecosystem’s variation pool, enhancing short-run coordination efficiency while eroding the diversity upon which long-run adaptation depends.
Within China’s institutional setting, additional complexities emerge that may amplify these dynamics. State-owned and private capital operate under heterogeneous logics of risk assessment, return expectations, and signaling strategies. State-backed capital tends to anchor high-risk exploratory trajectories aligned with national strategic priorities, while private capital responds more sensitively to market signals and convergent technological expectations. However, their differentiated roles in shaping systemic robustness and adaptability remain insufficiently examined. Furthermore, existing research rarely quantifies the temporal transmission lag between financial decision making and observable technological outputs, and limited attention has been paid to how major technological breakthroughs may reconfigure capital network structures over time. China’s dual capital structure and strong policy orientation toward strategic technological domains make it a particularly relevant context for examining these dynamics, while also raising questions about the extent to which observed patterns reflect institutionally general mechanisms versus China-specific amplification effects.
To address these gaps, this study develops an empirical framework based on panel data from China’s AI industry (2018–2023). By constructing parallel capital and technological networks and examining their structural association using Quadratic Assignment Procedure (QAP) models, combined with Shannon entropy measures derived from patent-text semantic analysis, the study addresses two research questions: (1) How does capital–technology network coupling correspond to path dependence and structural concentration? (2) How do heterogeneous capital attributes relate to the balance between robustness and adaptability?
From a sustainability standpoint, the structural configuration of capital–technology networks transcends mere allocative efficiency, extending to the domain of long-term systemic resilience. High-technology industries have increasingly evolved into interconnected innovation ecosystems in which structural diversity constitutes a foundational determinant of adaptive capacity. When capital allocation becomes excessively concentrated or tightly coupled with prevailing technological paradigms, coordination efficiency may be enhanced in the short term; however, such convergence risks attenuating exploratory variation and constraining the system’s capacity for renewal. Accordingly, examining the interplay between financial network architectures and technological diversity offers critical insights into the mechanisms sustaining adaptive capacity within emerging digital sectors—particularly under conditions of rapid technological disruption and structural uncertainty.
This study makes three main contributions. First, theoretically, it refines the analysis of path dependence by distinguishing efficiency-based robustness from diversity-based adaptability within capital–technology systems. It frames the capital–technology coupling mechanism as a structural source of technological lock-in. Second, methodologically, this study develops a novel firm-level dynamic technological similarity measure by leveraging BERT-based semantic embeddings extracted from patent texts. This approach departs from conventional applications of text models limited to document classification. By integrating semantic network construction with Shannon entropy, the framework tracks ecosystem-level technological diversity over time. Notably, by integrating semantic similarity networks and entropy-based tracking within a QAP cross-layer association framework, this study offers a methodological advantage in capturing the “structural precursors” of technological lock-in. Unlike conventional patent-classification methods that are limited to static categorical counts, our integrated framework enables the detection of cross-layer structural correspondence—specifically revealing how the densification of capital ties functions as a selective filter that precedes and dictates the narrowing of technological variety. This provides a more granular lens to observe how financial connectivity shapes the boundaries of evolutionary resilience long before such shifts become visible in macro-level industry statistics.
The remainder of this paper is structured as follows. Section 2 reviews the relevant theoretical literature and derives the study hypotheses. Section 3 describes the data sources and methodological approach. Section 4 and Section 5 present the empirical findings. Section 6 discusses the theoretical implications of the empirical findings, while Section 7 concludes the paper by summarizing the principal findings, articulating policy recommendations, and delineating the study’s limitations alongside avenues for future research.
2. Literature Review
2.1. Capital–Technology Co-Evolution and Path Dependence
Within the theoretical framework of evolutionary economics, technological progress is not an isolated linear process but a deeply intertwined, co-evolutionary mechanism with financial capital. Nelson and Winter (2004) posit that technological evolution follows a dynamic “variation–selection–retention” mechanism, in which capital functions as a critical selection environment shaping the survival of technological alternatives [11]. The concepts of “technological paradigm” and “technological trajectories” introduced by Dosi (1982) further suggest that intensive search activities are often channeled along specific directions under the influence of resource constraints and investment expectation [12]. In this sense, capital does not merely fund innovation but actively structures the directionality of technological exploration.
Carlota Perez (2002) systematically elucidated the dialectical relationship between financial and productive capital during technological diffusion cycles [13]. She argued that during the “installation period” of a technological revolution, the speculative drive of financial capital, while potentially generating asset bubbles, accelerates the deployment of foundational infrastructures. Janeway (2018) conceptualized this process as the “necessary waste of innovation,” emphasizing that venture capital’s tolerance for uncertainty is indispensable for the formation of new technological paradigms [14]. These perspectives highlight that capital concentration may initially expand the technological frontier by amplifying experimentation.
However, the coupling of technology and capital is not always Pareto-optimal. Freeman and Louçã (2002) noted that the long-term success of technological revolutions depends on institutional alignment between technological paradigms and financial regimes [15]. When capital excessively clusters toward mature or popular technological paths, it may activate the “increasing returns” mechanism described by Arthur (1989), pushing the system into self-reinforcing path dependence [16]. Grabher (1993) warned that such structural lock-in may gradually translate into cognitive ossification, undermining long-term adaptive capacity and evolutionary resilience [10]. From a heterogeneity perspective, Mazzucato’s (2015) “Entrepreneurial State” theory emphasizes that state-backed capital can anchor high-risk exploratory trajectories during early stages of disruptive innovation, thereby influencing the diversity of technological pathways [17].
Although the existing literature provides rich theoretical insights into capital–technology co-evolution and path dependence, empirical investigations often examine either capital allocation patterns or technological development trajectories separately. Limited attention has been devoted to quantifying how the structural coupling between capital networks and technological similarity networks jointly shapes the intensity and evolution of path dependence over time. Addressing this gap requires a structural perspective capable of capturing cross-layer interactions.
2.2. Cross-Layer Structural Approaches to Industrial Networks
Traditional industrial research typically focuses on single-dimensional interactions, such as equity investment networks or knowledge spillover networks. Schweitzer et al. (2009) conceptualized modern economic systems as Complex Adaptive Systems (CAS) composed of multi-dimensional interdependencies, arguing that single-layer analysis may overlook nonlinear risks arising from cross-layer feedback effects [18]. To better capture such complexity, the multilayer network framework has been introduced to model systems in which nodes interact through multiple relational dimensions simultaneously.
Boccaletti et al. (2014) demonstrated that multilayer network analysis enables the quantitative assessment of node interdependency across layers while preserving the topological properties of each layer [19]. Kivelä et al. (2014) further formalized the mathematical representation of multilayer structures, providing a foundation for analyzing multi-dimensional economic correlations [20]. De Domenico et al. (2013) showed that inter-layer coupling can fundamentally alter system-level dynamical behaviors, generating qualitative structural transformations that cannot be observed in isolated networks [21].
Within interdependent systems, connectivity simultaneously enhances allocative efficiency and amplifies systemic vulnerability. Buldyrev et al. (2010) demonstrated that cascading failures in interdependent networks propagate rapidly through coupling nodes, increasing fragility even when individual layers appear robust [22]. Similarly, Battiston et al. (2016) argued that highly interconnected duplex networks improve resource allocation efficiency but may elevate systemic fragility due to structural homophily and concentrated interconnections [23].
While these studies provide important insights into systemic risk and vulnerability in multilayer systems, their applications have largely focused on infrastructure networks or financial contagion. Relatively limited research has explored how structural coupling between capital and technological networks shapes long-term industrial evolution, particularly in emerging technology sectors. In innovation ecosystems, cross-network interactions may not only transmit shocks but also reinforce selective mechanisms that influence technological convergence or diversification.
Although fully specified multilayer network models offer a comprehensive representation of interdependent systems, the present study adopts a dual-network structural approach. Specifically, capital co-investment and technological similarity networks are constructed separately, and their alignment is evaluated through cross-layer association tests using the Quadratic Assignment Procedure (QAP). This approach emphasizes statistical coupling and structural correspondence rather than supra-adjacency integration, thereby providing a tractable framework for examining capital–technology interdependence in an evolving industrial context.
2.3. Evolutionary Resilience of the AI Industry
Evolutionary Economic Geography distinguishes industrial resilience into three dimensions: engineering resilience, ecological resilience, and evolutionary resilience. The latter emphasizes that systems do not merely return to equilibrium but undergo path re-orientation through structural reorganization (Sunley, 2014) [24]. Boschma (2015) further argued that evolutionary resilience is embedded in “related variety,” referring to technological combinations that are sufficiently proximate to enable knowledge spillovers yet sufficiently diverse to buffer against systemic shocks [25]. From this perspective, resilience depends on maintaining a balance between specialization and diversification.
Path dependence and lock-in effects pose fundamental challenges to evolutionary resilience. David’s (1985) study on the QWERTY keyboard illustrated how contingent technological choices can become entrenched through self-reinforcing mechanisms [26]. Subsequent research has extended this logic to industrial innovation. Cecere et al. (2014) examined path dependence in eco-innovation systems [27], while He et al. (2024) identified significant regional path dependence in AI adoption among Chinese manufacturing firms [28]. Dobusch and Schüßler (2013) distinguished between the constructive and constraining roles of path dependence: it may initially generate economies of scale but eventually induce cognitive “blindness” toward alternative trajectories as maturity increases [29]. These findings imply that structural convergence may enhance short-term robustness while simultaneously reducing long-term adaptive flexibility.
The AI industry represents a particularly sensitive case due to its rapid technological iteration and strong capital dependence. If capital and technological networks become tightly coupled around dominant paradigms, the resulting convergence may generate a system that appears robust yet becomes increasingly fragile when confronted with disruptive paradigm shifts. Such trade-offs between robustness and adaptability are central to the sustainability of innovation-driven industrial ecosystems.
China’s AI policy orientation and capital structure may further intensify these dynamics. Strong state support for strategic technological domains may induce clustering effects in technological exploration. Zhong et al. (2022) identified an inverted U-shaped relationship between policy intensity and innovation outcomes in the new materials sector, suggesting that excessive intervention may inhibit diversity [30]. Patent-based evidence by Cao and Cai (2025) in the AI sector shows that government support can contribute to technological concentration and declining disruptive innovation [31]. The underlying mechanism involves policy-induced herding behavior among investors (Dragomirescu-Gaina & Galariotis, 2021) [32], leading to capital over-concentration in specific technological domains. Concentration of policy resources in state-owned or large enterprises may also crowd out smaller innovators (Chen & Kim, 2023) [33].
Furthermore, the “Capital Matthew Effect” proposed by Su (2026) suggests that capital-rich regions attract continuous inflows, reinforcing specialization in capital-complementary technologies and deepening path dependence [34]. Micro-level evidence from Eng et al. (2021) shows that corporate R&D expenditure is highly dependent on historical investment patterns and capital availability, creating self-reinforcing feedback loops [35]. As a result, underfunded marginal technological fields struggle to access core financial channels despite possessing potential for disruptive breakthroughs. Despite extensive theoretical discussions on capital clustering, policy-induced concentration, and path dependence, empirical research has rarely integrated these perspectives within a dual-network structural perspective to systematically examine how capital–technology alignment relates to evolutionary resilience in emerging industries. In particular, there remains limited longitudinal evidence assessing whether increasing structural correspondence between financial connectivity and technological similarity coincides with greater concentration and changing adaptive diversity. Addressing this gap is essential for understanding the long-term sustainability of AI-driven industrial ecosystems and forms the central inquiry of this study.
2.4. Theoretical Framework and Conceptual Mechanism
This study links capital–technology structural coupling to evolutionary resilience by distinguishing two analytically distinct dimensions. Robustness denotes the system’s capacity to maintain stability within established technological paradigms (operationalized via network attack simulations); adaptability denotes the preservation of sufficient technological variety to enable paradigm reorientation under disruptive conditions (operationalized via Shannon entropy from patent-text semantic embeddings). These dimensions are not inherently complementary: configurations that enhance coordination efficiency may simultaneously compress the variation space upon which long-term adaptation depends. The central claim is that capital–technology structural coupling constitutes the primary mechanism generating this trade-off. The robustness–adaptability distinction is employed as an analytical lens, not a formal mathematical model; the empirical indicators serve as proxies for distinct facets of the underlying constructs.
Capital connectivity functions as a “selective environment” in the sense of Nelson and Winter (2004) [11]. In dense co-investment networks, frequent interactions reduce information asymmetry and intensify convergent expectations among investors. This alignment fosters structural correspondence between financial ties and technological similarity: the capital layer acts as a “selective filter,” channeling resources toward high-consensus domains and away from peripheral trajectories. The mechanism is self-reinforcing—firms within dense co-investment clusters face incentives favoring technological conformity, which attracts further investment from the same cluster.
Shannon entropy quantifies the breadth of the technological search space. High entropy signifies a rich reservoir of variety—a prerequisite for adaptability—while declining entropy reflects increasing convergence. Interpretation is necessarily context-dependent: in mature industries, entropy decline may reflect efficient specialization. Even in AI, observed declines may partly reflect maturing trajectories rather than adaptive erosion. Entropy is therefore treated as an indicative proxy, not a definitive diagnostic. Given China’s AI industry during a period of rapid paradigm transition, declining entropy is interpreted as a signal of contracting adaptive reserve, with appropriate caveats regarding generalizability. Intense capital–technology coupling thus induces “structural lock-in” by pooling resources into dominant trajectories, strengthening short-term robustness at the potential expense of long-term adaptability.
Based on this framework, three testable hypotheses are derived.
Hypothesis 1 (H1).
Increased connectivity within the capital association network is positively associated with the degree of structural alignment between financial ties and technological similarity networks.
Hypothesis 2 (H2).
The intensification of capital–technology structural coupling is associated with a longitudinal decline in ecosystem-level technological entropy.
Hypothesis 3 (H3).
Firms occupying central positions in the capital network exhibit lower technological uniqueness compared to financially peripheral firms.
3. Research Design and Methodology
3.1. Data and Network Construction
This study examines the Chinese artificial intelligence (AI) industry over 1 January 2018–31 December 2023 and constructs a firm-level panel dataset across financial and technological dimensions.
Investment data were obtained from the Wind database, including investor identity, financing rounds, and investment amounts. Technological information was collected through web crawling from patent descriptions, corporate websites, and prospectuses. A unified firm-level identifier was applied to match records across data sources. Firms with textual descriptions shorter than 50 words or missing key financial variables were excluded, yielding a final sample of 5518 enterprises observed over six years. Based on these data, two firm-level networks were constructed for each observation period. Importantly, this study does not construct a fully integrated multilayer or supra-adjacency matrix representation. Rather, it evaluates structural correspondence between two independently constructed networks through cross-network statistical association tests. This approach emphasizes structural coupling while preserving analytical clarity between financial and technological dimensions.
3.1.1. Financial Layer: Capital Association Network
A capital association network was constructed using a projection approach. When an investment institution simultaneously invests in Firm and Firm , a linkage is established between the two firms. This procedure generates an annual symmetric adjacency matrix .
Network density is defined as:
where denotes the number of observed edges and represents the total number of firm nodes.
The local clustering coefficient for node is:
where denotes the degree of node and represents the number of observed linkages among its neighboring nodes.
The average clustering coefficient is then defined as:
where denotes the total number of firm nodes in the network. A higher average clustering coefficient indicates stronger local cohesion and a greater tendency for nodes to form tightly interconnected subgroups.
System-wide connectivity was measured using the Largest Connected Component Ratio (LCCR):
where represents the number of firm nodes within the Largest Connected Component and denotes the total number of firm nodes in the network.
A higher LCCR indicates that a larger proportion of firms are connected within a single dominant subnetwork, reflecting stronger systemic integration. Conversely, a lower LCCR suggests fragmentation and reduced network cohesion.
3.1.2. Technological Layer: Semantic Similarity Network
Technological proximity is measured using the pre-trained bert-base-chinese model. Cleaned technical texts are transformed into 768-dimensional dense vectors via mean pooling of the final hidden layer. Cosine similarity is computed directly on these embeddings without artificial smoothing:
Cosine similarity between firms and is computed as:
An annual technological similarity matrix is constructed accordingly.
Following Bloom et al. (2013), a threshold is defined to binarize the similarity matrix [36]:
where and are the mean and standard deviation of pairwise similarities. A linkage is established if .
Technological diversity is measured using entropy:
where represents the share of investment events associated with technological domain in year .
Structural influence within the technological network is measured by eigenvector centrality:
where is the technological adjacency matrix and is its largest eigenvalue.
The use of entropy as a proxy for adaptability requires justification. Within evolutionary economics, technological diversity constitutes the system’s repository of “variation” (Nelson & Winter, 2004) [11]. Declining entropy thus signifies contraction of the available technological variants. In AI—characterized by rapid paradigm shifts—a low-entropy system lacks reserve pathways for reorientation under disruption. This interpretation is context-dependent: in stable industries, entropy decline may reflect efficient specialization. Even within AI, observed declines may partly reflect maturing trajectories. Entropy is therefore treated as an indicative proxy, not a definitive diagnostic. This aligns with Boschma’s (2015) [25] notion that resilience requires “related variety”: proximity for recombination, yet diversity to buffer shocks.
3.1.3. Mapping Theoretical Constructs to Empirical Indicators
To ensure conceptual clarity, we explicitly link the theoretical dimensions of evolutionary resilience to specific network metrics:
Selection Environment (Robustness): Measured by Capital Layer Density and LCCR. High connectivity reflects the systemic capacity to mobilize resources and provide financial buffers, corresponding to “engineering resilience.”
Evolutionary Variety (Adaptability): Measured by Technological Shannon Entropy (). Following evolutionary logic, higher entropy represents a wider search space and more diverse “variation” pool, which is essential for adapting to paradigm shifts.
Structural Coupling: Measured by the QAP Correlation Coefficient between the capital adjacency matrix and the technological similarity matrix, reflecting the alignment between resource allocation and technological trajectories. The QAP is formally described in next section.
3.2. Empirical Strategy
3.2.1. QAP Matrix Regression
To account for dyadic interdependence inherent in network data, we employed the Quadratic Assignment Procedure (QAP) matrix regression. This non-parametric approach addresses the issue of row and column autocorrelation by permuting the dependent matrix, thereby providing more reliable standard errors than OLS for relational data. The empirical model is specified as follows:
where represents the technological similarity matrix and denotes the capital association matrix. To isolate the net effect of capital ties, we incorporate two critical control matrices: (1) (Geographic Proximity), where if firms and are headquartered in the same city, to filter out spatial agglomeration effects; and (2) (Sub-industry Homophily), where if firms operate in the same AI sub-sector, to control for inherent technological overlap within specific niches. captures additional attribute homophily such as differences in firm age and registered capital, and denotes the matrix of residuals.
Statistical significance was assessed via 5000 row–column permutations. The QAP framework captures structural associations rather than causal direction. To mitigate contemporaneous feedback, the QAP results were interpreted as evidence of structural co-evolutionary patterns rather than unidirectional causal effects.
3.2.2. Temporal Association Tests
To explore temporal relationships, dynamic lag models are estimated:
A first-difference specification is further applied:
These models evaluate whether changes in financial integration precede shifts in technological diversity.
Given the six-year observation window (2018–2023), the temporal analysis necessarily relies on a limited number of time points. While the lag specifications provide suggestive evidence on the temporal ordering of capital densification and entropy decline, the short panel constrains the feasible lag structure and precludes the estimation of more complex distributed-lag models. The dynamic patterns reported here should therefore be interpreted as preliminary evidence of temporal association, pending validation with extended time series as the industry matures.
3.2.3. Firm-Level Transition and Position Dynamics
Beyond descriptive quadrant classification, we employed a Markov Transition Matrix to quantify the probability of firms moving between different technological–capital positions.
Furthermore, to test the systematic drivers of these movements, we estimated a Multinomial Logit Model:
This allows us to statistically test whether capital accumulation systematically predicts a firm’s transition toward technological convergence.
3.3. Robustness and Sensitivity Analysis
3.3.1. Baseline Threshold Determination
The binarization of the continuous technological similarity matrix requires the specification of a threshold . To determine an empirically grounded benchmark, we examine the pooled probability density distribution of pairwise similarity scores across all firm-year observations.
To assess structural sensitivity, we further evaluated the evolution of the Largest Connected Component (LCC) size under alternative threshold values. The network exhibits a pronounced connectivity transition within the interval , where the proportion of firms contained in the LCC increases rapidly.
Balancing network sparsity and connectivity, the baseline threshold is set as:
This value preserves the dominant structural features of the technological similarity network while avoiding excessive fragmentation or over-density.
3.3.2. Multi-Threshold Sensitivity Testing
To ensure that empirical findings are not driven by a specific parameter choice, alternative threshold specifications are examined:
- Loose threshold:
- Stringent threshold:
For each threshold, the technological network was reconstructed and key structural indicators—including the LCC Ratio and centrality distributions—were recalculated.
The consistency of coefficient signs, statistical significance levels, and structural patterns across alternative thresholds provides evidence of robustness. This procedure evaluates whether the observed capital–technology coupling remains stable under varying network density conditions. Results remain qualitatively unchanged when using percentile-based thresholds (top 15% and top 20% of similarity values), further confirming that the findings are not sensitive to a specific cut-off rule.
3.3.3. Addressing Network Size Dynamics and Sample Composition
As the number of active firms in the network fluctuates (and generally declines) over the observation period, network-level indicators may be subject to size-induced bias. We implement two corrective strategies:
Size-Normalized Metrics: All network density and centrality measures were normalized by the total possible ties () to ensure comparability across years with different node counts.
Balanced Panel Robustness: We implemented a fixed-size bootstrap sampling procedure to eliminate size-induced bias. For each year, 80 firms were randomly drawn without replacement from the pool of active firms, and all network metrics were recomputed. This procedure was repeated 100 times, and the reported metrics represent the averages across replications. Holding the number of nodes constant across years isolates structural evolution from compositional changes. The consistency of the resulting temporal patterns confirms that the observed technological convergence reflects genuine within-sample shifts rather than firm entry or exit.
4. Empirical Analysis: Structural Characteristics and Cross-Layer Coupling in the Capital–Technology Network
4.1. Dynamic Evolution of Network Topology
4.1.1. Evolutionary Morphology of the Capital Association Network
Table 1 reports the evolution of key topological indicators of the AI capital association network from 2018 to 2023. The number of firms included in the annual network declines from 190 in 2018 to 81 in 2023. This reduction reflects changes in observed investment participation rather than missing data. This contraction reflects a market selection process where financial capital progressively concentrated on a more resilient subset of AI enterprises during periods of macroeconomic uncertainty. Between 2018 and 2020, the network became increasingly sparse. Network density decreases from 0.0102 to 0.0066, while the Largest Connected Component (LCC) ratio declines from 0.4526 to 0.0840. This indicates a substantial contraction in system-wide connectivity, with a growing proportion of firms operating outside the dominant connected subnetwork.
Table 1.
Topological metrics evolution of China’s AI capital association network (2018–2023).
From 2021 onward, a “core-consolidation” pattern emerges: density nearly triples from 0.0072 to 0.0194, and the LCC ratio recovers to 0.3333. Size-normalized metrics confirm that this intensification outpaces node reduction, reflecting genuine structural tightening rather than sampling artifact. A balanced panel robustness check (Section 4.3.3) further supports this interpretation.
From a dispersed configuration to an interconnected core, this structural transition implies a strategic trade-off: consolidation enhances robustness through concentrated resource pooling, while the exclusion of peripheral nodes may reduce adaptability by narrowing the diversity of funded participants.
4.1.2. Evolution of Technological Power Centers
Appendix A Table A1 reports the annual ranking of firms by eigenvector centrality within the technological similarity network. Between 2018 and 2021, the technological network exhibited relatively low spatial centralization. Eigenvector centrality scores for leading firms remained modest (approx. 0.01), indicating a dispersed technological landscape where influence was spread across diverse subfields, fostering high evolutionary adaptability.
By 2023, the structure became significantly more concentrated, with the highest eigenvector centrality score rising to 0.0581. This shift indicates that a small group of “anchor firms” increasingly defines the dominant technological trajectory of the ecosystem. In particular, firms engaged in embodied AI and hardware-integrated applications began to occupy the network core. This pattern of structural convergence coincides with periods of intensified capital–technology coupling identified in the QAP analysis, suggesting a correspondence between resource allocation patterns and the narrowing of dominant technological trajectories. While such centralization improves coordination efficiency, it signals a potential decline in the system’s capacity to explore alternative technological paths, as discussed in the subsequent transition analysis.
4.2. Spatial Coupling and Consistency Verification Between Capital and Technology
4.2.1. QAP Regression Results
To examine the structural alignment between capital association and technological similarity, we employ the Quadratic Assignment Procedure (QAP) to estimate the correlation between the respective adjacency matrices. Unlike OLS, the QAP framework accounts for the dyadic interdependence of network data by performing 5000 random permutations. The results, incorporating geographic and sectoral controls, are reported in Table 2. Across the observation window (2018–2023), the estimated correlation coefficients (R) fluctuate over time. Significant positive correlations are observed in 2018 (R = 0.0335, p < 0.01), 2020 (R = 0.0721, p < 0.01), and 2023 (R = 0.0518, p < 0.01), whereas correlations in 2019, 2021, and 2022 are statistically insignificant. While the coefficients and the resulting values appear small (0.0011 to 0.0052), such magnitudes are typical in large-scale dyadic network regressions. In such contexts, explanatory variance is distributed across thousands of pairwise observations ( ties), often leading to lower absolute values compared to traditional OLS models (Cranmer et al., 2017) [37]. Similar ranges of small but statistically significant coefficients have been reported in existing studies of industrial innovation networks (e.g., Gilsing et al., 2008), confirming that these values reflect robust structural alignment rather than mere noise [38]. In inferential network analysis, the absolute magnitude of coefficients is often secondary to their statistical significance and direction, given the high degree of interdependence in network data. Statistical significance is assessed using 5000 random permutations, ensuring robustness against network autocorrelation.
Table 2.
QAP correlation analysis between capital association matrix and technological space similarity matrix (2018–2023).
By filtering out geographic and sub-industry homophily, these results indicate intermittent but statistically detectable structural correspondence between capital ties and technological proximity. The significant correlation in 2023, observed despite the reduced sample size, suggests that the alignment is not a mathematical artifact of network scale but rather reflects a genuine pattern of co-occurrence. Taken together, the QAP findings are consistent with Hypothesis 1: periods of stronger capital–technology coupling coincide with denser co-investment networks, supporting the interpretation that capital connectivity functions as a selective filter that aligns financial and technological structures. The implications of this fluctuating alignment for system-level diversity are examined in the next section.
4.2.2. The Divergence Between Coupling Intensity and Adaptive Diversity
To evaluate the co-evolution of network coupling and system-level variation, we compare the trajectory of QAP coefficients with the Technological Shannon Entropy (), which serves as a proxy for evolutionary adaptability (Figure 1). This analysis directly addresses Hypothesis 2 by examining whether increasing structural alignment (as documented in Section 4.2.1) corresponds to a contraction of the technological search space. We explicitly address the concern regarding sample contraction (from 190 to 81 firms).
Figure 1.
Structural divergence: the evolutionary trade-off between capital–technology coupling and technological diversity (2018–2023).
Consequently, Figure 1 illustrates a fundamental evolutionary trade-off: the strengthening of capital–technology coupling may be associated with improved short-term robustness through resource concentration, while coinciding with a reduction in the technological diversity required for long-term adaptability in response to disruptive paradigm shifts. This inverse relationship between coupling intensity and entropy is consistent with Hypothesis 2.
4.3. Lead–Lag Relationships in Dynamic Evolution
4.3.1. Lagged Correlation and the Temporal Selection Mechanism
To further examine the directional influence between financial integration and technological variety, we perform a lagged correlation analysis between capital network density (as a proxy for selection intensity) and Technological Shannon Entropy (, as a proxy for adaptive variety). The results, across various lag specifications, are reported in Table 3.
Table 3.
Lagged correlation analysis between capital network density and technological entropy (2018–2023).
Statistical analysis reveals that the relationship is not instantaneous. No significant correlation is observed at Lag 1 or Lag 2. However, at Lag 3 (three quarters), a robust negative correlation emerges (), which persists at Lag 4 (). This temporal structure suggests a “selection incubation period”: it takes approximately nine months for intensified capital coupling to manifest as a measurable reduction in technological diversity. From an evolutionary perspective, this lag may reflect the time required for capital-driven herding behavior to manifest in observable R&D outcomes, eventually corresponding to the abandonment of peripheral technological paths in favor of dominant paradigms. Given the relatively short time series (six annual observations), these lag estimates should be interpreted as suggestive rather than definitive; extended temporal coverage would enable more precise estimation of the lag structure. The significant negative correlation at Lag 3 provides further empirical support for Hypothesis 2, indicating that capital network densification temporally precedes—and is systematically associated with—declines in technological entropy. The contemporaneous first-difference specification yields a statistically insignificant coefficient (), consistent with the lag structure identified in Table 3 and further corroborating the presence of a delayed selection mechanism.
4.3.2. Quantitative Transition and the Robustness-Adaptability Trade-Off
To examine the lagged relationship identified in Table 3, Figure 2 presents a scatter plot and regression analysis between capital network density at lag 3 (t − 3) and current Technological Semantic Entropy (t). The results indicate a clear negative trend: higher capital network density in the previous three quarters is associated with lower technological entropy in the subsequent period (Pearson r = −0.529, p = 0.014). The fitted regression line and its 95% confidence interval (shaded area) further highlight the explanatory power of prior capital integration on the convergence of technological diversity within this lag span. Specifically, the scatter distribution suggests that periods of high capital network density tend to correspond to low entropy in the technological structure after approximately three quarters, potentially reflecting the consolidation of resources into core technological paths and a consequent reduction in technological uncertainty.
Figure 2.
Technological semantic entropy (t) versus capital network density at Lag 3 (t − 3).
Figure 3 illustrates the co-evolutionary trajectories of both networks. We observe that periods of rising capital density (2020–2021) are followed by a significant decline in entropy with a three-quarter delay. This pattern is consistent with a path-selection mechanism: capital connectivity functions as a “structural filter” associated with enhanced system robustness through resource concentration, and corresponding declines in evolutionary adaptability through narrowing of the industry’s search space.
Figure 3.
Capital network density and technological entropy dynamics in the capital–technology coupling network (2018Q1–2023Q4).
While we recognize the constraints of the time-series length for definitive causal claims, the robust Lag 3 structure, consistent across both QAP and OLS-based scatter plots, reduces the likelihood of simple contemporaneous feedback. This suggests that the financial network layer may serve as a leading indicator for the technological landscape’s structural evolution.
4.3.3. Robustness Check
To ensure that the observed structural evolution of the inter-firm network is not merely an artifact of sample attrition, we conduct a robustness check using a fixed-size balanced panel.
Specifically, we construct a sub-sample of 80 firms that remained continuously active and maintained connections throughout the entire 2018–2023 observation window. Because the strict requirement of appearing in every single year yields only a very small number of firms (N = 7) due to the inherent sparsity of financing events, we employ a bootstrap-based fixed-size sampling strategy: for each year, we randomly draw exactly 80 firms from the pool of firms active in that year (the maximum feasible constant size given the minimum annual firm count of 81) without replacement, recompute all network metrics, and repeat this procedure 100 times. The reported metrics in Table 4 represent the averages across the 100 bootstrap replications, thereby holding the number of nodes constant across years and eliminating any size-induced bias.
Table 4.
Robustness check using a fixed-size balanced panel (N = 80).
The temporal pattern observed in the full sample persists in the fixed-size panel: density, clustering, LCC ratio, and average degree all exhibit a U-shaped trajectory, declining toward 2020 before recovering. Absolute levels are higher in the balanced panel, reflecting the exclusion of peripheral firms with sparse ties—a discrepancy that does not affect the qualitative trend. The consistency of the directional movement across specifications indicates that the documented structural shifts are not artifacts of sample attrition. All reported metrics are also normalized by the theoretical maximum number of ties, further mitigating size dependence.
5. Empirical Analysis: Evolutionary Resilience and Structural Trade-Offs Under Capital Heterogeneity
5.1. Heterogeneous Capital and Technological Orientation
5.1.1. Technological Selection Patterns Across Capital Ownership Types
Descriptive semantic analysis (Figure 4) reveals that state-owned capital (SOC) investment portfolios are predominantly concentrated in domains such as “Robotics,” “Autonomous Driving,” and “Intelligent Manufacturing”—sectors that align with national strategic priorities and high-precision industrial upgrading. In contrast, private capital (PC) portfolios exhibit a more market-responsive logic, with greater representation in application-oriented fields like “Smart Home,” “AI Interaction,” and “Consumer Digital Applications.” These distributional differences suggest that SOC functions as a “Strategic Anchor,” stabilizing investments in capital-intensive foundational technologies, while PC acts as a “Market Explorer,” driving diversity in the application layer.
Figure 4.
Semantic word cloud comparison of technological domain representation: state-owned capital (SOC) versus private capital (PC).
Table 5 reports the longitudinal evolution of technological entropy (Shannon entropy) for heterogeneous capital ownership types from 2018 to 2023. Both state-owned capital (SOC) and private capital (PC) exhibit a pronounced downward trend in entropy over the observation window, indicating a systemic convergence toward a narrow set of technological clusters.
Table 5.
Evolution of technological entropy (Shannon entropy) for heterogeneous capital in China’s AI industry (2018–2023).
For SOC, entropy reaches zero in 2021 and 2023. We interpret these “zero-entropy” episodes not as data gaps, but as evidence of Extreme Structural Concentration. This pattern likely reflects policy-induced herding or the fulfillment of specific sector mandates during those intervals, where state-led resources were channeled into a single dominant technological paradigm (e.g., infrastructure-level AI). While such concentration enhances engineering resilience (resource efficiency and mission completion), it creates an evolutionary risk by temporarily zeroing out the adaptive variety within the state-funded segment. In contrast, PC exhibits a more gradual decline in entropy. The parallel downward trajectory across both groups suggests that technological convergence is a systemic “macro-evolutionary” phenomenon. However, Figure 5 reveals a significant Structural Decoupling: the co-investment ratio between SOC and PC contracted sharply from 34.5% (2018) to 12.6% (2023), while the PC-Only share expanded to 80.5%.
Figure 5.
Investment structure by capital ownership type (2018–2023).
This decoupling points to an increasing segmentation of the AI investment landscape. SOC and PC are moving toward different technological “poles,” reducing the cross-pollination of resources. This configuration presents a dual challenge for Evolutionary Resilience: while the specialization of capital types may improve efficiency within specific silos, the loss of co-investment connectivity and the overall decline in entropy across both categories suggest a narrowing of the industry’s “evolutionary search space,” potentially rendering the ecosystem more vulnerable to unexpected paradigm shifts.
5.1.2. Positional Transitions and the Selection Mechanism Across Network Quadrants
To further examine structural heterogeneity at the firm level, this study constructs a two-dimensional classification matrix based on technological uniqueness (TU) and capital centrality (CC). This analytical framework enables systematic identification of positional transitions across two evolutionary phases: Phase I (2018–2020, Expansion) and Phase II (2021–2023, Consolidation). Both dimensions are standardized using phase-specific median thresholds to account for shifts in the industry’s aggregate baseline.
Within this matrix, we distinguish three structural archetypes to test Hypothesis 3:
- HU-LC Firms: Firms with high TU and low CC, representing technologically distinctive actors operating at the capital periphery. The term denotes their structural position: well-resourced in technological variety yet semantically and financially peripheral relative to the dominant core. Drawing on Burt’s (2004) [39] structural hole theory, such firms occupy positions bridging unconnected regions of the knowledge space—potential sources of novel recombination, yet structurally disconnected from the capital networks that could amplify their trajectories.
- LU-HC Firms: Firms with low TU and high CC, representing capital-central actors occupying high-consensus technological domains. The label reflects the theoretical concern, articulated by Perez (2002) and Janeway (2018) [13,14], that configurations in which financial capital concentrates around technically convergent domains—decoupled from genuine frontier differentiation—may signal structural vulnerability. Under conditions of discontinuous technological change, such configurations risk simultaneous devaluation, as capital-backed portfolios lack the variety required for reorientation.
- Intermediate Firms: Firms occupying intermediate positions along both dimensions.
Comparative analysis of spatial distributions reveals three salient structural transitions consistent with the “selection-convergence” narrative (Figure 6). First, the proportion of HU-LC firms contracts markedly in Phase II. This suggests that firms characterized by pronounced technological differentiation but limited capital embeddedness face higher “exclusion pressure” in the consolidation phase. This shift is consistent with Hypothesis 1, indicating a correspondence between capital integration and technological alignment.
Figure 6.
Phased evolution of firm positions in the TU–CC matrix (2018–2023). Firms are classified according to phase-specific median thresholds of technological uniqueness (TU) and capital centrality (CC). HU-LC denotes high-uniqueness, low-centrality firms; LU-HC denotes low-uniqueness, high-centrality firms; intermediate denotes the remaining firms.
Second, the LU-HC quadrant exhibits increased density during Phase II. The co-occurrence of elevated capital centrality and diminished technological uniqueness is consistent with a reinforcing selection mechanism: capital connectivity and technological conformity appear to become mutually reinforcing, as central nodes tend to prioritize “safe” and high-consensus technological trajectories. This pattern provides empirical support for Hypothesis 3, suggesting an inverse association between structural prominence in the financial layer and technological uniqueness.
Third, the intermediate region displays a downward shift in average TU, consistent with a broad-based decline in technological differentiation across the population. This micro-level pattern provides cross-level corroboration for the macro-level entropy dynamics reported in Section 5.1.
To move beyond descriptive patterns and formally test whether firm movements across quadrants are systematic and economically meaningful, we construct a transition probability matrix from Phase I to Phase II (see Table 6). A chi-square test of independence rejects the null of random transitions (, , ). Notably, only 15% of HU-LC firms remain in that quadrant in Phase II, while 85% either move to Intermediate or LU-HC status or exit the sample. This non-random pattern is consistent with the presence of a directed selection mechanism rather than idiosyncratic drift.
Table 6.
Transition probability matrix from Phase I to Phase II (including exit firms).
Multinomial logit estimation (reported in full in Table 7) indicates that lagged capital centrality is a significant predictor of positional transitions. A one-standard-deviation increase in prior-year capital centrality is associated with a 12.3 percentage point increase in the predicted probability of transitioning to the LU-HC quadrant relative to the baseline category of remaining in HU-LC or exiting (p < 0.01), and a 9.7 percentage point decrease in the probability of remaining in HU-LC (p < 0.05). These results are robust to the inclusion of firm age, financing round, and year fixed effects. Taken together, the transition matrix and regression evidence provide formal statistical support for the claim that firm movements across quadrants are systematic rather than random.
Table 7.
Multinomial Logit estimates of positional transitions (Phase I → Phase II).
We acknowledge that sample contraction (from 190 to 81 firms) implies a degree of mechanical redistribution. As an additional robustness check, we restrict the transition analysis to firms that remain active across both phases. The directional drift from HU-LC toward LU-HC remains statistically significant in this balanced subsample (χ2 = 18.7, p < 0.01), indicating that the observed positional shifts are not an artifact of sample entry or exit.
5.2. Ecosystem Resilience and Evolutionary Stress Testing
5.2.1. Targeted Attack Simulations and Structural Robustness
To evaluate the structural robustness of the AI industrial ecosystem, this study conducts a targeted attack simulation by sequentially removing investment institutions based on their capital centrality. This experiment mimics the systemic risk of capital withdrawal from key “financial hubs.” After each removal step, we recalculate the relative size of the Largest Connected Component (LCC ratio) to measure the remaining systemic integrity.
The baseline structural integrity in 2023 stands at 0.4136, indicating that approximately 41% of firms are integrated within the primary capital–technology core. As shown in Figure 7, the resilience curve exhibits a “scale-free” failure pattern: the removal of just the top three highly central institutions causes the LCC ratio to plummet from 0.41 to 0.30. As node removal continues, the network fragments rapidly; when the top 13 hubs are removed, the LCC ratio falls below 0.20, signifying total structural collapse.
Figure 7.
Resilience of the AI ecosystem: impact of targeted attacks on financial hubs on network connectivity.
These results provide empirical evidence for the Robustness–Fragility Trade-off. While the “core-consolidation” identified in Section 4.1 enhances efficiency under stable conditions, it creates a “hub-dependency” that renders the ecosystem highly vulnerable to targeted disruptions in the financial layer. This concentrated connectivity, while associated with short-term resource pooling, is structurally characterized by critical points of failure that may amplify systemic risk under targeted perturbations.
5.2.2. Structural Polarization and the Erosion of Adaptive Variety
Using the TU–CC matrix framework, firms are categorized into two polar types: LU-HC (low uniqueness, high centrality) and HU-LC (high uniqueness, low centrality). We define the Polarization Ratio as the number of LU-HC firms divided by the number of HU-LC firms in a given phase. Longitudinal tracking yields a Polarization Ratio of 0.65 across the full observation period (2018–2023). A two-proportion z-test confirms that the shift in polarization is statistically significant (, ).
Notably, over 60% of firms initially identified as HU-LC are no longer present in the active network core by 2023. To address the concern regarding sample attrition, our balanced panel check confirms that even among surviving firms, there is a significant drift away from high-uniqueness positions. This pattern is consistent with the presence of an evolutionary selection filter: firms with frontier-level technological differentiation tend to face greater difficulty in achieving financial embeddedness, often remaining structurally disconnected from the capital network (). The non-random transition patterns documented above provide evidence that this filter is systematic rather than idiosyncratic, although formal survival analysis is beyond the scope of this study.
This structural polarization points to a decoupling between innovation differentiation and financial integration. The top 15 HU-LC firms (detailed in Appendix A Table A2) represent the industry’s reservoir of technological variety, yet their persistent marginalization in the capital network suggests that the current selection environment is systematically associated with “safe” technological convergence rather than radical exploration.
In summary, while the ecosystem exhibits increased robustness through the consolidation of its financial–technological core, this coincides with a reduction in adaptive variety. The marginalization of technologically unique but financially peripheral actors may signal a potential “evolutionary trap,” in which the ecosystem’s capacity to reorient toward future technological paradigms could be gradually constrained by the very structural configuration that appears to support its current performance.
5.2.3. Robustness Check and Methodology Validation
- Cross-Threshold Sensitivity and Network Stability
To assess the sensitivity of results to the technological similarity threshold (τ), we conduct a cross-threshold robustness test using τ = 0.25, 0.35, and 0.45.
As shown in Table 8, the QAP correlation coefficients remain directionally consistent and statistically significant () in 2018, 2020, and 2023 across threshold specifications.
Table 8.
QAP coefficients across different threshold parameters () (2018–2023).
The invariance of coefficient signs and significance levels suggests that the observed alignment between capital associations and technological similarity is not driven by a specific threshold choice within this range. Rather, the core structural relationships appear stable across moderate variations in network construction parameters. This robustness reduces concerns that the empirical findings are artifacts of arbitrary similarity cutoffs.
The invariance of these coefficients indicates that the observed alignment between capital associations and technological proximity is not an artifact of an arbitrary cutoff. Instead, it reflects a polarized structural distribution where capital-linked firm pairs consistently reside far above the similarity threshold, confirming the stability of the identified coupling patterns.
- 2.
- Validation of BERT-based Entropy
To ensure the transparency of our NLP methodology, we provide additional clarification on the entropy construction. Patent abstracts were embedded into a 768-dimensional semantic space using the BERT-base-Chinese model. The optimal number of clusters () was determined via the Silhouette Score and the Calinski–Harabasz Index to maximize partition quality. Crucially, the declining trend in Shannon entropy () remains robust under alternative clustering resolutions (), indicating that the observed technological convergence is a genuine evolutionary signal rather than clustering noise.
5.3. Structural Implications and Evolutionary Trade-Offs
The convergent evidence from structural metrics, cross-layer association tests, and robustness simulations delineates a fundamental evolutionary trade-off within China’s AI industrial ecosystem. This configuration privileges coordination efficiency over exploratory variation, leading to the following structural implications:
First, the intensification of capital–technology coupling is structurally aligned with path dependence. The concurrent rise in capital centrality and structural alignment suggests that investment flows are increasingly “locked” into relationally proximate technological domains. While this reduces resource dispersion and reinforces the internal cohesion of the industrial core, it suggests the presence of a self-reinforcing lock-in mechanism that may marginalize disruptive, non-linear technological breakthroughs.
Second, structural polarization coincides with the marginalization of “HU-LC Firms”. The persistent gap between technologically unique peripheral firms and convergent central actors underscores a structural misalignment in the ecosystem’s capital allocation. This polarization suggests that the current “selection environment” (the capital network) is optimized for exploitative innovation (refining existing paths) rather than exploratory innovation (creating new paths). This misalignment is an endogenous feature of the network architecture that market coordination alone may fail to resolve.
Third, hub-dependent resilience is associated with latent systemic fragility. While the network maintains stability under stochastic perturbations, our targeted attack simulations reveal a high sensitivity to the removal of central financial–technological hubs. This profile is characteristic of concentrated configurations that optimize for short-term performance through centralized coordination but lack the redundancy and distributed adaptive capacity required to navigate discontinuous paradigm shifts.
In conclusion, the AI innovation ecosystem exhibits characteristics of a structural equilibrium that prioritizes engineering robustness at the expense of evolutionary adaptability. Sustained long-term resilience will depend on whether the ecosystem can evolve “bridging mechanisms” to reconnect marginalized innovation explorers with central capital hubs, thereby restoring the exploratory diversity essential for future survival.
6. Discussion
This study contributes to sustainability research by distinguishing structural robustness from adaptive diversity within innovation ecosystems. Drawing on evolutionary economics and innovation network theory, we conceptualize evolutionary resilience as a dynamic tension between two analytically distinct dimensions: robustness, defined as the system’s capacity to maintain performance stability within established technological paradigms; and adaptability, defined as the preservation of sufficient technological diversity to enable paradigm-level reorientation under disruptive conditions. These two dimensions are not inherently complementary—structural configurations that enhance coordination efficiency may simultaneously compress the variation space necessary for long-term adaptation. The empirical findings from China’s AI industry (2018–2023) provide longitudinal evidence consistent with H1, H2, and H3 as formulated in Section 2: capital–technology network coupling has intensified over the study period, aggregate technological entropy has declined, and firms with higher capital centrality exhibit systematically lower technological uniqueness than peripherally positioned counterparts.
By examining the evolving relationship between capital connectivity and technological orientation in China’s AI industry, the findings demonstrate that financial and technological networks have become progressively more structurally aligned over time. Rather than functioning as loosely connected subsystems, the two dimensions exhibit increasing structural alignment, forming a tightly coordinated configuration. This pattern is consistent with theoretical expectations derived from path dependence theory and the “weakness of strong ties” argument: as capital co-investment networks densify, information circulation becomes more homogeneous, narrowing the effective technological search space available to network-embedded firms.
Importantly, this alignment should not be interpreted as a linear causal mechanism in which capital unilaterally determines technological trajectories. The observed structural correspondence reflects mutually reinforcing dynamics that are difficult to disentangle with the present identification strategy. Preferential capital allocation toward established technological domains may intensify similarity through cumulative advantage effects, while firms operating in related knowledge spaces may simultaneously attract overlapping investors due to convergent expectations and comparable risk assessments. Institutional priorities and policy signals may further synchronize these trajectories. The strengthening correspondence identified in this study thus reflects an interactive co-evolutionary process.
From an evolutionary perspective, increasing structural cohesion corresponds to a relative shift toward exploitation, where coordination efficiency and scaling capacity are enhanced at the expense of exploratory variation. The observed decline in technological entropy over the study period is interpreted here not simply as specialization deepening, but as a reduction in the ecosystem’s reserve of alternative technological trajectories—a distinction that is particularly consequential in the context of rapid paradigm transitions. In sectors characterized by discontinuous technological change, such as AI, low entropy configurations risk leaving the system without viable adaptation pathways when dominant paradigms are disrupted. This interpretation is necessarily context-dependent: in more mature or stable industrial settings, declining entropy may reflect efficient convergence rather than adaptive vulnerability. Accordingly, the concern raised here is specific to innovation ecosystems facing high paradigm uncertainty rather than a universal claim about technological diversity.
That said, heightened structural cohesion does not necessarily imply systemic stagnation. Evidence from the post-2022 period suggests that major technological breakthroughs, exemplified by the rapid diffusion of generative AI architectures, can reopen exploratory space, indicating that path dependence operates as a dynamic constraint rather than irreversible lock-in. Structural concentration and episodic diversification may therefore coexist within the same evolutionary system, and the balance between them may shift in response to exogenous technological shocks.
The presence of technologically distinctive yet financially peripheral firms highlights an additional dimension of sustainability. Drawing on Burt’s (2004) [39] structural hole theory and Boschma’s (2015) [25] related variety perspective, these firms can be understood as repositories of non-redundant knowledge that occupy positions outside the dominant capital–technology alignment. Their peripheral status within capital networks does not diminish their potential systemic function: during periods of paradigm transition, such firms may constitute the primary source of variation from which new technological trajectories emerge. The sustainability of innovation ecosystems therefore depends not solely on high connectivity among core actors, but on maintaining sufficient bridging mechanisms between exploratory niches and dominant capital structures. The transition analysis reported in Section 5 further indicates that movements out of the HU-LC Firm quadrant are relatively infrequent, suggesting that structural isolation tends to persist rather than self-correct through market mechanisms alone.
Overall, the findings suggest that capital logic exerts a dual structural influence on innovation ecosystems: enhancing coordination and scaling efficiency under dominant paradigms, while potentially compressing technological dispersion during stable phases. Long-term sustainability is therefore linked to the management of this structural tension rather than the optimization of either dimension in isolation. Adaptive systems require a dynamic balance between centralized coordination and distributed experimentation—a balance that is unlikely to self-sustain without deliberate institutional mechanisms.
The capital–technology configuration observed in China’s AI industry illustrates how this balance evolves within a specific institutional setting characterized by dual capital structures (state-owned and private) and strong policy orientation toward strategic technological domains. China’s institutional environment may amplify the coupling dynamics identified here through at least two mechanisms: policy-induced herding behavior among investors, and the preferential channeling of state-backed capital toward politically salient technological paradigms. These factors may intensify the structural alignment between financial networks and dominant technological trajectories beyond what would be observed in more market-driven innovation systems. At the same time, the underlying structural logic—whereby capital network densification corresponds to technological convergence and a shift in the robustness–adaptability balance—may generalize to other capital-intensive emerging industries in which financial networks play a coordinating role. Comparative analysis across national innovation systems with varying capital structures, such as the United States’ market-led venture ecosystem or South Korea’s state-coordinated industrial policy model, would help delineate the boundary conditions of this framework and is identified as a priority for future research.
7. Conclusions
7.1. Findings
This study develops a dual-layer network framework integrating investment co-occurrence and technological similarity to examine the structural evolution of China’s AI industry between 2018 and 2023. The empirical analysis yields three central observations. First, capital connectivity and technological similarity exhibit increasing structural alignment over the study period, as evidenced by QAP Correlations that remain robust across alternative similarity thresholds. Second, rising capital network density is associated with declining ecosystem-level technological entropy—a pattern that, within the context of rapid AI paradigm shifts, may signal contraction of adaptive reserves rather than simple efficiency gains. Third, firm-level heterogeneity persists: “HU-LC Firms”, technologically distinctive but financially peripheral, remain structurally isolated, and transition analysis indicates that movements out of this quadrant are infrequent. Collectively, these patterns illuminate how financial embeddedness and technological evolution mutually constrain each other within an adaptive network system. It should be emphasized that these findings reflect structural associations rather than directional causal relationships, given the correlational nature of the empirical strategy.
7.2. Policy Implications
Building on the empirical findings, several policy-relevant implications emerge for strengthening the long-term evolutionary resilience of the AI industrial ecosystem. These implications are interpretative rather than prescriptive, given the correlational nature of the analysis.
First, improving connectivity between technologically distinctive but financially peripheral firms and core capital networks appears critical. The quadrant-based diagnostic framework developed in this study may serve as a diagnostic tool to identify firms characterized by high technological uniqueness but limited financial integration. Public funding instruments or co-investment platforms could be designed to facilitate bridging ties, thereby reducing structural isolation without crowding out market-based capital allocation.
Second, the network’s increasing concentration suggests potential vulnerability to hub dependency. Encouraging a more distributed participation of investment institutions may enhance structural robustness. A diversified investment landscape—where different capital types assume complementary roles—could mitigate excessive reliance on a small number of dominant financial nodes while preserving coordination efficiency.
Third, the identified lag structure between capital densification and subsequent technological convergence offers potential for early-warning monitoring. Tracking changes in capital network density may help anticipate shifts toward excessive homogenization. Policy responses, such as adjusting innovation incentives or supporting exploratory research programs, could then be implemented proactively to maintain a balanced exploration–exploitation dynamic.
Finally, maintaining institutional conditions that preserve technological heterogeneity is essential for long-term sustainability. During periods of heightened capital concentration or risk aversion, targeted support mechanisms, such as competitive R&D grants, public procurement programs, or innovation intermediaries, may complement market mechanisms by helping sustain non-mainstream technological trajectories.
It should be noted that these implications are derived from patterns observed within China’s specific institutional context, in which state-owned and private capital co-exist and policy signals play a coordinating role. Policymakers in other institutional settings should therefore consider the extent to which local capital structures and governance arrangements may amplify or attenuate the dynamics identified here before directly applying these recommendations.
7.3. Research Limitations and Future Directions
Despite its contributions, this study has several limitations.
First, the temporal coverage of the dataset—six annual observations spanning 2018 to 2023—constrains the statistical power of time-series-dependent analyses, particularly the lagged correlation models between capital density and technological entropy. With k = 1 and k = 2 lag specifications, the effective number of observations reduces to five and four data points respectively, limiting the reliability of inferences drawn from temporal sequencing alone. Panel-based dynamic models or extended temporal coverage would substantially strengthen these analyses, and current findings regarding lag structure should be interpreted with corresponding caution.
Second, the network sample exhibits variation in firm count across years. As network indicators including density, entropy, and centrality are sensitive to changes in network size, the observed trends in these indicators may partly reflect compositional shifts rather than genuine structural evolution. The robustness checks across similarity thresholds partially address this concern, but balanced panel analyses or size-adjusted indicator specifications would provide stronger evidence and are recommended for future work.
Third, the dual-layer network model captures macro-level structural patterns but does not directly observe micro-level investment decision processes or intra-firm R&D allocation dynamics. Future research could integrate detailed venture capital contract data, patent strategy information, or firm-level financial disclosures to refine micro-foundational explanations of the coupling mechanisms identified here.
Fourth, although lagged QAP correlations provide directional insights, fully disentangling endogeneity—particularly reverse causality—remains methodologically challenging. Future research should prioritize more rigorous identification strategies to isolate causal effects. Specifically, instrumental variable (IV) approaches could leverage exogenous shocks to the capital network, such as variations in local government guidance fund allocations or the implementation of regional financial pilot policies, which affect investment ties but are unrelated to specific firm-level technological trajectories. Furthermore, a Difference-in-Differences (DID) framework could be constructed around specific regulatory shocks, such as the 2021 Algorithm Recommendation Regulations, to treat them as quasi-natural experiments for evaluating how capital–technology coupling responds to shifting institutional boundaries. Such high-frequency or event-based identification would significantly strengthen the causal claims regarding the co-evolutionary mechanisms identified in this study.
Finally, this study is grounded in China’s AI industry, and the generalizability of findings to other institutional contexts warrants careful consideration. The dual capital structure (state-owned and private), strong policy orientation, and specific regulatory environment of China’s AI sector may amplify the coupling dynamics observed here. Comparative analyses across national innovation systems, such as the United States’ market-led venture ecosystem or South Korea’s state-coordinated industrial policy model, would help identify the boundary conditions of the theoretical framework and clarify which structural patterns are institutionally specific versus broadly generalizable across capital-intensive emerging industries.
Author Contributions
Conceptualization, R.W. and Y.H.; methodology, Y.H.; software, Y.H.; validation, R.W. and Y.H.; formal analysis, Y.H.; investigation, Y.H.; data curation, Y.H.; writing—original draft preparation, Y.H.; writing—review and editing, Y.H.; visualization, Y.H.; supervision, R.W. All authors have contributed to data collection. All authors have read and agreed to the published version of the manuscript.
Funding
This research was funded by the National Social Science Fund of China, grant number 21BJY253.
Institutional Review Board Statement
Not applicable.
Informed Consent Statement
Not applicable.
Data Availability Statement
The data presented in this study are available upon request from the corresponding author.
Conflicts of Interest
The authors declare no conflicts of interest.
Appendix A
Table A1.
Core enterprises by annual technical centrality (2018–2023).
Table A2.
List of HU-LC firms identified through empirical analysis.
References
- Eisfeldt, A.L.; Schubert, G. Generative AI and Finance. Annu. Rev. Financ. Econ. 2025, 17, 363–393. [Google Scholar] [CrossRef] [Scilit]
- Tu, M.; Dall’erba, S.; Ye, M. Spatial and Temporal Evolution of the Chinese Artificial Intelligence Innovation Network. Sustainability 2022, 14, 5448. [Google Scholar] [CrossRef] [Scilit]
- Li, S.; Zhan, S.; Zhan, S.; Zhan, M. How Does Financial Development Change the Effect of the Bank Lending Channel of Monetary Policy in Developing Countries?—Evidence from China. Int. Rev. Econ. Financ. 2023, 85, 502–519. [Google Scholar] [CrossRef] [Scilit]
- Tang, M.; Wang, X.; Niu, W.; Fu, J.; Zhu, M. How Financial Development Scale and R&D Influence Regional Innovation Efficiency: Empirical Evidence from the Financial Industry. Environ. Sci. Pollut. Res. 2023, 30, 61257–61270. [Google Scholar] [CrossRef] [Scilit]
- Kim, J.; Shin, J. Mapping Extended Technological Trajectories: Integration of Main Path, Derivative Paths, and Technology Junctures. Scientometrics 2018, 116, 1439–1459. [Google Scholar] [CrossRef] [Scilit]
- Zirulia, L. Path Dependence in Evolving R&D Networks. J. Evol. Econ. 2023, 33, 149–177. [Google Scholar] [CrossRef] [Scilit]
- Li, X.; Yu, H. On the Multifractal Cross-Correlations and Coupling Coordination Characteristics of Fintech, Global Technology and Bitcoin Markets. Physical A 2025, 671, 130645. [Google Scholar] [CrossRef] [Scilit]
- Liu, Z.; Zhang, J.; Cao, L. The Synergistic Effect of Digital Transformation Technology and Supply Chain Finance: Empirical Evidence from 500 Listed Companies. Front. Phys. 2025, 13. [Google Scholar] [CrossRef] [Scilit]
- Gu, W.; Luo, J.; Liu, J. Exploring Small-World Network with an Elite-Clique: Bringing Embeddedness Theory into the Dynamic Evolution of a Venture Capital Network. Soc. Netw. 2019, 57, 70–81. [Google Scholar] [CrossRef] [Scilit]
- Grabher, G. The Weakness of Strong Ties: The Lock-in of Regional Development in the Ruhr Area. In The Embedded Firm: On the Socioeconomics of Industrial Networks; Grabher, G., Ed.; Routledge: London, UK, 1993; pp. 255–277. [Google Scholar]
- Nelson, R.R.; Winter, S.G. An Evolutionary Theory of Economic Change; Digitally Reprinted; The Belknap Press of Harvard University Press: Cambridge, MA, USA, 2004. [Google Scholar]
- Dosi, G. Technological Paradigms and Technological Trajectories: A Suggested Interpretation of the Determinants and Directions of Technical Change. Res. Policy 1982, 11, 147–162. [Google Scholar] [CrossRef] [Scilit]
- Perez, C. Technological Revolutions and Financial Capital: The Dynamics of Bubbles and Golden Ages; Edward Elgar: Cheltenham, UK, 2002. [Google Scholar]
- Janeway, W.H. Doing Capitalism in the Innovation Economy: Reconfiguring the Three-Player Game Between Markets, Speculators and the State; Cambridge University Press: Cambridge, UK, 2018. [Google Scholar]
- Freeman, C.; Louçã, F. As Time Goes By: From the Industrial Revolutions to the Information Revolution; Oxford University Press: Oxford, UK, 2002. [Google Scholar]
- Arthur, W.B. Competing Technologies, Increasing Returns, and Lock-In by Historical Events. Econ. J. 1989, 99, 116–131. [Google Scholar] [CrossRef] [Scilit]
- Mazzucato, M. Entrepreneurial State: Debunking Public vs. Private Sector Myths; Anthem Press: London, UK, 2015. [Google Scholar]
- Schweitzer, F.; Fagiolo, G.; Sornette, D.; Vega-Redondo, F.; Vespignani, A.; White, D.R. Economic Networks: The New Challenges. Science 2009, 325, 422. [Google Scholar] [CrossRef] [Scilit]
- Boccaletti, S.; Bianconi, G.; Criado, R.; del Genio, C.I.; Gómez-Gardeñes, J.; Romance, M.; Sendiña-Nadal, I.; Wang, Z.; Zanin, M. The Structure and Dynamics of Multilayer Networks. Phys. Rep. 2014, 544, 1–122. [Google Scholar] [CrossRef] [Scilit]
- Kivelä, M.; Arenas, A.; Barthelemy, M.; Gleeson, J.P.; Moreno, Y.; Porter, M.A. Multilayer Networks. J. Complex Netw. 2014, 2, 203–271. [Google Scholar] [CrossRef] [Scilit]
- De Domenico, M.; Solé-Ribalta, A.; Cozzo, E.; Kivelä, M.; Moreno, Y.; Porter, M.A.; Gómez, S.; Arenas, A. Mathematical Formulation of Multilayer Networks. Phys. Rev. X 2013, 3, 041022. [Google Scholar] [CrossRef] [Scilit]
- Buldyrev, S.V.; Parshani, R.; Paul, G.; Stanley, H.E.; Havlin, S. Catastrophic Cascade of Failures in Interdependent Networks. Nature 2010, 464, 1025–1028. [Google Scholar] [CrossRef] [Scilit] [PubMed]
- Battiston, S.; Farmer, J.D.; Flache, A.; Garlaschelli, D.; Haldane, A.G.; Heesterbeek, H.; Hommes, C.; Jaeger, C.; May, R.; Scheffer, M. Complexity Theory and Financial Regulation: Economic Policy Needs Interdisciplinary Network Analysis and Behavioral Modeling. Science 2016, 351, 818–819. [Google Scholar] [CrossRef] [Scilit]
- Sunley, P. On the Notion of Regional Economic Resilience: Conceptualization and Explanation. J. Econ. Geogr. 2014, 15, 1–42. [Google Scholar] [CrossRef] [Scilit]
- Boschma, R. Towards an Evolutionary Perspective on Regional Resilience. Reg. Stud. 2015, 49, 733–751. [Google Scholar] [CrossRef] [Scilit]
- David, P. Clio and the Economics of QWERTY. Am. Econ. Rev. 1985, 75, 332–337. Available online: https://fbaum.unc.edu/teaching/articles/David_AER_1985.pdf (accessed on 21 April 2026).
- Cecere, G.; Corrocher, N.; Gossart, C.; Ozman, M. Lock-in and Path Dependence: An Evolutionary Approach to Eco-Innovations. J. Evol. Econ 2014, 24, 1037–1065. [Google Scholar] [CrossRef] [Scilit]
- He, C.; Chen, R.; Lv, Y.; Shi, Z.; Lyu, C. Path Dependence and Market Choice in Industrial Intelligence Development. IEEE Trans. Eng. Manag. 2024, 71, 8623–8635. [Google Scholar] [CrossRef] [Scilit]
- Dobusch, L.; Schüßler, E. Theorizing Path Dependence: A Review of Positive Feedback Mechanisms in Technology Markets, Regional Clusters, and Organizations. Ind. Corp. Change 2013, 22, 617–647. [Google Scholar] [CrossRef] [Scilit]
- Zhong, M.; Lu, Q.; He, R. The Heterogeneous Effects of Industrial Policy on Technological Innovation: Evidence from China’s New Metal Material Industry and Micro-Data. Resour. Policy 2022, 79, 103107. [Google Scholar] [CrossRef] [Scilit]
- Cao, L.; Cai, X. Decreasing Disruption and Increasing Concentration of Artificial Intelligence. Minds Mach. 2025, 36, 4. [Google Scholar] [CrossRef] [Scilit]
- Dragomirescu-Gaina, C.; Galariotis, E.; Philippas, D. Chasing the ‘Green Bandwagon’ in Times of Uncertainty. Energy Policy 2021, 151, 112190. [Google Scholar] [CrossRef] [Scilit]
- Chen, P.; Kim, S. The Relationship between Industrial Policy and Exploratory Innovation—Evidence from High-Tech Enterprise Identification Policy in China. Kybernetes 2023, 53, 1636–1652. [Google Scholar] [CrossRef] [Scilit]
- Su, D. The Capital Matthew Effect: Directed Technical Change and International Capital Flows. Int. Econ. Rev. 2026, 67, 171–197. [Google Scholar] [CrossRef]
- Eng, L.L.; Fang, H.; Tian, X.; Yu, T.R. Path Dependence and Resource Availability: Process of Innovation Activities in Chinese Family and Non-Family Firms. Emerg. Mark. Rev. 2021, 49, 100779. [Google Scholar] [CrossRef] [Scilit]
- Bloom, N.; Schankerman, M.; Van Reenen, J. Identifying Technology Spillovers and Product Market Rivalry. Econometrica 2013, 81, 1347–1393. [Google Scholar] [CrossRef] [Scilit]
- Cranmer, S.J.; Leifeld, P.; McClurg, S.D.; Rolfe, M. Navigating the Range of Statistical Tools for Inferential Network Analysis. Am. J. Pol. Sci. 2017, 61, 237–251. [Google Scholar] [CrossRef] [Scilit]
- Gilsing, V.; Nooteboom, B.; Vanhaverbeke, W.; Duysters, G.; van den Oord, A. Network Embeddedness and the Exploration of Novel Technologies: Technological Distance, Betweenness Centrality and Density. Res. Policy 2008, 37, 1717–1731. [Google Scholar] [CrossRef] [Scilit]
- Burt, R.S. Structural Holes and Good Ideas. Am. J. Sociol. 2004, 110, 349–399. [Google Scholar] [CrossRef] [Scilit] [PubMed]
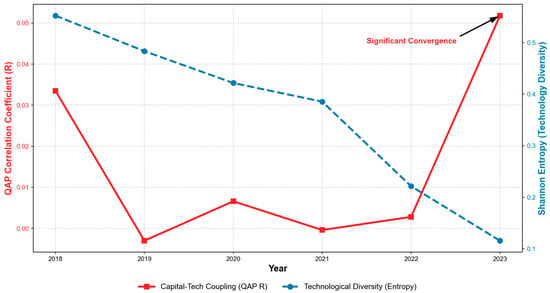
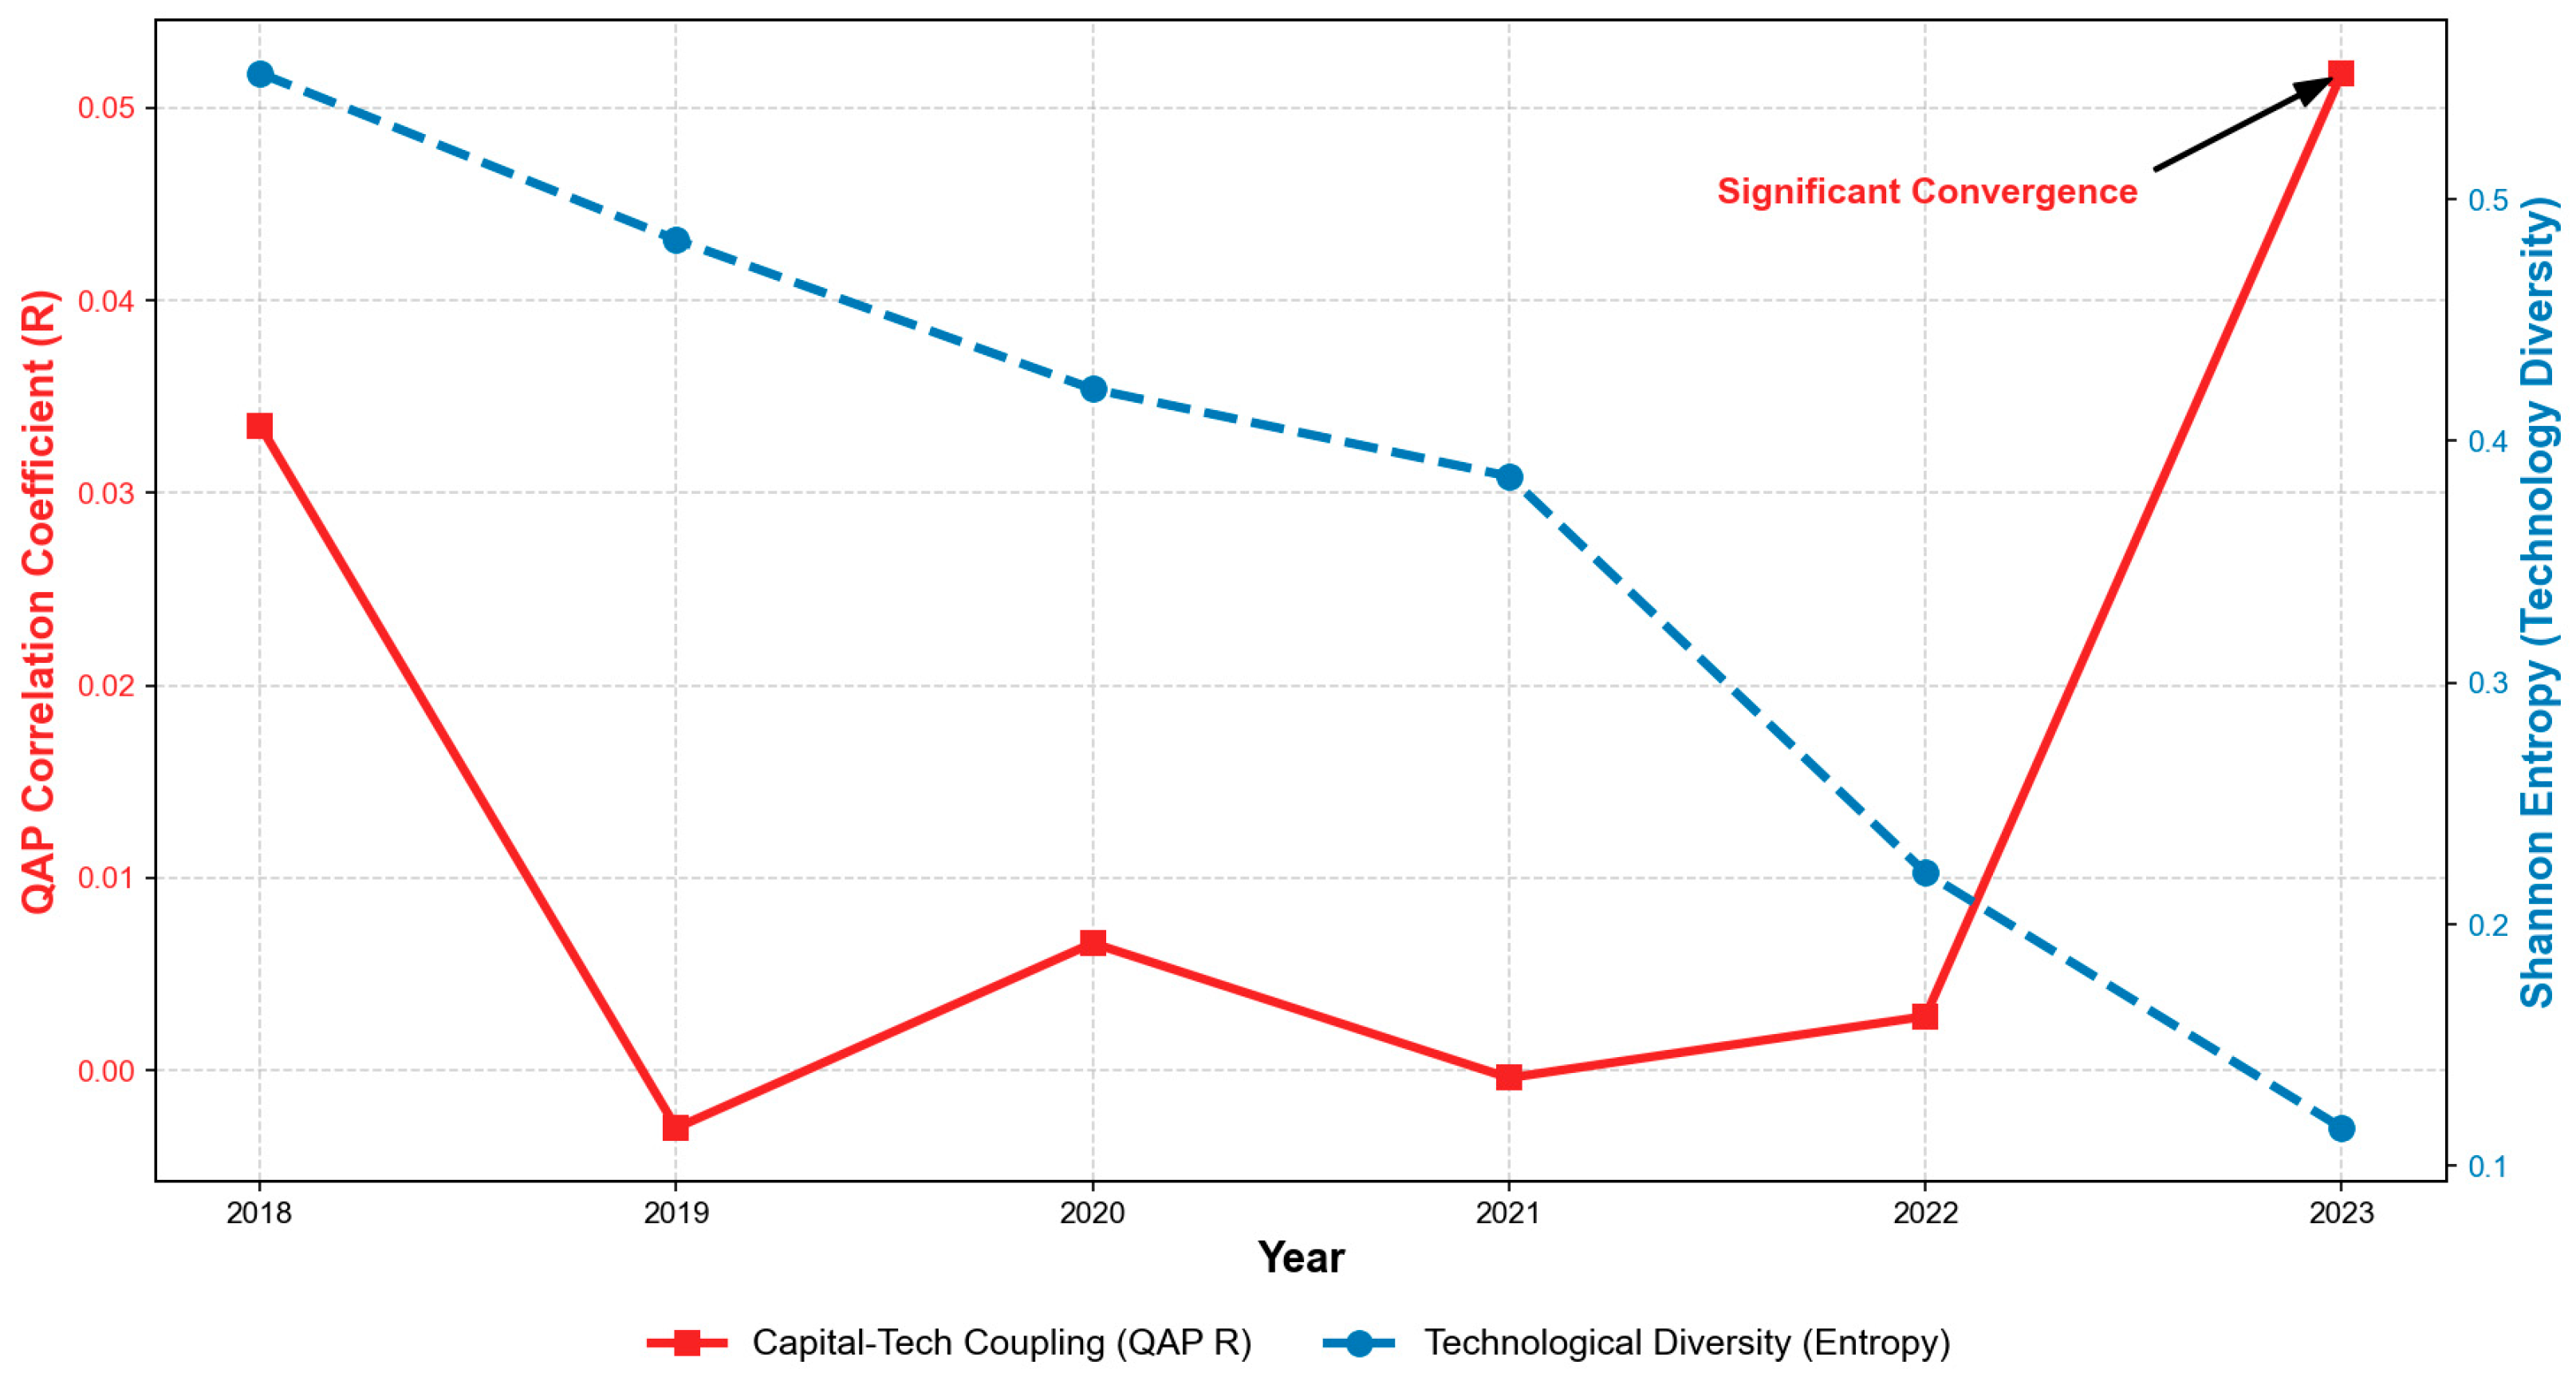
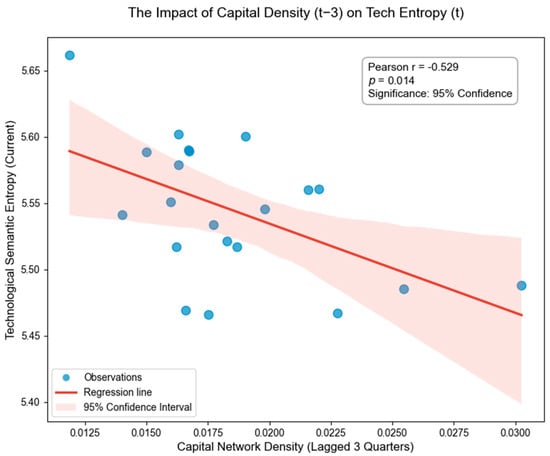
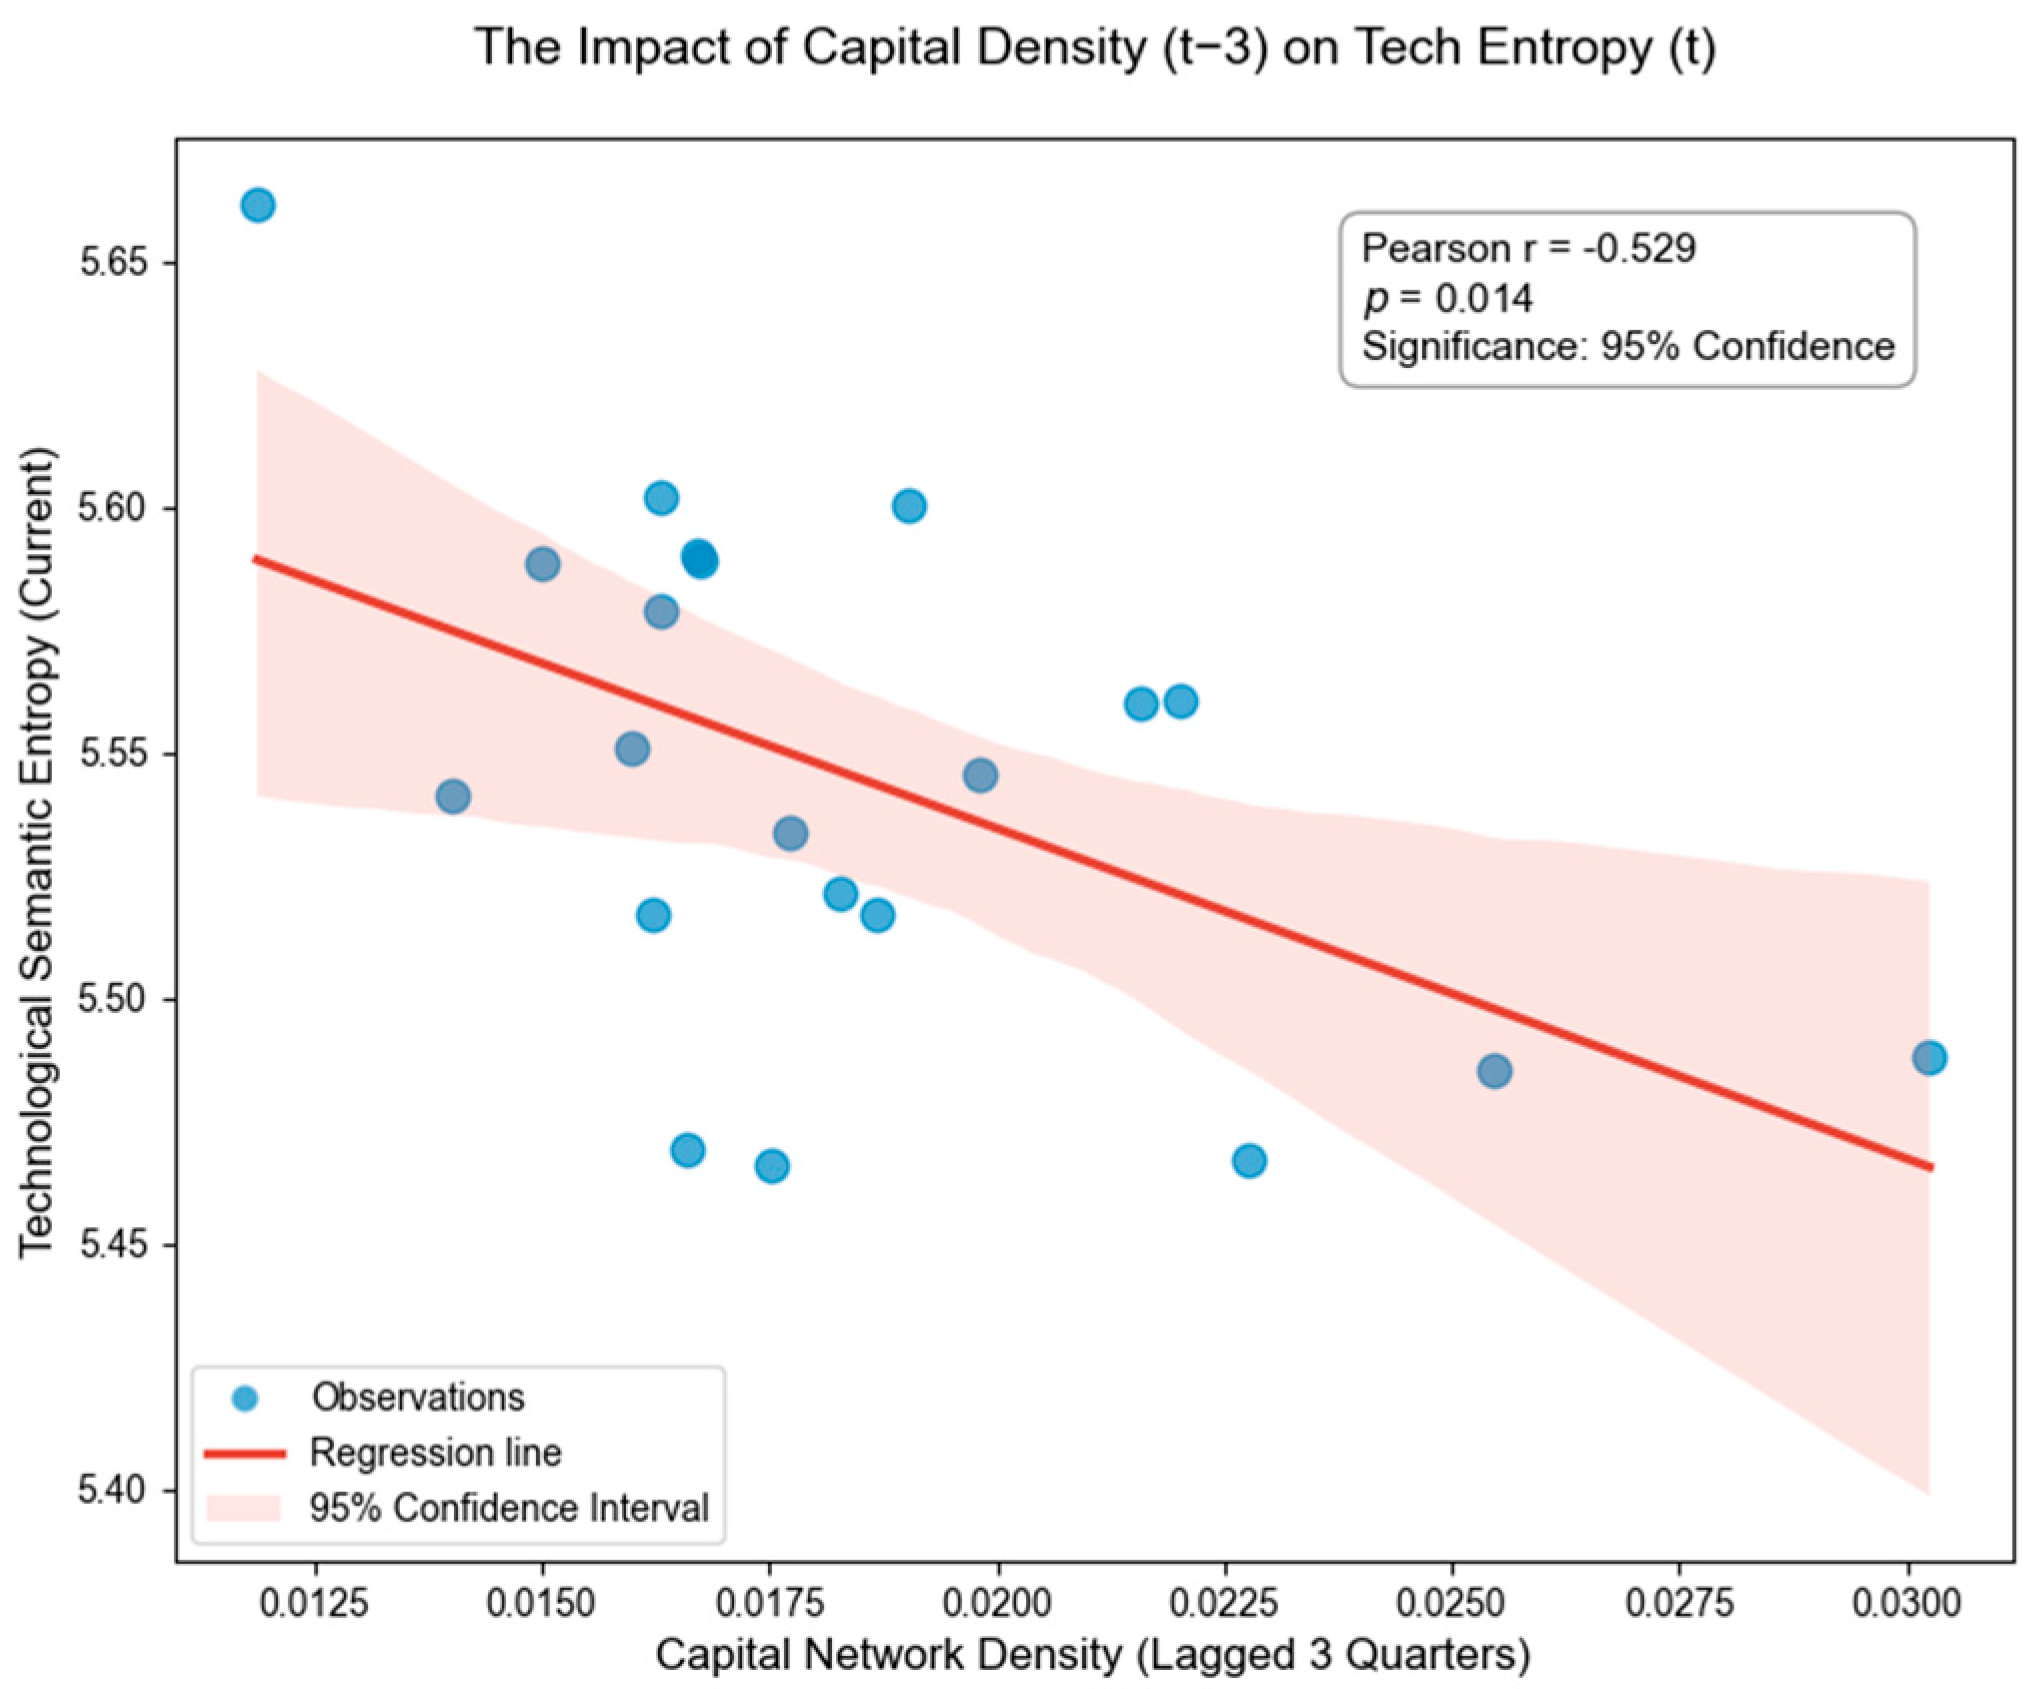
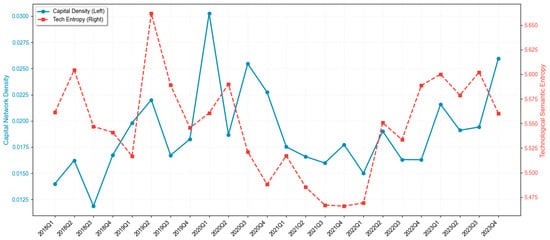
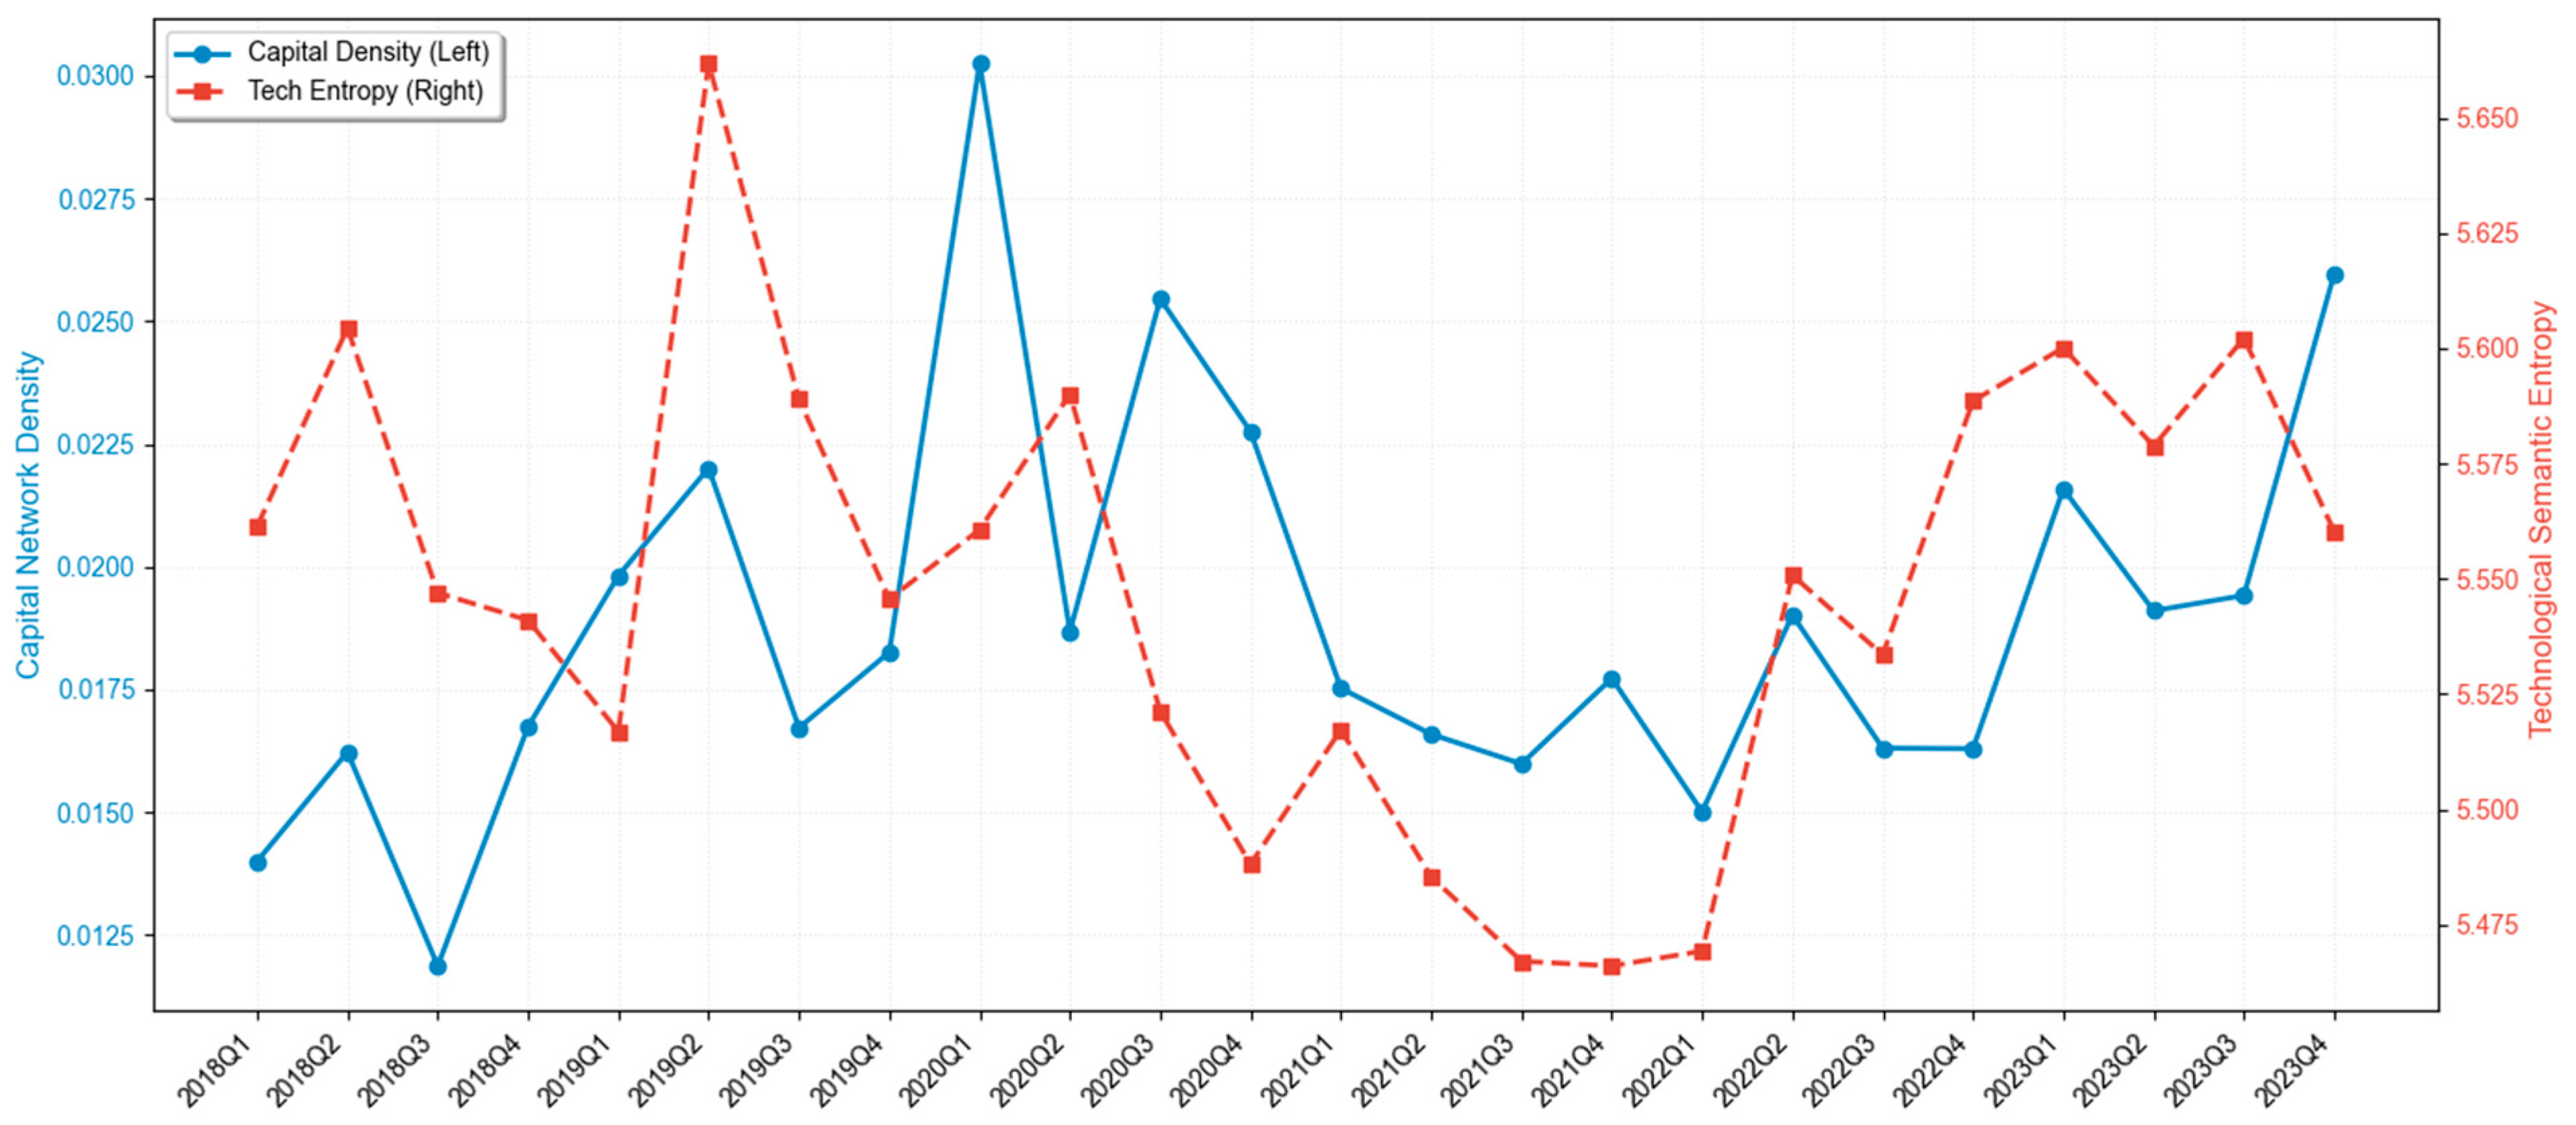

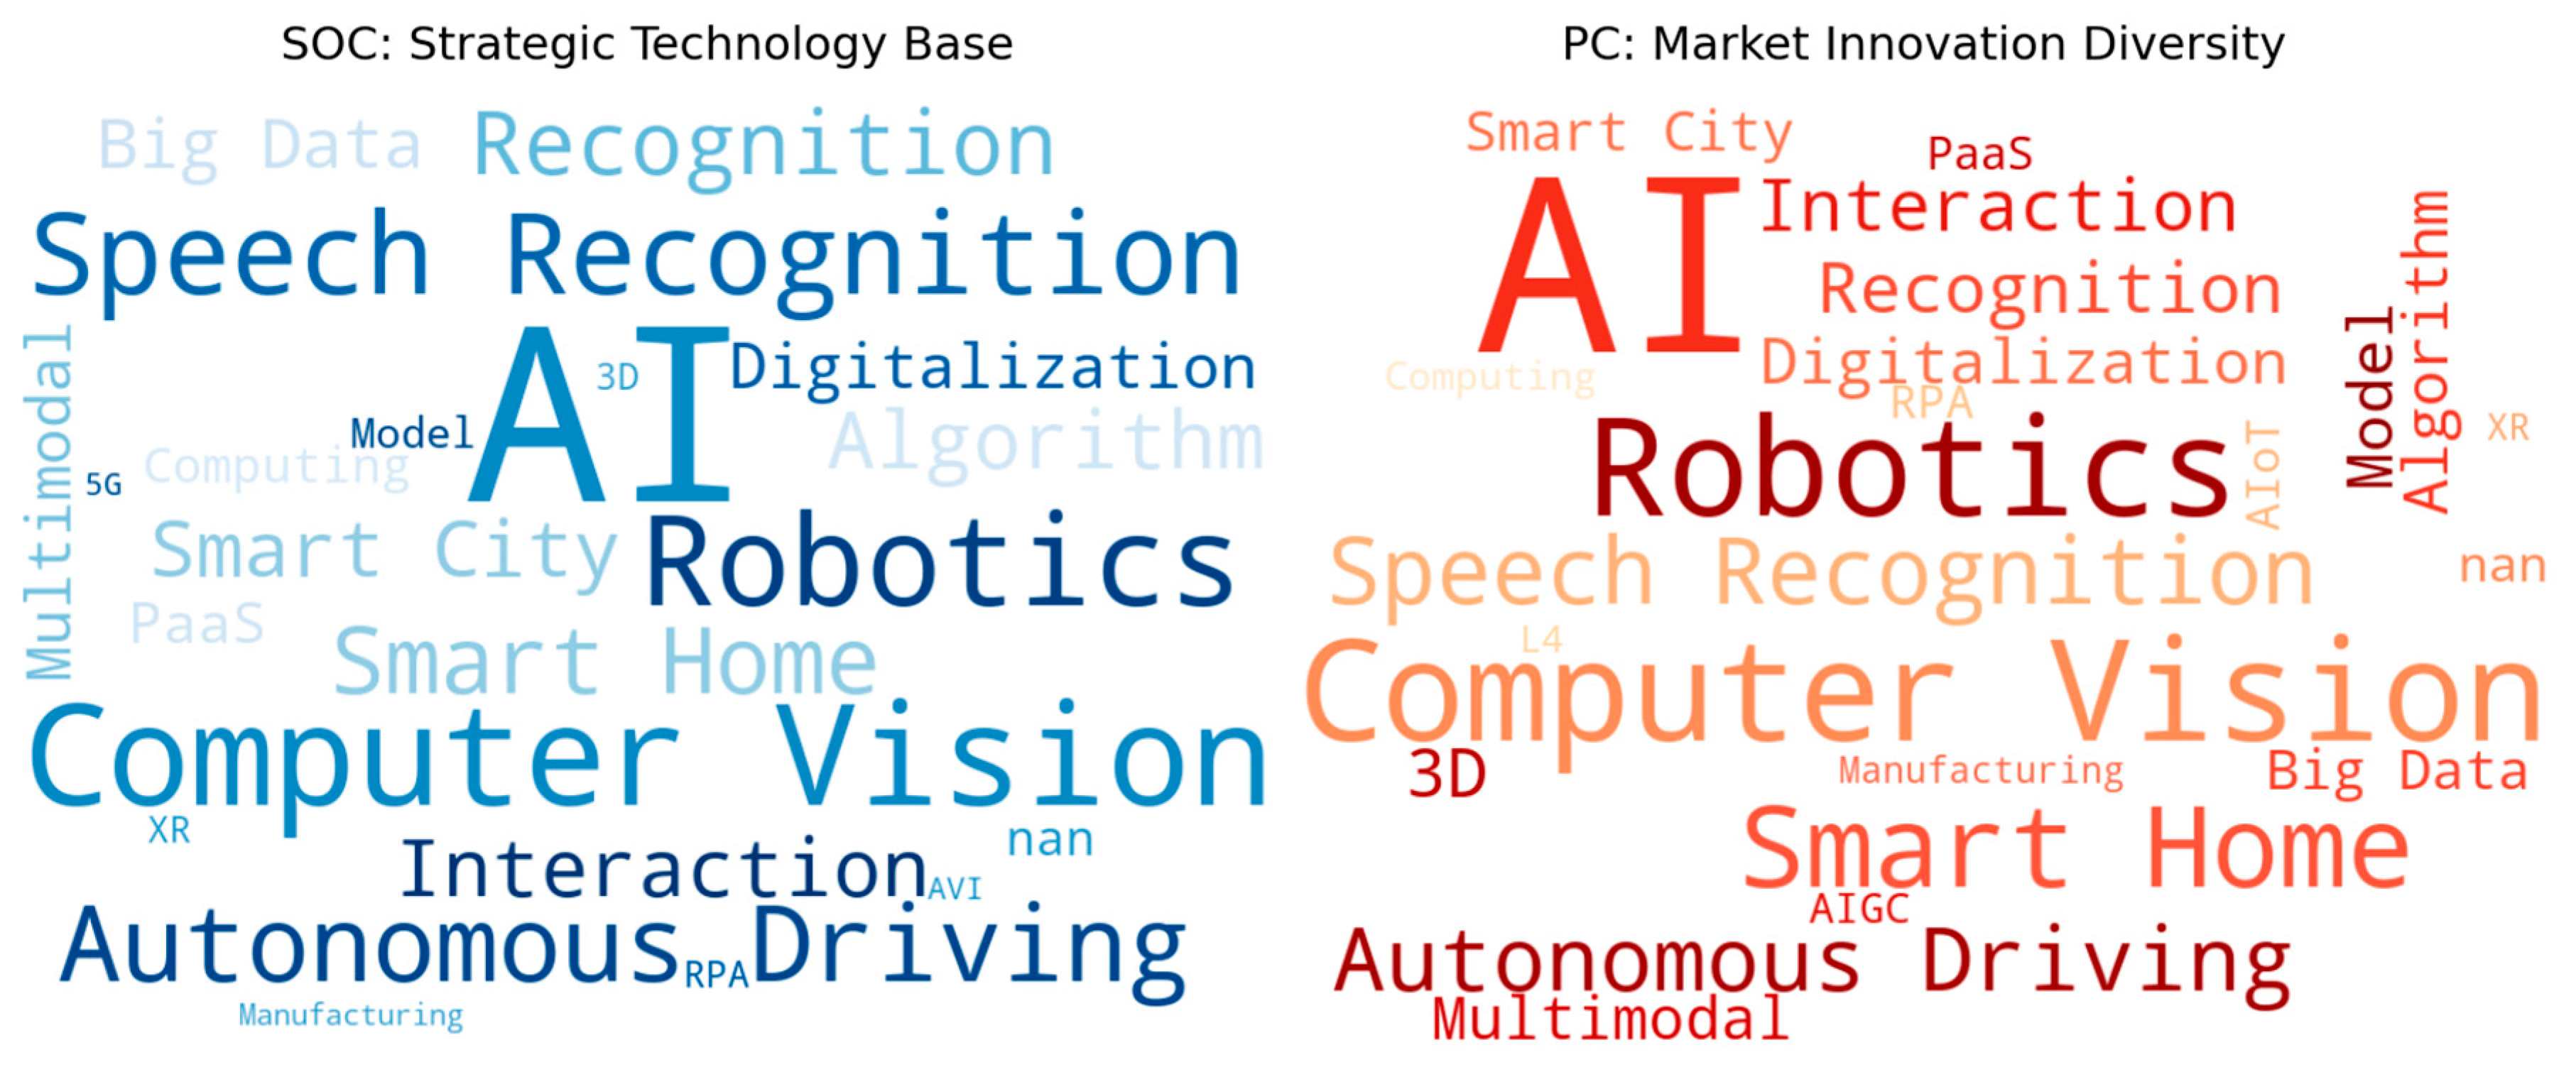
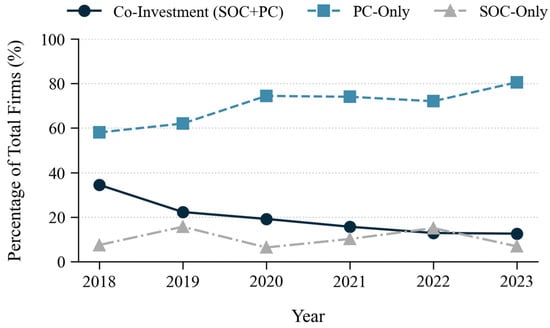
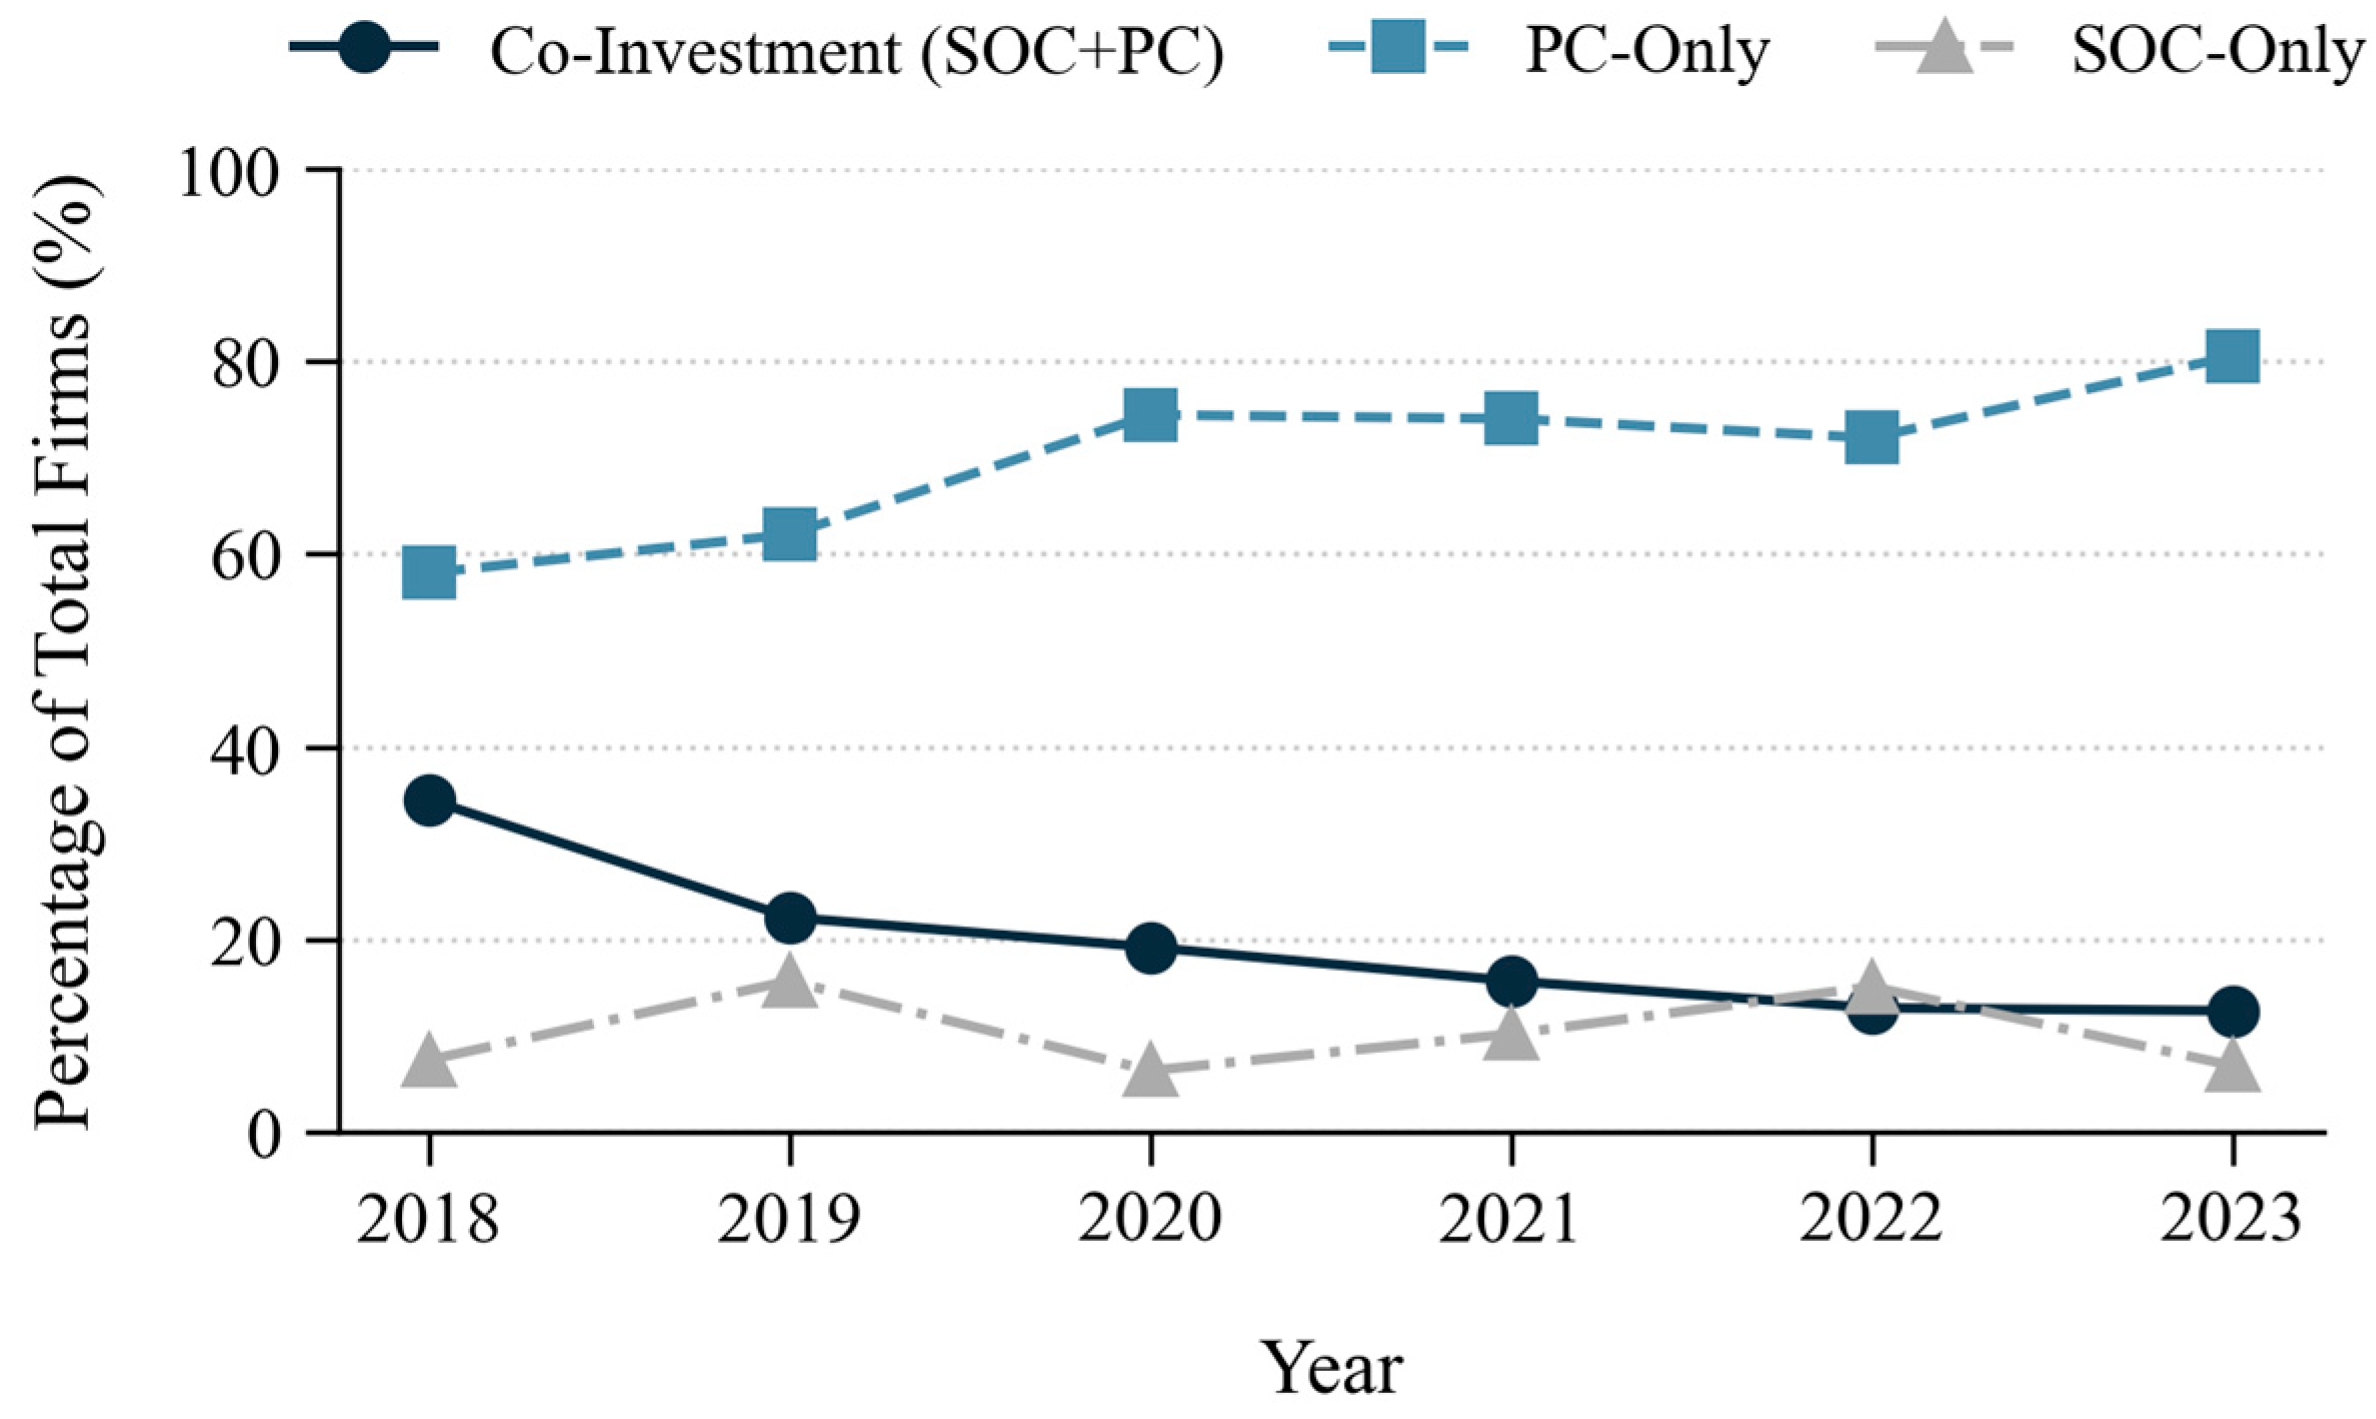
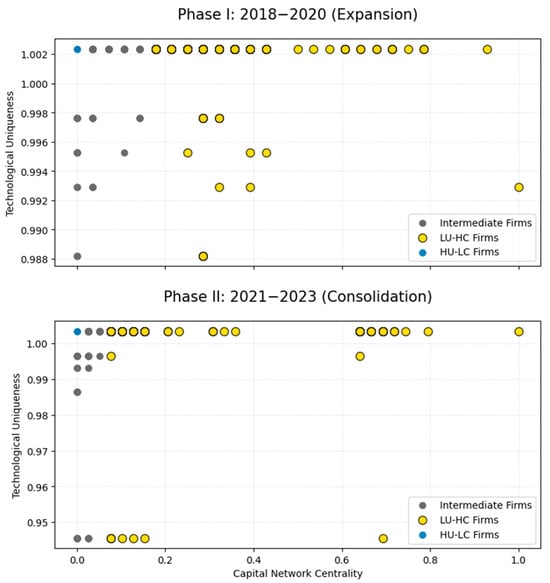
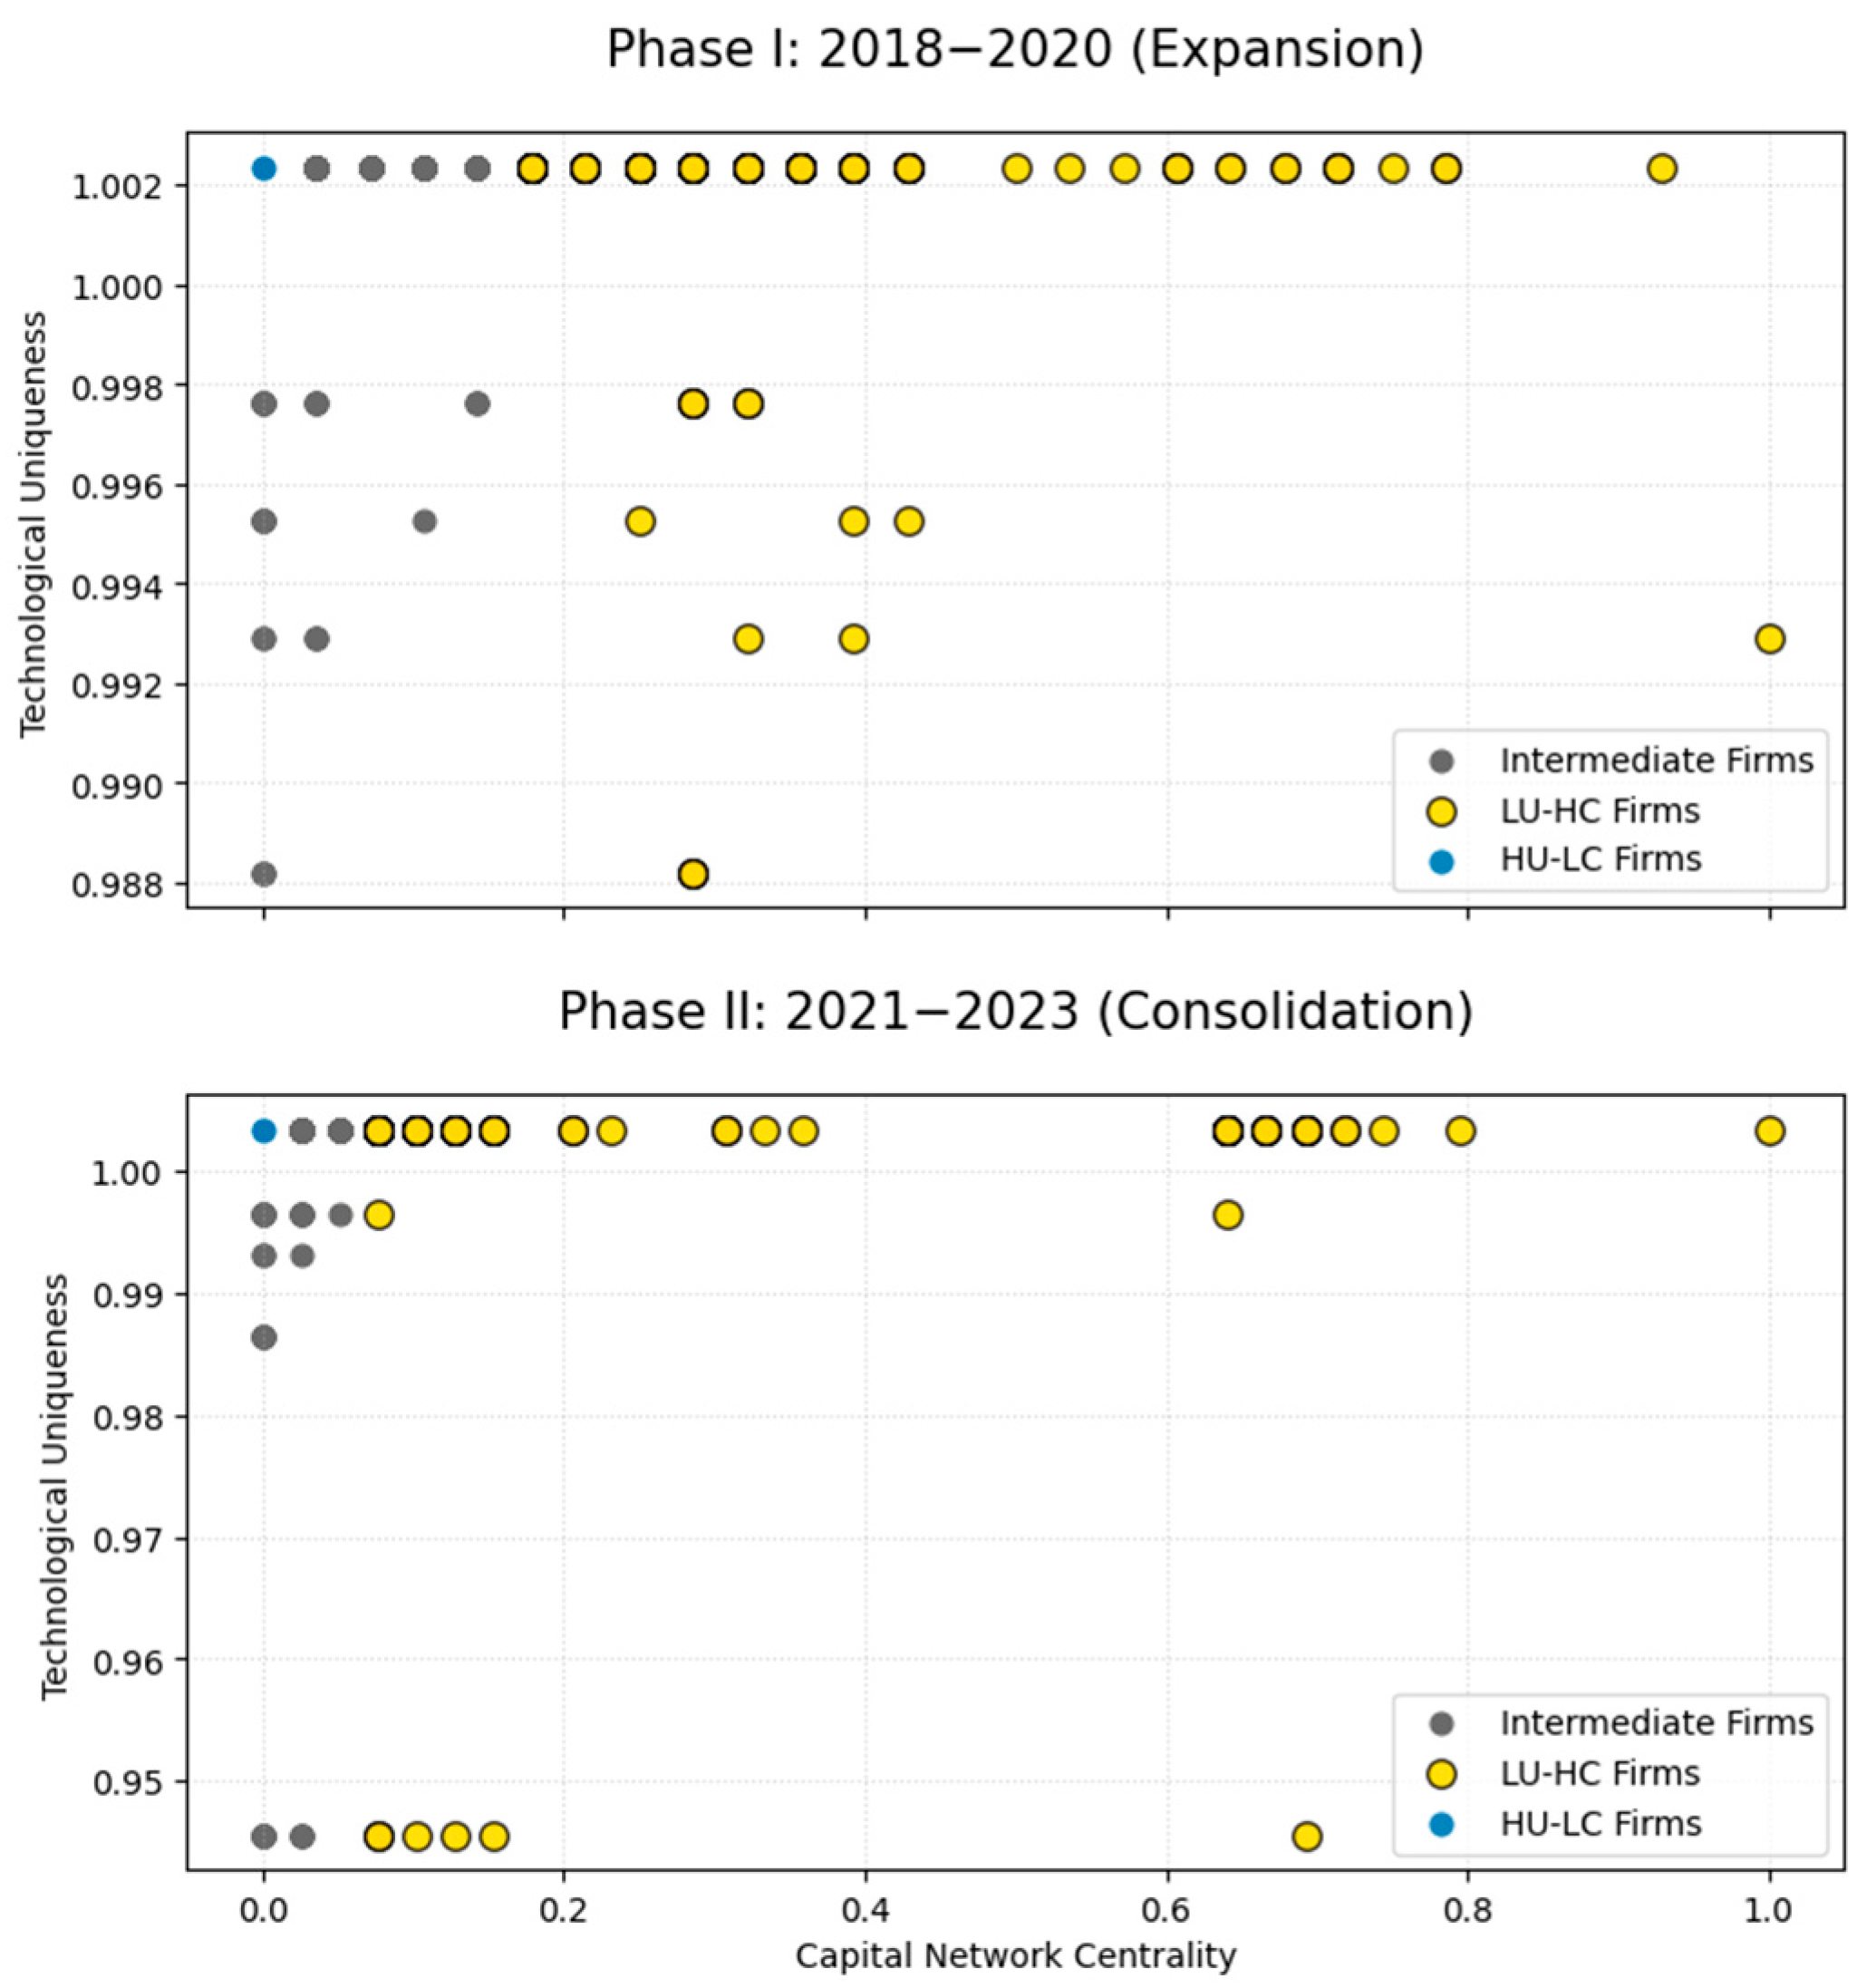
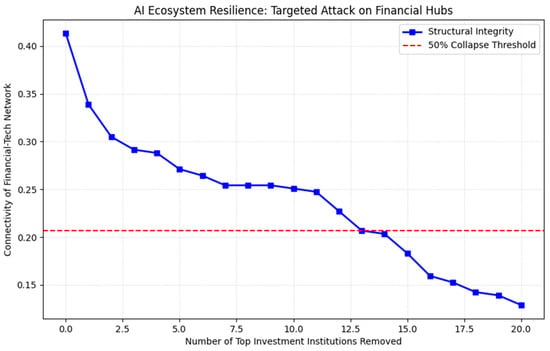
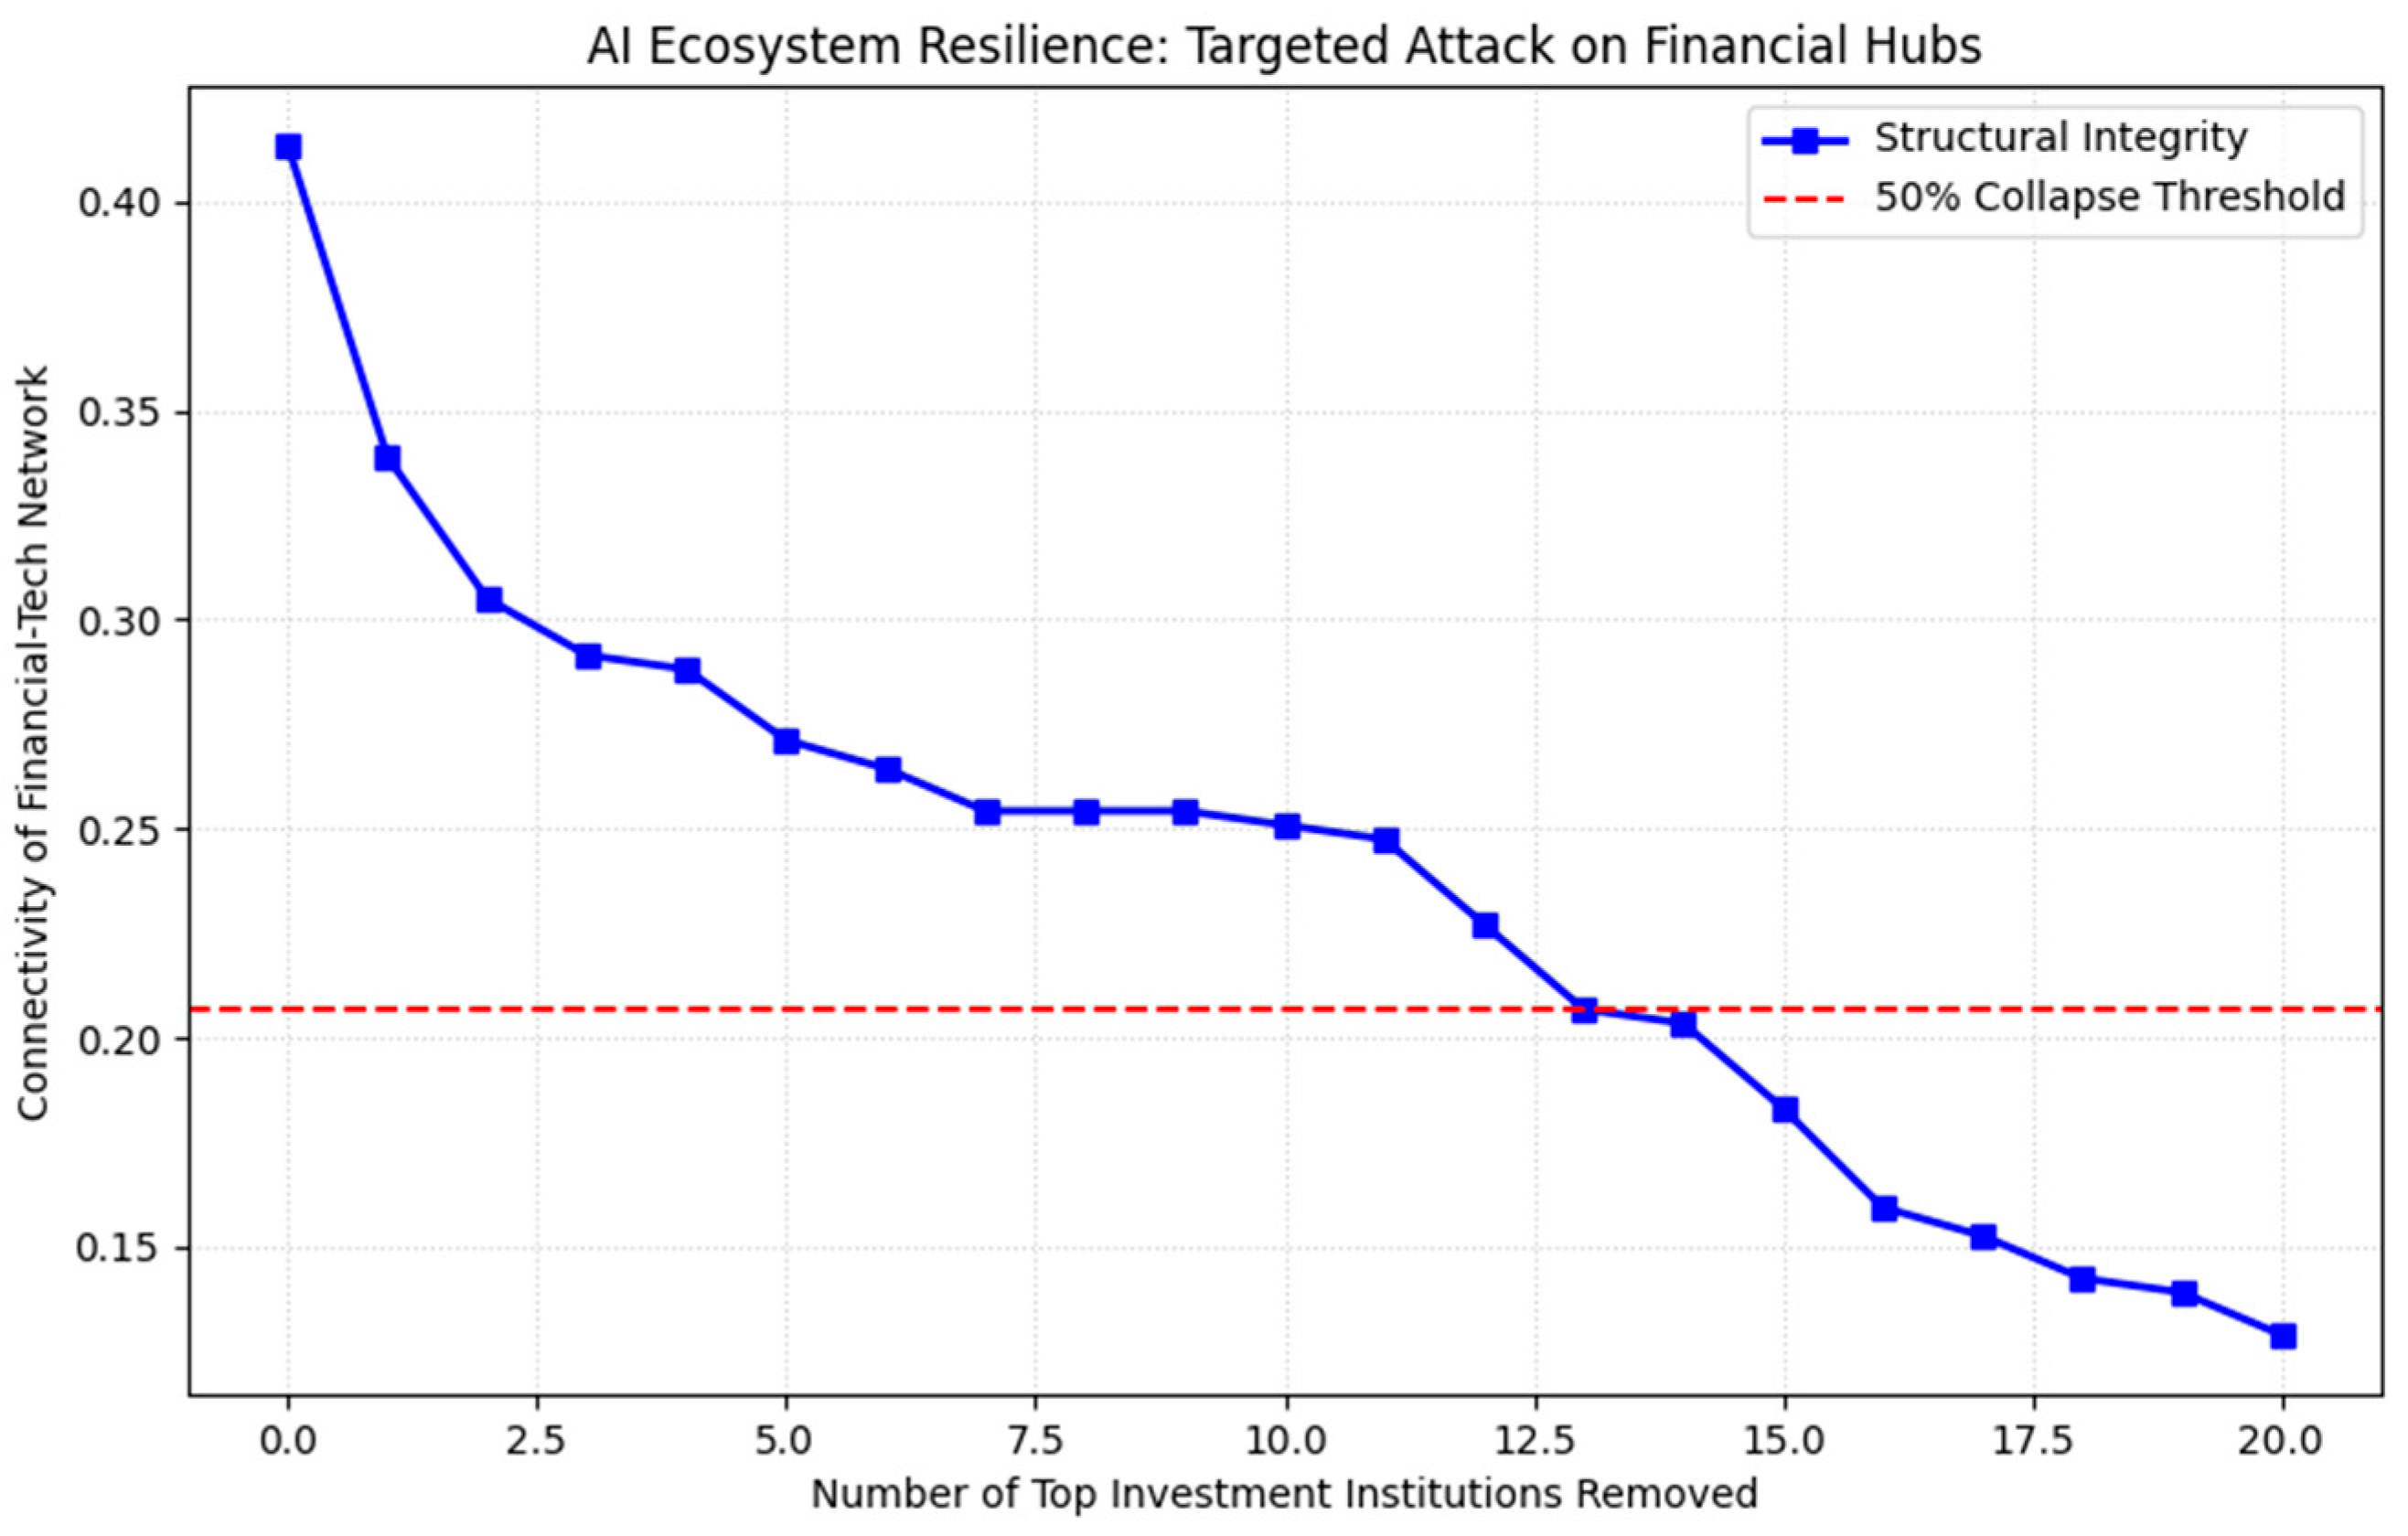

Disclaimer/Publisher’s Note: The statements, opinions and data contained in all publications are solely those of the individual author(s) and contributor(s) and not of MDPI and/or the editor(s). MDPI and/or the editor(s) disclaim responsibility for any injury to people or property resulting from any ideas, methods, instructions or products referred to in the content. |
© 2026 by the authors. Licensee MDPI, Basel, Switzerland. This article is an open access article distributed under the terms and conditions of the Creative Commons Attribution (CC BY) license.