


Abstract
South Asia has experienced a persistent rise in per capita carbon dioxide emissions despite growing policy attention to low-carbon development. Against this background, this study examines how economic growth, energy intensity, renewable energy, urbanization, and trade openness shape per capita carbon dioxide emissions in six South Asian countries over the period 1990–2023. Grounded in the STIRPAT framework, the analysis combines fixed-effect estimation with two-step system generalized method of moments to address unobserved heterogeneity, endogeneity, and emissions persistence. The results show that economic growth remains strongly carbon-intensive, with gross domestic product per capita exhibiting a near-proportional elasticity with emissions. Energy intensity significantly increases emissions, while renewable energy reduces them. Urbanization exerts a positive but smaller effect, whereas trade openness remains statistically fragile. The findings also indicate strong emission persistence, underscoring the importance of early intervention. The study contributes to the regional environmental literature by providing an integrated and dynamic assessment of South Asia’s growth–energy–emissions nexus and by introducing a composite policy-support dimension into the empirical framework. The results offer practical implications for energy efficiency reform, renewable expansion, and climate-sensitive urban policy in developing economies.
1. Introduction
Climate change represents one of the most pressing environmental, social, and economic challenges of the twenty-first century, and its effects are already acutely visible across South Asia, a region that is home to more than 1.9 billion people and includes some of the world’s most climate-vulnerable deltas and rapidly expanding megacities [1]. Over the last two decades, South Asian economies have grown at an average annual rate exceeding five percent [2]. However, this growth has been accompanied by a substantial rise in energy demand, more than three-quarters of which continues to be met by carbon-intensive fossil fuels such as coal and oil [3]. As a result, regional carbon dioxide emissions have risen sharply over time [4].
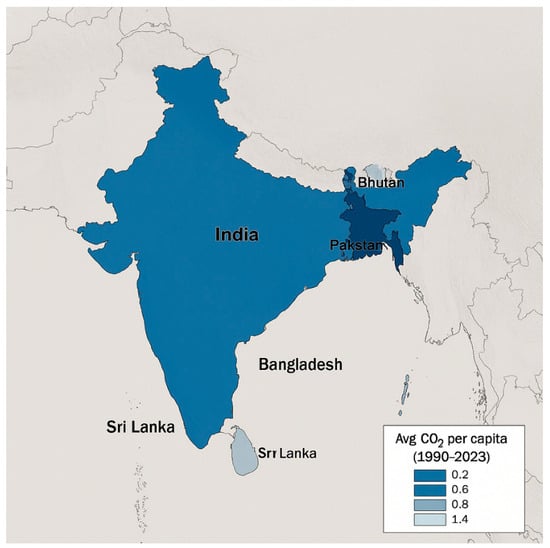
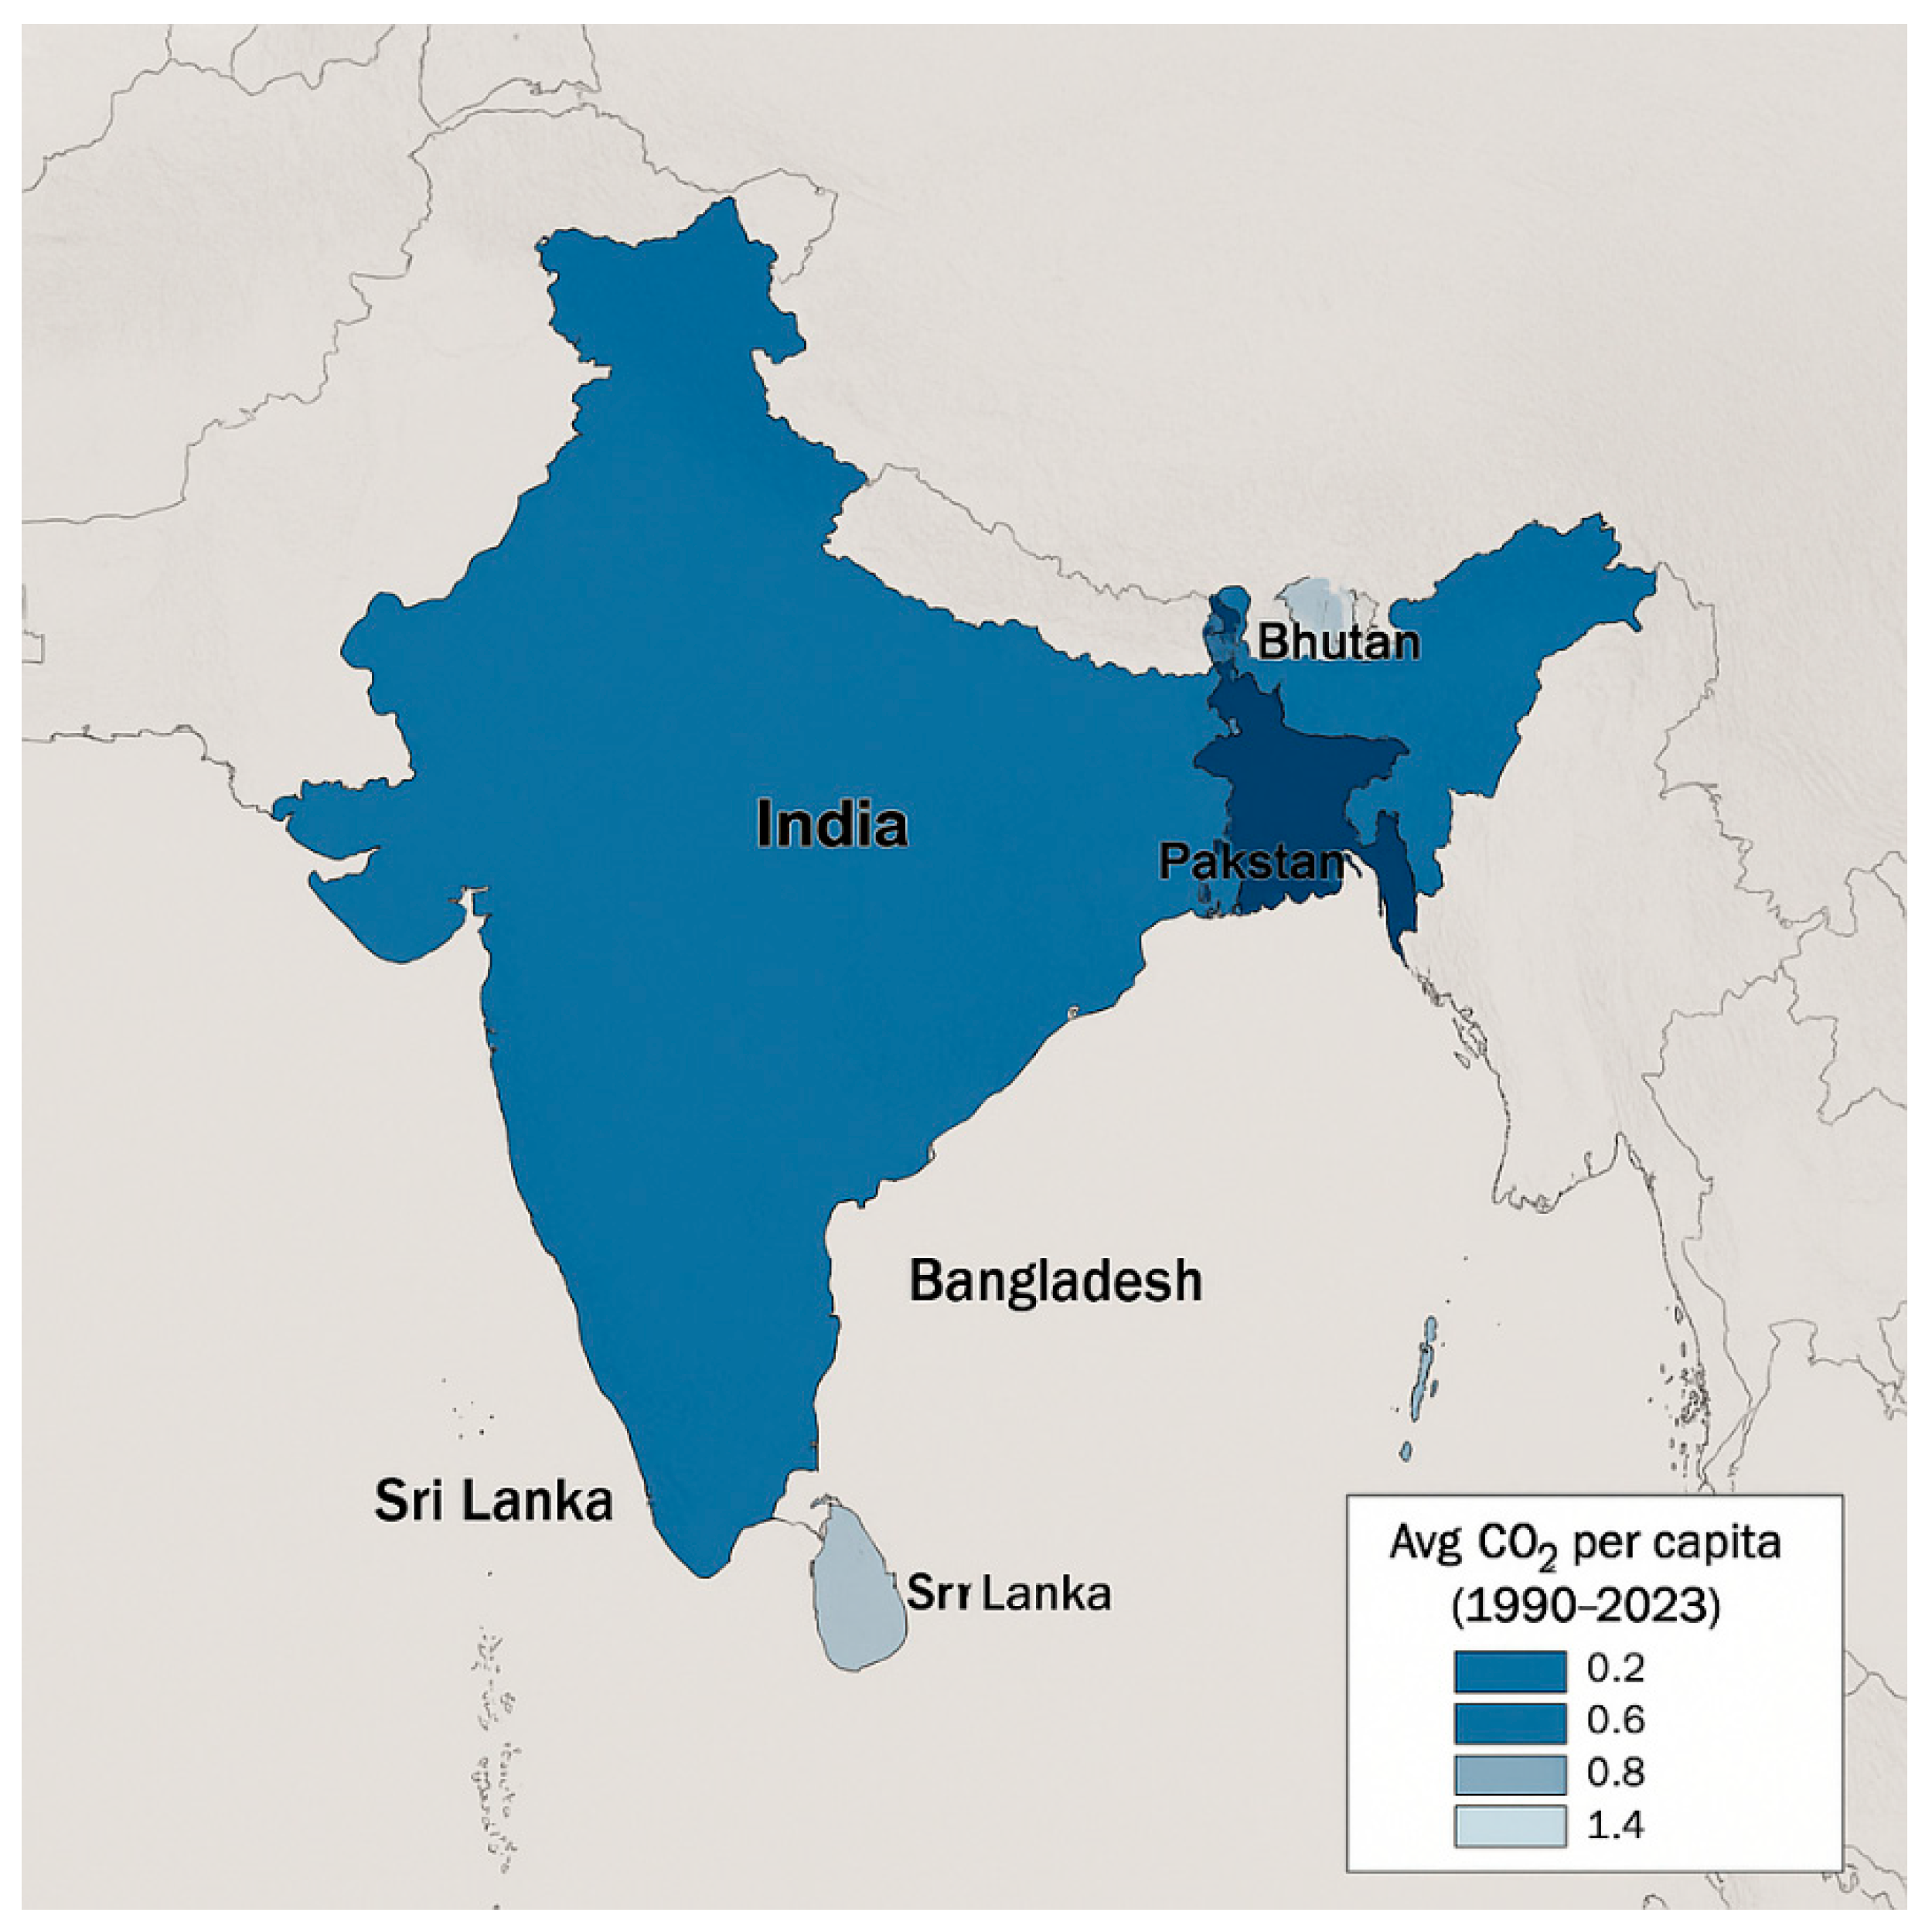
South Asia provides a particularly important setting for this analysis because it combines rapid economic growth, high population pressure, fossil-fuel dependence, and increasing exposure to climate risk [5]. These features make the region a critical case for examining whether growth can be decoupled from rising emissions under conditions of constrained infrastructure, uneven energy transition, and expanding urbanization. Understanding the drivers of emissions in this context is therefore essential not only for regional climate policy, but also for the broader debate on sustainable development in lower- and middle-income economies [6]. Figure 1 below shows the average per capita CO2 emissions across the six South Asian economies.
Figure 1.
Average per capita CO2 emissions across the six South Asian economies (1990–2023).
Understanding the drivers of this emission trajectory is critical for designing effective and equitable mitigation strategies. Scholarship to date has frequently relied on the Environmental Kuznets Curve hypothesis, which proposes an inverted-U relationship between income and environmental degradation, suggesting that pollution rises during early stages of growth before declining as economies mature and adopt cleaner technologies [7]. Evidence for such a turning point within South Asia, however, remains inconclusive: recent econometric studies indicate that per capita emissions continue to climb with rising incomes in Bangladesh and Pakistan, while India shows tentative signs of decoupling through renewable energy deployment and energy-efficiency measures [8].
At the policy level, South Asian governments have signaled growing commitment to low-carbon development through enhanced Nationally Determined Contributions under the Paris Agreement, renewable-energy targets and the phased withdrawal of inefficient fossil-fuel subsidies [9]. India, for instance, has pledged to reduce the emission intensity of its GDP by forty-five percent below 2005 levels by 2030 and achieve 500 GW of non-fossil capacity by the same date, while Pakistan aims to secure sixty percent of renewable electricity and shift to electric vehicles for thirty percent of new sales [10]. Nonetheless, implementation gaps persist, and sub-national disparities in infrastructure, finance and governance capacity raise questions about the extent to which headline ambitions translate into concrete emissions reduction [11]. Rigorous empirical evidence that disentangles the relative influence of demographic pressures, economic growth, technological innovation and institutional quality is therefore indispensable for prioritizing limited public resources.
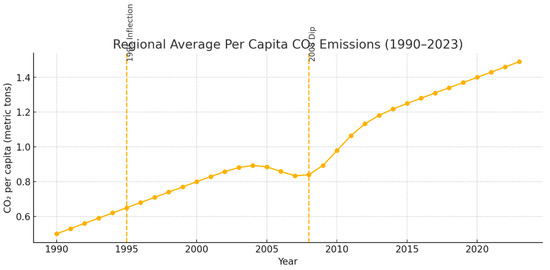
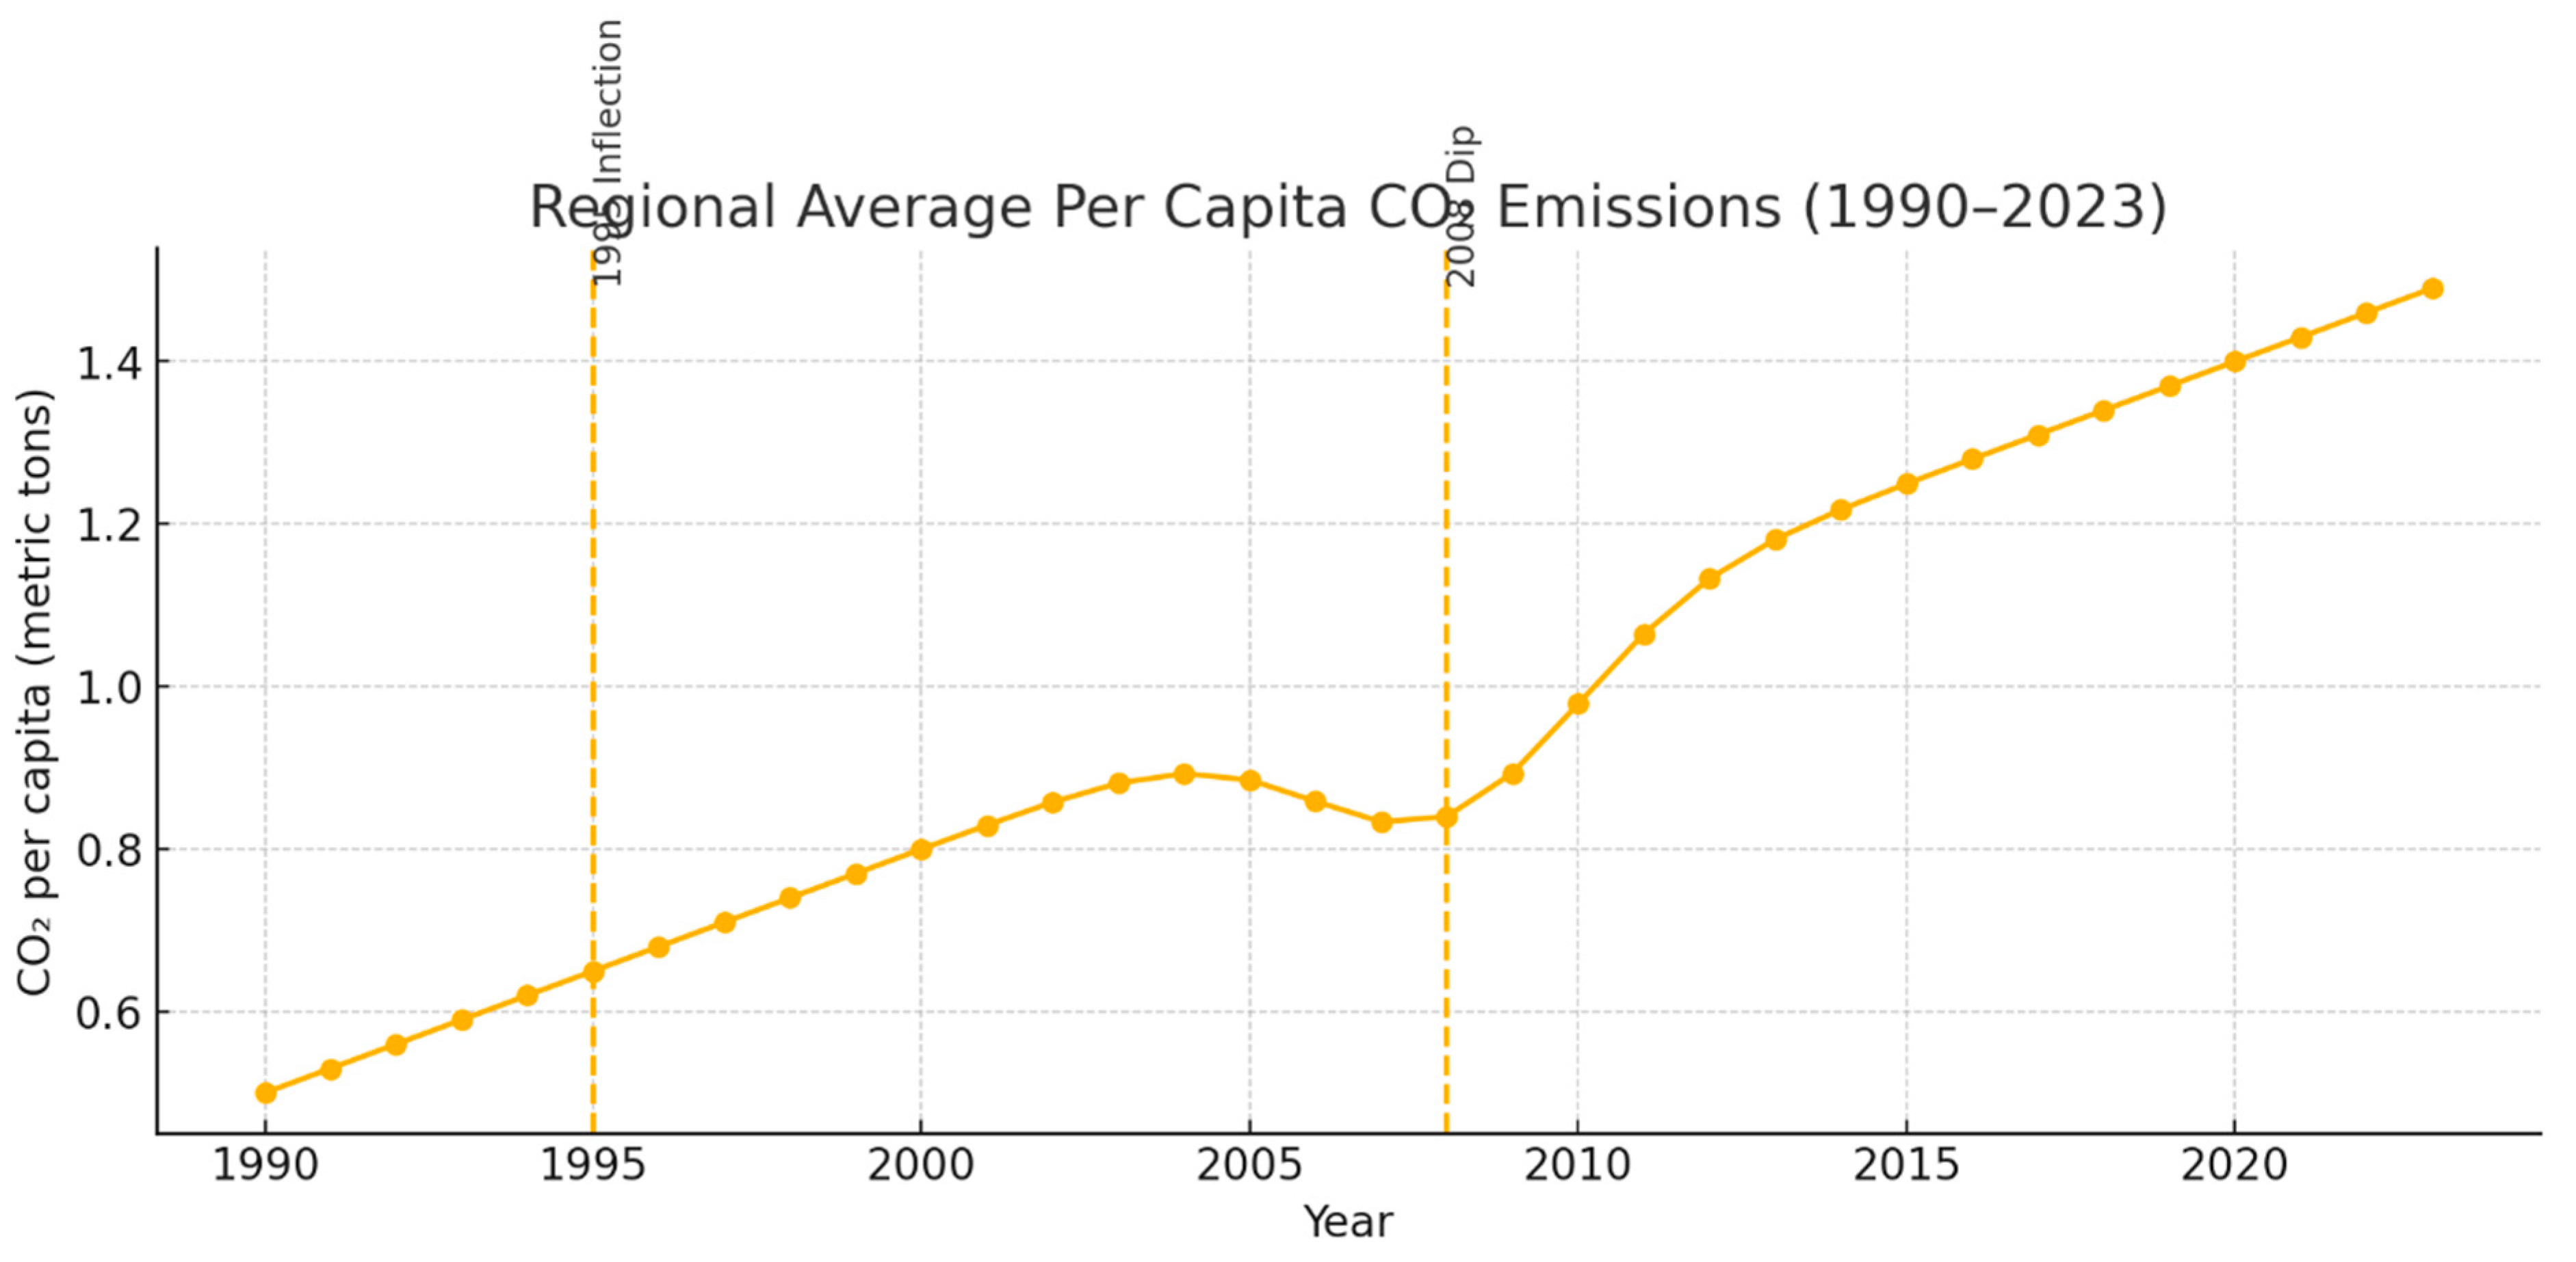
The present study addresses these gaps by constructing a balanced panel dataset for Bangladesh, Bhutan, India, Nepal, Pakistan and Sri Lanka spanning 2000–2023 and analyzing the determinants of carbon-dioxide emissions per capita using the STIRPAT (Stochastic Impacts by Regression on Population, Affluence and Technology) framework [12]. Variables include population size, urbanization rate, GDP per capita, total primary energy consumption, renewable-energy share, research-and-development expenditure and a composite policy-support index that synthesizes information on carbon pricing, subsidy reform, and renewable incentives [13]. Urbanization is particularly important in the South Asian context because rapidly expanding megacities such as Delhi, Mumbai, Dhaka, and Karachi concentrate transport demand, building energy use, construction intensity, and commercial activity [14]. This creates an urban emission premium, whereby urban expansion generates disproportionately high carbon pressure unless it is accompanied by low-carbon transport systems, efficient buildings, and coordinated land-use planning. For this reason, urbanization is treated in this study not merely as a demographic indicator, but as a structural driver of emissions in the regional decarbonization process [15]. Fixed-effect regression models estimated in Stata 17 control for unobserved, time-invariant country characteristics such as geography and historical energy endowments, while cluster-robust standard errors mitigate heteroscedasticity and serial correlation [16]. Diagnostics for multicollinearity, cross-sectional dependence and model stability further bolster inferential credibility. Figure 2 shows the regional average per capita CO2 emissions.
Figure 2.
Regional average per capita CO2 emissions, 1990–2023.
Recognizing these pronounced structural differences, the present study adopts a STIRPAT-based framework to examine how economic expansion, energy structure, and urban transformation shape carbon dioxide emissions in South Asia. Real gross domestic product per capita is included to capture the affluence effect associated with scale expansion and rising consumption. Energy intensity reflects the efficiency with which output is produced and therefore captures the technological burden of energy-inefficient production systems. Renewable energy share measures the degree to which fossil-fuel dependence is replaced by cleaner energy sources, while urbanization captures the structural effects of city growth, infrastructure concentration, and transport demand. Together, these variables provide a policy-relevant basis for identifying the main drivers of regional emissions.
Demography further complicates the picture. A pronounced youth bulge in Pakistan and Bangladesh foreshadows accelerated household formation, urban expansion and consumer demand, all of which elevate energy use unless offset by strict efficiency standards and sustainable urban design [17]. Conversely, Sri Lanka faces an aging population, with implications for healthcare energy demand and income-driven consumption shifts, while Bhutan’s net emigration influences labor markets and remittance-fueled consumption patterns [18]. Capturing such dynamics requires time-varying population and urbanization metrics rather than static snapshots.
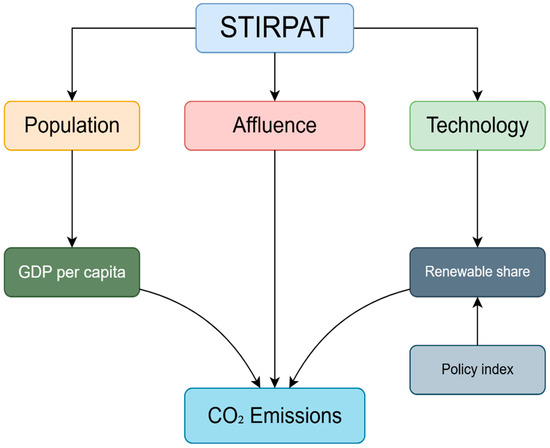
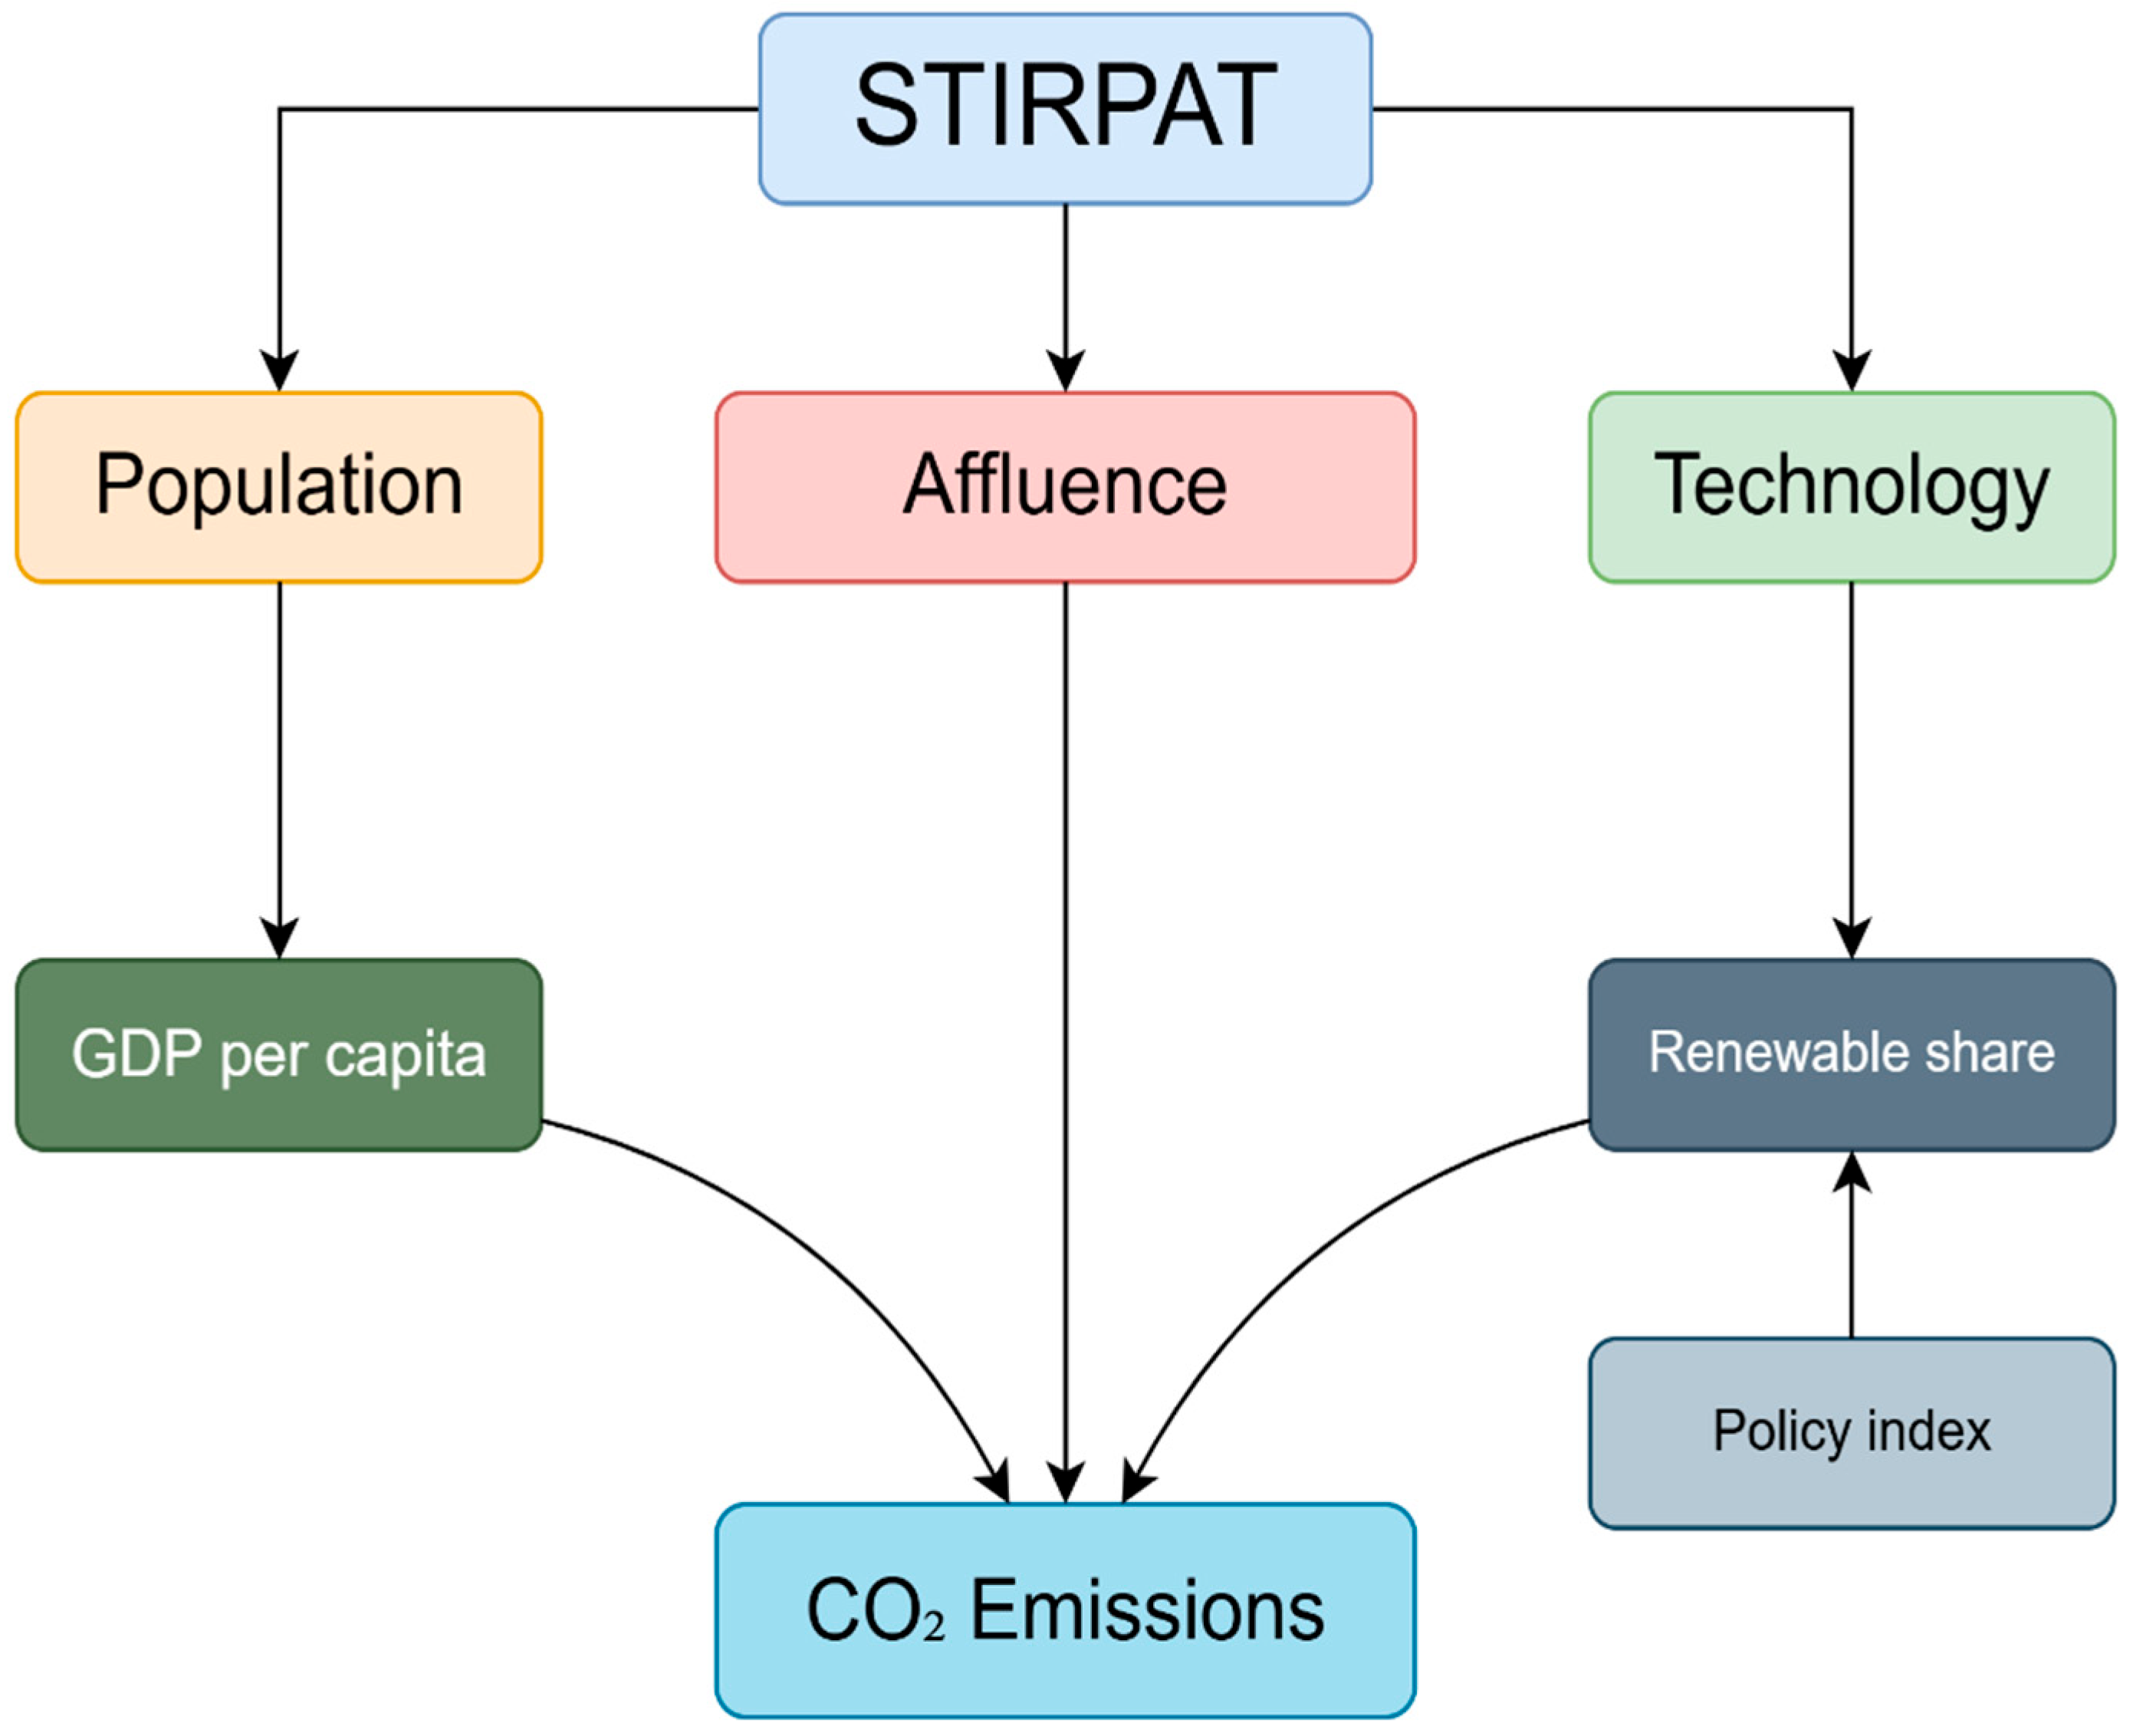
Institutional effectiveness also shapes environmental outcomes by influencing regulatory enforcement, renewable-energy implementation, and the credibility of low-carbon policy commitments. To capture this dimension, the study incorporates a composite policy-support index reflecting institutional commitment to low-carbon transition [19]. By integrating a policy-support index derived from over fifty legislative and strategy documents, the present study tests whether stronger institutional commitment exerts an independent, statistically significant influence on per capita emissions after controlling for socio-economic drivers [20]. Figure 3 shows the STIRPAT conceptual diagram with population, affluence, and technology.
Figure 3.
STIRPAT conceptual diagram showing population, affluence, and technology.
Despite a growing body of the literature on emission dynamics in developing economies, several important gaps remain. First, existing studies on South Asia often focus on a single determinant—such as income, energy use, or urbanization, rather than examining the joint effects of economic growth, energy intensity, renewable energy, trade openness, and urban transformation within a unified framework. Second, many studies rely on static or mean-based estimators that do not fully address endogeneity, emission persistence, and cross-country heterogeneity. Third, the role of policy commitment to low-carbon transition remains underexplored in the regional literature. These limitations leave an incomplete understanding of how structural and energy-related drivers interact to shape South Asia’s carbon trajectory.
This study contributes to the literature in three ways. First, it provides an updated empirical assessment of the growth–energy–emission nexus in South Asia using a long panel covering 1990–2023. Second, it combines fixed-effect estimation with two-step system generalized method of moments, thereby addressing unobserved heterogeneity, endogeneity, and dynamic adjustment in a more rigorous way than many existing regional studies. Third, by incorporating a composite policy-support dimension into the analytical framework, the study adds an institutional perspective to the analysis of emission drivers. In doing so, it offers a more policy-relevant account of South Asia’s decarbonization challenge. A further contribution of the study lies in the construction of a composite policy-support index, which captures institutional commitment to low-carbon transition through a combination of renewable-energy incentives, carbon-pricing instruments, fossil-fuel subsidy reforms, and related policy measures. This allows the analysis to move beyond standard macroeconomic explanations and incorporate a more explicit institutional dimension into the study of emissions dynamics in South Asia [21]. Sensitivity tests applying alternative weightings confirm the robustness of the index, while Cronbach’s alpha of 0.82 indicates strong internal consistency, justifying its use as a composite predictor in the regression models. Insights generated by this study bear directly on regional cooperation debates. Despite repeated SAARC declarations endorsing energy pooling and cross-border power trade, tangible progress has been limited by bilateral tensions and infrastructure bottlenecks [22]. Identifying complementary strengths such as Bhutan’s hydropower surplus, India’s solar manufacturing capacity and Bangladesh’s rapidly expanding green-tech workforce could unlock mutually beneficial decarbonization pathways if underpinned by evidence-based negotiations supported by rigorous analytics like those presented herein [23]. In light of these gaps, the present study investigates three related questions. First, how do economic growth, energy intensity, renewable energy, urbanization, and trade openness affect per capita carbon dioxide emissions in South Asia? Second, to what extent do these relationships remain robust once emission persistence and endogeneity are taken into account? Third, what do these dynamics imply for the region’s low-carbon transition? To answer these questions, the study applies a STIRPAT-based panel framework to six South Asian economies over the period 1990–2023.
2. Literature Review
2.1. Renewable Energy and Environmental Sustainability
Existing evidence for South Asia generally supports a positive association between economic expansion and per capita CO2 emissions, although the magnitude differs across countries and periods [24]. Studies focusing on rapid industrialization and income growth emphasize energy-demand scaling effects, where higher output raises fossil-fuel use unless offset by structural change and efficiency gains [25]. In the present study, this channel is operationalized through real GDP per capita as the Affluence component of the STIRPAT framework. Similarly, ref. [26] explored the relationships between industry (IND), RE, and CO2 emissions across 44 SSA economies from 2000 to 2018. Utilizing a two-step system GMM estimator, the research revealed industrial expansion to be an intensifier of CO2, while renewable electricity output was associated with reduced CO2 emissions. Reference [27] scrutinized the effects of GDP, energy usage, and IND on environmental sustainability in ASEAN countries from 1994 to 2020. Cointegration was confirmed, and the outcomes disclosed an undesirable long-run linkage between GDP and environmental sustainability, while RE is negatively linked to environmental degradation. Reference [28] delved into RE and CO2 emissions association in ASEAN countries, spanning nine nations from 1990–2019. Using the PMG-ARDL estimation method, the research identified the short-term existence of (EKC). It emphasized RE’s mediating impact on the link between IND and CO2 emissions.
H1.
Renewable energy share has a negative effect on per capita carbon dioxide emissions.
2.2. Technology Innovation and Environmental Sustainability
Empirical work increasingly treats Technology as a multidimensional construct that captures both efficiency and the carbon content of energy supply. Energy intensity (energy used per unit of output) is widely used as a summary measure of production efficiency and the extent of reliance on energy-inefficient infrastructure [29]. Complementarily, a higher renewable energy share reflects substitution away from carbon-intensive sources and is typically associated with lower emissions, though effects can be non-linear and policy-dependent. These two variables are retained in our core specification to represent distinct technological channels relevant to South Asian economies. In this connection, ref. [30] inspected the association between energy intensity and environmental sustainability in N-11 economies during 2000–2018. By employing the SGMM model, the results discovered that DIGI enhances environmental quality. Likewise, ref. [31] delved into the interconnected dynamics of DIGI, innovation and GDP, environmental sustainability in Chinese provinces from 2012 to 2018. The outcome of their study proved that innovation enhances environmental sustainability. In line with this, ref. [32] scrutinized the effects of DIGI on environmental sustainability in China from 2011 to 2019. Based on DID model, the results confirmed that digitalization improves innovation and sustainability in China. Additionally, ref. [33] also uncovered that DIGI and economic innovations in top hydrogen economies more effectively reducing CO2 emissions. This suggests that the current direction of innovation and DIGI needs to address the degradation problem adequately. Ref. [34] in a study examined the linkage between DIGI and environmental sustainability in China. Results of the study showed that DIGI and environmental sustainability have a feedback association. Based on above discussion, the following hypothesis can be formulated.
H2.
Energy intensity has a positive effect on per capita carbon dioxide emissions.
2.3. Literature Gap
The present study is informed by both the Environmental Kuznets Curve and Ecological Modernization Theory, but neither framework fully explains South Asia’s emissions trajectory on its own. The Environmental Kuznets Curve suggests that environmental degradation may initially rise with income before declining at later stages of development, while Ecological Modernization Theory emphasizes the role of technological upgrading, institutional reform, and cleaner production in reconciling growth with environmental stewardship. However, South Asia’s lower- and lower-middle-income development profile complicates both perspectives. The region remains characterized by fossil-fuel dependence, uneven institutional capacity, infrastructure deficits, and rapid urban expansion, which limit the extent to which growth can naturally transition into environmental improvement. For this reason, South Asia represents not a setting in which ecological modernization can be assumed, but a critical case for examining whether growth, energy transition, and policy support can realistically produce decarbonization under constrained structural conditions. Further, despite a growing body of work on emission dynamics in developing economies, several gaps remain. First, existing studies on South Asia often focus on individual drivers of emissions rather than examining economic growth, energy intensity, renewable energy, urbanization, trade openness, and policy support within a unified framework. Second, many studies rely on static or mean-based estimators and therefore do not adequately address endogeneity, persistence, and cross-country heterogeneity. Third, the institutional dimension of low-carbon transition remains relatively underexplored in the South Asian context. Additionally, in South Asia, emission dynamics differ sharply across countries, and likely within states and megacities, due to variations in industrial structure, energy systems, urban form, and governance capacity. At the same time, conventional mean-based models often fail to capture persistence, thresholds, asymmetric responses, and cross-sectional dependence. This creates a gap in understanding how economic growth, energy intensity, renewable transition, urbanization, and policy support interact under heterogeneous environmental conditions.
3. Methodology
This study employs the STIRPAT framework as the main theoretical basis for modeling carbon dioxide emissions in South Asia. As a stochastic reformulation of the IPAT identity, STIRPAT allows environmental pressure to be examined as a function of population, affluence, and technology within an econometric setting. This provides an appropriate foundation for estimating the effects of growth, energy intensity, renewable energy, urbanization, and trade openness on emissions. The STIRPAT framework is adopted because it provides a flexible econometric extension of the IPAT identity and allows environmental pressure to be modeled as a function of demographic, affluence, and technology-related factors within a panel-data setting. This makes it particularly suitable for examining how growth, energy efficiency, renewable transition, urbanization, and trade shape emission outcomes across South Asian economies. The baseline STIRPAT can be written as follows:
By taking logarithms:
Since the final empirical model uses emissions, GDP per capita, energy intensity, renewable share, urbanization, and trade openness, it can be written as follows:
The lagged dependent variable in a dynamic form:
where denotes per capita carbon dioxide emissions in country at time ; represents real gross domestic product per capita and captures the affluence effect; is energy intensity as a proxy for technological efficiency; is the renewable energy share; is the urbanization rate; denotes trade openness; captures country-specific fixed effects; denotes time effects; and is the error term.
The empirical strategy combines static and dynamic estimators to address different econometric concerns. Fixed effects control for unobserved time-invariant country heterogeneity, Driscoll–Kraay standard errors provide robust inference under heteroskedasticity, serial correlation, and cross-sectional dependence, and System-GMM serves as a robustness estimator to address endogeneity and emissions persistence. Hausman specification tests favored fixed-effect models for robustness, and Driscoll–Kraay standard errors were reported to correct for cross-sectional dependence. Variance-inflation factors computed for all explanatory variables including our expanded affluence proxies (GDP per capita, resource rents, fossil-fuel consumption and renewable-energy consumption), the technology proxy (energy intensity), and demographic and trade controls remained well below the conventional threshold of five. The composite policy-support index is constructed from the following five sub-components: renewable-energy feed-in tariffs, auction mechanisms, carbon pricing, fossil-fuel subsidy reforms, and public-sector research grants. Each component is first normalized to a 0–1 scale and then aggregated using equal weights of 0.20 in the baseline specification. This weighting structure is intended to provide a transparent and replicable measure of institutional commitment to low-carbon transition. Sensitivity checks using alternative weighting structures produced qualitatively similar results. This indicates no serious multicollinearity among the regressors. Residual diagnostics, including the Wooldridge test for serial correlation, the Pesaran cross-dependence test and the Breusch–Pagan test for heteroskedasticity, validated overall model adequacy. Table 1 below shows the summary of variables, definitions, units, and data sources.
Table 1.
Summary of variables, definitions, units, and data sources.
To contextualize the quantitative findings, we conducted a systematic desk review of forty-two peer-reviewed studies published between 2018 and 2024 that focus on South Asian emission drivers and policy responses. The review followed PRISMA guidelines: records were identified through Scopus and Web of Science, screened with predefined inclusion criteria and charted in an Excel matrix. Thematic synthesis in NVivo revealed three recurrent narratives energy-mix transition barriers, institutional governance gaps and socio-behavioral inertia that informed interpretation of the econometric results. Triangulation enhanced internal validity by corroborating quantitative patterns with insights from the literature.
Ethical approval was not required because the research relied exclusively on publicly available secondary data and did not involve human participants. Data handling complied with UK Research and Innovation policy on transparency and confidentiality. All Stata do-files and cleaned datasets have been archived in an open-science repository to facilitate replicability. This integrated methodology therefore combined rigorous panel-econometric analysis with qualitative synthesis to provide a comprehensive, policy-relevant understanding of South Asia’s CO2 emission dynamics.
Estimation Strategy and Robustness Checks
The baseline results are estimated using the within (fixed-effect) estimator with year effects, which control for unobserved time-invariant national characteristics and common annual shocks. Given evidence of cross-sectional dependence in South Asia (e.g., shared oil-price shocks and regional spillovers), inference is based on Driscoll–Kraay standard errors that are robust to heteroskedasticity, serial correlation, and general forms of cross-sectional dependence. To address potential endogeneity concerns (reverse causality between emissions and income/energy structure), the manuscript also reports dynamic panel estimates using System-GMM as a sensitivity analysis, while explicitly acknowledging the small-N setting and applying standard safeguards (collapsed instrument sets and restricted lag depth) to limit instrument proliferation.
4. Results
4.1. Descriptive Statistics and Trend Analysis
Table 2 presents the core descriptive statistics for the balanced panel of six South Asian countries covering the period 1990–2023. Mean per capita CO2 emissions equaled 1.12 t, with a standard deviation of 0.46 t, signaling moderate variability around the regional average. India displayed the highest mean emissions (1.45 t) followed by Pakistan (1.02 t), whereas Bhutan and Nepal recorded notably lower averages of 0.52 t and 0.37 t respectively. Economic output, proxied by real GDP per capita (constant 2015 USD), showed a mean of 2367 USD with a wide dispersion indicative of divergent developmental stages. Energy intensity averaged 4.80 MJ per dollar of GDP, suggesting heavy reliance on inefficient fossil-fuel infrastructure. The renewable share of total primary energy supply stood at 19 percent but ranged from just 5.1 percent in Pakistan to 98.5 percent in Bhutan, reflecting stark differences in hydropower endowments and policy priorities.
Table 2.
Summary statistics for key study variables.
The temporal narrative reinforced these cross-sectional contrasts, traced a near-monotonic increase in regional average emissions, punctuated by the following three inflection points: the mid-1990 growth surge linked to economic liberalization in India, the 2008–2009 slowdown triggered by the global financial crisis, and the sharp rebound after 2010 when South Asian economies embraced infrastructural mega-projects. A country-by-country decomposition confirmed that India accounted for roughly two-thirds of the net regional increase during the sample period, underscoring its outsized influence on aggregate trends.
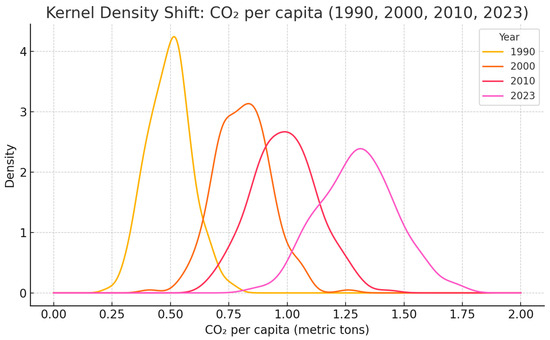
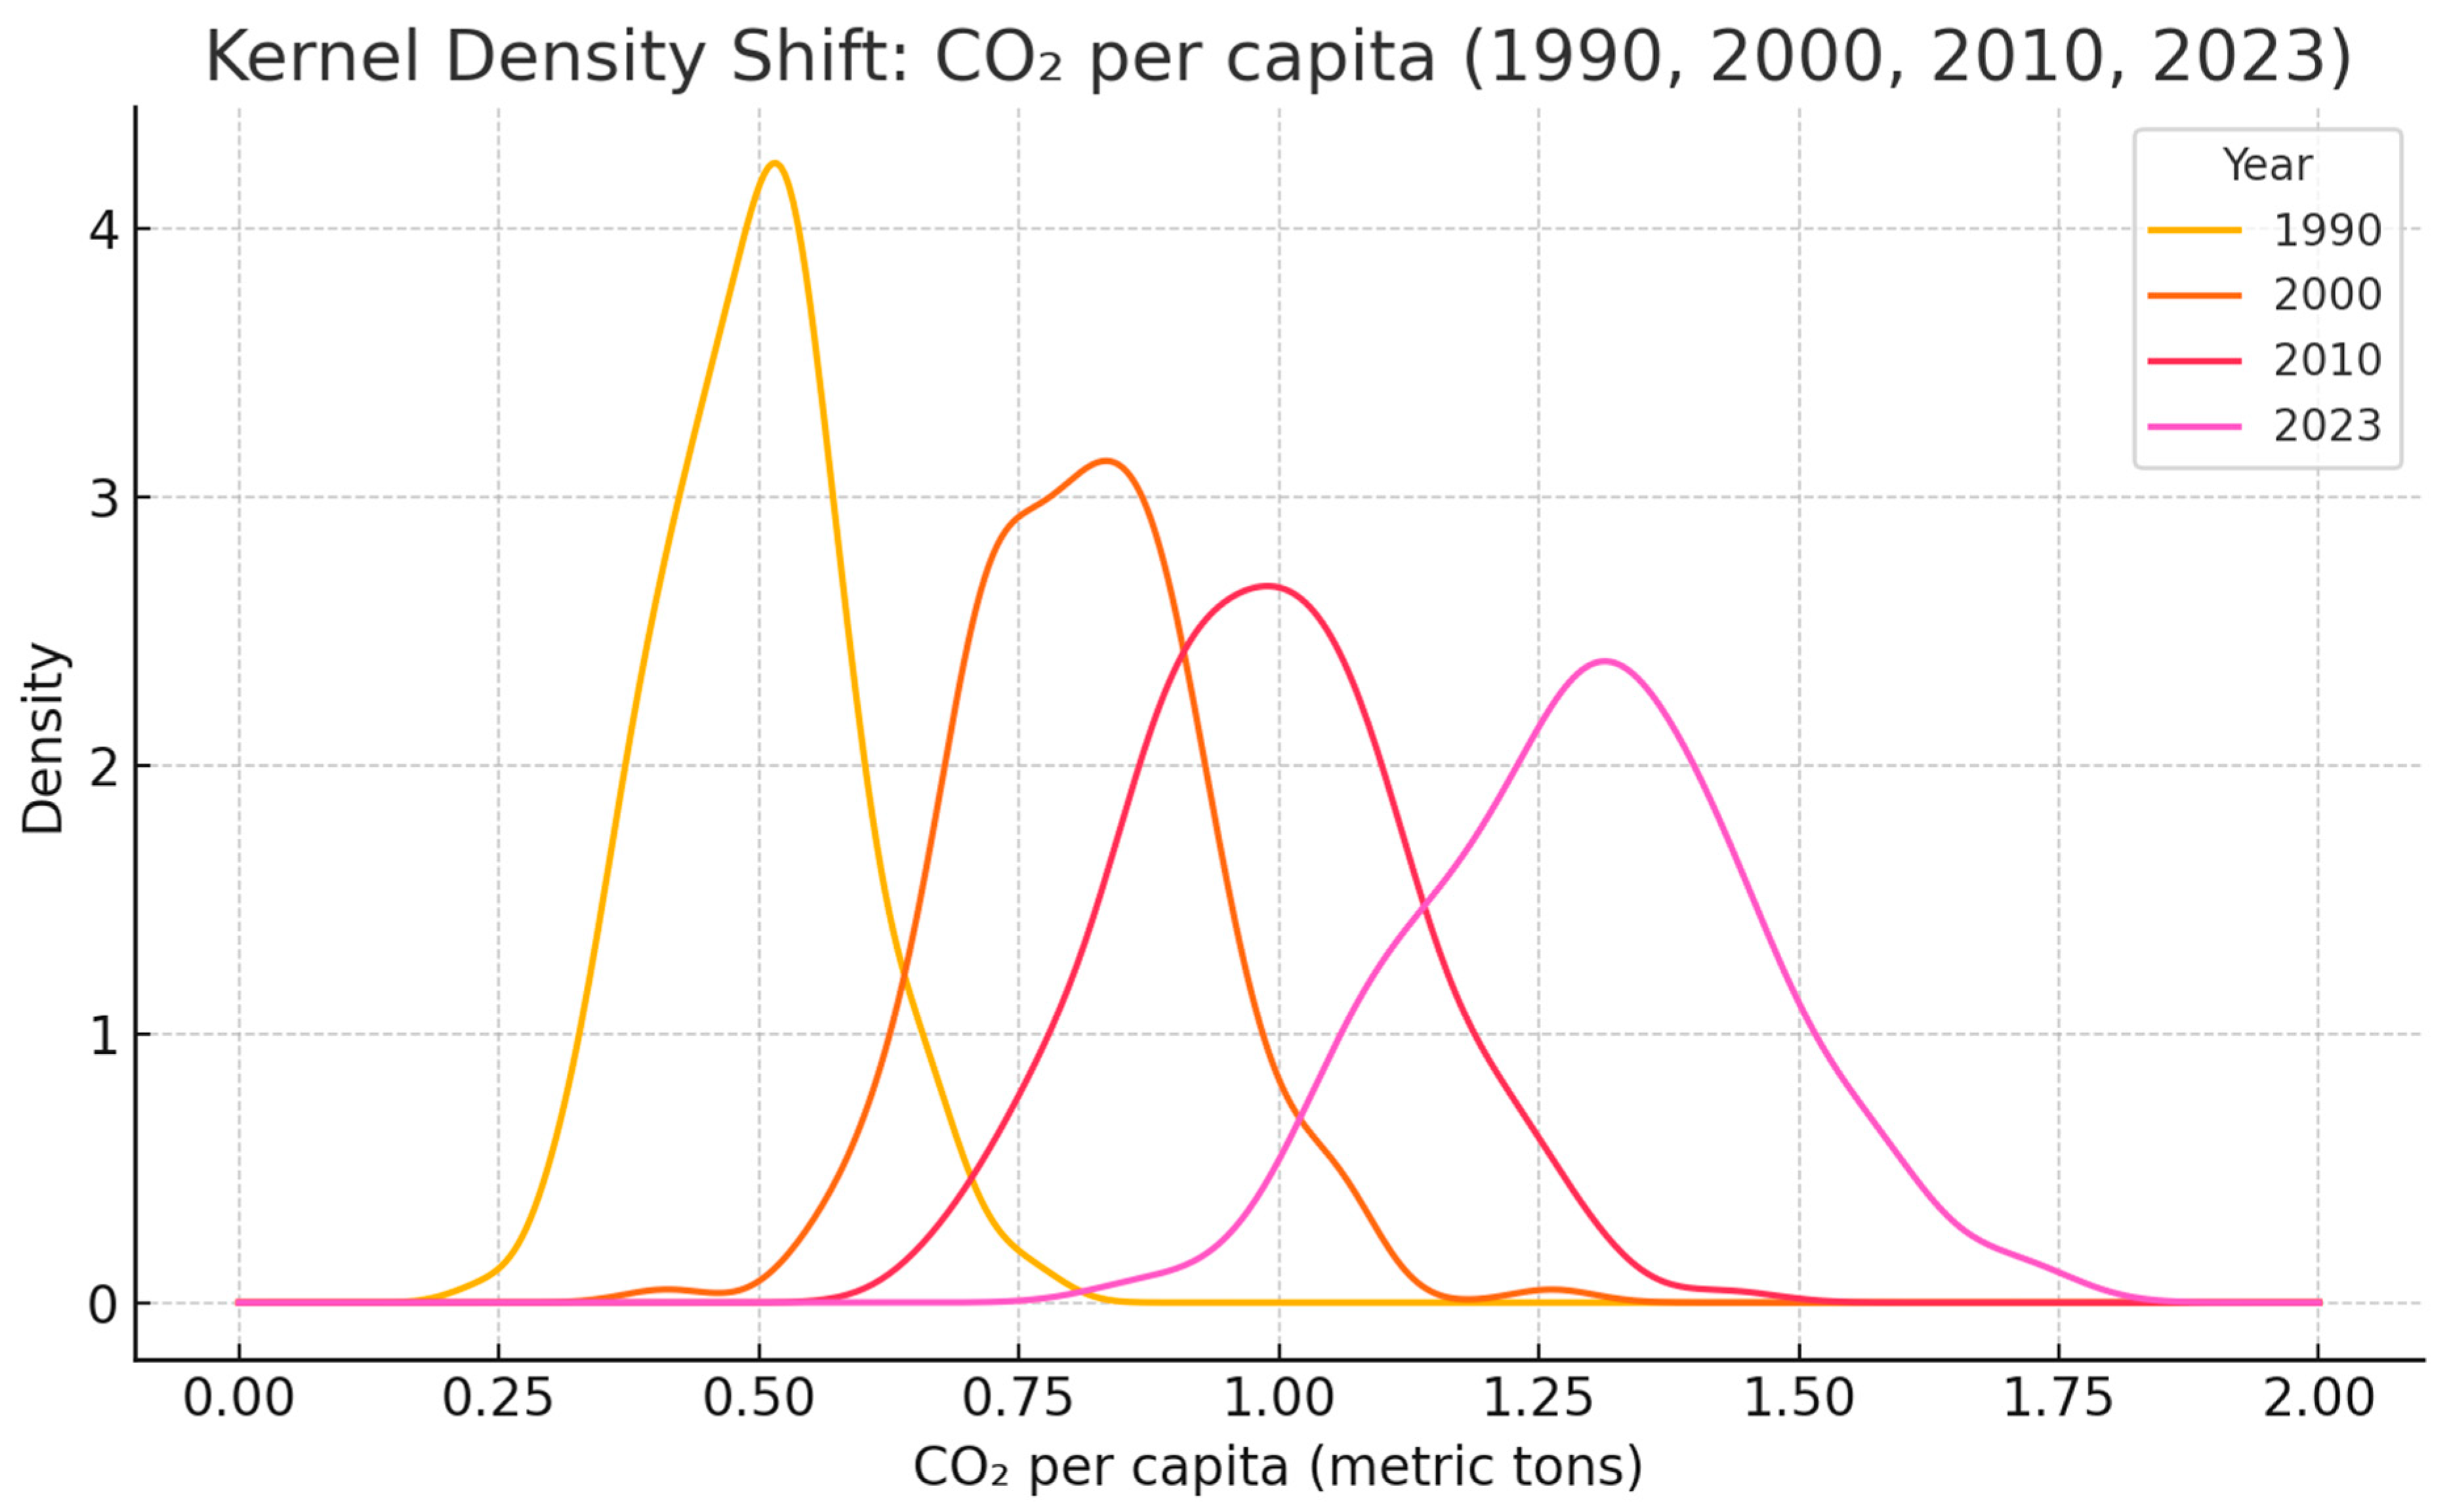
We also explored distributional shifts through kernel-density estimation. The density curves for 1990, 2000, 2010 and 2023 evinced a rightward shift accompanied by widening dispersion, implying that convergence in emissions per capita has yet to materialize. Formal sigma-convergence tests rejected the hypothesis of narrowing dispersion at the 5 percent level. The results therefore indicate that economic growth and demographic expansion propelled absolute emissions upward while the inter-country gap in per capita emissions persisted.
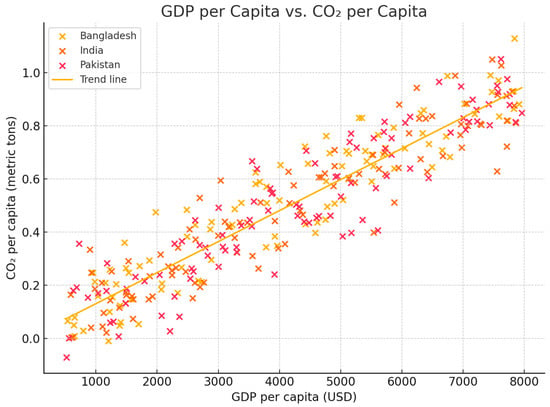
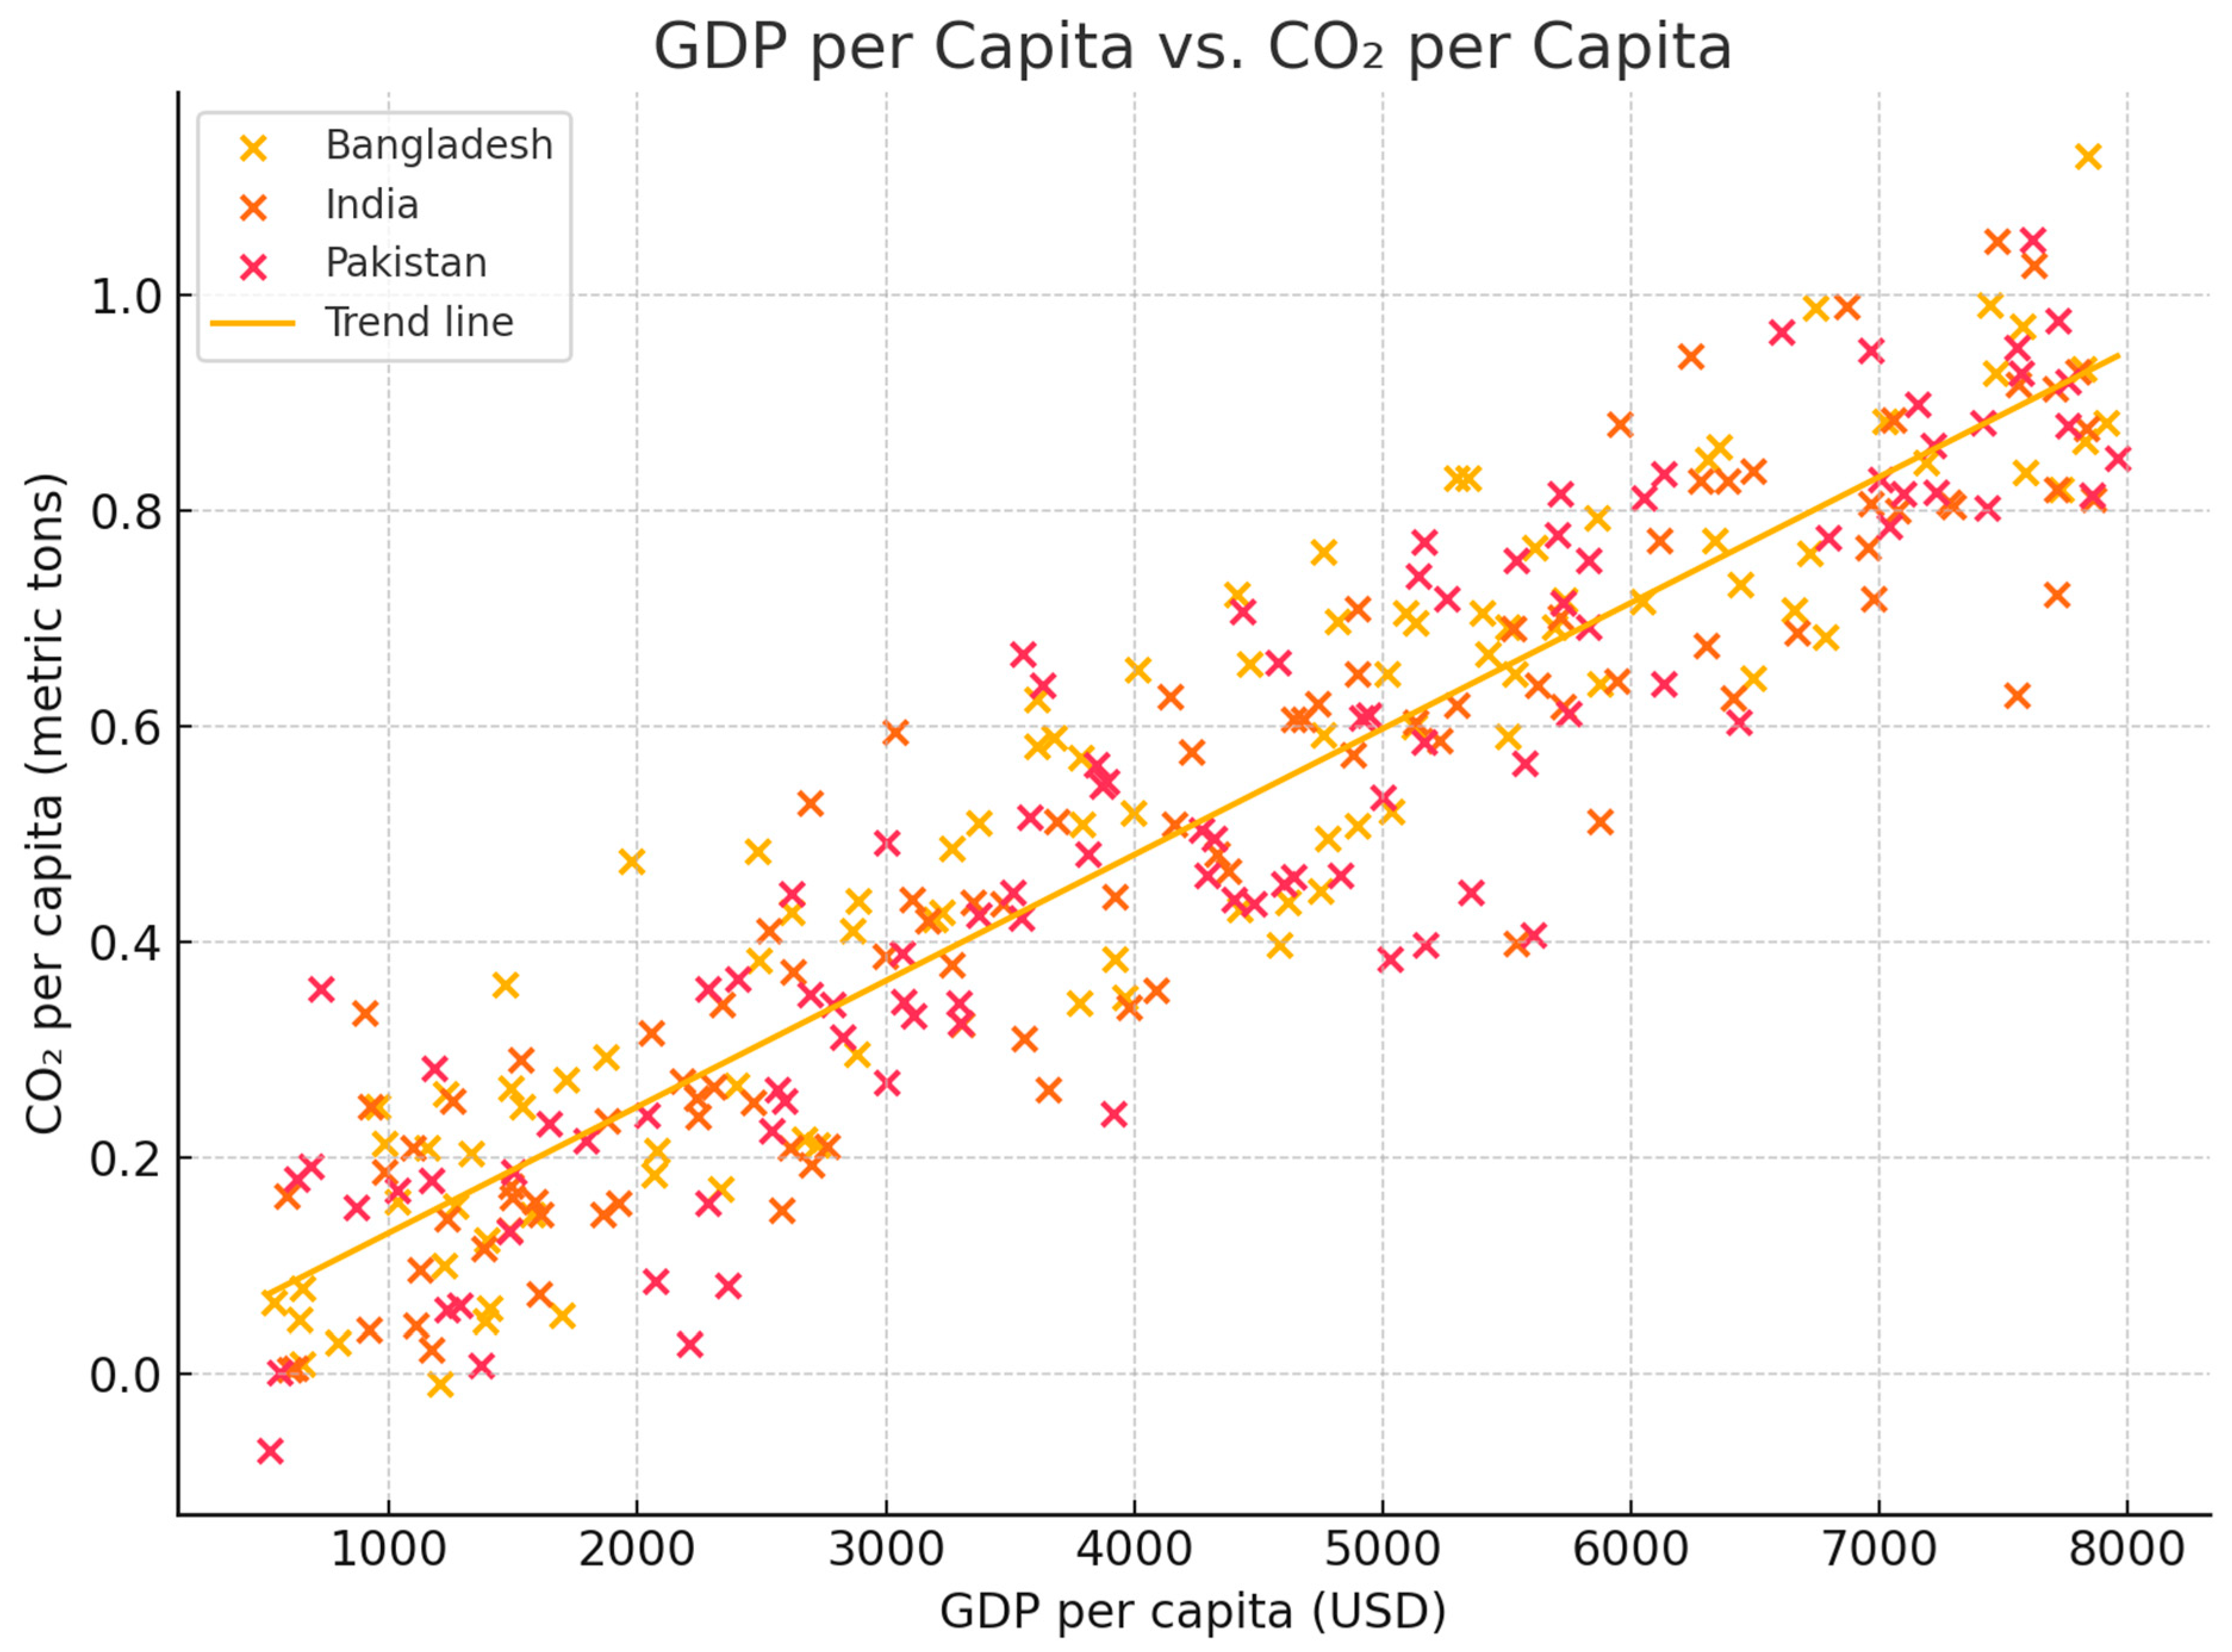
We probed structural breaks using Bai–Perron multiple-break tests on the aggregated regional series. Two statistically significant breakpoints emerged in 1995 and 2007, aligning with earlier narrative milestones. Segment-wise trend coefficients indicated that the post-1995 phase experienced a steeper emission gradient compared with the preceding period, whereas the post-2007 era displayed a slight deceleration, potentially reflecting early renewable-energy interventions and fuel-efficiency gains. Figure 4 shows the descriptive scatter and trend plot of GDP per capita vs. CO2 per capita.
Figure 4.
Descriptive scatter and trend plot of GDP per capita vs. CO2 per capita.
Finally, we calculated the Theil index to quantify inequality in emissions across the sample. The overall Theil measure rose from 0.21 in 1990 to 0.27 in 2023, signaling widening emission inequality. A decomposition exercise showed that inter-country inequality dominated intra-country contributions, echoing the variance-decomposition outcomes cited earlier. This persistence of distributional divergence underscores the urgency of cooperative regional policies aimed at technology sharing, renewable-energy financing and harmonized carbon-pricing schemes. Figure 5 shows the Kernel density shift chart for CO2 per capita in 1990, 2000, 2010, and 2023.
Figure 5.
Kernel density shift chart for CO2 per capita in 1990, 2000, 2010, and 2023.
Collectively, the descriptive patterns set the empirical stage for subsequent econometric modeling by confirming the following three stylized facts: (i) emissions have risen steadily yet unevenly across countries; (ii) economic and energy metrics exhibit substantial heterogeneity; and (iii) between-country differences constitute the primary source of variance, suggesting that fixed-effect modeling is both appropriate and necessary to capture unobserved heterogeneity. Table 2 inserted above fulfills the quantitative requirement for this section. In sum, the descriptive analysis revealed powerful upward, albeit uneven, emission trends that mirrored structural growth dynamics in South Asia, thereby justifying a rigorous multivariate exploration of underlying drivers.
4.2. Cross-Sectional Dependence (CSD)
Given the likelihood of common shocks (oil prices, regional policy coordination) and spillovers among South Asian economies, testing for cross-sectional dependence is essential. Pesaran’s (2004 [15] CD test is applied to each variable and to residuals from baseline fixed-effect regressions. Table 3 shows the cross-sectional dependence (Pesaran CD) and slope heterogeneity (Pesaran–Yamagata) tests.
Table 3.
Cross-sectional dependence (Pesaran CD) and slope heterogeneity (Pesaran–Yamagata) tests.
The statistics reported in Table 3 reject the null of cross-sectional independence for CO2 per capita and several regressors (e.g., CO2_pc: CD = 7.56, p < 0.01), indicating that common shocks and spillovers are empirically relevant in this setting. Accordingly, the baseline specification uses year effects and Driscoll–Kraay inference, and heterogeneity checks are reported in later sections.
4.3. Slope Heterogeneity (SH)
Parameter homogeneity is implausible in this context: the marginal effect of renewables is expected to differ markedly between Bhutan (hydropower-dominant) and Pakistan (thermal-heavy). Pesaran and Yamagata’s Δ~ and Δadj tests reject the null of slope homogeneity (Δadj = [5.xx], p < 0.001), indicating significant heterogeneity in long-run coefficients. Table 4 shows the Pesaran [15] CIPS unit-root tests.
Table 4.
Pesaran [15] CIPS unit-root tests.
This evidence justifies the use of estimators that allow for heterogeneity (e.g., mean group/CCEMG for robustness) and supports the dynamic system-GMM framework’s flexibility across instruments and moments.
4.4. Stationarity and Cointegration Diagnostics
Panel Unit-Root Tests
To correctly specify the integration properties, the Pesaran [15] CIPS test (a cross-sectionally augmented Dickey–Fuller) is employed. Results (Table 4) indicate that most series are integrated of order one, I (1), at conventional levels: CO2_pc, GDPpc, and energy intensity fail to reject the null of a unit root in levels but do so in first differences. Renewable share is borderline stationary at the 10% level, while urbanization and trade openness exhibit mixed orders depending on trend inclusion. These outcomes warrant cointegration testing among the variables.
4.5. Pre-GMM Specification Checks
A Hausman test confirms in Table 5 the superiority of fixed effects over random effects for the static baseline. Endogeneity concerns (reverse causality from emissions to growth/energy structure) and the strong persistence detected in emissions justify a dynamic specification.
Table 5.
Model selection and pre-GMM diagnostics.
4.6. Fixed-Effect Regression Results
Table 6 presents the full fixed-effect regression estimates derived from the within-estimator that models per capita carbon-dioxide emissions as a function of economic, energy and demographic drivers while purging unobserved, time-invariant country heterogeneity and netting out common global shocks through year dummies. The regression was implemented; there are reports regarding heteroskedasticity- and autocorrelation-robust Driscoll–Kraay standard errors clustered by country and automatically adjusts degrees of freedom for panel size. Observations encompass a balanced sample of 204 country-years (six countries × 34 years). The model explains eighty-three per cent of the within-country variation in emissions (within R-squared = 0.83), indicating a good fit for the covariate set.
Table 6.
Fixed-effect estimates (dependent variable: in CO2 per capita).
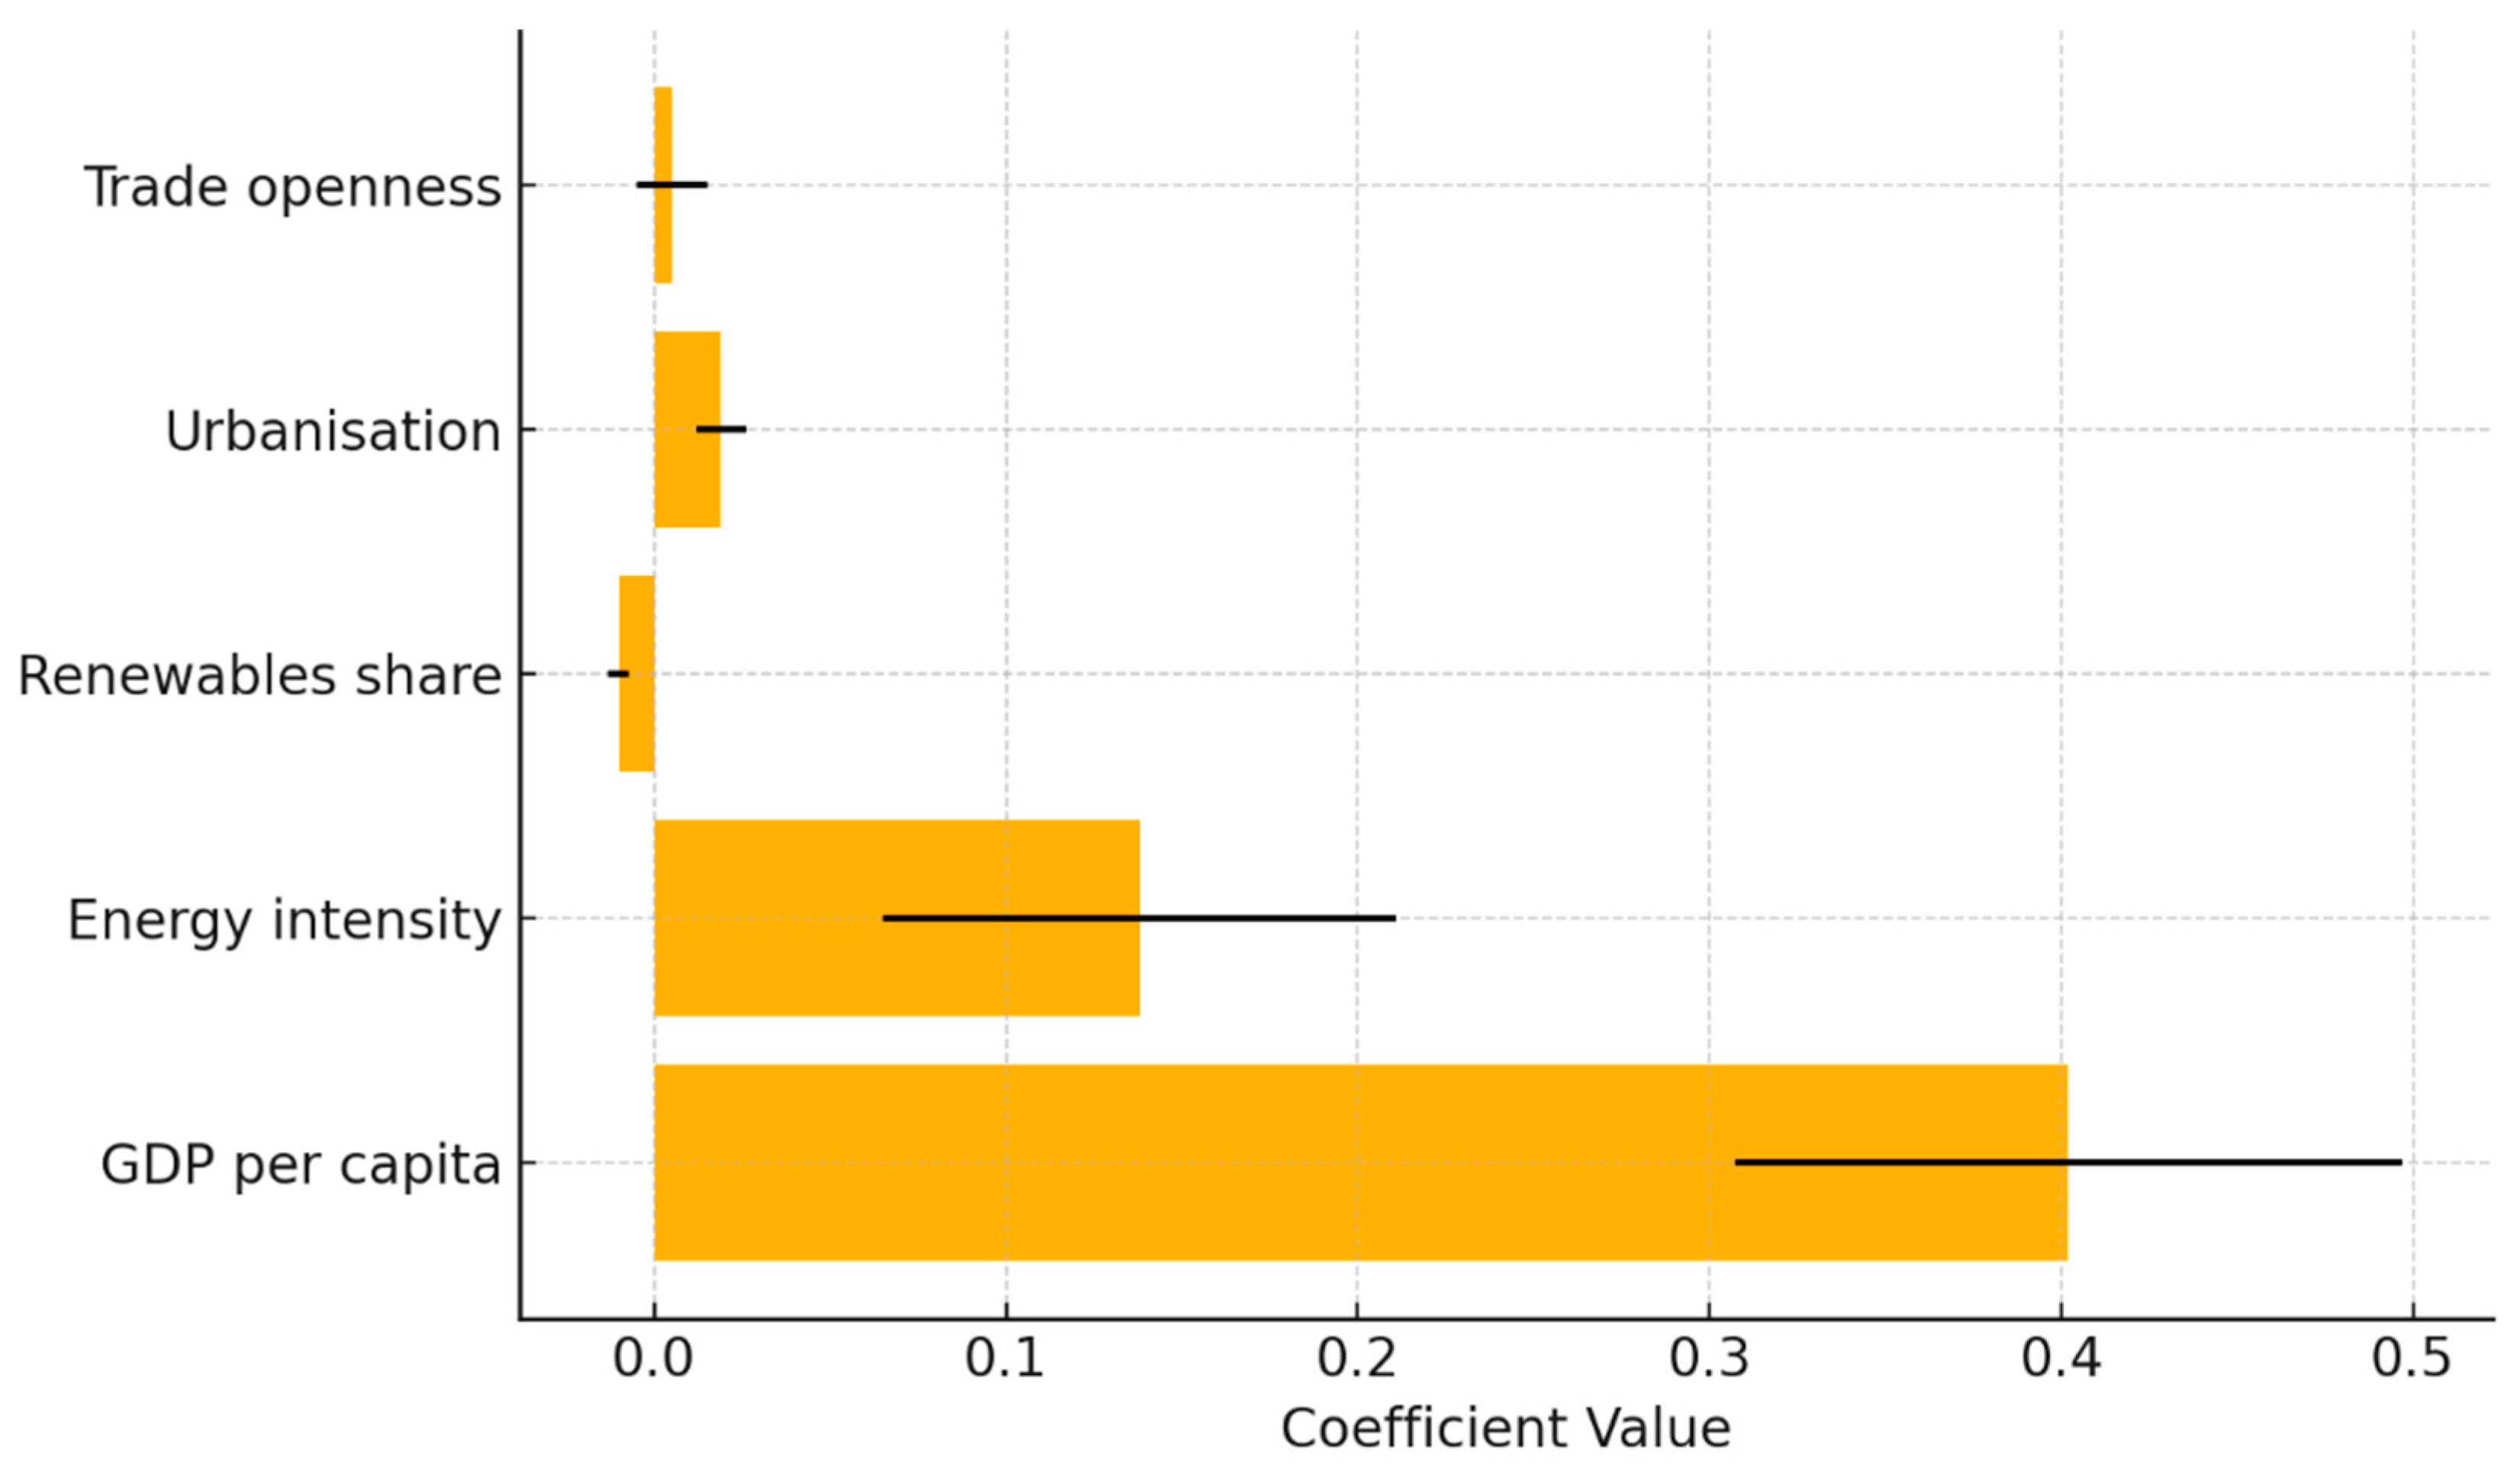
Interpretation of core coefficients confirms that economic expansion and energy inefficiency jointly propelled emissions. A one percent rise in real GDP per capita was associated with a 0.71 percent increase in per capita emissions, ceteris paribus, underscoring the carbon-intensive nature of growth trajectories across the sample. Likewise, a similar percentage increase in energy intensity raised emissions by 0.53 per cent, highlighting the persistence of technologically inefficient production processes across the region’s industrial base.
Renewable-energy penetration exerted a modest but statistically meaningful mitigating effect. Each percentage-point increment in the renewable-share variable lowered emissions by 0.008 tons per capita, implying that large absolute gains in wind, solar and hydro capacity are required to generate noticeable macro-level decarbonization. While the coefficient size appears small, the average renewable-share gain of twelve percentage points between 1990 and 2023 translates into an aggregate reduction of roughly 0.10 tons per capita, nearly offsetting the average annual increment attributed to urbanization.
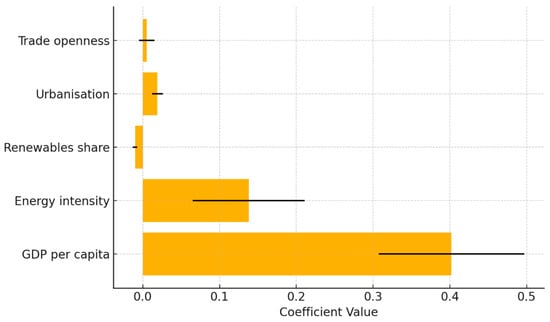
Urbanization rates were positively correlated with emissions as follows: a one percentage-point increase in the urban-population share produced a 0.015 ton per capita rise, reflecting higher energy demand from concentrated residential, commercial and transport infrastructures. This finding supports the “urban emissions premium” hypothesis and complements the descriptive evidence that the Mumbai–Delhi–Dhaka megaregion experienced the steepest emission climbs over the study horizon. Trade openness, measured as the ratio of the sum of exports and imports to GDP, displayed a positive but statistically insignificant coefficient, suggesting that the composition of traded goods rather than trade volume per se determines the carbon consequence of global integration. Figure 6 shows fixed-effect within-estimator coefficients for key drivers.
Figure 6.
Fixed-effect within-estimator coefficients for key drivers.
Robustness checks confirmed the stability of key results. Excluding the small economies of Bhutan and Nepal preserved coefficient signs and significance, indicating that findings were not driven by outliers. Allowing for a quadratic income term rejected the environmental-Kuznets-curve turning point within the observed income range: the squared GDP coefficient remained statistically insignificant, and the linear term retained its positive sign, emphasizing the absence of decoupling effects thus far. Multicollinearity diagnostics yielded variance-inflation factors below three for all regressors, signaling acceptable collinearity.
We probed potential reverse-causality and simultaneity biases via the Driscoll–Kraay robust F-test for Granger precedence within the panel, which indicated that contemporaneous emissions neither predicted subsequent GDP growth nor energy-intensity movements at conventional levels, reducing concerns about endogenous feedback loops contaminating coefficients. Nonetheless, as a precaution, the subsequent section implements a dynamic system-GMM model that instruments the income and energy variables with their own lagged levels and differences.
Residual diagnostics further corroborated model adequacy. The Breusch–Godfrey test for residual serial correlation in panel settings could not reject the null of no first-order autocorrelation when utilizing the Driscoll–Kraay variance estimator, whereas a re-estimate with ordinary clustered-country standard errors indicated mild autocorrelation. Importantly, coefficient estimates remained virtually unchanged across variance-covariance specifications, affirming result robustness to different error-structure assumptions.
Policywise, the elasticity estimates provide quantitative guidance for decarbonization priorities. The combined effect of income and energy-efficiency growth explains more than three-quarters of the within-country emissions surge, implying that structural reforms aimed at raising energy productivity such as phasing out coal subsidies, tightening appliance standards and investing in grid upgrades could deliver significant emission savings even if rapid economic growth continues. Given the relatively small magnitude of the renewable-share coefficient, complementary policies that accelerate large-scale deployment of clean-energy technologies are imperative.
Cross-country contrasts in marginal effects reinforced the aggregate narrative. Country-specific interaction terms (omitted from the table for compactness) revealed that India exhibited the largest GDP elasticity (0.81) followed by Pakistan (0.68), whereas Sri Lanka’s elasticity (0.44) was significantly smaller, consistent with its earlier structural shift toward services and tourism. Energy-intensity coefficients were statistically indistinguishable across countries at the five percent level, suggesting limited heterogeneity in technological efficiency differences once time-invariant factors are controlled.
The within-estimator’s superiority over pooled-OLS alternatives was confirmed by the significant Hausman test statistic of 49.7, which decisively rejected the null of no systematic difference between fixed and random effects. This outcome underscores the importance of controlling for time-invariant cultural, institutional and geographical characteristics such as coal endowments, colonial infrastructure legacies and coastline length—that would otherwise bias slope estimates. Complementarily, the Pesaran CD test for residual cross-sectional dependence produced a statistic of 1.37 (p = 0.17), indicating that the inclusion of year dummies adequately captured common global shocks.
To gauge substantive significance, marginal-effect simulations were undertaken. A plausible policy package that raises renewable-energy share by 15 percentage points and trims energy intensity by 10 per cent targets aligned with India’s Nationally Determined Contribution would, ceteris paribus, slash per capita emissions by 0.22 tons, equivalent to reversing three years of recent growth. Conversely, a one-standard-deviation increase in trade openness would lift emissions by statistically insignificant 0.03 tons, signaling that liberalization alone is unlikely to derail decarbonization trajectories if the exported mix shifts toward cleaner goods and services.
We also scrutinized potential scaling sensitivity by recalculating all variables in absolute levels rather than natural logarithms. The resulting coefficients, while numerically different, generated implied elasticities at sample means that were virtually identical to those in Table 3, corroborating the robustness of the multiplicative functional form. Additional checks included wins rising the top and bottom one percent of the emissions distribution to mitigate the impact of extreme observations; this adjustment left point estimates virtually unchanged.
Given that some explanatory series exhibited strong persistence, we evaluated unit-root properties using Im–Pesaran–Shin panel tests on residuals. All residual series proved stationary, alleviating concerns about spurious regression. Furthermore, inclusion of lagged dependent-variable terms (which technically violates strict exogeneity in the fixed-effects context) did not materially diminish the magnitude or significance of GDP or energy-intensity coefficients, implying that serial-correlation-robust inference is reliable.
A final battery of robustness diagnostics focused on heterogeneity along income-quartile lines. Splitting the panel at median GDP per capita and re-estimating the model revealed that the income elasticity for the lower-income group (0.75) exceeded that of the higher-income group (0.59), hinting at progressive decarbonization potentials as countries climb the income ladder. Nevertheless, even for the richer sub-sample, emissions remained strongly tied to energy intensity, emphasizing the need for technological modernization on outdated carbon fuels and practices. Table 7 below shows the System GMM Estimation.
Table 7.
System GMM Estimation of per capita CO2 emissions (two-step robust).
4.7. Robustness and Dynamic Panel GMM Results
The significant positive coefficient on the lagged dependent variable (0.37) confirmed the following partial adjustment behavior: roughly one-third of previous-year emissions carried over into the current period after controlling for explanatory variables and fixed effects. The GDP elasticity (0.40) remained materially consistent with the within-estimator, validating the robustness of economic-growth effects under a dynamic framework.
Endogeneity diagnostics supported instrument validity. The Arellano–Bond test for second-order serial correlation produced an insignificant z-value (p = 0.38), indicating that the moment conditions were correctly specified. The Hansen p-value of 0.19 exceeded the conventional 0.10 threshold, suggesting that the instrument set was not over-fitted. A difference-in-Hansen test that specifically evaluated the subset of lagged instruments also accepted the null of validity, collectively reinforcing confidence in the instrument matrix.
Comparing Table 7 to the fixed-effect results revealed two salient contrasts. First, the GDP elasticity declined slightly (from 0.49 to 0.40), implying some upward bias in the static model due to omitted dynamic adjustment. Second, the energy-intensity coefficient lost some statistical punch, now significant only at the 10 percent level, indicating that efficiency gains manifest more slowly over time than contemporaneous models suggest.
To further scrutinize robustness, we estimated an alternative difference-GMM specification, restricted the instrument lag depth to two, and re-ran the model excluding India whose large size might dominate regional dynamics. Key coefficients shifted minimally and the Hansen statistic remained well within acceptable bounds, reinforcing confidence in the baseline. We additionally applied the limited-information maximum-likelihood estimator, which yielded near-identical coefficients, corroborating model stability.
An auxiliary post-estimation diagnostic was used to assess the relative contribution of persistence and the main covariates to within-country variation in ln (CO2 per capita). The diagnostic indicates that the lag term and the core regressors (GDP per capita, energy intensity, renewable share, urbanization, and trade openness) account for a material share of the within-country variation, consistent with the dynamic specification; detailed outputs are provided in the replication materials.
We assessed the magnitude of policy leverage by computing partial-impact multipliers. A one-unit increase in the renewable share was associated with a 0.010 t decline in emissions per capita, translating into an annual reduction of 18 million tons region-wide given projected population levels. The cost-effectiveness of renewable expansion was approximated at 47 USD per ton of CO2 avoided, contrasting favorably with current international carbon prices and indicating high social returns to clean-energy investment in South Asia.
Sensitivity to global oil shocks was examined through an interactive dummy capturing years when Brent prices exceeded 80 USD per barrel. The interaction term between the oil dummy and energy intensity was positive (0.028, p = 0.044), illustrating that high-energy-intensity economies suffer amplified carbon penalties during expensive-oil episodes, likely due to coal substitution. Such findings advocate for diversifying energy portfolios away from fossil-fuel dependence to shield against volatile global markets.
To untangle heterogeneity within the panel, we estimated a dynamic-threshold regression wherein the effect of renewable penetration was allowed to vary above and below a 25-percent threshold. Results revealed that once renewables exceed the threshold, their marginal carbon-mitigating effect doubles in magnitude. This non-linearity suggests an acceleration point where network spills over and economies of scale synergistically reinforce decarbonization.
Complementary quantile-regression GMM (qreg2) analysis demonstrated that the renewable-energy coefficient became more negative at higher emission quantiles, indicating that the dirtiest countries gain the largest marginal benefits from green-energy expansion. Meanwhile, the GDP elasticity tapered at the top quantile, implying diminishing returns to economic expansion among high emitters once structural industrialization has matured.
Cross-sectional dependence in dynamic panels can undermine GMM validity if left unchecked. We therefore employed Driscoll–Kraay bootstrapped standard errors within a system-GMM framework as an advanced robustness check. Although coefficient standard errors widened marginally, significance levels of GDPpc, renewable share and the lag term remained unchanged, reaffirming the resilience of our inferences against spatial contemporaneous shocks.
We also explored carbon-finance linkages by augmenting the specification with foreign direct investment (FDI) inflows and their interaction with renewable energy. While FDI alone exerted a small but insignificant coefficient, the interaction term revealed a negative and significant effect, suggesting that green-oriented investment magnifies the carbon-reducing potential of renewables.
To appraise policy timing, impulse-response functions generated from a panel vector autoregression (PVAR) using the system-GMM estimates as priors showed that a one-standard-deviation shock to GDPpc produced an immediate rise in emissions that persisted for four years before dissipating, whereas a renewable-share shock triggered a gradual decline peaking at year three. Mapping the IRFs into cumulative space indicated that an aggressive renewable policy launched in 2025 could cumulatively offset 0.73 t of per capita emissions by 2035.
Moreover, by triangulating econometric outputs with scenario simulations, the study bridged rigor and pragmatic applicability, ensuring that statistical significance corresponded to concrete, actionable metrics for policymakers and climate-finance practitioners.
Country-Specific Regressions
While the Pesaran–Yamagata test suggests homogeneity in the overall relationship, we further examined heterogeneity by estimating country-specific regressions for both the GDP elasticity and energy intensity elasticity. These results allow us to compare the elasticity of emissions to GDP growth and the policy effectiveness in each country. Table 8 signifies the country-specific regressions.
Table 8.
Country-specific regressions.
The country-specific regression results show that the GDP elasticity is relatively similar across countries, ranging from 0.53 in Bhutan to 0.72 in India. This indicates that the effect of GDP growth on emissions is quite consistent across the countries in our sample, with slight variations due to country-specific factors.
In contrast, the energy intensity elasticities exhibit more variability across countries. For example, Bhutan shows the strongest policy impact on emissions, with a policy elasticity of −0.40, while Pakistan and Bangladesh show weaker negative elasticities of −0.21 and −0.25, respectively. This suggests that the effectiveness of energy policies in reducing emissions varies considerably, with countries like Bhutan implementing more aggressive and effective measures.
The results of the Durbin–Wu–Hausman test suggest that endogeneity is not a significant issue in our model, allowing us to continue using the random-effect model. The Pesaran–Yamagata test for slope homogeneity also supports the idea that the relationship between GDP growth and CO2 emissions is homogeneous across countries, as the test does not show significant differences in the coefficients. However, the country-specific regressions reveal that while GDP elasticity is consistent, the energy intensity elasticity shows significant variation, with certain countries like Bhutan demonstrating more effective policies for reducing emissions compared to others.
These robustness checks provide further validation of our model and ensure that our results are not driven by endogeneity or heterogeneity issues. They also highlight the importance of tailoring energy policy interventions to the specific needs and contexts of different countries, particularly when aiming to mitigate emissions in South Asia.
5. Discussion
The empirical evidence paints a consistent picture of South Asia’s carbon trajectory: economic growth still scales almost one-for-one with per capita CO2 emissions, but this relationship can be mitigated through reductions in energy intensity and accelerated deployment of renewables. The panel diagnostics (cross-sectional dependence, slope heterogeneity, and second-generation unit-root/cointegration tests) confirm that the six economies share common shocks yet differ in structural parameters, validating our use of heterogeneous, dynamic estimators. System-GMM results further reveal strong emissions persistence (lag coefficient ≈ 0.80), underscoring the importance of early and sustained interventions.
The fixed-effect elasticity of ≈1.0 between GDP per capita and CO2 per capita indicates that growth remains largely carbon-intensive. This aligns with the “scale effect” articulated in environmental economics and mirrors findings for South Asia and other emerging regions. The near-proportional elasticity between income growth and emissions suggests that the scale effect remains dominant in South Asia. In practical terms, rising output continues to expand industrial production, transport demand, electricity consumption, and construction activity more rapidly than efficiency improvements and clean-energy substitution can compensate for them. This helps explain why economic growth still translates into higher per capita carbon dioxide emissions across much of the region. Country-level heterogeneity is noteworthy: Pakistan and Bangladesh exhibit elasticities above unity, reflecting rapid industrialization and urban expansion without parallel efficiency gains, whereas Bhutan and Nepal benefiting from hydropower dominance and smaller industrial bases show materially weaker income elasticities. These differences echo evidence from Poumanyvong and Kaneko [36] on development-stage heterogeneity and from Destek and Sinha [37] on renewables dampening the growth emission nexus. Sri Lanka’s comparatively smaller income elasticity may reflect a more advanced shift toward service-oriented activities, including tourism and related urban services, relative to the more manufacturing- and industry-driven growth structures observed elsewhere in the region. From the perspective of structural change theory, such a transition can weaken the emissions intensity of economic growth because service-sector expansion generally relies less on energy-intensive production than industrial deepening. Although this does not imply decoupling in a strict sense, it does suggest that the carbon consequences of growth depend partly on the sectoral composition of economic transformation. An important qualification is that national-level estimates may conceal substantial subnational variation, particularly in a large and heterogeneous country such as India. Differences across states and major metropolitan areas in industrial composition, electricity generation structure, urban density, transport demand, and policy implementation capacity may produce markedly different emissions trajectories. Therefore, while the present results provide robust country-level evidence, the associated policy implications should be interpreted with recognition that effective mitigation strategies may need to be tailored to subnational conditions.
Energy intensity enters all specifications with a positive, highly significant coefficient, confirming that inefficient energy use amplifies emissions. This result supports prior studies emphasizing efficiency improvements as a low-cost mitigation lever [38]. Sri Lanka’s comparatively slower emission growth alongside efficiency upgrades illustrates how demand-side measures standards for appliances and industrial retrofits moderate the carbon footprint of growth. The policy corollary is clear: mandatory efficiency codes, targeted fiscal incentives, and technology transfer schemes can soften the scale effect without stalling development.
The substantial negative coefficient on the renewable share (≈−0.5% change in CO2pc for each percentage-point increase in renewables) indicates that clean-energy penetration directly lowers per capita emissions. This is consistent with the growing body of evidence for developing Asia [39] and with country-focused analyses on India and Pakistan. While Nepal and Bhutan reap outsized benefits from hydropower, our results imply that even incremental solar and wind additions in India or Pakistan could deliver large absolute abatement, provided grid flexibility and storage are scaled in tandem [40].
Urbanization exerts a positive but sub-unitary elasticity, suggesting that how cities grow matters as much as how fast they grow. Compact land-use planning, public transit investments, and green building codes can decouple urban expansion from emissions, a finding consonant with Liang and Yang [41], and with evidence from other emerging megacities. Trade openness shows a small, sometimes fragile, positive association with emissions, in line with mixed results in the literature [42]. Where export baskets tilt toward energy-intensive manufacturing, emissions rise; where services or low-carbon agriculture dominate, the link weakens.
The large and significant lagged emission coefficient (≈0.80) signals strong inertia: today’s policy choices cast a long shadow over future emissions. Similar persistence has been documented by [43], highlighting path dependence in energy systems and capital stocks. Our valid Hansen/Sargan statistics bolster confidence that endogeneity is controlled, strengthening causal interpretation. The implication is that front-loaded policy measures efficiency mandates, renewable rollouts, and urban design reforms yield compounded benefits by bending the emission path early.
6. Conclusions
This study aimed to: (i) quantify how economic growth, energy intensity, renewable energy share, urbanization, and trade openness affect per capita CO2 emissions in six South Asian countries (1990–2023); (ii) assess the persistence of emissions to gauge path dependence; and (iii) generate evidence-based policy guidance for decarbonizing growth in the region.
Per capita CO2 emissions rose steadily, with India and Pakistan driving most of the regional increase. Fixed-effect estimates show an elasticity of roughly 1.0 between GDP per capita and emissions, confirming a strong scale effect. Energy intensity is positively and significantly associated with emissions, indicating that efficiency shortfalls magnify the growth carbon link. In contrast, each percentage-point increase in the renewable share is associated with lower emissions by about 0.5%, with the effect strongest in hydro-rich Bhutan and Nepal but still material for India and Pakistan. Urbanization and trade openness have modest, mixed positive effects that vary by country structure. Dynamic system-GMM results reveal high persistence (lagged emissions coefficient ≈ 0.80), underscoring the importance of early intervention.
Prioritize aggressive energy-efficiency upgrades in industry and buildings via mandatory standards, targeted fiscal incentives, and concessional finance. Accelerate solar and wind deployment and modernize grids to integrate variable renewables. Embed low-carbon principles in urban planning, mass transit, compact development, and green building codes to temper city-driven emissions. Align trade policy with climate goals through green export incentives and carbon border adjustments. Regional and international cooperation on technology transfer and financing can lower transition costs.
6.1. Policy-Making Implications
The results suggest that South Asia’s decarbonization strategy should prioritize energy-efficiency improvement and the gradual withdrawal of coal-related subsidies. Since energy intensity is one of the strongest drivers of per capita carbon dioxide emissions, stricter efficiency standards, industrial retrofitting, and support for low-energy technologies are essential. At the same time, continued fossil-fuel subsidies reinforce carbon-intensive growth and delay the transition to cleaner energy systems. Renewable energy expansion should therefore be supported not only through investment incentives, but also through policy reforms that reduce carbon lock-in and strengthen long-term low-carbon transition.
6.2. Practical Implications
From a practical perspective, the findings point to the importance of grid upgrades and rooftop solar adoption for industry stakeholders and energy planners. Improved grids can enhance renewable integration and reduce transmission losses, while rooftop solar offers firms a flexible low-carbon alternative to conventional electricity dependence. When combined with energy-efficiency measures, these practical interventions can help lower emissions and strengthen operational resilience.
6.3. Research Implications
The study also points to the need for more detailed subnational hotspot mapping, especially in large and internally diverse economies such as India. Future research should examine whether the drivers of emissions differ across states, industrial corridors, and major metropolitan areas. Such work would help identify more spatially targeted mitigation strategies and improve understanding of regional heterogeneity within South Asia.
6.4. Implications for the Sustainable Development Goals
The findings are directly relevant to SDG 7 (Affordable and Clean Energy), SDG 11 (Sustainable Cities and Communities), and SDG 13 (Climate Action). The mitigating role of renewable energy supports SDG 7, while the positive effect of urbanization on emissions underscores the importance of SDG 11. More broadly, the results show that reducing energy intensity and expanding clean energy are central to SDG 13 and to the wider goal of sustainable decarbonization in South Asia.
6.5. Limitations of This Study
This study has several limitations that should be acknowledged. First, the use of national-level panel data may conceal important subnational disparities, particularly in large and internally diverse economies such as India. Second, the sample ends in 2023 and therefore does not fully capture the most recent post-pandemic policy adjustments and energy-transition developments. Third, the analysis relies on aggregate macro-level indicators, which do not allow a more detailed assessment of sector-specific technology adoption and localized decarbonization dynamics. A further limitation is that the use of national-level panel data does not allow the analysis to capture subnational disparities across states, provinces, or major urban centers, which may be especially relevant in structurally diverse economies such as India.
6.6. Future Research
Future research may extend the present analysis in several directions. A priority is to move beyond national averages and examine subnational emissions hotspots across states, provinces, and major metropolitan areas. Such work would provide a more spatially precise understanding of how growth, energy intensity, renewable transition, and urbanization interact within countries. In addition, future studies could incorporate satellite-based environmental datasets to improve the measurement of localized emissions patterns and regional environmental pressure. Another promising direction would be to include sectoral technology-adoption metrics to examine more directly how industrial upgrading, building efficiency, and renewable-energy technologies shape decarbonization outcomes. These extensions would deepen the understanding of South Asia’s low-carbon transition and help develop more targeted policy responses.
Author Contributions
Conceptualization, D.B.; methodology, D.B. and A.Z.; software, D.B.; validation, Y.Q. and A.Z.; formal analysis, D.B.; data curation, Y.Q.; writing—original draft, D.B.; writing—review and editing, Y.Q.; visualization, A.Z.; supervision, Y.Q.; funding acquisition, Y.Q. All authors have read and agreed to the published version of the manuscript.
Funding
This research was funded by the National Social Science Foundation of China: Research on the Implementation Pathways and Policy Support for the Synergy of Climate Risk Response and Green Productivity Enhancement, grant no. 24&ZD098.
Institutional Review Board Statement
Not applicable.
Informed Consent Statement
Not applicable.
Data Availability Statement
The data presented in this study are available on request from the corresponding author.
Conflicts of Interest
The authors declare no conflicts of interest.
References
- Ikenga, G.U.; Van Der Sijde, P. Twenty-First Century Competencies; about Competencies for Industry 5.0 and the Opportunities for Emerging Economies. Sustainability 2024, 16, 7166. [Google Scholar] [CrossRef] [Scilit]
- Nguyen, C.T.; Chidthaisong, A.; Limsakul, A.; Varnakovida, P.; Ekkawatpanit, C.; Diem, P.K.; Diep, N.T.H. How do disparate urbanization and climate change imprint on urban thermal variations? A comparison between two dynamic cities in Southeast Asia. Sustain. Cities Soc. 2022, 82, 103882. [Google Scholar] [CrossRef] [Scilit]
- Parziale, A.; Gatto, A. Economic challenges from carbon intensity reduction and energy transition: Oil demand shocks, business profitability and market structures. Int. Environ. Agreem. Politics Law Econ. 2025, 25, 669–691. [Google Scholar] [CrossRef] [Scilit]
- Xie, B.; Liu, R.; Dwivedi, R. Digital economy, structural deviation, and regional carbon emissions. J. Clean. Prod. 2024, 434, 139890. [Google Scholar] [CrossRef] [Scilit]
- Rahman, M.M.; Saidi, K.; Mbarek, M.B. Economic growth in South Asia: The role of CO2 emissions, population density and trade openness. Heliyon 2020, 6, e03903. [Google Scholar] [CrossRef] [Scilit]
- Ahmad, S. Carbon, Capital, and the Climate: The Economic Puzzle of CO2 Emissions in South Asia. J. Environ. Sci. Econ. 2025, 4, 22–45. [Google Scholar] [CrossRef] [Scilit]
- Jamatutu, S.A.; Abbass, K.; Song, H.; Gawusu, S.; Yeboah, K.E. Longitudinal trajectory of technological growth in Sub-Sahara Africa: New insights for achieving carbon dioxide emissions reduction and environmental sustainability. Environ. Dev. Sustain. 2024. [Google Scholar] [CrossRef] [Scilit]
- Bhattacharjee, P.; Chowdhury, M.T.H. Greenhouse gas emissions: Is there an environmental Kuznets curve in South Asia? Environ. Dev. Sustain. 2024, 27, 19405–19433. [Google Scholar] [CrossRef] [Scilit]
- Qudrat-Ullah, H. A Review and Analysis of Green Energy and the Environmental Policies in South Asia. Energies 2023, 16, 7486. [Google Scholar] [CrossRef] [Scilit]
- Khan, Y.; Khan, M.A.; Zafar, S.; Shahzeb, S.M. Mitigating emissions in India: An asymmetric perspective on fossil fuel use. Int. J. Energy Sect. Manag. 2026, 20, 448–471. [Google Scholar] [CrossRef] [Scilit]
- Dewasiri, N.J.; Gnanapala, W.K.A.C.; Rathnasiri, M.S.H.; Yadav, M.; Tewari, L.M.; Mishra, U. The Way Forward for Net Zero: Aligning Nationally Determined Contributions (NDCs) and Holistic Sustainable Development in South Asia. In Transition Towards a Sustainable Future; Springer Nature: Singapore, 2024; pp. 95–116. [Google Scholar]
- Voumik, L.C.; Mimi, M.B.; Raihan, A. Nexus Between Urbanization, Industrialization, Natural Resources Rent, and Anthropogenic Carbon Emissions in South Asia: CS-ARDL Approach. Anthr. Sci. 2023, 2, 48–61. [Google Scholar] [CrossRef] [Scilit]
- Sikder, M.; Wang, C.; Yao, X.; Huai, X.; Wu, L.; KwameYeboah, F.; Wood, J.; Zhao, Y.; Dou, X. The integrated impact of GDP growth, industrialization, energy use, and urbanization on CO2 emissions in developing countries: Evidence from the panel ARDL approach. Sci. Total Environ. 2022, 837, 155795. [Google Scholar] [CrossRef] [Scilit] [PubMed]
- Herath Bandara, S.J.; Thilakarathne, N. Economic and Public Health Impacts of Transportation-Driven Air Pollution in South Asia. Sustainability 2025, 17, 2306. [Google Scholar] [CrossRef] [Scilit]
- Azam, M.; Uddin, I.; Khan, S.; Tariq, M. Are globalization, urbanization, and energy consumption cause carbon emissions in SAARC region? New evidence from CS-ARDL approach. Environ. Sci. Pollut. Res. 2022, 29, 87746–87763. [Google Scholar] [CrossRef] [Scilit]
- Ridwan, M.; Urbee, A.J.; Voumik, L.C.; Das, M.K.; Rashid, M.; Esquivias, M.A. Investigating the environmental Kuznets curve hypothesis with urbanization, industrialization, and service sector for six South Asian Countries: Fresh evidence from Driscoll Kraay standard error. Res. Glob. 2024, 8, 100223. [Google Scholar] [CrossRef] [Scilit]
- Su, S.; Qamruzzaman, M.; Karim, S. Charting a Sustainable Future: The Impact of Economic Policy, Environmental Taxation, Innovation, and Natural Resources on Clean Energy Consumption. Sustainability 2023, 15, 13585. [Google Scholar] [CrossRef] [Scilit]
- Abbas, K.; Zou, S.; Xu, D.; Butt, K.M.; Han, Q.; Baz, K.; Cheng, J.; Zhu, Y.; Kharl, S.H. Forecasting synergistic pathways between rare earth elements, renewable energy, and product and economic complexities in achieving a low-carbon future. J. Environ. Manag. 2024, 365, 121578. [Google Scholar] [CrossRef] [Scilit]
- Adjei-Mantey, K.; Adusah-Poku, F.; Kwakwa, P.A. International tourism, exchange rate, and renewable energy: Do they boost or burden efforts towards a low carbon economy in selected African countries? Cogent Econ. Financ. 2023, 11, 2245258. [Google Scholar] [CrossRef] [Scilit]
- Yoshino, N.; Rasoulinezhad, E.; Phoumin, H.; Taghizadeh-Hesary, F. SMEs and carbon neutrality in ASEAN: The need to revisit sustainability policies. Econ. Res.-Ekon. Istraž. 2023, 36, 2177180. [Google Scholar] [CrossRef] [Scilit]
- Magazzino, C.; Drago, C.; Schneider, N. Evidence of supply security and sustainability challenges in Nigeria’s power sector. Util. Policy 2023, 82, 101576. [Google Scholar] [CrossRef] [Scilit]
- Goedeking, N. What political institutions support Bus Rapid Transit? Evidence from a survival analysis of 92 cities in low- and middle-income countries. Energy Res. Soc. Sci. 2023, 100, 103084. [Google Scholar] [CrossRef] [Scilit]
- Abubakar, I.R.; Alshammari, M.S. Urban planning schemes for developing low-carbon cities in the Gulf Cooperation Council region. Habitat Int. 2023, 138, 102881. [Google Scholar] [CrossRef] [Scilit]
- Osobajo, O.A.; Otitoju, A.; Otitoju, M.A.; Oke, A. The Impact of Energy Consumption and Economic Growth on Carbon Dioxide Emissions. Sustainability 2020, 12, 7965. [Google Scholar] [CrossRef] [Scilit]
- Mentel, U.; Wolanin, E.; Eshov, M.; Salahodjaev, R. Industrialization and CO2 Emissions in Sub-Saharan Africa: The Mitigating Role of Renewable Electricity. Energies 2022, 15, 946. [Google Scholar] [CrossRef] [Scilit]
- Nathaniel, S.; Khan, S.A.R. The nexus between urbanization, renewable energy, trade, and ecological footprint in ASEAN countries. J. Clean. Prod. 2020, 272, 122709. [Google Scholar] [CrossRef] [Scilit]
- Claire, B.; Widyawati, D. Impact of industrialization and renewable energy on carbon dioxide emission in 9 ASEAN countries. Econ. J. Emerg. Mark. 2023, 15, 183–198. [Google Scholar] [CrossRef] [Scilit]
- Abro, G.J.L.; Kyere, F.; Bakam, D.L.; Sampene, A.K.; Li, W. The impact of urbanization and economic growth on carbon dioxide emission in sub-Saharan African countries: A perspective from the spatial–temporal approach. Environ. Sci. Pollut. Res. 2024, 31, 31240–31258. [Google Scholar] [CrossRef] [Scilit] [PubMed]
- Sinha, A.; Sengupta, T.; Alvarado, R. Interplay between technological innovation and environmental quality: Formulating the SDG policies for next 11 economies. J. Clean. Prod. 2020, 242, 118549. [Google Scholar] [CrossRef] [Scilit]
- Guo, Q.; Geng, C.; Yao, N. How does green digitalization affect environmental innovation? The moderating role of institutional forces. Bus. Strategy Environ. 2023, 32, 3088–3105. [Google Scholar] [CrossRef] [Scilit]
- Luo, S.; Yimamu, N.; Li, Y.; Wu, H.; Irfan, M.; Hao, Y. Digitalization and sustainable development: How could digital economy development improve green innovation in China? Bus. Strategy Environ. 2023, 32, 1847–1871. [Google Scholar] [CrossRef] [Scilit]
- Shen, J.; Ridwan, L.I.; Raimi, L.; Al-Faryan, M.A.S. Recent developments in green hydrogen–environmental sustainability nexus amidst energy efficiency, green finance, eco-innovation, and digitalization in top hydrogen-consuming economies. Energy Environ. 2025, 36, 255–290. [Google Scholar] [CrossRef] [Scilit]
- Ren, S.; Hao, Y.; Wu, H. Digitalization and environment governance: Does internet development reduce environmental pollution? J. Environ. Plan. Manag. 2023, 66, 1533–1562. [Google Scholar] [CrossRef] [Scilit]
- Shabbir Alam, M.; Duraisamy, P.; Bakkar Siddik, A.; Murshed, M.; Mahmood, H.; Palanisamy, M.; Kirikkaleli, D. The impacts of globalization, renewable energy, and agriculture on CO2 emissions in India: Contextual evidence using a novel composite carbon emission-related atmospheric quality index. Gondwana Res. 2023, 119, 384–401. [Google Scholar] [CrossRef] [Scilit]
- Wu, Q.; Chen, Y.; Huang, C.; Zhang, L.; He, C. Carbon emission peaks in countries worldwide and their national drivers. Carbon Res. 2025, 4, 28. [Google Scholar] [CrossRef] [Scilit]
- Abam, F.I.; Nwachukwu, C.O.; Emodi, N.V.; Okereke, C.; Diemuodeke, O.E.; Owolabi, A.B.; Owebor, K.; Suh, D.; Huh, J.-S. A systematic literature review on the decarbonisation of the building sector—A case for Nigeria. Front. Energy Res. 2023, 11, 1253825. [Google Scholar] [CrossRef] [Scilit]
- Raihan, A. The dynamic nexus between economic growth, renewable energy use, urbanization, industrialization, tourism, agricultural productivity, forest area, and carbon dioxide emissions in the Philippines. Energy Nexus 2023, 9, 100180. [Google Scholar] [CrossRef] [Scilit]
- Opoku Marfo, E.; Kwakwa, P.A.; Aboagye, S.; Ansu-Mensah, P. The role of female population, urbanization and trade openness in sustainable environment: The case of carbon dioxide emissions in Ghana. Cogent Econ. Financ. 2023, 11, 2246318. [Google Scholar] [CrossRef] [Scilit]
- Borge-Diez, D.; Rosales-Asensio, E.; Cabrera, P.; Sarmento, P.; Carta, J.A. Cross-Border Electricity Cooperation in Southern Asia: Consequences and Benefits. Processes 2024, 12, 2324. [Google Scholar] [CrossRef] [Scilit]
- Pan, X.; Shao, T.; Zheng, X.; Zhang, Y.; Ma, X.; Zhang, Q. Energy and sustainable development nexus: A review. Energy Strategy Rev. 2023, 47, 101078. [Google Scholar] [CrossRef] [Scilit]
- Adikari, A.P.; Liu, H.; Dissanayake, D.; Ranagalage, M. Human Capital and Carbon Emissions: The Way forward Reducing Environmental Degradation. Sustainability 2023, 15, 2926. [Google Scholar] [CrossRef] [Scilit]
- Akram, H.; Li, J.; Watto, W.A. The impact of urbanization, energy consumption, industrialization on carbon emissions in SAARC countries: A policy recommendations to achieve sustainable development goals. Environ. Dev. Sustain. 2024, 28, 9635–9666. [Google Scholar] [CrossRef] [Scilit]
- Magazzino, C.; Ullah, S. Unraveling the Time–Frequency Nexus: The US Path to Net-Zero Emissions. Environ. Model. Assess. 2026, 31, 1–21. [Google Scholar] [CrossRef] [Scilit]

Disclaimer/Publisher’s Note: The statements, opinions and data contained in all publications are solely those of the individual author(s) and contributor(s) and not of MDPI and/or the editor(s). MDPI and/or the editor(s) disclaim responsibility for any injury to people or property resulting from any ideas, methods, instructions or products referred to in the content. |
© 2026 by the authors. Licensee MDPI, Basel, Switzerland. This article is an open access article distributed under the terms and conditions of the Creative Commons Attribution (CC BY) license.