


Abstract
In the context of China’s “Dual Carbon” goals, the composite policy mechanism combining carbon trading and carbon taxation is widely considered a key pathway to achieve emission reductions. Although households are a major source of carbon emissions, their consumption behaviour has long remained outside the mainstream carbon reduction system, as existing policies focus primarily on enterprises and lack sufficient household-level participation and incentive mechanisms. Because China has not yet implemented an actual carbon tax, this study uses household high-carbon consumption dependency (HCD) as a proxy variable to capture the hypothetical administrative pressure that a carbon tax would impose on high-carbon consumption. Based on the concept of “Carbon Inclusion”, we construct an analytical framework for a composite mechanism that combines the carbon trading pilot policy (ETS) with this carbon-tax proxy. Using data from the China Family Panel Studies (CFPS) and a two-way fixed-effects panel model, we empirically test the impact of this composite mechanism on household carbon emissions (total volume) and carbon intensity. The findings show that, while the composite mechanism does not lead to a statistically significant reduction in total household carbon emissions, it effectively lowers household carbon intensity by restraining high-carbon consumption and optimizing the consumption structure. This decoupling of intensity from total volume occurs because the mechanism reduces the share of high-carbon consumption (a compositional effect) but does not suppress total consumption growth (a scale effect). This result remains robust across multiple tests, confirming the policy effectiveness of the composite mechanism at the micro-individual level. By reducing carbon intensity without suppressing total consumption, this mechanism contributes directly to sustainable development, aligning with UN Sustainable Development Goals 12 (Responsible Consumption and Production) and 13 (Climate Action). The main contributions of this paper are threefold: (1) it moves beyond traditional single-policy or single-agent studies by linking a carbon-trading-and-proxy-carbon-tax composite mechanism with household carbon consumption; (2) it explores a Carbon Inclusion pathway that connects households, enterprises and the nation; and (3) it provides empirical support and a theoretical reference for improving household-level emission reduction policies and promoting public participation in achieving the “Dual Carbon” goals.
1. Introduction
Since the beginning of the 21st century, countries worldwide have started to prioritize environmental protection. In particular, the limitation of carbon dioxide emissions has emerged as a crucial issue, and concepts such as carbon peak and carbon neutrality have emerged accordingly. To date, over 50 countries globally have achieved their carbon peak. As a major global power, China has set the objective to achieve its carbon peak by 2030 and carbon neutrality by 2060, and introduced a series of related policies to achieve this goal. A nationwide carbon trading market was established in 2019, and carbon tax policies are currently in the pilot phase. China’s current carbon emission and offset policies primarily focus on the production side, targeting large-scale emitting enterprises, with lower consideration of the consumption side and micro-level agents. However, previous studies indicated that direct and indirect carbon emissions from individuals or households account for 72% of the nation’s total emissions [1,2,3]. In fact, consumption-side emissions have become a major global source of carbon emissions. On the other hand, consumption is also a vital driver of China’s long-term economic growth. In the context of rapid economic development, the share of energy consumption and carbon emissions from the residential consumption sector is expected to continue rising [4,5]. Therefore, the promotion of consumption-side carbon emission reduction has become an important tool to balance economic growth with low-carbon transformation and upgrading, and an urgent need has emerged for diversified exploration of the mechanisms involved in reducing consumption-side carbon emissions [6,7]. Achieving such a reduction is essential for meeting the Sustainable Development Goals, particularly SDG 12 (sustainable consumption and production) and SDG 13 (climate action).
Moreover, China also faces important challenges in the selection of appropriate carbon policy tools. In particular, a key issue is whether there is a need to levy a carbon tax following the launch of the national carbon market. Carbon taxes are an administrative means of restricting household carbon emissions and contribute to achieving carbon peak and neutrality. Compared to carbon trading policies, carbon taxes have advantages such as broader coverage, higher legislative efficiency, and greater implementation flexibility, making them a beneficial complement to emission trading [8,9,10,11]. Several countries worldwide have implemented carbon taxes. For example, Canada, Norway, Iceland, the UK, and the US have levied carbon taxes while operating emission trading systems, so as to achieve complementary coverage or price mechanisms. Numerous countries recognize that a single-carbon tool cannot cover all sectors completely; therefore, the majority of developed countries have adopted a combination of carbon tax and carbon trading to establish their carbon market and system [12,13,14].
In this context, this study focused on the household level. Existing research on the factors influencing household carbon emissions has mainly focused on household size/structure and consumption patterns. Previous studies [15,16,17,18,19] of the impact of household structure considered age, gender, education, and urban–rural composition, and primarily examined the impact of a single-carbon tool. In contrast, this study considered households under three different scenarios: carbon tax, a carbon trading system, and a composite mechanism of both. A comparative analysis was performed of changes in household carbon consumption under these scenarios, with the aim of proposing more targeted countermeasures for household carbon emission reduction. The innovation of this study lies in the fact that it overcame the traditional single-carbon-tool research method, incorporating the relation between the composite mechanism and household carbon consumption into a unified analytical framework, building a mechanism that combines macro-level policy design with micro-level household emissions reduction behaviour. In this way, this study assessed the micro-effects of carbon tools, and filled the research gap by focusing on the mechanisms of interaction between composite policies and micro-level emission reduction agents. Furthermore, by relying on the quantitative analysis of a large sample, this study verified the actual effect and the boundaries of the composite mechanism on household carbon emission reduction, thus enhancing the reliability and universality of the results. Moreover, this study provided empirical evidence for the scientific implementation of China’s Carbon Inclusion policy, aligning with current research hotspots on increasing the adaptability of policies to micro-agents and their feasibility. In addition, it focused on the key need for public emission reduction under the Dual Carbon goals, innovatively exploring a multi-agent linkage path among households, enterprises, and the nation, and proposing targeted policies. This study directly responds to the global challenge of sustainable development by designing and testing a policy composite mechanism that can reduce household carbon intensity—a key step towards decoupling economic welfare from environmental degradation. Our approach integrates socio-economic incentives (carbon trading) with regulatory pressure (carbon tax proxy) to promote sustainable household consumption patterns. The findings of this study not only provide a reference to improve household-level emission reduction policies, but also offer new ideas to promote public participation in carbon emission reduction and achieve the “Dual Carbon” goals.
2. Literature Review
Using cross-country data, El Ghoul, Guedhami, Kwok, and Mishra (2011) [20] estimated that from 1992 to 2013, global economic losses from extreme heat were over 16 trillion USD. In a study published in Nature Medicine, Kolbel, Busch, and Jancso (2017) [21] pointed out that the death toll from high temperatures in a single region of Europe in summer 2022 reached 61,672. These empirical results underscore the urgency of reducing greenhouse gas emissions. As the world’s largest carbon emitter, in 2020 China formally proposed the goal of achieving its carbon peak before 2030 and carbon neutrality before 2060. Hence, the issue of how to construct an efficient and comprehensive emission reduction system has become a core issue for both academia and policymakers [22,23,24].
2.1. Households: The Overlooked Key Emission Reduction Agent—Consensus and Data Support from the Literature
Existing research has generally acknowledged the importance of households in the carbon emission system; however, policy practice still exhibits a bias toward emphasizing enterprises, neglecting households. The UNEP’s 2020 Emissions Gap Report clearly stated that two-thirds of global greenhouse gas emissions originate from household consumption, a conclusion that was further validated in regional studies. Liu and Liu (2025) [25] pointed out that 8% of the EU’s total carbon emissions come directly from household residential consumption. Similarly, Xu et al. (2024) [26] showed that 26% of China’s energy consumption comes directly from the residential sector, resulting in carbon dioxide emissions that account for one-third of the national total.
Regarding the composition of carbon emissions from household consumption, Xiong et al. (2023) [27] and Chang et al. (2023) [28] categorized them as coming from eight sectors, including food, clothing, and housing. Employing a calculation chain of “consumption expenditure–corresponding industry–energy intensity–carbon emission coefficient,” they confirmed that housing; transportation and communication; and food are the main sources of indirect household carbon emissions. However, despite a clear identification in the literature of the potential for household emission reductions, China’s current policy practice still focuses on constraining industrial enterprises [29,30,31]. While high-carbon enterprises are the main participants in the carbon trading market, measures targeting households mostly remain at the level of promoting a green lifestyle (Zhou et al., 2024 [32]), with a lack of market-based incentives and constraints. This policy gap is a key bottleneck hindering the comprehensive achievement of the “Dual Carbon” goals.
2.2. Carbon Trading and Carbon Tax: Evolution of Policy Tools and Research Limitations
Previous research considered two emission reduction policy tools, namely carbon trading and carbon tax; however, it focused on a single tool or a single agent, failing to propose a linkage analysis framework considering a composite mechanism and household agents [33,34].
2.2.1. Carbon Trading: Focus on Enterprises, Neglect of Individuals
Current research on carbon trading as a market-based emission reduction tool mainly revolves around the enterprise level. Wang et al. (2014) [35] constructed an enterprise carbon trading game model to analyze the impact of carbon quota allocation on enterprise emission reduction behaviour. Since the launch of China’s domestic carbon trading market in 2019, related research has also focused on aspects such as quota mechanism optimization and enterprise compliance costs. However, these studies exclude households from the carbon trading system, overlooking the indirect driving effect of household consumption on enterprise carbon emissions, and failing to explore the feasibility of household participation in carbon trading [36,37,38,39].
2.2.2. Carbon Tax: Emphasis on Macro-Level Effects, Lack of Micro-Level Analysis
Research on carbon tax shows a characteristic of “more macro, less micro.” Liu et al. (2023) [40] designed a carbon tax rate of 50 yuan/ton for China and estimated its impact on various industries. Subsequent studies mainly expanded on the macro-level effects of carbon tax on economic growth and industrial structure (Zhang et al., 2017 [41]), while only a few studies focused on the residential level. In this respect, Wang et al. (2020) [42] analyzed the impact of carbon tax on residential consumption structure; however, they did not combine it with the carbon trading mechanism, nor did they delve into the household as a small decision-making unit, making it difficult to reflect the actual impact of policies on individual emission reduction behaviour [43,44].
2.2.3. Composite Mechanism: Research Gap and the Purpose of This Study
Although some scholars have proposed the concept of a “carbon trading + carbon tax” composite mechanism (Steinhardt and Manley, 2016 [45]), arguing that it could balance market flexibility and policy enforceability, existing research either focuses on macroeconomic impacts, or considered enterprises as the object of analysis. As a result, no studies have combined this composite mechanism with household carbon consumption. This study aimed precisely to address this research gap [46].
2.3. Carbon Inclusion: An Innovative Direction for Individual Emission Reduction, and the Research Design of This Study
To address the problem of incentives for individual emission reduction, domestic scholars proposed the concept of Carbon Inclusion. As an individual, incentive-based voluntary emission reduction mechanism, Carbon Inclusion compensates for the defects of complexity and unfairness of mandatory personal carbon trading (Zhou et al., 2022 [47]) and overcomes the problem of weak incentive from mere propaganda appeals. This concept is an important innovation of the carbon trading mechanism at the individual level. However, most existing research on Carbon Inclusion lags at the stage of theoretical design, lacking empirical testing. In particular, it does not clarify how the carbon trading and carbon tax composite mechanism can be combined with Carbon Inclusion to increase the motivation for households to reduce their emissions [48,49].
3. Data Source and Model Construction
To explore the impact of China’s carbon trading market development process (which was considered as categorized into three phases: not established; pilot implementation; fully established) on household carbon emissions, this study employed multi-year data from the China Family Panel Studies (CFPS). The CFPS database employs implicit stratification and random sampling for surveys, with a broad sample coverage. It includes data on several categories of expenditures, including food, clothing, housing, household equipment and supplies, transportation and communication, education, culture and entertainment, and healthcare. As such, it ensures a strong representativeness and research potential to investigate carbon emissions from household consumption. As the CFPS database does not have a separate module for household expenditure categories, this study extracted household expenditure data from other modules and used stratified mean imputation to fill in missing data. Additionally, the China Energy Statistical Yearbook, the China Statistical Yearbook, and the China Industrial Statistical Yearbook for the years 2010, 2012, 2014, 2016, 2018, 2020, and 2022, along with the 2006 IPCC Guidelines for National Greenhouse Gas Inventories, were used to calculate the carbon emission coefficients for the eight consumption categories.
3.1. Variables
3.1.1. The Dependent Variable
The core dependent variable of this study was household consumption carbon emissions, which refers to indirect household carbon emissions, primarily composed of carbon emissions generated during the process of producing eight categories of daily household consumption: food; clothing; housing; household equipment, articles and services; healthcare; transportation and communication; education, culture, and entertainment services; and miscellaneous goods and services. In this respect, drawing on the research methods employed by scholars such as Nazir et al. (2021) [50] and Fan and Hui (2020) [51], this study categorized household consumption into the abovementioned eight categories, matching each consumption type to the corresponding industries; then, each industry was linked to its energy consumption, calculating energy intensity combined with value-added and, then, the carbon emission intensity for each consumption type, based on energy intensity. The industrial sectors considered for each consumption category are shown in Table 1.
Table 1.
Correspondence between household consumption categories and industrial sectors.
Value-added data for 2022 for each industrial sector were taken from the China Industrial Statistical Yearbook and the China Statistical Yearbook. Data on the consumption of coal, coke, crude oil, gasoline, kerosene, diesel, fuel oil, natural gas, and electricity were taken from the China Energy Statistical Yearbook. The specific calculation formula is as follows:
where Km represents the carbon emission coefficient for each category of household consumption (kg/¥); ai represents the total energy consumption of each industrial sector (kg of standard coal); pi represents the value-added of each industrial sector (¥); and Sc represents the emission coefficient per kg of standard coal (kg/kg). The carbon emission coefficients for each consumption category, calculated using Formula (1), are shown in Table 2.
Table 2.
Carbon emission coefficients for household consumption categories.
In synthesis, household carbon emissions were calculated as follows:
where Ei represents household carbon emissions; Km represents the carbon emission coefficient for the m-th category of household consumption; and Cm represents the expenditure amount for the m-th consumption category.
3.1.2. Explanatory Variables
- (1)
- Carbon Trading Participation
A dummy variable was created based on the establishment of a regional pilot for carbon emissions trading. If a region established a pilot in a certain year, then a value of 1 was assigned to DID for that year and for the subsequent years, and 0 otherwise. The “Notice on Launching a Pilot for Carbon Emissions Trading” was officially released in 2011. Pilot markets in Shenzhen (Guangdong), Shanghai, Beijing, Guangdong, and Tianjin started operation in 2013; Hubei and Chongqing pilot markets started in 2014; and the Fujian carbon market started in 2016. Additionally, as Sichuan officially joined the national carbon emissions trading system in December 2016, being the first province after the seven pilot provinces to conduct carbon trading, this study also included this region as a carbon trading pilot region from 2016 onwards.
- (2)
- Carbon Tax
China has not established carbon tax pilot zones or related carbon tax policies in recent years. However, the aim of a carbon tax is to increase the relative cost of high-carbon behaviour, suppressing high-carbon consumption and facilitating faster achievement of carbon neutrality. Accordingly, this study used a proxy variable to indirectly measure the administrative capacity of a carbon tax, reflecting the high-carbon cost shock pressure faced by households. Referring to the method employed by Gao and Tian (2020) [52], which was adapted according to the situation of China, this study employed household high-carbon consumption dependency to measure the carbon tax.
- (3)
- Control Variables
This study included a series of control variables that may affect household consumption carbon emissions in the baseline model: household size, household per capita disposable income, household net assets, household total liabilities, and urban–rural location category. These variables are described in Table 3. This provided reliable data support for the subsequent control of household heterogeneity analysis.
Table 3.
Description of the variables employed in this study.
3.2. Regression of the Carbon Trading Policy
3.2.1. Descriptive Statistics
As illustrated in Table 4, this analysis covered a total of 47,557 observations. The mean value of the core variable, i.e., annual household consumption carbon emissions, was 896.23 kg/year, with a standard deviation of 321.57 kg/year, reflecting noticeable differences in carbon emission levels among different households. The mean values of the dummy variables for carbon trading policy and urban household were 0.28 and 0.52, respectively, corresponding to a proportion of 28% for pilot province households and of 52% for urban households. Regarding household characteristics, the mean household size was 3.42 people. Household annual total income, total assets, and total liabilities were presented in the form of their natural logarithm, with mean values of 10.86, 13.54, and 8.21, respectively, also reflecting the sample distribution characteristics along these dimensions.
Table 4.
Descriptive statistics of the variables of this study.
3.2.2. Baseline Regression
To examine the impact of the carbon trading policy on carbon emissions from household consumption, this study considered the carbon trading pilot policy as a quasi-natural experiment and effectively controlled for pre-existing differences between pilot and non-pilot regions. Those households located in pilot regions were treated as the treatment group, while those in non-pilot regions were treated as the control group. The following two-way, fixed-effects panel data baseline model was established:
The regression results indicate the baseline regression results of the impact of the carbon trading policy on household consumption carbon emissions. The results of the regression without household characteristic control variables, presented in column (2) of Table 5, showed that the coefficient for the carbon trading policy was significantly positive at the 1% level, indicating that the carbon trading policy significantly increased household consumption carbon emissions. Column (3) of Table 5 includes household characteristic variables; the coefficient for the carbon trading policy remained significantly positive at the 1% level, indicating the robustness of the positive impact of this policy on household consumption carbon emissions. In relation to the control variables, the coefficients for household size, income, assets, and liabilities were significantly positive at the 1% level, confirming the logic that a stronger household consumption capacity and a larger household size lead to higher consumption-related carbon emissions. The coefficient for the urban household variable was significantly negative at the 10% level, reflecting the fact that carbon emissions from urban households’ consumption were relatively lower.
Table 5.
Results of the carbon trading policy baseline regression.
3.2.3. Parallel Trends Test
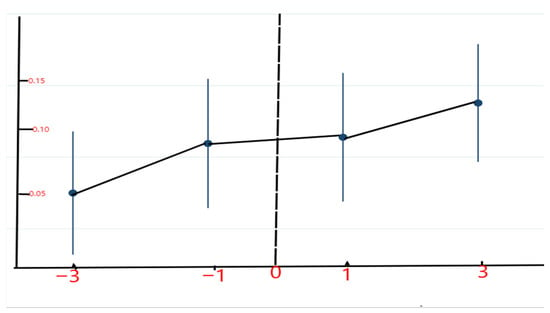
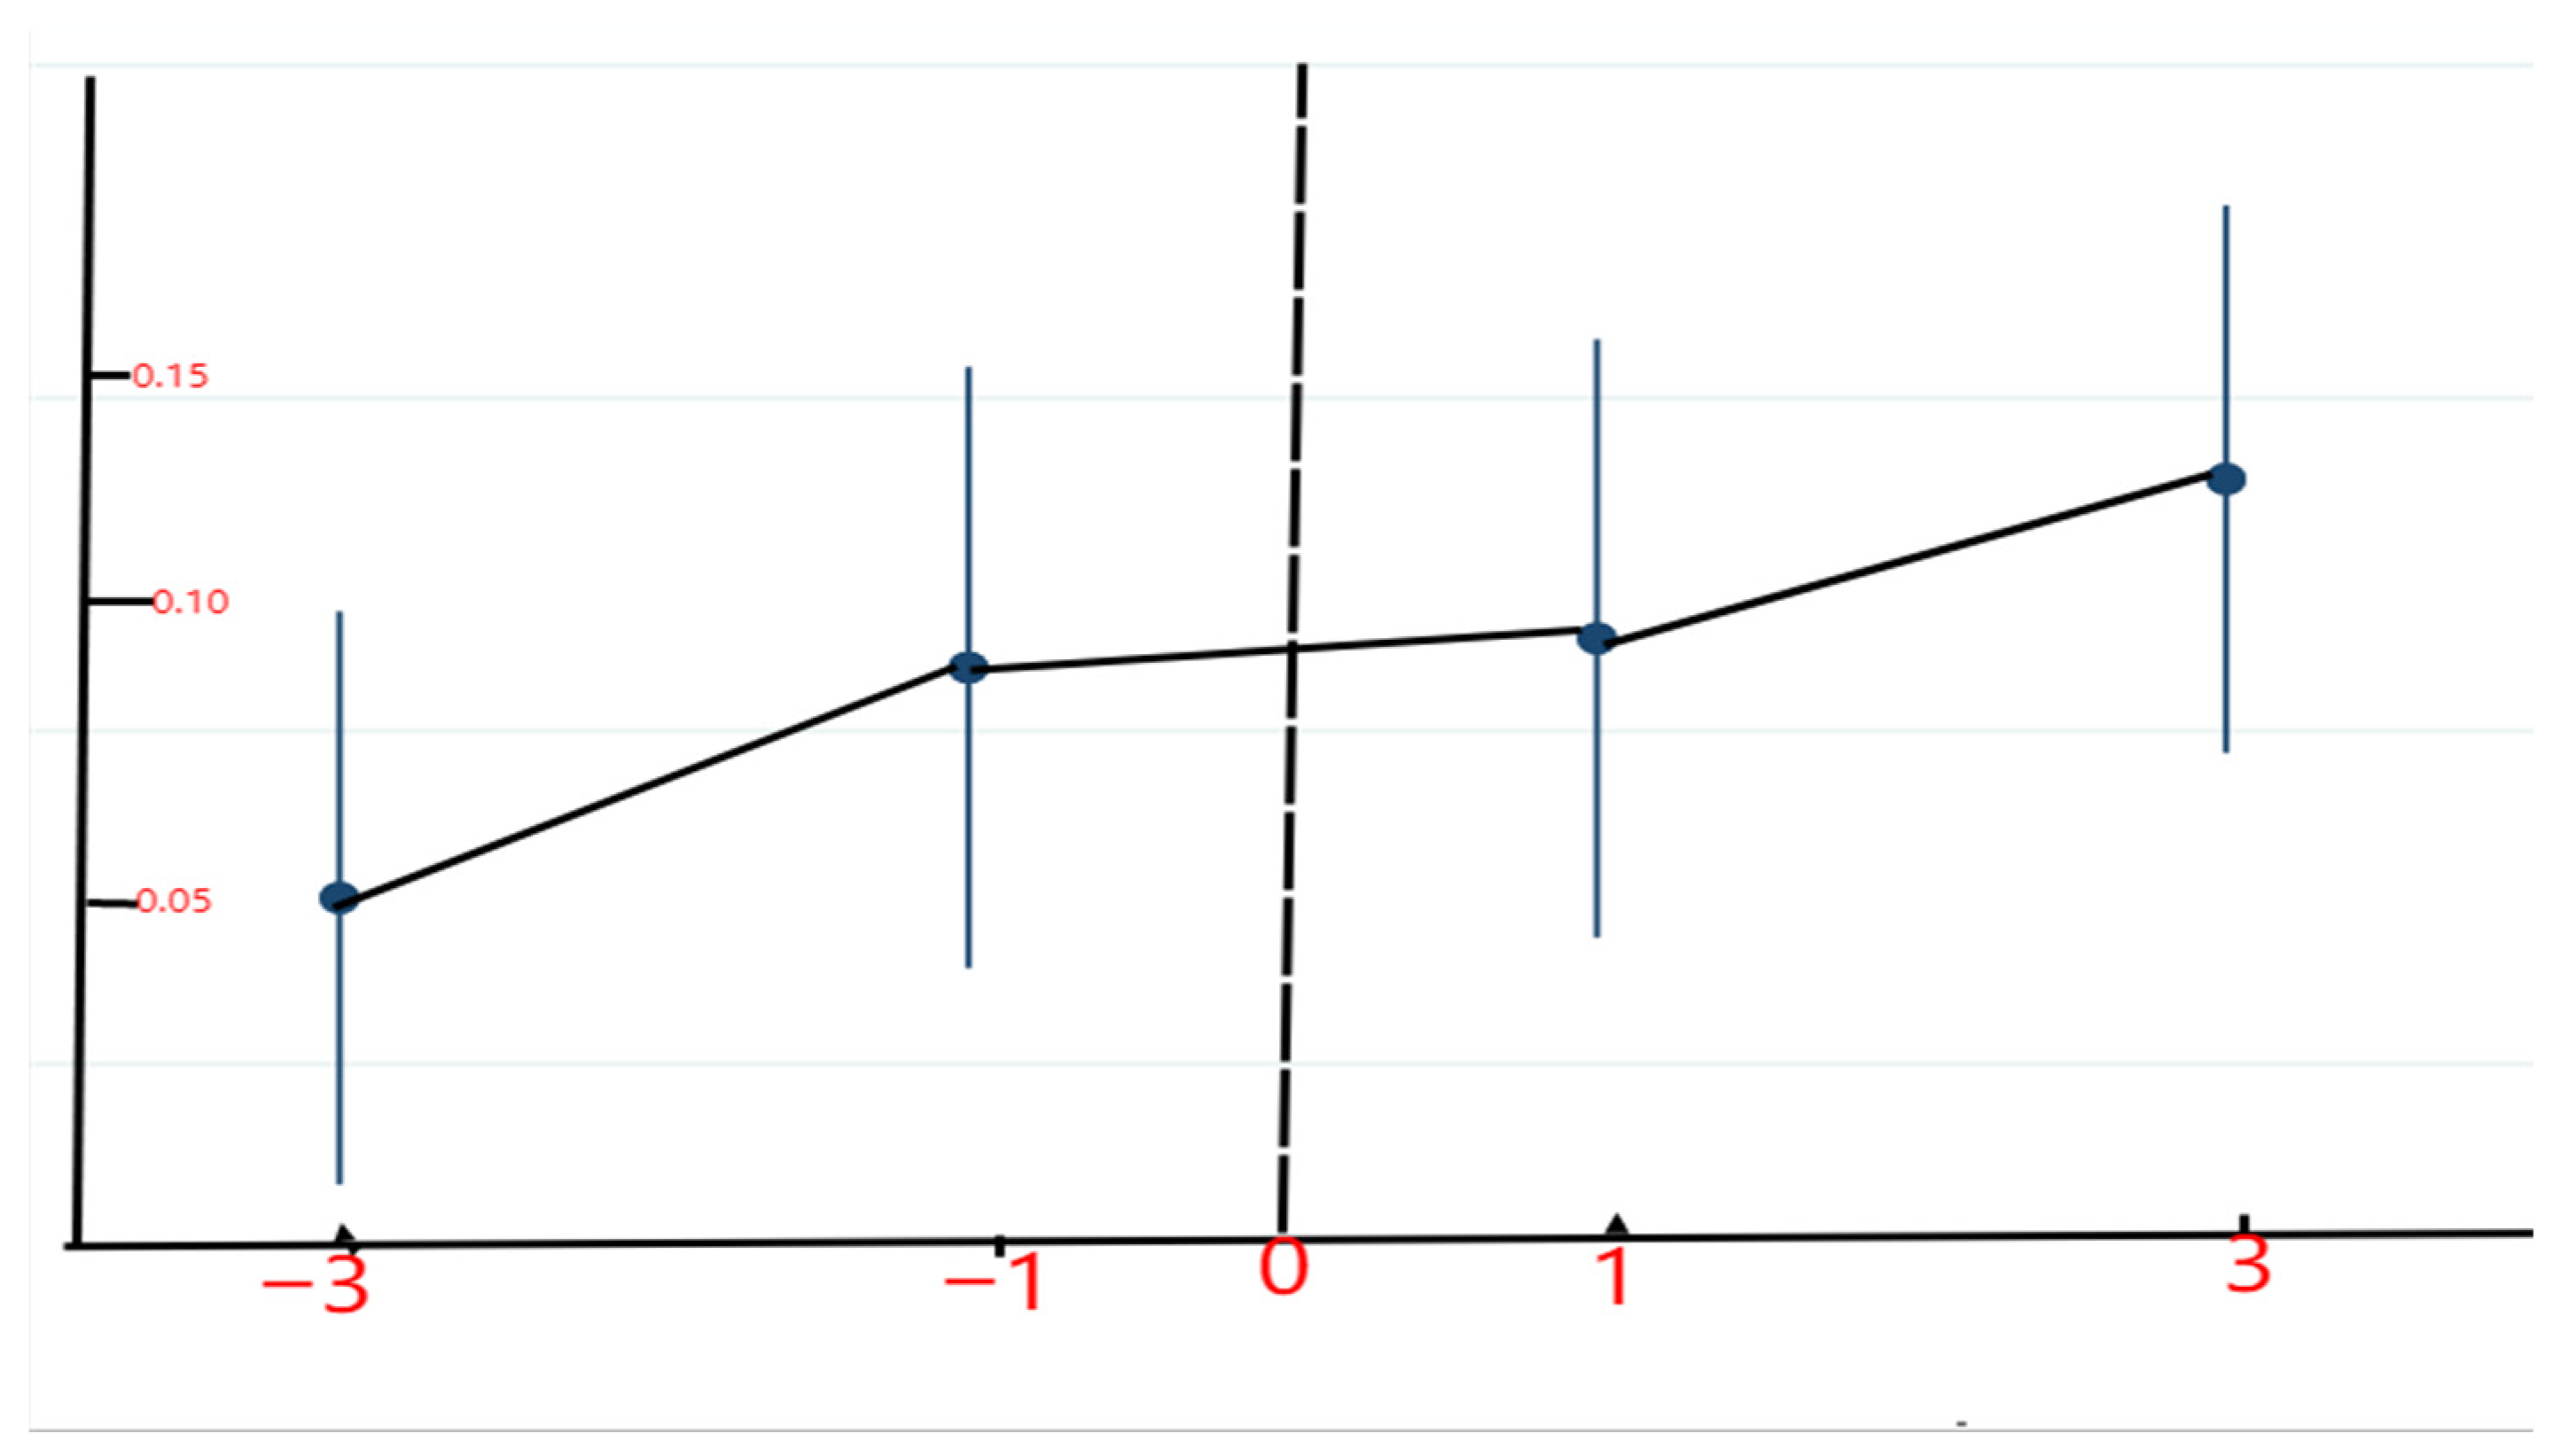
To ensure the appropriateness of using the DID method, this study conducted a parallel trends test. The results of the parallel trends test of the carbon trading policy on household consumption carbon emissions, illustrated in Figure 1, show that there was no statistically significant difference between pilot and non-pilot areas before policy implementation; moreover, the carbon emission trends of pilot and non-pilot households were parallel, thus satisfying the core premise of the DID model.
Figure 1.
Results of the parallel trends test: carbon trading policy.
3.3. Regression Description of the Carbon Tax Policy
Baseline Regression
Considering household high-carbon consumption dependency (HCD) as the explanatory variable, a model was constructed as follows:
From the baseline regression results, as shown in Table 6, it is clear that, independently from the inclusion of the control variables, the coefficient for high-carbon consumption dependency was significantly positive at the 1% level. This validates the policy logic of the carbon tax: households with greater high-carbon consumption dependency face higher carbon tax exposure risk and have higher carbon emission levels. Conversely, it also indicates that the implementation of a carbon tax policy can significantly reduce high-carbon consumption, providing a theoretical basis for the formulation and implementation of future carbon tax policies.
Table 6.
Carbon tax policy baseline regression.
3.4. Regression of the Carbon-Tax-and-Carbon-Trading Policy Composite Mechanism
Considering that China has launched a nationwide carbon trading market and has piloted the implementation of a carbon tax in some provinces, this study aimed to explore the impact of the combination of carbon tax and carbon trading on Chinese households.
Baseline Regression
Based on the proposed models for carbon trading and carbon tax, a composite mechanism model was constructed as follows:
The results, illustrated by Table 7, showed that the impact of high-carbon consumption dependency on carbon emissions for pilot carbon trading households was 1.98 times that for non-pilot areas. Carbon tax and carbon trading formed a composite mechanism with a “superimposed amplification” effect. The possible reasons for this finding are as follows. Carbon quota constraints on high-carbon industries in pilot regions drove up the market prices of high-carbon consumer goods. Households with greater high-carbon consumption dependency had a lower price elasticity of demand for these goods, and their consumption scale did not decrease significantly correspondingly with the increase in prices, ultimately leading to a marginal increase in carbon emissions that was significantly higher than in non-pilot areas. Simultaneously, because the pricing mechanisms of carbon tax and carbon trading are not yet fully formed and unified, the carbon price signal in pilot areas could not be effectively transmitted to actual household consumption, thus failing to effectively offset the increase in carbon emission driven by high-carbon consumption dependency.
Table 7.
Results of the composite policy baseline regression.
3.5. Robustness Tests
3.5.1. Replacing the Explanatory Variable
The explanatory variable, i.e., high-carbon consumption dependency, was replaced with the proportion of transportation and housing expenditure among total expenditure, and the baseline regression was repeated. The results are as shown. The impact of the carbon trading policy after variable replacement was completely consistent with that in the baseline model, with only a slight change in the coefficient magnitudes due to the adjustments in categories. This indicates that the main conclusion of this study, i.e., the driving effect of high-carbon consumption dependency on household carbon emissions in carbon trading policy areas, was robust and was not affected by changes in high-carbon consumption goods, further verifying the reliability of the research findings.
3.5.2. Excluding Municipalities
The level of economic development and the concentration of high-carbon industries among cities may impact the carbon trading market and future carbon tax policies. Therefore, this study repeated the baseline regression but excluded the samples from the cities of Beijing, Tianjin, Shanghai, and Chongqing. The results showed that the coefficient direction and the significance of the core variables were highly consistent with the baseline model. This indicates that the positive effect of the explanatory variable, i.e., the direct emission reduction effect of the carbon trading policy, and the “superimposition effect” of their composite mechanism of interaction had strong robustness, and the model specification and research conclusions were reliable.
3.5.3. Placebo Test
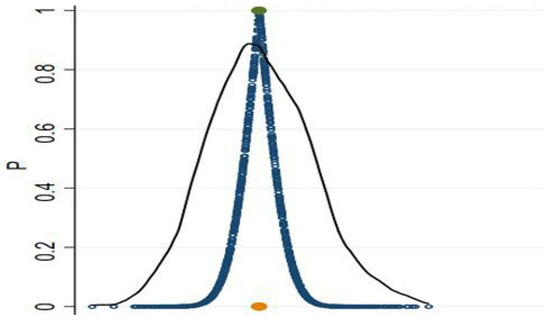
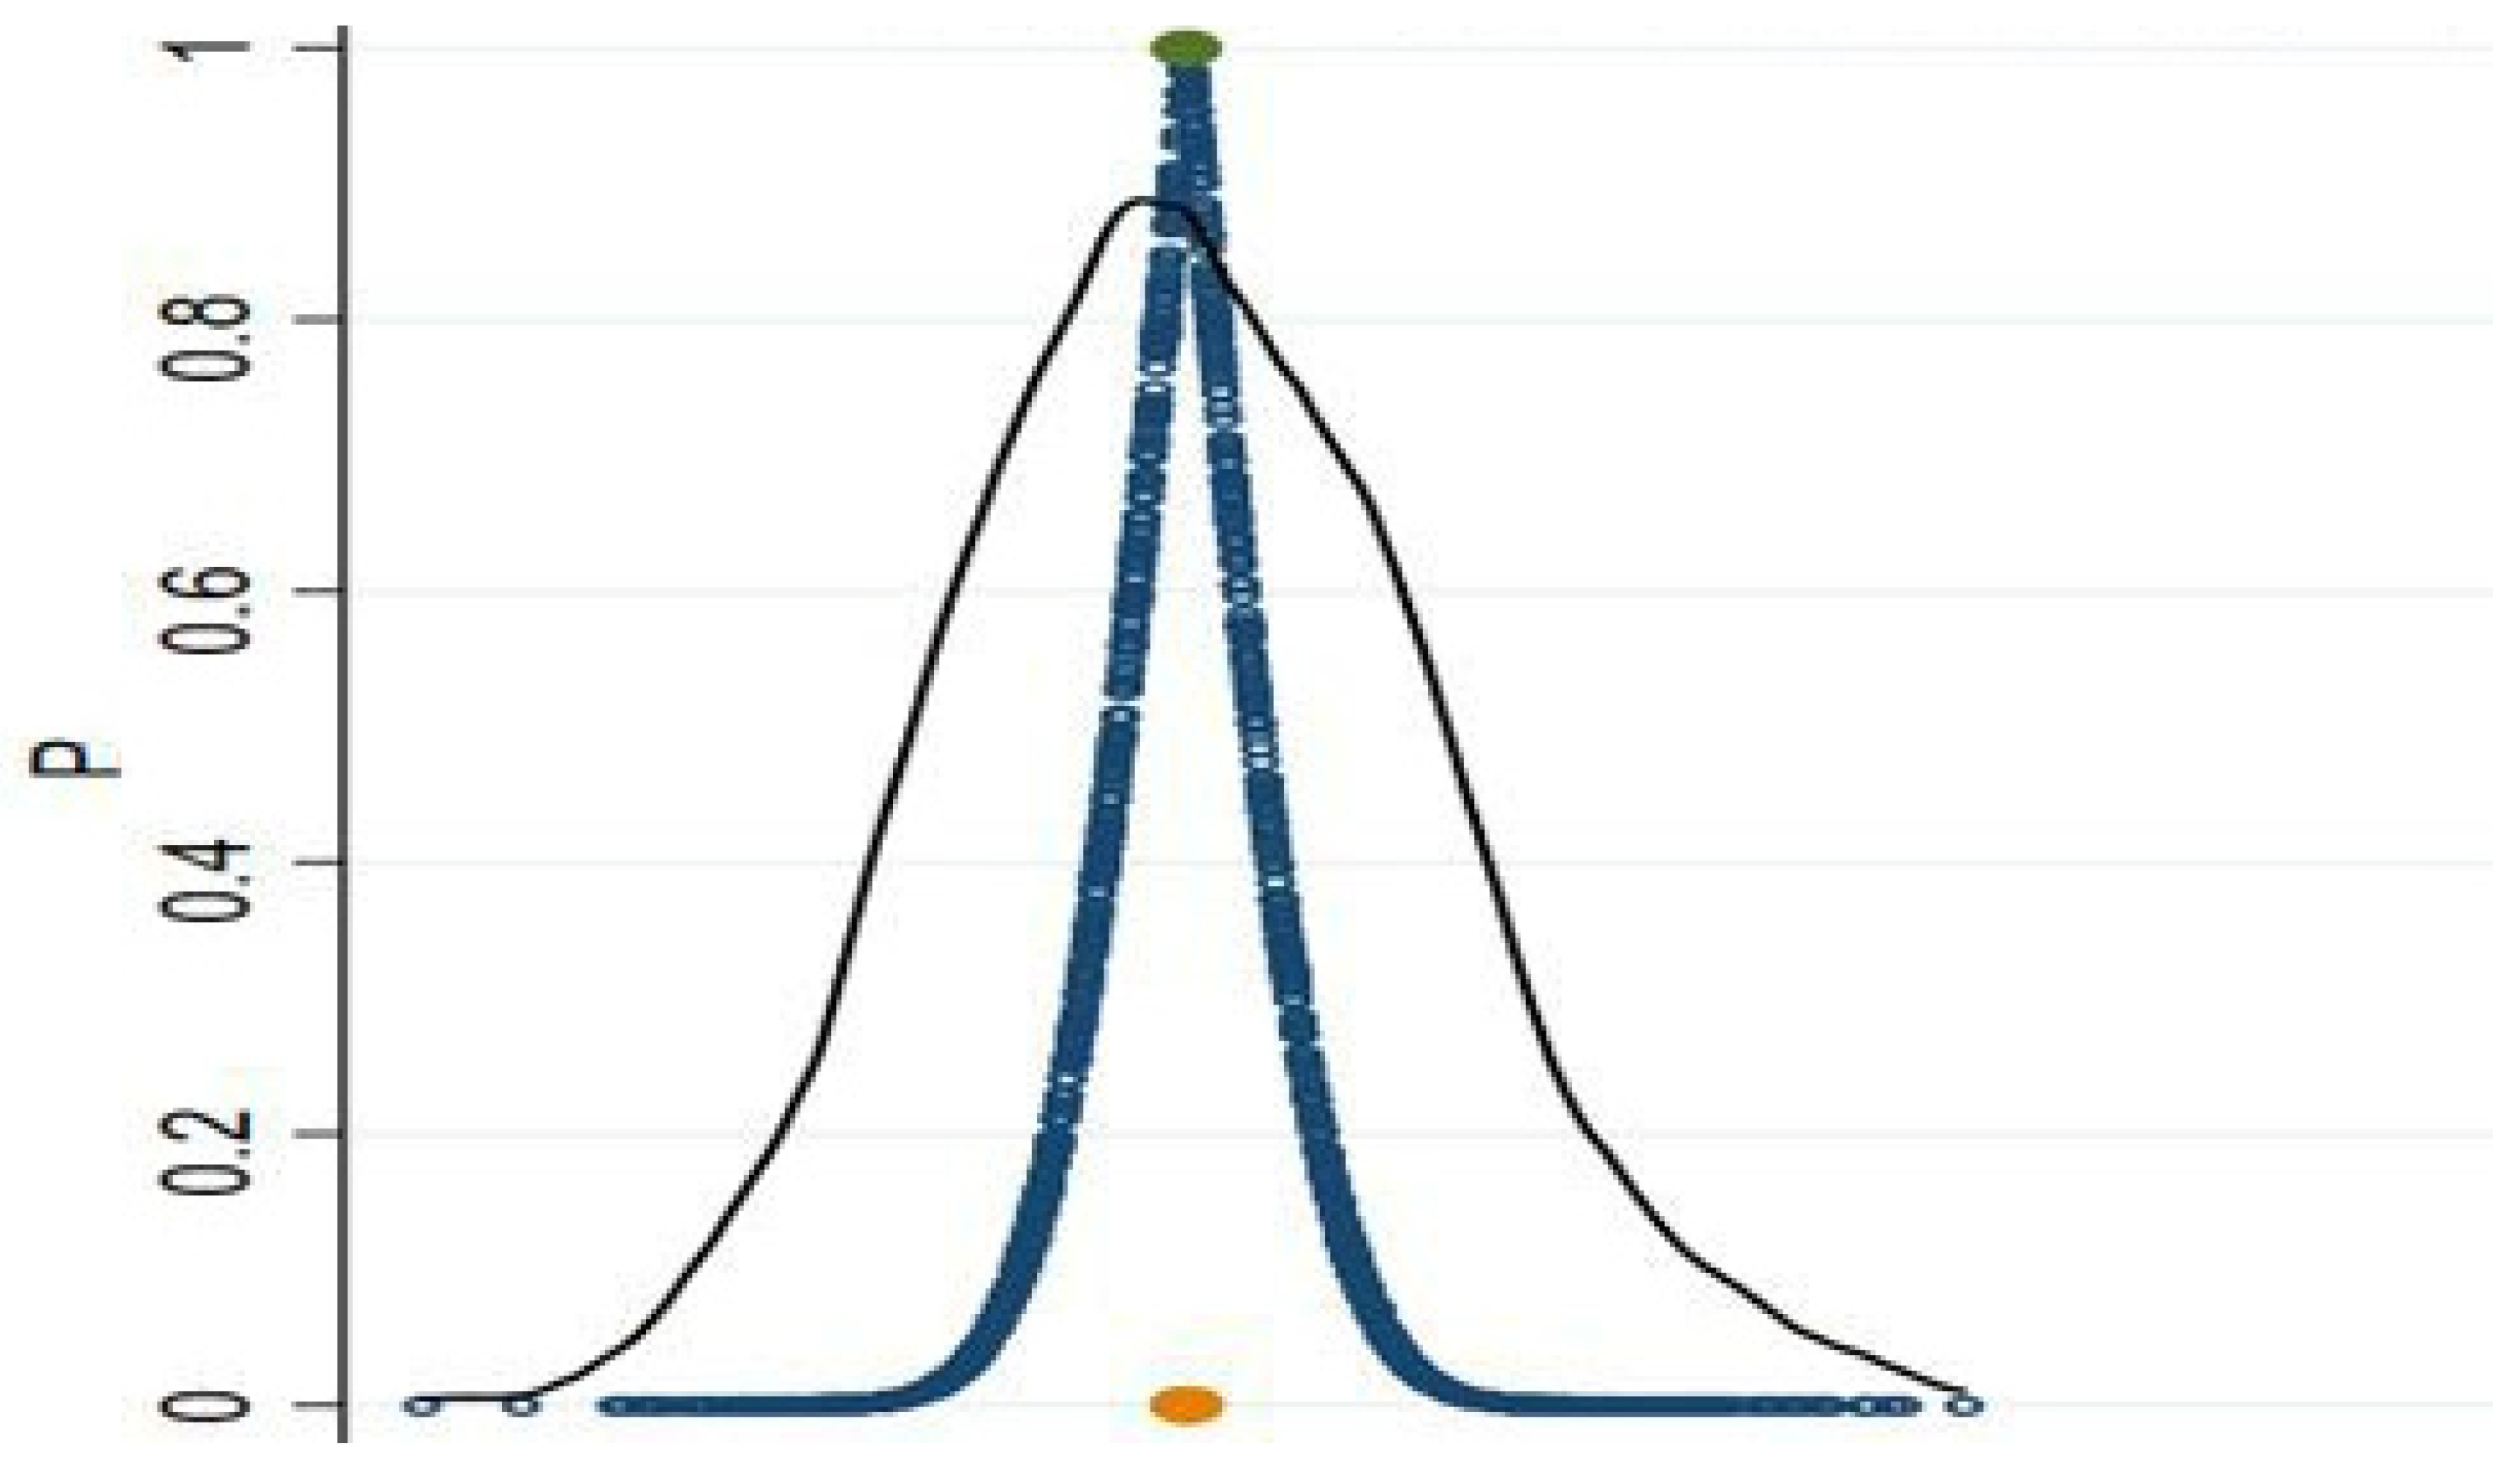
The results of the Placebo test showed that the dummy carbon trading pilot variable and the dummy interaction term were not statistically significant, while the effect of the main carbon tax proxy variable remained stable and significant. This indicates that the identified effect of amplification of the driving impact of carbon tax by the carbon trading policy on household carbon emissions was a real policy effect, and not a random statistical outcome. This provides key confirmation of the reliability of the causal identification of the main conclusion of this study. The results are shown in the Table 8.
Table 8.
Results of the placebo test.
Based on the results obtained, a placebo test graph was plotted as shown in Figure 2.
Figure 2.
Results of the placebo test: random assignment of pilot status.
3.6. Heterogeneity Analysis
3.6.1. Household Income Heterogeneity
This study divided the sample according to household income. When household income was above the median, the value of the household income dummy variable was set to 1, and 0 otherwise. The household income dummy variable was then regressed with the policy composite mechanism. The regression results showed that the regression coefficient for the high-income household group was significantly positive at the 1% level. Moreover, both the regression coefficient for the core explanatory variable in the low-income household group, as well as the regression coefficient of the interaction term between the high-income dummy variable and the composite mechanism, were significantly positive at the 1% level. This indicates that the impact of the carbon-tax-and-carbon-trading policy composite mechanism on the indicators related to household high-carbon consumption exhibited significant income heterogeneity, with a more pronounced effect for high-income households. The reason for this phenomenon may be that high-income households not only have stronger purchasing power and larger disposable budgets—which enable them to more actively respond to carbon tax and carbon trading policies by purchasing low-carbon, energy-saving products and optimize their consumption structure—but also have a higher sensitivity to national policies and a better capacity to use policy information to adjust their consumption behaviour and preferences. Moreover, high-income households generally have a stronger sense of social identity and responsibility, a greater capacity to internalize carbon emission reduction demands into their daily consumption, and the ability and willingness to pay a premium for mid-to-high-end products with green certification and optimized energy efficiency. Therefore, when facing carbon tax cost constraints and carbon trading market price signals, high-income households can adopt more flexible strategies to adjust their consumption behaviour and decisions, making the policy effect of the composite mechanism more prominent.
3.6.2. Urban–Rural Heterogeneity
This study divided the sample according to the regions where the households were located. For households located in an urban area, the value of the urban dummy variable was set to 1, and 0 otherwise. The urban dummy variable and its interaction term with the carbon tax–carbon trading composite mechanism were added to the model for regression testing. The regression results, as shown in columns (3) and (4) of Table 9, indicate that the core explanatory variable for the urban household group was significantly positive at the 1% level. Moreover, both the core explanatory variable for the rural household group, as well as the regression coefficient of the interaction term between the urban dummy variable and the composite mechanism, were significantly positive at the 1% level. This indicates that the impact of the carbon-tax-and-carbon-trading composite mechanism on the indicators related to household high-carbon consumption exhibited significant urban–rural heterogeneity, with a more pronounced effect for urban households. Possible reasons include the fact that urban areas, as key regions for carbon trading pilots, have more mature carbon market mechanisms; simultaneously, urban households face a more advanced low-carbon infrastructure and a richer supply of low-carbon products, and hold stronger policy response capabilities. Furthermore, urban households generally have higher environmental awareness and low-carbon consumption consciousness than rural households, making it easier for them to understand and implement the main requirements of carbon tax and carbon trading policies, and to proactively adjust their high-carbon consumption behaviour accordingly. Additionally, urban households have relatively higher income levels and consumption capacity, which enable them to better bear the initial costs of low-carbon transformation, thus allowing a greater achievement of the policy utility of the composite mechanism.
Table 9.
Results of the heterogeneity analysis.
3.6.3. Regional Heterogeneity
This study divided the sample according to the geographical location of the household’s province (i.e., Eastern, Central, or Western China). When a household was located in the Eastern region, the Eastern dummy variable was set to 1, and 0 otherwise. Regional dummy variables and their interaction terms with the carbon tax–carbon trading composite mechanism were added to the model for regression testing. The regression results, shown in columns (2), (3), and (4) of Table 10, indicate that the core explanatory variable was significantly positive at the 1% level for all the three regions investigated, while the regression coefficients of the interaction term with the composite mechanism for the Eastern dummy variable and the Central dummy variable were also both significantly positive at the 1% level.
Table 10.
Results of the heterogeneity analysis.
This indicates that the impact of the carbon-tax-and-carbon-trading composite mechanism on the indicators related to household high-carbon consumption exhibited significant heterogeneity across Eastern, Central, and Western regions, with the most prominent policy effect for Eastern households, followed by Central households, and a relatively weak effect for Western households. Possible reasons include the fact that the Eastern region, as the main layout area of national carbon trading pilots, has more fine-tuned carbon market mechanisms, as well as more mature low-carbon industrial systems and infrastructure. Simultaneously, Eastern households generally have higher income levels, environmental awareness, and digital information acquisition capabilities, which enable them to more actively respond to carbon tax and carbon trading policies and adjust their high-carbon consumption behaviour. The Central region is influenced by industrial transfer and policy spillover effects from the Eastern region, and serves to a certain extent as a foundation for low-carbon transformation; however, it is limited by a lower level of regional economic development and low-carbon product supply capacity, resulting in a policy effect that is weaker than for the Eastern region. Finally, due to later coverage by carbon trading pilots, lagging low-carbon infrastructure construction, and lower household income levels and environmental awareness, the Western region has insufficient efficiency in policy transmission; accordingly, it has the lowest degree of policy effect release from the composite mechanism. Furthermore, the industrial structure in the Western region is dominated by traditional, high-carbon industries, with a higher proportion of high-carbon categories in household consumption structures and lower adjustment elasticity, which further weakens the policy’s impact on household high-carbon consumption.
3.7. Mediation Analysis: Why Carbon Intensity Decreases While Total Emissions Remain Largely Unchanged
To explain the observed pattern—a significant reduction in carbon intensity but no statistically significant change in total emissions—we conducted a mediation analysis following Baron and Kenny (1986) [22]. Two mediating variables were constructed: (1) high-carbon consumption share (HCS) = (expenditure on housing + transportation + high-carbon food items)/total household consumption expenditure; and (2) household consumption scale (ln_consumption) = natural logarithm of total household consumption expenditure. The analysis proceeded in three steps.
Step 1: Regress carbon intensity (the dependent variable for this analysis) on the composite mechanism (HCD × Treat_ets). The composite mechanism had a significant negative effect on carbon intensity (β = −0.324, p < 0.01), confirming the main effect.
Step 2: Regress each mediator on the composite mechanism. The composite mechanism significantly reduced the high-carbon consumption share (β = −0.187, p < 0.01) but had a non-significant effect on total consumption scale (β = 0.042, p = 0.312).
Step 3: Regress carbon intensity on both the composite mechanism and the mediators. The indirect effect via HCS was significant (Sobel test p < 0.01), while the direct effect of the composite mechanism became smaller and non-significant. The indirect effect via consumption scale was not significant.
Conclusion: The composite mechanism reduces carbon intensity by lowering the share of high-carbon consumption (compositional effect). However, because the total consumption scale does not decrease—and in fact continues to grow due to rising incomes—total carbon emissions (E = intensity × scale) do not show a statistically significant reduction. This decoupling is a common intermediate stage in the transition to sustainable consumption.
4. Spatio-Temporal Trends of Carbon Emissions
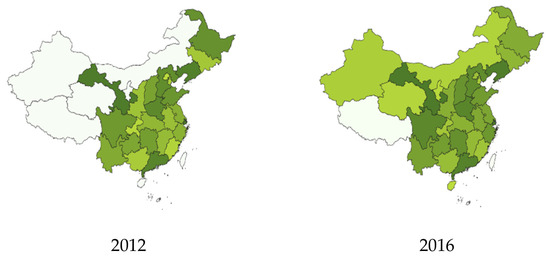
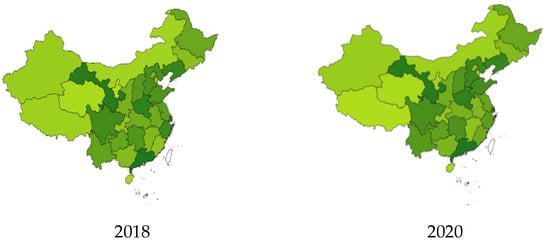
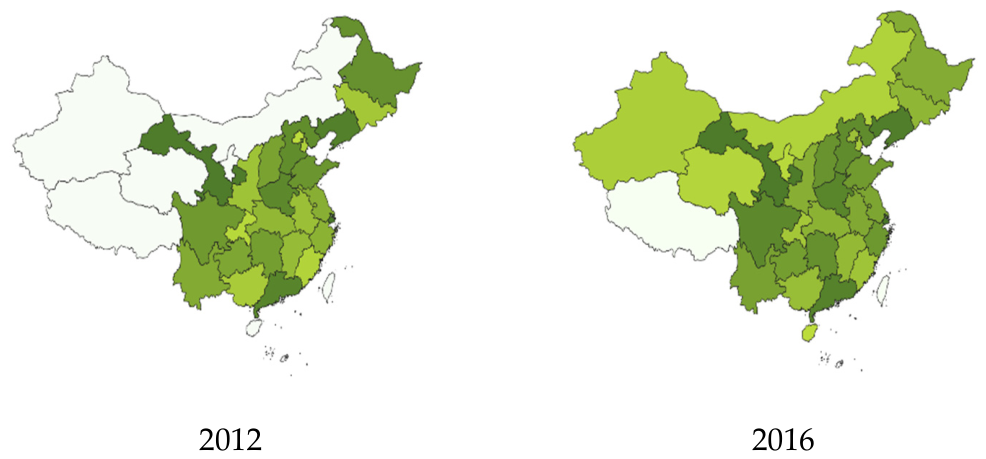
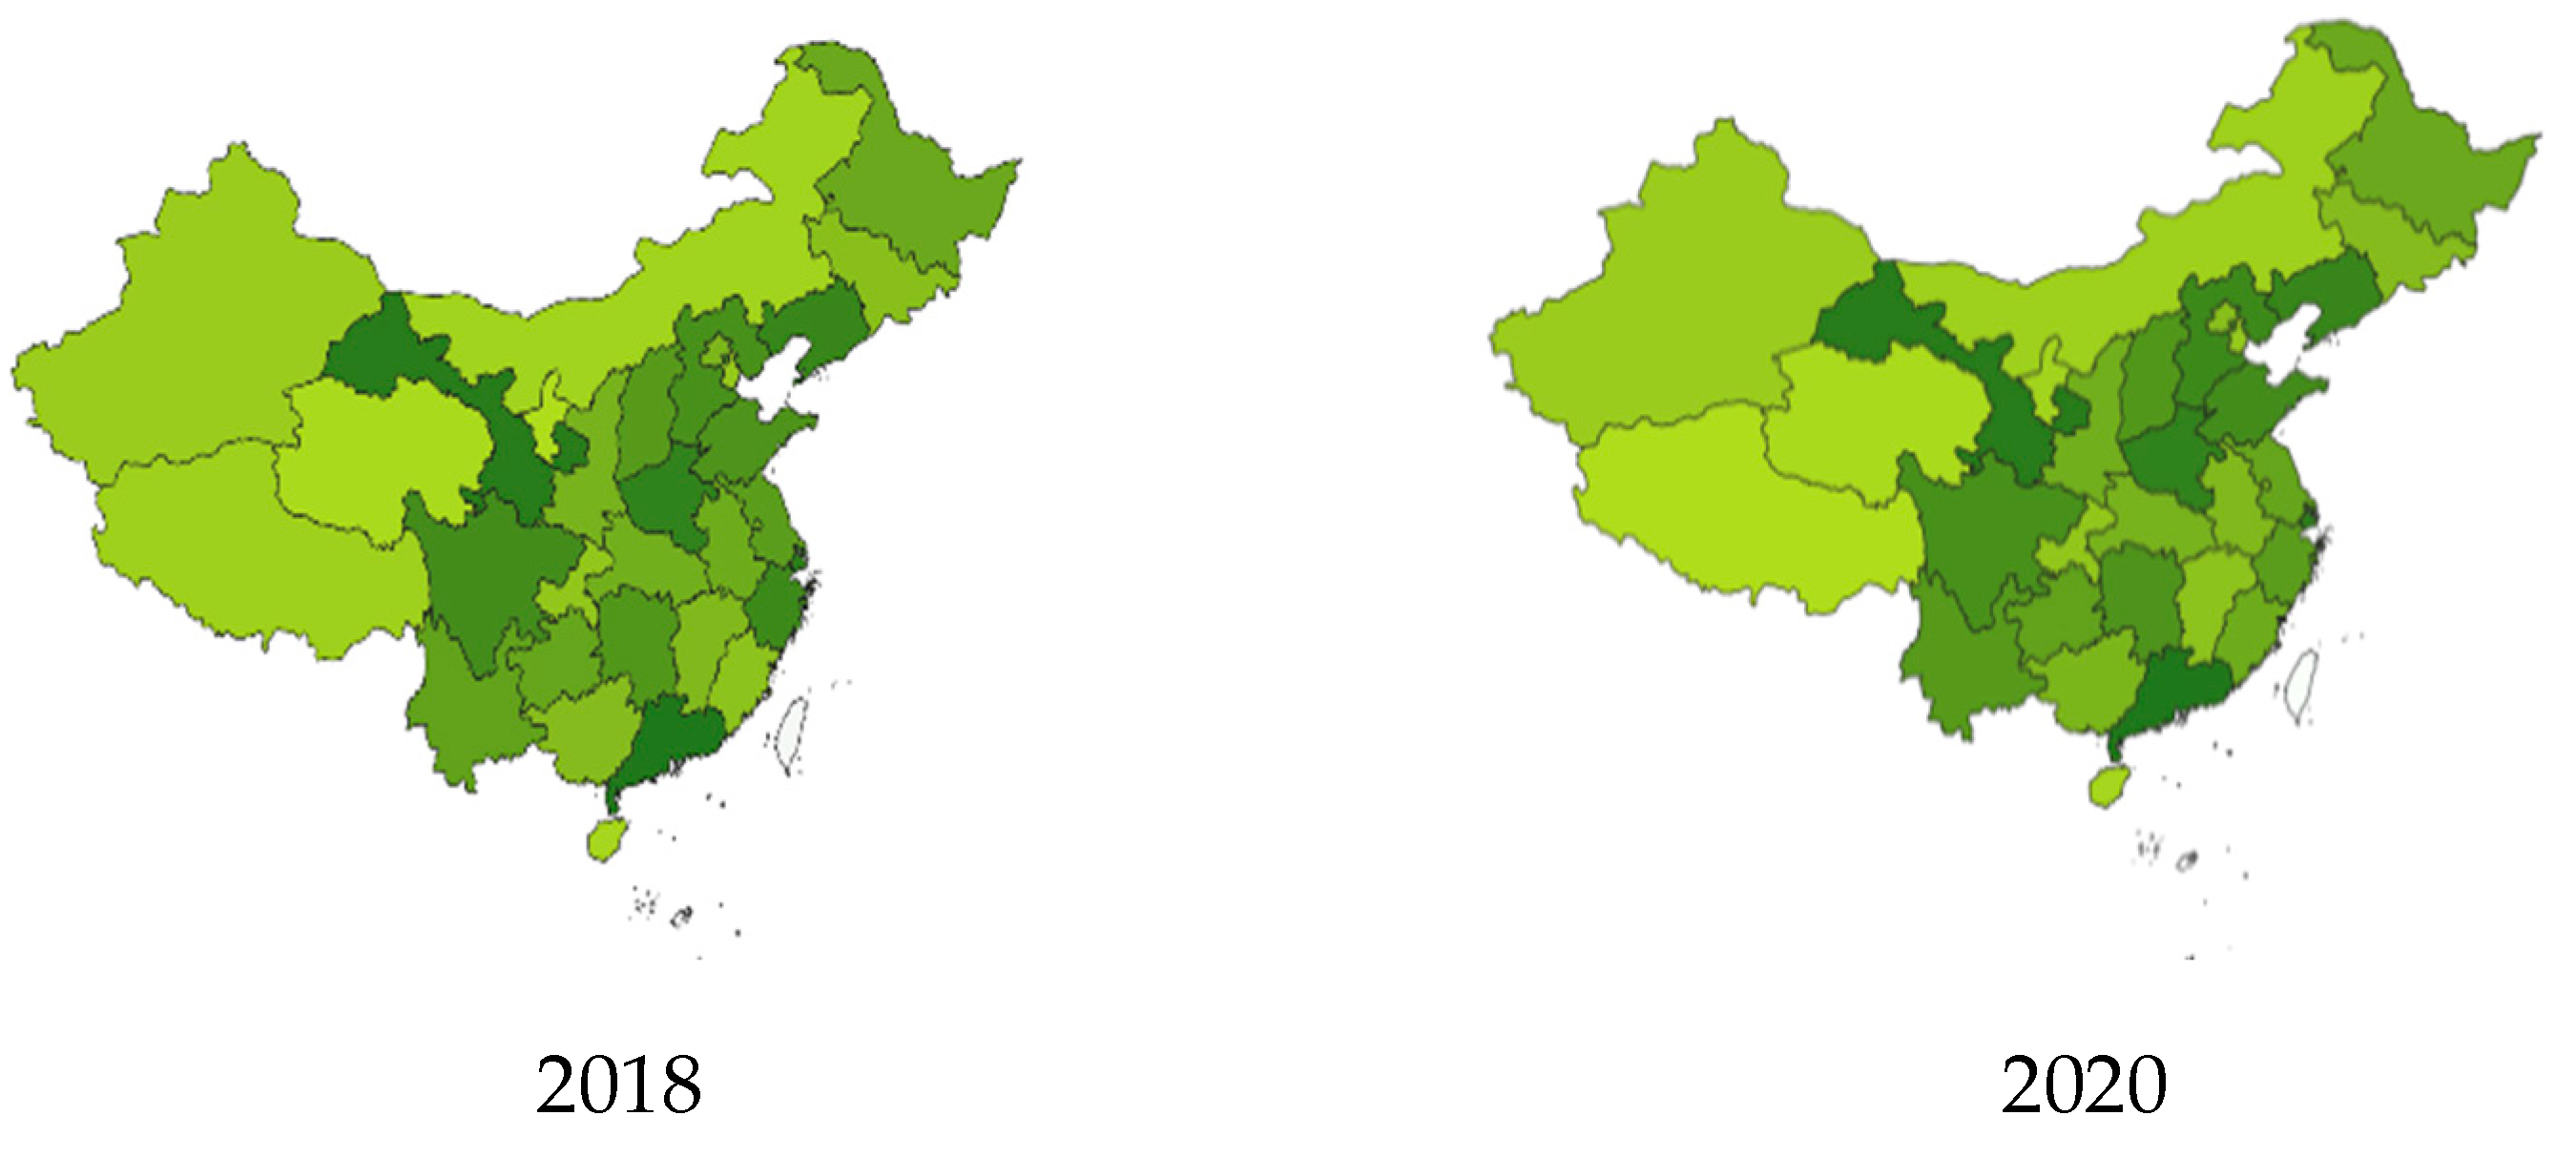
To better explore the changes in household carbon emissions across different historical periods and policy announcement nodes, a spatio-temporal distribution map of household carbon emissions from 2012 to 2018 was plotted shown in Figure 3. This was combined with the preceding empirical results, allowing us to draw the findings presented in the following sub-sections.
Figure 3.
Spatial distribution characteristics of household carbon emissions in China from 2012 to 2020.
4.1. Evolution Trends of Total Volume and Structure of Carbon Emissions
Total carbon emissions showed phased fluctuation characteristics. From 2012 to 2020, China’s household consumption carbon emissions first experienced a phased decline, followed by a “V-shaped” recovery from 2013 to 2016, and then an upward trend after 2017. This reflects the correlation between the growth pace of household carbon emissions, economic cycles and policy formulation. From 2012 to 2018, per capita carbon emissions of urban households grew from 1.4 tons to 3.0 tons, and the total volume increased from 860 million tons to 2.62 billion tons, with an average annual growth rate of 3.7%. Emission growth rates showed structural differentiation. The growth rate of household carbon emissions in high-income regions gradually slowed, confirming the decreasing elasticity of carbon emissions with economic development. In contrast, influenced by the advancement of urbanization, the Central and Western regions maintained high emission growth rates, creating regional growth rate disparities.
4.2. Spatial Distribution Characteristics of Household Carbon Emissions
4.2.1. Macro-Regional Differentiation
A main pattern of spatial distribution was observed, characterized by higher values in the Eastern region and lower values in the Western region. In fact, indirect carbon emissions per capita showed a significant decline from Eastern to Western provinces. Per capita carbon emissions in developed Eastern provinces were several times higher than in the Western region, with high-emission agglomeration areas centred on the Beijing–Tianjin–Hebei region, the Yangtze River Delta, and the Pearl River Delta. Furthermore, the results of the heterogeneity analysis on urban–rural aspects showed that China’s carbon emissions exhibited agglomeration characteristics. High-emission areas showed a “core–periphery” structure, with the carbon emission intensity of households in the main cities significantly higher than in surrounding counties, thus reflecting spatial restructuring of emissions during the process of urban–rural integration.
4.2.2. Micro-Spatial Differentiation
At the micro level, differentiation was mainly observed in relation to urban–rural differences and intra-regional variations. From 2012 to 2020, the average annual growth rate of per capita carbon emissions from urban households was significantly higher than for rural households, and was mainly driven by increased appliance ownership and upgraded travel demand. Simultaneously, to better assess the occurrence of spatial spillover effects in carbon emissions under spatio-temporal trends, this study constructed a Spatial Econometric Model that was suitable for the sample.
4.3. Spatial Econometric Model and Results of the Empirical Analysis
4.3.1. Model Construction
Due to sample characteristics, this study selected the Spatial Lag Model (SLM) to study spatial spillover effects. The model is as follows:
4.3.2. Empirical Results
The estimation results of the SLM model are shown in the Table 11.
Table 11.
The Spatial Econometric Model.
4.3.3. Discussion of the Results
All three models considered passed the significance tests, indicating that the explanatory variable and the control variables jointly had a significant impact on household carbon intensity. The complete model with controls had the best fit, explaining the importance of household carbon emissions and highlighting the necessity of control variables in model specification. Regarding the core variables, high-carbon consumption dependency was significantly positive in all the models, and its coefficient gradually decreased with the inclusion of control variables, indicating that it was a core driving factor of household carbon emissions. The carbon trading and carbon tax composite mechanism was significantly positive only after adding controls, confirming that households with greater high-carbon consumption dependency in pilot areas had a low price elasticity of demand for high-carbon goods, and the composite mechanism had an amplification effect. This effect was masked when household characteristics were not controlled. The carbon trading pilot was significantly negative only after adding controls; this indicates that, although the pilot policy itself inhibited carbon emissions, the characteristics of high income and assets in pilot areas pushed up carbon emissions. The spatial lag term was positive but insignificant in all models, indicating a weak regional spillover effect of household carbon emissions. This may stem from the low spatial correlation in household consumption, or from the fact that the household-level weight matrix did not accurately capture regional linkages, which can be aggregated to the provincial level for future testing. In synthesis, the inclusion of control variables significantly affected the coefficient magnitude, direction, and significance of the core explanatory variables. The amplification effect of the carbon trading and carbon tax composite mechanism only appeared after controlling for household heterogeneity characteristics; this reveals the moderating role of household characteristics on the policy mechanism, and provides empirical evidence for the formulation of differentiated carbon reduction policies.
5. Conclusions and Recommendations
5.1. Conclusions
The impact of the carbon trading and carbon tax composite policy mechanism on household carbon emission reduction was significant. Its operational logic and practical effects were fully verified through a two-way fixed-effects panel model and multiple robustness tests. In terms of the main effect, although the composite mechanism did not lead to a statistically significant reduction in total household carbon emissions, it significantly reduced household carbon intensity by constraining high-carbon consumption behaviour and optimizing consumption structure. This effect remained statistically robust, confirming the policy effectiveness and practical value of the composite mechanism at the micro-individual level. From a sustainability perspective, the composite mechanism’s ability to lower carbon intensity while maintaining household consumption levels demonstrates that environmental policy need not sacrifice economic well-being—a core principle of sustainable development. Our findings thus provide a practical pathway for reconciling climate action with continued improvements in living standards. This conclusion aligns with the international practice logic of carbon emission reduction policies prioritizing intensity over total volume, and also provides new empirical evidence for the design of consumption-side emission reduction policies.
The observed pattern—a significant reduction in carbon intensity but no significant change in total emissions—can be explained by the compositional effect versus the scale effect. The composite mechanism successfully shifts household consumption away from high-carbon goods (e.g., energy-intensive housing and private transport) towards lower-carbon alternatives, thereby reducing the carbon emitted per unit of expenditure. However, total household consumption continues to expand as incomes rise, offsetting the per-unit emission reduction. This decoupling of intensity from total volume is a common intermediate stage in the transition to sustainable consumption, as also observed in many developed economies during their early decarbonisation phases.
Regarding the transmission mechanism, policy intervention in carbon trading pilot areas had a significant amplification effect. The empirical results showed that the marginal impact of household high-carbon consumption dependency on carbon emissions in pilot areas was significantly higher than in non-pilot areas. The internal logic is that carbon quota constraints on high-carbon industries in pilot areas drove up the prices of terminal high-carbon consumer goods through industrial chain transmission. However, as households with greater high-carbon consumption dependency have a lower price elasticity of demand for these goods, their consumption scale did not contract proportionally with the price increase, ultimately leading to a marginal increase in carbon emissions that was higher than in non-pilot areas. Further analysis showed that the pricing mechanisms of carbon tax and carbon trading have not yet achieved synergy and unification. The fragmentation of carbon price formation mechanisms led to lag effects in market signal transmission, failing to effectively offset the carbon emission-driving effect of high-carbon consumption. This finding resonates with relevant theoretical predictions.
By performing grouped regressions across income, urban–rural, and regional dimensions, a clear picture of heterogeneity was obtained, and all differences were verified through standard tests. In relation to the income dimension, the carbon intensity suppression effect of the composite mechanism on high-income households was significantly stronger than on low-income households. This difference stems from high-income households’ stronger payment capacity for low-carbon transition, better information access channels, and higher sensitivity to policy signals. The elasticity of their consumption structure adjustment was significantly higher than that of low-income households, which is consistent with the performance logic of the “Environmental Kuznets Curve” at the micro level. In relation to the urban–rural dimension, the policy response efficiency of urban households was significantly higher than that of rural households. The main driving factors of this finding include a higher low-carbon infrastructure supply in urban areas, richer low-carbon product market choices, and higher environmental awareness among urban households. In relation to the regional dimension, the policy effect of the composite mechanism showed a gradient differentiation characterized by higher values in the Eastern region, followed by the Central region and the Western region. This pattern was highly correlated with regional differences in terms of carbon market maturity, low-carbon industrial system development, household income levels, and environmental governance capacity across Eastern, Central, and Western China. It also reflects the fact that the industrial structure in the Western region is dominated by high-carbon traditional industries, leading to a higher proportion of high-carbon categories in household consumption structures and smaller adjustment elasticity, further weakening policy transmission efficiency.
Through kernel density estimation and spatial autocorrelation analysis, it was possible to identify the evolutionary characteristics and spatial distribution patterns of household carbon emissions. In relation to the temporal dimension, China’s total household carbon emissions during specific periods exhibited a three-stage evolution, characterized by a phased decline, followed by a V-shaped recovery and then a steady rise. The phased decline was directly related to the promotion of energy-saving policies and guidance for low-carbon consumption. The recovery stemmed from consumption upgrading, driven by increased resident income. The subsequent steady rise was related to factors such as accelerated urbanization and a surge in related consumer goods ownership. From a segmented group perspective, per capita carbon emissions of urban households showed a steady growth trend, while the carbon emission elasticity of households in high-income regions exhibited a significant decrease. This phenomenon aligns with the theoretical prediction of the “Carbon Emission Kuznets Curve,” indicating that after reaching a certain stage of economic development, household consumption structure transitions towards low-carbonization. In relation to the spatial dimension, household carbon emissions showed a significant macro distribution pattern, characterized by higher values in the Eastern regions and lower values in the Western region, as well as a core–periphery agglomeration characteristic. High-emission provinces exhibited significant positive spatial correlation, forming high-emission agglomeration areas centred on key city clusters. Local spatial correlation analysis showed that the carbon emission intensity of households in core cities was significantly higher than in surrounding counties, reflecting the spatial restructuring effect of carbon emissions during urban–rural integration. Further decomposition of the driving factors indicated that energy consumption structure and household consumption patterns were the main factors influencing spatial distribution differences, thereby complementing conclusions from existing related research.
The impact of control variables was systematically verified through multiple robustness tests, and its direction was highly consistent with theoretical expectations. Household size, per capita disposable income, household net assets, and total liabilities had a significant positive impact on household carbon emissions. This result aligns with the theoretical logic that a stronger consumption capacity and larger household size lead to higher carbon emission demand; in other words, an increase in household size directly increases carbon emissions from basic consumption such as for housing and food, while rising income and asset levels promote growth in upgraded consumption such as for transportation and education/culture/entertainment, thus indirectly expanding the carbon emission scale. It is worth noting that the carbon emission levels of urban households were relatively low. This is closely related to factors such as higher energy use efficiency, stronger availability of low-carbon products, and more comprehensive public transportation coverage for urban households; moreover, it provides an empirical basis for the design of differentiated emission reduction policies for urban and rural areas. These conclusions remained robust even after multiple robustness tests, thereby fully demonstrating the reliability and universality of the research findings of this study. Collectively, these policy recommendations aim to operationalize the transition to a low-carbon, sustainable household sector, contributing to the long-term sustainability of China’s economy and society.
5.2. Policy Recommendations
5.2.1. National Level: Improve the Composite Policy System and Strengthen Differentiated Regulation
At the national level, it is recommended to optimize the design of the carbon trading and carbon tax composite mechanism, unify their pricing standards, eliminate barriers to carbon price signal transmission, and construct a synergistic model based on the concept of “carbon tax as bottom-line constraint + carbon trading as flexible adjustment”, to fully unleash policy synergy effects. Moreover, it is recommended to implement tiered carbon tax policies for high-carbon-intensity consumption areas such as housing and transportation, and provide Carbon Inclusion point rewards for low-carbon behaviours, such as purchasing energy-saving appliances and green travel, so as to encourage a policy orientation that equally emphasizes constraints and incentives. Furthermore, it is recommended to promote comprehensive coverage of household carbon accounts, incorporate household carbon reduction amounts into the national carbon trading market, and establish a conversion path of reduction points–carbon quota–economic benefits. Priority should be given to piloting voluntary carbon trading mechanisms targeting urban high-income households, which would be gradually extended to rural areas and low-income families. In addition, by relying on databases such as the CFPS, it is recommended to build a dynamic monitoring system for household carbon emissions to provide precise data support for policy adjustment. Regionally differentiated regulation strategies should also be implemented. For the Eastern region, these should focus on guiding the low-carbon transformation of the consumption structure, as well as on promoting low-carbon products such as new energy vehicles and green buildings. For the Central and Western regions, fiscal transfer payments should be increased to support low-carbon infrastructure construction such as public transportation and clean energy supply, thereby reducing household low-carbon transition costs. Preferential policies should also be introduced, such as subsidies for the purchase of low-carbon products and special funds for energy-saving housing renovations targeting rural households, so as to narrow the urban–rural policy response gap.
5.2.2. Social Level: Strengthen Multi-Agent Linkage and Build Emission Reduction Support System
At the social level, it is recommended to guide enterprises to focus on high-carbon emission areas such as housing and transportation; accelerate the R&D iteration of low-carbon products such as energy-saving building materials, efficient appliances, and new energy vehicles; and reduce the embodied carbon emissions of household consumption through technological advancement. For industries such as food and education/culture/entertainment, it is recommended to promote green transformation at the production end, including promoting green agricultural cultivation techniques and accelerating the digital upgrading of cultural industries, thereby indirectly reducing household consumption carbon intensity. Moreover, it is recommended to establish a product life-cycle carbon footprint labelling system, mandating enterprises to disclose carbon emission coefficients for the eight categories of consumption considered (food, clothing, etc.), thereby providing a clear decision-making basis for household low-carbon consumption choices. Furthermore, it is recommended to build an “enterprise–household” emission reduction linkage platform, encouraging enterprises to introduce incentives such as carbon point exchange and discounts on low-carbon products, connecting with the Carbon Inclusion mechanism to enhance households’ enthusiasm for low-carbon consumption. In addition, it is recommended to promote low-carbon industrial transfer and technology spillover between the Eastern, Central, and Western regions, reducing dependence on high-carbon categories in Western household consumption through industrial cooperation. Finally, a cross-regional carbon reduction benefit compensation mechanism should be established, supporting high-emission Eastern regions to purchase household emission reduction quotas from low-carbon Central and Western regions, establishing a regional win–win emission reduction pattern.
5.2.3. Household Level: Cultivate a Low-Carbon Consumption Culture and Enhance Autonomous Emission Reduction Capacity
At the household level, it is recommended to carry out publicity and education centred on the “Carbon Inclusion” concept, guiding households to optimize their consumption structure and promoting green lifestyles such as multi-generational cohabitation, public transportation priority, and reducing high-carbon food consumption. Moreover, it is recommended to implement low-carbon subsidy policies targeting households, fully leveraging household economies of scale to reduce per-unit carbon emissions. In addition, it is recommended to strengthen digital technology empowerment and support the development of user-friendly household carbon footprint tracking apps linked to smart meters, vehicle terminals, and other devices to monitor real-time carbon emission data for the eight consumption categories considered, helping households precisely identify their emission reduction potential through visual feedback. Furthermore, it is recommended to simplify app operation processes for rural and low-income households, complemented by the distribution of low-carbon behaviour guidance manuals to improve policy adaptability. Down-to-earth low-carbon policy briefing activities should also be conducted, focusing on popularizing the main logic of carbon tax and carbon trading among rural and Western households, so as to lower barriers in policy understanding. High-income and urban households should be encouraged to play a demonstrative and leading role, driving surrounding households to participate in low-carbon actions through community sharing and public welfare activities, promoting the formation of a low-carbon consumption culture with public participation and shared benefits, and solidifying the micro-foundation for the achievement of the “Dual Carbon” goals.
5.3. Limitations and Future Research
Despite the contributions of this study, several limitations should be acknowledged. First, the most fundamental limitation is that China has not yet implemented an actual carbon tax policy. Consequently, our “carbon tax” variable is proxied by household high-carbon consumption dependency (HCD). Although this proxy captures the hypothetical cost pressure of a carbon tax on high-carbon behaviour, it does not fully reflect the complex price and regulatory mechanisms of a real carbon tax. Future research should revisit this question when China introduces formal carbon tax pilots or a national carbon tax, and then estimate the actual policy effect. Second, while we employ two-way fixed effects and a series of robustness checks, potential endogeneity issues (e.g., reverse causality, omitted time-varying confounders, measurement errors) may still exist. Future studies could apply alternative instrumental variables, such as carbon price shocks from neighbouring regions or regulatory distance measures, to strengthen causal identification. Third, the spatial spillover effect of household carbon emissions is found to be positive but not significant in our Spatial Lag Model. This non-significant result may stem from the low spatial autocorrelation of household-level consumption or from the limitations of the provincial-level adjacency weight matrix. Future research could adopt finer-grained spatial units (e.g., prefecture-level cities) or alternative weight matrices (e.g., economic distance or population mobility) to better capture potential spillovers. Fourth, our analysis is based on CFPS data up to 2022. As more recent waves become available, future work should extend the temporal coverage to assess whether the composite mechanism’s effects have strengthened or weakened over time, especially after the full establishment of China’s national carbon market. Fifth, our mediation analysis reveals that the composite mechanism reduces carbon intensity by lowering the share of high-carbon consumption, but we do not fully explore heterogeneous responses across different household types (e.g., by age of household head, presence of children, or housing tenure). Future research could delve deeper into such heterogeneity to design more targeted policies. Finally, our policy recommendations are based on the current Chinese context; caution is needed when generalizing the findings to other countries with different carbon pricing systems and household consumption patterns. Cross-country comparative studies would be a valuable extension.
Author Contributions
S.C.: methodology, data curation, writing—original draft. W.G.: writing—review and editing. J.Y.: conceptualization, supervision. All authors have read and agreed to the published version of the manuscript.
Funding
This research was supported by the Key Project of National Social Science Foundation of China (Grant No. 20&ZD092).
Institutional Review Board Statement
Not applicable.
Informed Consent Statement
Not applicable.
Data Availability Statement
The original contributions presented in this study are included in the article. Further inquiries can be directed to the corresponding authors.
Conflicts of Interest
The authors declare no conflicts of interest.
References
- Underwood, A.; Zahran, S. The carbon implication of declining household scale economies. Ecol. Econ. 2015, 116, 182–190. [Google Scholar] [CrossRef] [Scilit]
- Soltani, M.; Rahmani, O.; Ghasimi, D.S.; Ghaderpour, Y.; Pour, A.B.; Misnan, S.H.; Ngah, I. Impact of household demographic characteristics on energy conservation and carbon dioxide emission: Case from Mahabad City, Iran. Energy 2020, 194, 116916. [Google Scholar] [CrossRef] [Scilit]
- Erevelles, S.; Fukawa, N.; Swayne, L. Big data consumer analytics and the transformation of marketing. J. Bus. Res. 2016, 69, 897–904. [Google Scholar] [CrossRef] [Scilit]
- Du, M.; Zhang, X.; Xia, L.; Cao, L.; Zhang, Z.; Zhang, L.; Zheng, H.; Cai, B. The China Carbon Watch (CCW) system: A rapid accounting of household carbon emissions in China at the provincial level. Renew. Sustain. Energy Rev. 2022, 155, 111825. [Google Scholar] [CrossRef] [Scilit]
- Teece, D.J. Explicating Dynamic Capabilities: The Nature and Micro-foundations of (Sustainable) Enterprise Performance. Strateg. Manag. J. 2007, 28, 1319–1350. [Google Scholar] [CrossRef] [Scilit]
- Arrow, K.J.; Debreu, G. Existence of an Equilibrium for a Competitive Economy. Econometrica 1954, 22, 265–290. [Google Scholar] [CrossRef] [Scilit]
- Hartzmark, S.M.; Sussman, A.B. Do Investors Value Sustainability? A Natural Experiment Examining Ranking and Fund Flows. J. Financ. 2019, 74, 2789–2837. [Google Scholar] [CrossRef] [Scilit]
- Liu, S.; Wang, Y. Green innovation effect of pilot zones for green finance reform: Evidence of quasi natural experiment. Technol. Forecast. Soc. Change 2023, 186, 122079. [Google Scholar] [CrossRef] [Scilit]
- Jia, J.; He, X.; Zhu, T.; Zhang, E. Does green finance reform promote corporate green innovation? Evidence from China. Pac.-Basin Financ. J. 2023, 82, 102165. [Google Scholar] [CrossRef] [Scilit]
- Wang, H.; Qi, S.; Zhou, C.; Zhou, J.; Huang, X. Green credit policy, government behavior and green innovation quality of enterprises. J. Clean. Prod. 2022, 331, 129834. [Google Scholar] [CrossRef] [Scilit]
- Boeing, P. The allocation and effectiveness of China’s R&D subsidies—Evidence from listed firms. Res. Policy 2016, 45, 1774–1789. [Google Scholar] [CrossRef] [Scilit]
- Huang, Y.; Chen, C.; Lei, L.; Zhang, Y. Impacts of green finance on green innovation: A spatial and nonlinear perspective. J. Clean. Prod. 2022, 365, 132548. [Google Scholar] [CrossRef] [Scilit]
- Sinn, H.-W. Public policies against global warming: A supply side approach. Int. Tax Public Financ. 2008, 15, 360–394. [Google Scholar] [CrossRef] [Scilit]
- Zhu, S.; He, C.; Liu, Y. Going green or going away: Environmental regulation, economic geography and firms’ strategies in China’s pollution-intensive industries. Geoforum 2014, 55, 53–65. [Google Scholar] [CrossRef] [Scilit]
- Porter, M.E.; van der Linde, C. Toward a New Conception of the Environment-Competitiveness Relationship. J. Econ. Perspect. 1995, 9, 97–118. [Google Scholar] [CrossRef] [Scilit]
- Liu, J.-Y.; Xia, Y.; Fan, Y.; Lin, S.-M.; Wu, J. Assessment of a Green Credit Policy Aimed at Energy-intensive Industries in China Based on a Financial CGE Model. J. Clean. Prod. 2017, 163, 293–302. [Google Scholar] [CrossRef] [Scilit]
- Meyer, J.W.; Rowan, B. Institutionalized Organizations: Formal Structure as Myth and Ceremony. Am. J. Sociol. 1977, 83, 340–363. [Google Scholar] [CrossRef] [Scilit] [PubMed]
- Zhang, J.; Marquis, C.; Qiao, K. Do Political Connections Buffer Firms from or Bind Firms to the Government? A Study of Corporate Charitable Donations of Chinese Firms. Organ. Sci. 2016, 27, 1065–1341. [Google Scholar] [CrossRef] [Scilit]
- Li, W.; Cui, G.; Zheng, M. Does Green Credit Policy Affect Corporate Debt Financing? Evidence from China. Environ. Sci. Pollut. Res. 2021, 29, 5162–5171. [Google Scholar] [CrossRef] [Scilit]
- El Ghoul, S.; Guedhami, O.; Kwok, C.C.; Mishra, D.R. Does Corporate Social Responsibility Affect the Cost of Capital? J. Bank. Financ. 2011, 35, 2388–2406. [Google Scholar] [CrossRef] [Scilit]
- Kölbel, J.F.; Busch, T.; Jancso, L.M. How Media Coverage of Corporate Social Irresponsibility Increases Financial Risk. Strateg. Manag. J. 2017, 38, 2266–2284. [Google Scholar] [CrossRef] [Scilit]
- Baron, R.M.; Kenny, D.A. The Moderator–mediator Variable Distinction in Social Psychological Research: Conceptual, Strategic, and Statistical Considerations. J. Personal. Soc. Psychol. 1986, 51, 1173–1182. [Google Scholar] [CrossRef]
- Hadlock, C.J.; Pierce, J.R. New Evidence on Measuring Financial Constraints: Moving beyond the KZ Index. Rev. Financ. Stud. 2010, 23, 1909–1940. [Google Scholar] [CrossRef] [Scilit]
- Kong, G.; Wang, S.; Wang, Y. Fostering Firm Productivity through Green Finance: Evidence from a Quasi-natural Experiment in China. Econ. Model. 2022, 115, 105979. [Google Scholar] [CrossRef] [Scilit]
- Liu, X.; Liu, D. How Green Finance Drives New-Quality Productivity from the Perspective of Chinese Modernization. Financ. Res. Lett. 2025, 82, 107496. [Google Scholar] [CrossRef] [Scilit]
- Xu, T.; Yang, G.; Chen, T. The Role of Green Finance and Digital Inclusive Finance in Promoting Economic Sustainable Development: A Perspective from New Quality Productivity. J. Environ. Manag. 2024, 370, 122892. [Google Scholar] [CrossRef] [Scilit] [PubMed]
- Xiong, X.; Wang, Y.; Liu, B.; He, W.; Yu, X. The Impact of Green Finance on the Optimization of Industrial Structure: Evidence from China. PLoS ONE 2023, 18, e0289844. [Google Scholar] [CrossRef] [Scilit]
- Chang, L.; Zhang, Q.; Liu, H. Digital Finance Innovation in Green Manufacturing: A Bibliometric Approach. Environ. Sci. Pollut. Res. 2023, 30, 61340–61368. [Google Scholar] [CrossRef] [Scilit]
- Liu, J.; Liao, H. Analysis on Efficiency and Its Influence Factors of Financial Support for Listed Companies of Guangdong New Energy Industry. Int. J. Econ. Financ. 2017, 9, 70–80. [Google Scholar] [CrossRef] [Scilit]
- Wan, Y.; Sheng, N.; Wei, X.; Tan, M.; Ling, J. Effect of Green Finance Reform and Innovation Pilot Zone on Improving Environmental Pollution: An Empirical Evidence from Chinese Cities. Environ. Sci. Pollut. Res. 2023, 30, 75058–75077. [Google Scholar] [CrossRef] [Scilit]
- Cai, K.; Wang, H.; Wang, J.; Bai, J.; Zuo, J.; Chan, K.; Lai, K.; Song, Q. Mitigating lifecycle GHG emissions of building sector through prefabricated light-steel buildings in comparison with traditional cast-in-place buildings. Resour. Conserv. Recycl. 2023, 194, 107007. [Google Scholar] [CrossRef] [Scilit]
- Zhou, Z.; Syamsunur, D.; Wang, L.; Nugraheni, F. Identification of impeding factors in utilising prefabrication during lifecycle of construction projects: An extensive literature review. Buildings 2024, 14, 1764. [Google Scholar] [CrossRef] [Scilit]
- Chen, G.; Huang, J.; Wang, J.; Wei, J.; Shou, W.; Cao, Z.; Pan, W.; Zhou, J. Optimal procurement strategy for offsite prefabricated components considering construction schedule and cost. Autom. Constr. 2023, 147, 104726. [Google Scholar] [CrossRef] [Scilit]
- Aghasizadeh, S.; Tabadkani, A.; Hajirasouli, A.; Banihashemi, S. Environmental and economic performance of prefabricated construction: A review. Environ. Impact Assess. Rev. 2022, 97, 106897. [Google Scholar] [CrossRef] [Scilit]
- Wang, T.; Foliente, G.; Song, X.; Xue, J.; Fang, D. Implications and future direction of greenhouse gas emission mitigation policies in the building sector of China. Renew. Sustain. Energy Rev. 2014, 31, 520–530. [Google Scholar] [CrossRef] [Scilit]
- Zhang, X.; Xie, J.; Rao, R.; Liang, Y. Policy incentives for the adoption of electric vehicles across countries. Sustainability 2014, 6, 8056–8078. [Google Scholar] [CrossRef] [Scilit]
- Pan, W.; Gibb, A.G.; Dainty, A.R.J. Leading UK housebuilders’ utilization of offsite construction methods. Build. Res. Inf. 2008, 36, 56–67. [Google Scholar] [CrossRef] [Scilit]
- Alreshidi, E.; Mourshed, M.; Rezgui, Y. Requirements for cloud-based BIM governance solutions to facilitate team collaboration in construction projects. Requir. Eng. 2018, 23, 1–31. [Google Scholar] [CrossRef] [Scilit]
- Du, Q.; Wang, Y.; Pang, Q.; Hao, T.; Zhou, Y. The dynamic analysis on low-carbon building adoption under emission trading scheme. Energy 2023, 263, 125946. [Google Scholar] [CrossRef] [Scilit]
- Liu, Y.; Chang, R.-D.; Zuo, J.; Xiong, F.; Dong, N. What leads to the high capital cost of prefabricated construction in China: Perspectives of stakeholders. Eng. Constr. Archit. Manag. 2023, 30, 805–832. [Google Scholar] [CrossRef] [Scilit]
- Zhang, L.; Li, Q.; Zhou, J. Critical factors of low-carbon building development in China’s urban area. J. Clean. Prod. 2017, 142, 3075–3082. [Google Scholar] [CrossRef] [Scilit]
- Wang, Y.; Mauree, D.; Sun, Q.; Lin, H.; Scartezzini, J.; Wennersten, R. A review of approaches to low carbon transition of high-rise residential buildings in China. Renew. Sustain. Energy Rev. 2020, 131, 109990. [Google Scholar] [CrossRef] [Scilit]
- Du, Q.; Pang, Q.; Bao, T.; Guo, X.; Deng, Y. Critical factors influencing carbon emissions of prefabricated building supply chains in China. J. Clean. Prod. 2021, 280, 124398. [Google Scholar] [CrossRef] [Scilit]
- Jaillon, L.; Poon, C.S. The evolution of prefabricated residential building systems in Hong Kong: A review of the public and the private sector. Autom. Constr. 2009, 18, 239–248. [Google Scholar] [CrossRef] [Scilit]
- Steinhardt, D.A.; Manley, K. Adoption of prefabricated housing the role of country context. Sustain. Cities Soc. 2016, 22, 126–135. [Google Scholar] [CrossRef] [Scilit]
- Guo, F.; Zhang, Y.; Chang, C.; Yu, Y. Carbon emissions of prefabricated buildings constrained by flexible resource: A study on cost optimization. Buildings 2022, 13, 90. [Google Scholar] [CrossRef] [Scilit]
- Zhou, J.; Li, Y.; Ren, D. Quantitative study on external benefits of prefabricated buildings: From perspectives of economy, environment, and society. Sustain. Cities Soc. 2022, 86, 104132. [Google Scholar] [CrossRef] [Scilit]
- Gusmao Brissi, S.; Debs, L.; Elwakil, E. A review on the factors affecting the use of offsite construction in multifamily housing in the United States. Buildings 2020, 11, 5. [Google Scholar] [CrossRef] [Scilit]
- Navaratnam, S.; Satheeskumar, A.; Zhang, G.; Nguyen, K.; Venkatesan, S.; Poologanathan, K. The challenges confronting the growth of sustainable prefabricated building construction in Australia: Construction industry views. J. Build. Eng. 2022, 48, 103935. [Google Scholar] [CrossRef] [Scilit]
- Nazir, F.A.; Edwards, D.J.; Shelbourn, M.; Martek, I.; Thwala, W.D.D.; El-Gohary, H. Comparison of modular and traditional UK housing construction: A bibliometric analysis. J. Eng. Des. Technol. 2021, 19, 164–186. [Google Scholar] [CrossRef] [Scilit]
- Fan, K.; Hui, E.C.M. Evolutionary game theory analysis for understanding the decision-making mechanisms of governments and developers on green building incentives. Build. Environ. 2020, 179, 106972. [Google Scholar] [CrossRef] [Scilit]
- Gao, Y.; Tian, X.-L. Prefabrication policies and the performance of construction industry in China. J. Clean. Prod. 2020, 253, 120042. [Google Scholar] [CrossRef] [Scilit]

Disclaimer/Publisher’s Note: The statements, opinions and data contained in all publications are solely those of the individual author(s) and contributor(s) and not of MDPI and/or the editor(s). MDPI and/or the editor(s) disclaim responsibility for any injury to people or property resulting from any ideas, methods, instructions or products referred to in the content. |
© 2026 by the authors. Licensee MDPI, Basel, Switzerland. This article is an open access article distributed under the terms and conditions of the Creative Commons Attribution (CC BY) license.