


Abstract
Achieving sustainable development requires moving beyond pollution metrics to holistic measures, such as the load capacity factor (LCF), which balances ecological demand and supply. While recent studies have provided important insights into the determinants of LCF in OECD countries, further research is needed to incorporate additional determinants and updated estimation approaches. This study addresses this gap by examining the impacts of financial innovation, forestry, urbanization, population, and economic growth on the LCF in Organization for Economic Cooperation and Development (OECD) economies from 1990 to 2023. Using second-generation panel econometric methods, including tests for cross-sectional dependence, slope heterogeneity, second-generation unit roots, and cointegration techniques, this paper confirms a stable long-run relationship among the variables. The core analysis applies the method of moments quantile regression to uncover the heterogeneous effects across the LCF distribution. The results indicate that financial innovation consistently enhances the ratio of biocapacity to ecological footprint. In contrast, economic growth and urbanization exert significant negative pressure on the LCF, whereas population size shows a uniformly detrimental effect. Forestry has a positive but less pronounced influence. Robustness checks using fully modified ordinary least squares, dynamic ordinary least squares, and panel-corrected standard errors confirm these results. The present study concludes that targeted financial innovation and stringent urban demographic policies support OECD nations in improving ecological balance and reducing ecological deficits.
1. Introduction
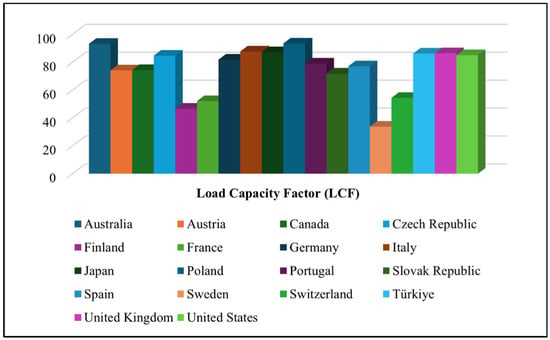
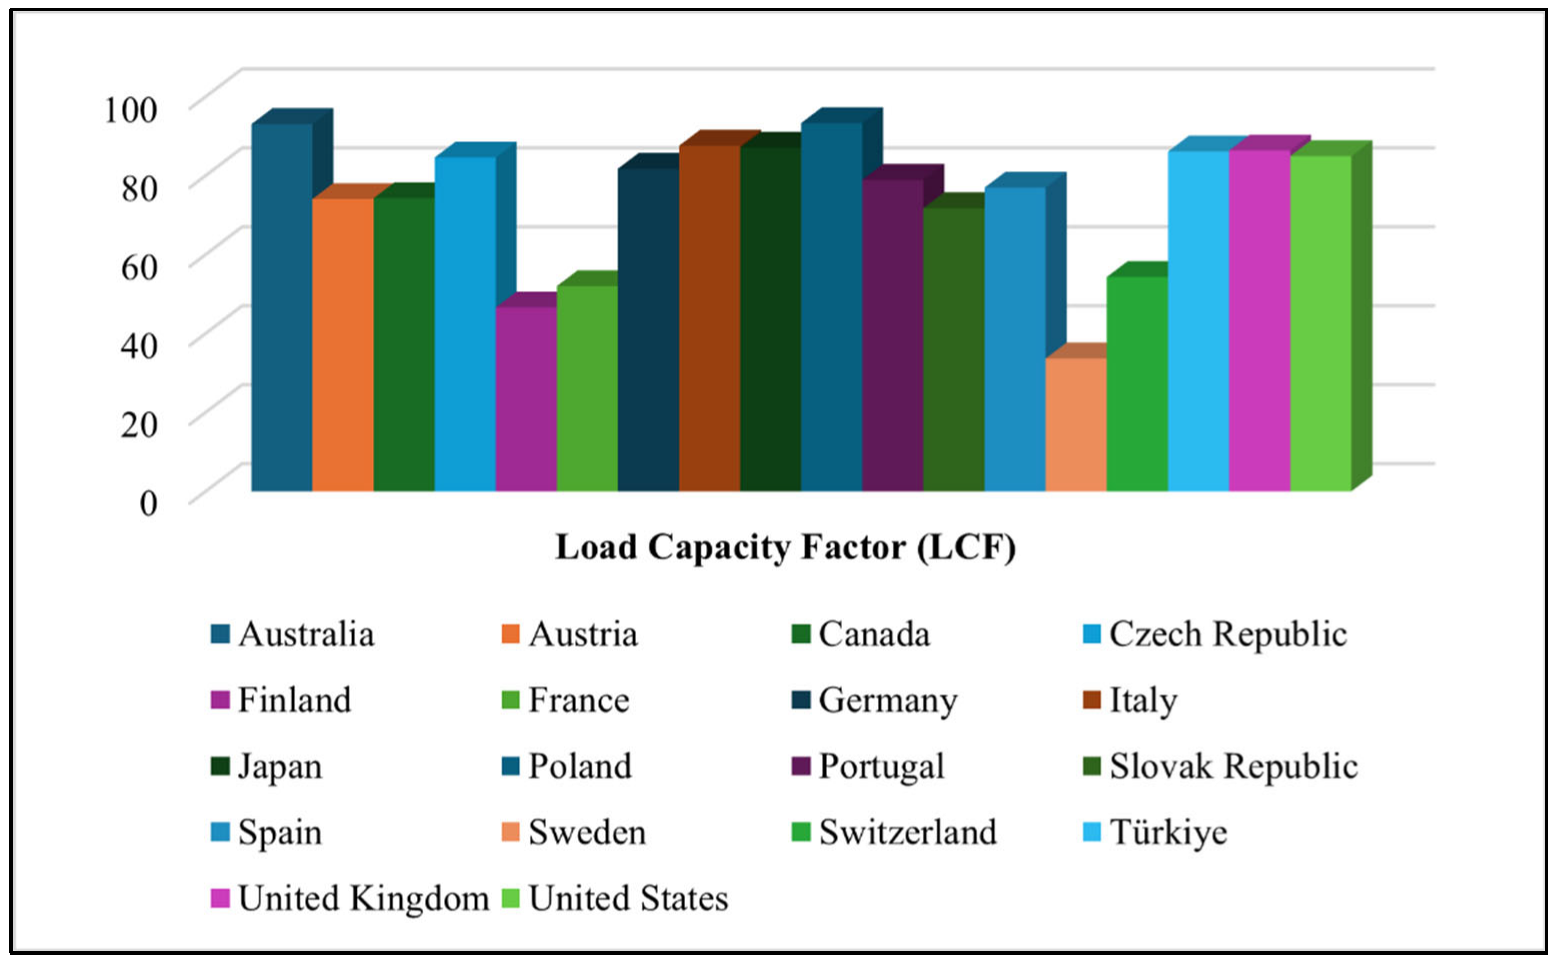
For the world’s most advanced economies, the defining environmental challenge has evolved from mitigating discrete pollutants to addressing the systemic imperative of restoring the ecological equilibrium. While metrics such as greenhouse gas emissions remain vital, they offer a demand-side narrative that focuses on anthropogenic pressures while neglecting nature’s regenerative capacity [1]. A comprehensive assessment of sustainability requires an indicator that reconciles economic and environmental dimensions. The load capacity factor (LCF), defined as the ratio of a nation’s biocapacity to its ecological footprint, plays a critical role in balancing the supply of natural resources and human consumption [2]. An LCF value below unity indicates ecological overshoot, a condition pervasive among affluent nations of the Organization for Economic Cooperation and Development (OECD) [3]. These economies face a profound paradox in leveraging their advanced technological and institutional capabilities to address environmental degradation, which has historically been intertwined with economic progress. Therefore, identifying the precise determinants of the LCF within this influential bloc is essential for informing effective global environmental governance and shaping credible pathways for sustainable development [4]. Understanding these determinants has direct political implications. By revealing how financial innovation, urbanization, and forestry management affect ecological capacity, policymakers in OECD countries can design targeted fiscal, regulatory, and investment strategies that promote sustainable development and strengthen national resilience to ecological deficits. Such insights are particularly relevant for coordinating transnational policies, setting binding environmental targets, and prioritizing sectors for green investment. Figure 1 shows the LCF for 18 OECD countries using country-wise averages from 1990 to 2023. The LCF, sourced from the Global Footprint Network [5], measures the ratio of a nation’s biocapacity to its ecological footprint, indicating whether a nation has an ecological surplus or deficit. The x- and y-axes list the countries and LCF values, respectively. All nations exhibit ecological deficits, with varying severity. Sweden and Finland show the largest deficits, while Australia and Poland are closer to sustainability thresholds, highlighting heterogeneous ecological pressures across advanced economies [6].
Figure 1.
Country-wise average load capacity factor (LCF) across 18 OECD countries (1990–2023). Source of data: Global Footprint Network [5]; figure constructed by the authors based on the literature.
The existing empirical literature has made important progress in identifying the determinants of LCF; however, further extensions are required to incorporate additional variables and alternative estimation approaches. In particular, analyzing the determinants of the LCF in OECD countries provides a benchmark quantile-based analysis, which the present study builds upon and extends [7]. The influence of financial systems, for instance, is ambiguously characterized as either a catalyst for green investment or a driver of resource-intensive consumption [8]. Similarly, the environmental impact of urbanization remains contested, viewed alternately as a source of agglomeration efficiencies or as a catalyst for land-use change and habitat fragmentation [9]. These inconsistencies often stem from methodological limitations, including the aggregation of nations at disparate stages of development and the reliance on broad indicators that obscure substantive socio-economic variations. This study seeks to resolve these ambiguities by focusing on a panel of OECD economies. OECD countries were specifically selected because they share comparable high-income, post-industrial characteristics, possess reliable and consistent ecological and financial data, and face common challenges associated with reconciling economic growth and environmental sustainability. Focusing on this relatively homogeneous set of nations allows for a clearer assessment of the policy and socio-economic levers that influence the ratio of biocapacity to ecological footprint, making the results highly relevant for governments aiming to implement evidence-based environmental interventions.
The selection of explanatory variables is theoretically anchored in the dual nature of the LCF, which reflects the stock of natural capital and the intensity of human demand for it [10]. To advance beyond conventional financial depth metrics, we introduce financial sector research and development (R&D) expenditure intensity as a novel proxy for financial innovation, capturing strategic investment in tools and platforms that could steer capital toward sustainability transitions [11]. Forest area is incorporated as a direct measure of a core component of biocapacity, recognizing the indispensable role of forests as carbon sinks and biodiversity reservoirs [12]. Urbanization is examined to assess the net environmental impact of concentrated human settlements, testing whether the hypothesized efficiencies of urban density materialize or are offset by increased consumption [13]. Finally, the roles of population and economic growth are analyzed to determine whether within mature, slow-growing demographic contexts, environmental pressures are driven more by per capita consumption patterns than by aggregate population size, and to investigate the potential for absolute decoupling of economic activity from ecological degradation [14].
The primary objective of this investigation is to build on recent empirical advances by providing a robust, methodologically rigorous analysis of the drivers of the ratio of biocapacity to ecological footprint in advanced economies. This paper contributes to the OECD focused LCF literature by building on the framework of analyzing the determinants of the LCF in OECD countries and extending it in several important ways. First, it provides a variable-level extension by incorporating additional determinants, including financial innovation, forestry, and population dynamics, thereby broadening the set of factors influencing the ratio of biocapacity to ecological footprint in advanced economies. Second, it offers an estimator-level extension by employing the method of moments quantile regression (MMQR), which allows for a more flexible examination of heterogeneous effects across the conditional distribution of LCF. This approach enables a deeper understanding of how the impacts of key variables differ between countries with ecological deficits and those with relatively stronger ecological reserves. Third, this study updates the empirical evidence using a more recent dataset covering the period 1990–2023, thereby providing contemporary insights into the evolving dynamics of environmental sustainability in OECD countries. Finally, the present study extends the existing OECD–LCF–quantile literature by integrating additional variables, applying an alternative estimation approach, and offering updated empirical evidence to inform sustainable policy design.
The remainder of this paper is organized as follows: Section 2 reviews the relevant theoretical and empirical literature. Section 3 outlines the data and details econometric methods. Section 4 presents and interprets the empirical findings. Section 5 concludes by synthesizing the core insights, deriving targeted policy implications, and suggesting avenues for future research.
2. Literature Review
The climate crisis prompted a shift from singular environmental metrics, such as carbon dioxide (CO2) emissions, to holistic indicators that balance ecological demand and supply. The LCF, defined as the ratio of biocapacity to ecological footprint, represents such an advancement and provides a more integrated measure of sustainability [15]. For OECD economies characterized by high ecological deficits, understanding the determinants of LCF is crucial for transitioning from emission reduction to genuine ecological restoration [16]. This literature review synthesizes existing research on key determinants, including financial innovation, forestry, urbanization, population, and economic development. However, the relationship between financial innovation and environmental outcomes remains unclear. The scale effect suggests that increased capital access leads to higher resource consumption, thereby increasing ecological pressure. Conversely, the composition/efficiency effect suggests that sophisticated financial tools redirect investments toward cleaner technologies [17,18].
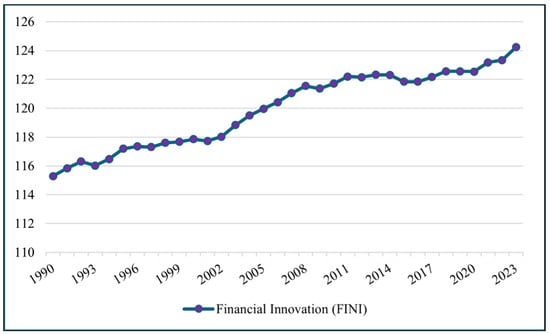
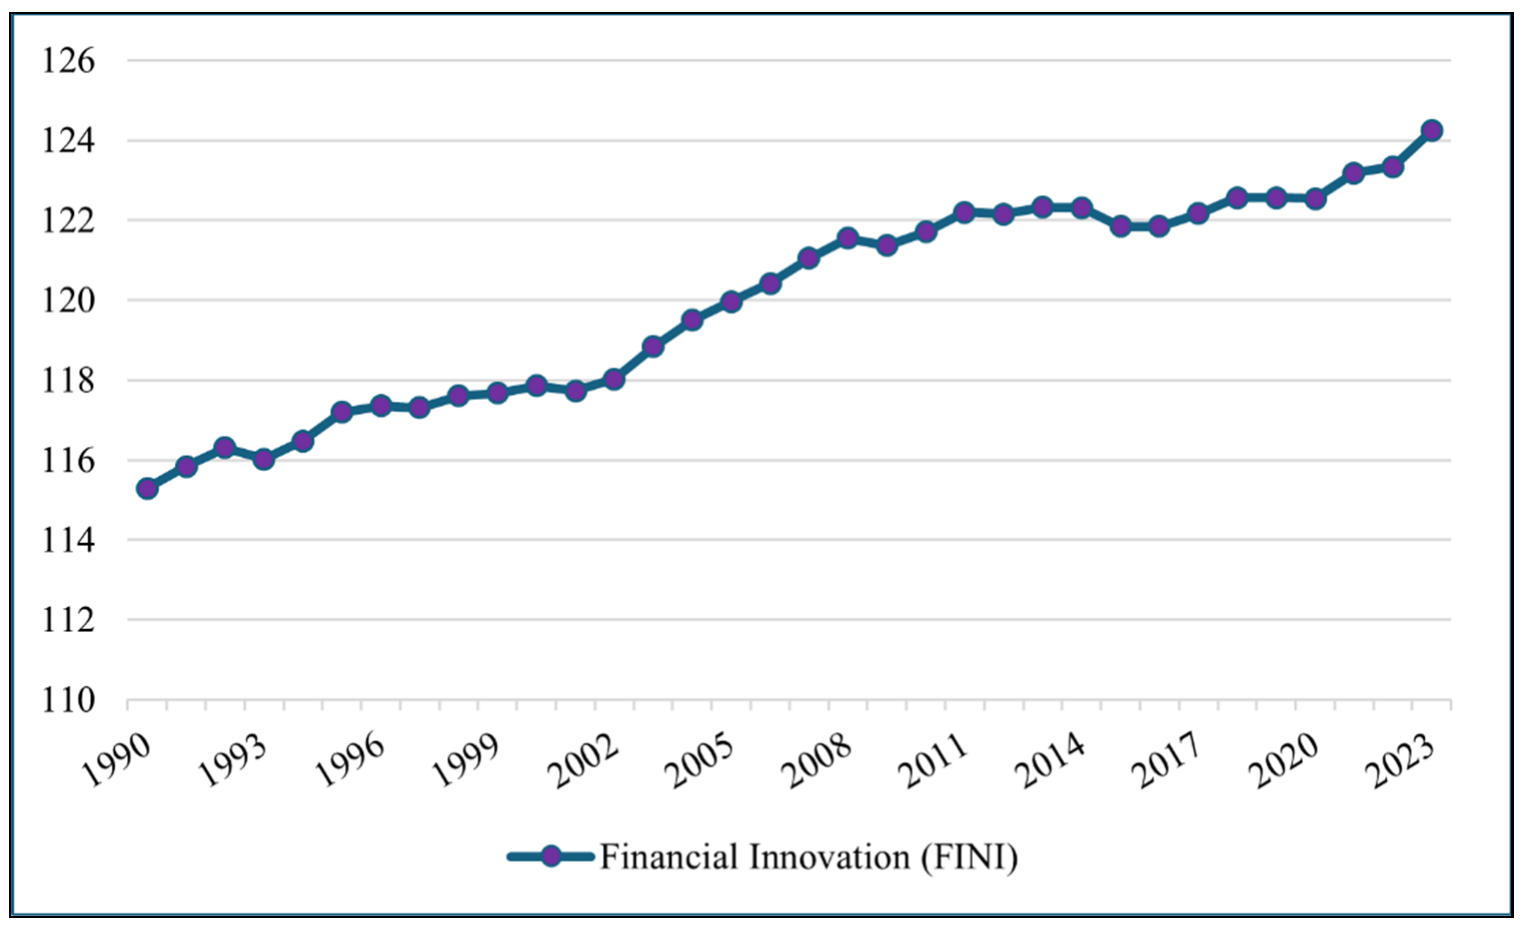
However, the empirical evidence remains mixed. While studies using traditional financial proxies often report a negative association with LCF, emerging research indicates that financial sector R&D intensity is a measure that supports cutting-edge innovation, fostering ecological capacity in advanced economies by promoting green finance and enhancing ESG transparency [19]. The overall impact appears to depend on the type of financial variable, regulatory context, and institutional maturity, underscoring the need for a more precise measurement [20]. Figure 2 illustrates the evolution of financial innovation across the 18 OECD countries as year-wise averages from 1990 to 2023. The x-axis represents years, and the y-axis shows financial innovation, measured as financial sector R&D expenditure intensity, sourced from the OECD’s Analytical Business Enterprise Research and Development database [21]. The figure shows an upward trajectory, reflecting a steady increase in investment in financial sector R&D and highlighting the growing emphasis on technological advancement and innovation in finance. This trend underscores the importance of R&D-driven financial innovation, a key independent variable in this study, as a potential driver of ecological sustainability [22].
Figure 2.
Year-wise average financial innovation (FINI) in 18 OECD countries (1990–2023). Source of data: OECD [21]; figure constructed by the authors based on the literature.
Forests are a core component of biocapacity, serving as carbon sinks and stabilizing ecosystems [23]. The literature robustly confirms a positive relationship between forest area and LCF in diverse contexts [24]. Sustainable forest management enhances biocapacity and reduces the ecological footprint by providing renewable resources and regulating microclimate [25]. However, a critical distinction exists between forest stock (beneficial) and extractive forest rents, which, if mismanaged, exacerbate environmental degradation [26]. For OECD nations, this underscores the importance of conservation and active reforestation as part of broader environmental strategies. The impact of urbanization on LCF is dualistic. Unplanned expansion drives habitat loss, energy demand, and soil sealing, thereby reducing biocapacity [27]. Conversely, well-planned compact cities generate efficiency gains through economies of scale [28]. Empirical findings reflect this tension, showing significant heterogeneity across regions. While some studies report neutral or positive links in contexts with strong green planning [29], others consistently find negative effects when urbanization outpaces sustainable infrastructure development [30,31]. This suggests that urbanization’s net effect is conditional on governance, urban form, and environmental policy factors, which are often more favorable in OECD countries. Rooted in the IPAT/STIRPAT framework, population growth is traditionally viewed as a multiplier of environmental impact, increasing the aggregate demand for biocapacity [32].
Empirical studies predominantly confirm a negative association between population and LCF across income groups [33]. However, in slow-growing, aging OECD societies, this relationship becomes more nuanced. Here, environmental pressure is driven less by population size and more by consumption intensity and demographic structure [34]. A strong consensus across diverse economies indicates a significant negative correlation between gross domestic product (GDP) growth and LCF, challenging the optimistic later stage of the environmental Kuznets curve for this metric [35,36]. Studies employing advanced panel estimators consistently find that economic expansion reduces load capacity, as scale effects overwhelm efficiency gains [37]. While some conditional, non-linear patterns exist (e.g., in China), the prevailing evidence suggests that in the absence of deliberate structural and policy shifts, growth continues to undermine the ratio of biocapacity to ecological footprint, even in high-income contexts [38]. Recent studies also emphasize the importance of policy frameworks and institutional quality in shaping the impact of these determinants on ecological outcomes. For instance, OECD countries with proactive environmental regulations, green finance incentives, and robust urban planning have demonstrated that financial innovation and urbanization can be harnessed to enhance ecological capacity rather than exacerbate deficits [16,39,40]. Moreover, cross-country comparisons reveal that differences in governance, regulatory enforcement, and strategic resource management substantially mediate the effects of population growth, economic expansion, and forestry practices on LCF [41]. These insights highlight that achieving ecological balance is not solely a function of economic or demographic factors, but is critically shaped by the political and institutional context in which they operate. By synthesizing these findings in the literature, this study underscores the need for studies that combine precise measures of financial innovation with socio-political and demographic considerations to guide policy interventions in high-income economies. Despite important contributions to the OECD–LCF literature, including analyses of the determinants of LCF in OECD countries, several extensions remain relevant. First, the role of financial innovation remains underexplored, particularly when measured using R&D intensity. Second, limited attention has been paid to the combined effects of forestry and population dynamics. Third, this paper is further extended by employing alternative estimation techniques to better capture distributional heterogeneity. This study addresses these aspects by extending the existing frameworks.
3. Materials and Methods
3.1. Data and Variables
This present study investigates the determinants of ratio of biocapacity to ecological footprint for a panel of 18 OECD economies, namely, Australia, Austria, Canada, the Czech Republic, Finland, France, Germany, Italy, Japan, Poland, Portugal, the Slovak Republic, Spain, Sweden, Switzerland, Türkiye, the United Kingdom, and the United States, over the period 1990 to 2023. The empirical analysis uses a comprehensive panel dataset to examine the impacts of financial innovation, forestry, urbanization, population, and economic growth on LCF, employing established panel econometric techniques. The dependent variable is LCF, sourced from the Global Footprint Network, which measures the ratio of a nation’s biocapacity to its ecological footprint and serves as a holistic indicator of the ecological surplus or deficit [5]. The independent variable, financial innovation, measured as financial sector R&D expenditure intensity, is defined as the ratio of R&D expenditure of financial intermediaries (banking and insurance sectors) to the total value added of the financial intermediary industry (lagged by one year). R&D data are obtained from the OECD Analytical Business Enterprise Research and Development (ANBERD) database [21], following the Frascati Manual definition, while value-added data come from the OECD Statistics Database [42]. Forestry is measured by the total forest area in square kilometers; urbanization is measured as the urban share of the total population; population is measured as the total population; and economic growth is measured by gross domestic product, expressed in constant 2015 US dollars. All socio-economic and forestry variables were sourced from the World Bank’s World Development Indicators [43].
3.2. Theoretical Framework and Model Specification
The theoretical foundation of this analysis is the concept of the ratio of biocapacity to ecological footprint, which integrates the supply of natural capital (biocapacity) with demand (ecological footprint) [44]. To examine the drivers of this holistic metric, we specified an empirical model that draws on established literature linking economic activity, land use, demographic pressures, and technological innovation to environmental outcomes [45]. The model posits that the LCF is influenced by the scale of economic output (GDP), the extent of natural carbon sinks (forest area), the intensity of financial innovation, the degree of urbanization, and the size of the population. The baseline functional form of the model is specified as follows:
where is the load capacity factor; stands for gross domestic product; represents forest; denotes financial innovation denotes urbanization; and is the total population. For estimation, all variables were transformed into natural logarithms to normalize the data, mitigate potential heteroscedasticity, and facilitate the interpretation of the coefficients as elasticities [46]. It yields the following panel econometric specification:
In this equation, denotes the country, denotes the year, is the constant, to are the parameters to be estimated, and is the error term. This model enables an analysis of how proportional changes in the independent variables are associated with proportional changes in LCF across OECD economies.
3.3. Econometric Approaches
In an increasingly globalized economy, cross-sectional dependence (CD) is a common feature of panel data owing to shared economic shocks, international trade, and financial linkages. Failure to account for CD leads to biased and inconsistent estimates [47]. Therefore, the first step in the empirical analysis was to test for CD across OECD economies. Following the established econometric literature, this analysis employs the Breusch–Pagan LM test and the bias-corrected LM test proposed by Pesaran [48] to test the null hypothesis of cross-sectional independence. The assumption of homogeneous slopes across cross-sectional units is often untenable in panel data analysis, particularly in diverse economies. Ignoring slope heterogeneity leads to inconsistent results [49]. This study applies the slope homogeneity test developed by Pesaran and Yamagata [50] to test this assumption. This paper applies the second-generation cross-sectionally augmented IPS (CIPS) test proposed by Pesaran [51] to test for stationarity while accounting for CD. The CIPS test is based on individual cross-sectionally augmented Dickey–Fuller (CADF) regressions for each panel unit. The CIPS statistics are calculated as the cross-sectional average of the individual CADF t-statistics, providing a robust unit root test in the presence of common factors and interdependence across economies. We employed Westerlund’s error-correction-based panel cointegration test to test for a long-run equilibrium relationship among the variables under CD [52].
This study applies the MMQR method introduced by Machado and Santos Silva [53] to capture the heterogeneous and conditional effects of the independent variables across the full distribution of the LCF. Conventional panel estimators, such as fixed effects or the generalized method of moments, primarily capture mean effects, whereas quantile regression is robust to outliers. It enables the analysis of relationships at various points (e.g., low, median, and high) along with the conditional distribution of the dependent variable. It is particularly relevant for environmental analysis, as the impact of determinants such as financial innovation or forestry differs substantially between countries with an ecological surplus (high LCF) and those with a severe deficit (low LCF). The MMQR approach is preferred because it accommodates panel data structures with unobserved individual heterogeneity while estimating conditional quantile functions without imposing the often-restrictive assumption of a pure location shift. The MMQR estimations include country-specific fixed effects to control for unobserved heterogeneity. Because MMQR is distribution-free and robust to non-normality, heteroskedasticity, and outliers, conventional diagnostic tests (e.g., the Shapiro–Wilk test) are not required. These features are inherent to the MMQR framework. The model specifies the conditional quantile for quantile as follows:
where and denote country-specific fixed effects that are allowed to vary across the quantiles . is a vector of the core independent variables. represents known differentiable transformations of the elements of . and are parameter vectors to be estimated, and is the -th sample quantile. The estimation is achieved by solving an optimization problem based on a check function that weights positive and negative residuals asymmetrically depending on the quantile τ, whereas MMQR does not require strict distributional assumptions and is robust to heterogeneity and outliers.
The present study employs three established long-run panel estimators to verify the robustness of the primary MMQR findings: fully modified ordinary least squares (FM-OLS), dynamic ordinary least squares (D-OLS), and panel-corrected standard errors (PCSE). FM-OLS corrects for endogeneity and serial correlation through semiparametric adjustments, making it suitable for heterogeneous cointegrated panels [54]. D-OLS addresses endogeneity by including the leads and lags of the differenced regressors, providing consistent estimates for finite samples [55]. The PCSE approach by Beck and Katz [56] is employed to account for heteroskedasticity and contemporaneous correlation across panel units. This approach provides more reliable standard error estimates in panels with CD. The use of these methods ensures the reliability and stability of the estimated long-term relationships.
4. Results and Discussion
Table 1 presents the descriptive statistics of the variables used in the analysis. These statistics provide a summary of the central tendency, dispersion, and shape of each variable distribution. The LCF shows considerable variation, with a mean of 74.58 and a range of 25.12 to 98.05, reflecting the diverse ecological states across the panel. Financial innovation and forest areas also exhibit notable ranges, indicating differing levels of financial R&D intensity and forest endowments among countries. Urbanization is consistently high (90.40%) on average, with a negative skew, confirming that most OECD nations are highly urbanized. GDP and population display the expected variability across the sample. The skewness and kurtosis statistics indicate that most variables approximate a normal distribution, although urbanization exhibits a pronounced left skew and higher kurtosis than the other variables.
Table 1.
Descriptive statistics of variables.
The variance inflation factor (VIF) results in Table 2 indicate that multicollinearity is not a concern, as all VIF values range between 1.32 and 2.40 and remain well below the conventional threshold of 10. The mean VIF of 1.87 further confirms the robustness and reliability of the estimated model. The results of the CD tests are presented in Table 3. For all variables, the Breusch–Pagan LM and bias-corrected LM tests reject the null hypothesis of cross-sectional independence at the 1% significance level [57]. The test statistics are highly significant (p = 0.000), providing strong evidence of interdependence across OECD economies. This finding confirms the presence of shared shocks, spatial spillovers, or unobserved common factors in the panel, validating the use of second-generation econometric techniques that account for such dependence in the subsequent unit root and cointegration analyses.
Table 2.
Variance inflation factor (VIF) results.
Table 3.
Findings of the CD tests.
The results of the slope homogeneity test are presented in Table 4. Both the delta and adjusted delta test statistics are highly significant (p = 0.000), leading to a firm rejection of the null hypothesis that slopes are homogeneous across cross-sectional units [58]. This indicates that the relationship between the explanatory variables and LCF differs significantly across OECD economies. The presence of slope heterogeneity justifies the application of estimation methods, such as the MMQR, that can capture these differing marginal effects and avoid the problems that arise from imposing a standard slope structure.
Table 4.
Testing for slope heterogeneity.
Second-generation unit root tests (CIPS and CADF) are employed, given the confirmed presence of CD. The results presented in Table 5 indicate a mixed order of integration. The CIPS fails to reject the null hypothesis of a unit root at the level of most variables (LCF, FOR, POP, and GDP). However, all variables become stationary after the first differencing, as shown by the highly significant CIPS and CADF statistics at the 1% level in Column (Δ). Specifically, financial innovation and urbanization are stationary at the level (I (0)) according to the CIPS test, while the others are integrated of order one (I (1)). This mix of I (0) and I (1) variables necessitates a cointegration analysis to establish long-run equilibrium relationships.
Table 5.
Findings of the unit root tests.
We employed Westerlund’s error-correction-based panel cointegration test to test for a long-run equilibrium relationship among the variables [52]. The results presented in Table 6 provide robust evidence of cointegration. The group-mean statistics (Gt and Ga) and panel statistics (Pt and Pa) are all statistically significant at the 1% level, as indicated by their robust p-values of 0.000. The significance of these statistics, particularly the robust results, leads to a decisive rejection of the null hypothesis of cointegration. This confirms the existence of a stable long-run relationship between LCF and its determinants within the panel of OECD economies. This finding validates the estimation of long-run coefficients using the MMQR, FM-OLS, D-OLS, and PCSE methodologies.
Table 6.
Westerlund ECM panel cointegration test results.
Table 7 presents the MMQR results, revealing the heterogeneous impact of the independent variables across the LCF distribution. The estimates demonstrate that the effects of the key determinants vary substantially between economies with a low biocapacity-to-ecological footprint ratio (lower quantiles) and those with higher capacity (upper quantiles). Financial innovation exhibits a consistent, positive, and statistically significant coefficient across all quantiles (from the 10th to 90th quantiles). This indicates that an increase in financial sector R&D intensity is associated with an improvement in LCF across the entire distribution [59]. The positive effect is most pronounced at the 10th quantile (coefficient: 1.677), suggesting that financial innovation is particularly beneficial for countries with the most severe ecological deficits, potentially by directing capital toward green technologies and sustainable projects that enhance biocapacity and reduce the ecological footprint [60]. Forestry shows a positive coefficient across the distribution, but it is not statistically significant at conventional levels. This shows that, while the direction of the relationship is as theoretically expected (more forest area improves LCF), its marginal impact in this OECD panel, once other factors are controlled for, is not consistently distinguishable from zero [61]. This indicates that forest areas are relatively stable in these economies, with marginal changes having a limited effect on the overall LCF compared to more dynamic drivers [62].
Table 7.
Findings of the MMQR test.
Urbanization has a negative, statistically significant coefficient across all quantiles, confirming its detrimental effect on the ratio of biocapacity to ecological footprint. The negative impact is most substantial at the lowest quantile (coefficient: −1.115), indicating that further urban expansion incurs a particularly high environmental cost for countries already in a severe ecological deficit, likely due to land-use change and increased resource demand [63]. The effect attenuates but remains negative in the higher quantiles. The population exerts a strong, negative, and statistically significant influence on all quantiles. The coefficient becomes increasingly negative as it moves from the lower to the upper quantiles (from −1.082 at Q0.10 to −2.292 at Q0.90). This suggests that population pressure is a fundamental constraint on LCF, and that its marginal negative impact is most acutely felt in countries with higher carrying capacities, possibly due to higher per capita consumption associated with more developed economies [64]. Economic growth shows a large, negative, and highly significant coefficient across all quantiles. The detrimental effect is most severe at the lowest quantile (coefficient: −15.667), indicating that for nations with the poorest ecological health, economic growth drastically worsens their load capacities. The effect, although still strongly negative, diminishes at higher quantiles. This robust finding challenges the optimistic latter stage of the environmental Kuznets curve for this OECD sample, suggesting that the scale effect of economic activity continues to dominate, depleting biocapacity faster than it can be restored [65].
The long-run coefficients from the FM-OLS, D-OLS, and PCSE estimators reported in Table 8 corroborate the core findings of the MMQR analysis and confirm the robustness of the primary relationships. Financial innovation exhibits a consistently positive and statistically significant coefficient across all three estimators. The D-OLS (0.93) and PCSE (1.53) estimates are larger than the FM-OLS (0.42) estimate, but all results consistently indicate that R&D-driven financial innovation enhances LCF, likely through efficiency gains and environmentally oriented capital allocation [66]. Forestry also shows a positive and statistically significant coefficient across all robustness estimations. While the magnitude varies across estimators, the results consistently support the beneficial role of forest areas in strengthening biocapacity and improving ecological balance in OECD economies [67]. Urbanization maintains a negative and highly significant coefficient across the FM-OLS, D-OLS, and PCSE models. This consistent finding reinforces the MMQR results and suggests that urban expansion continues to exert considerable pressure on the ratio of biocapacity to ecological footprint within the sampled OECD countries [68]. The population shows a negative coefficient across all models. Although statistically significant in the FM-OLS and PCSE estimations, it becomes marginally insignificant in the D-OLS specification. This pattern indicates a generally adverse yet somewhat less stable relationship between population dynamics and LCF [69].
Table 8.
Robustness test findings.
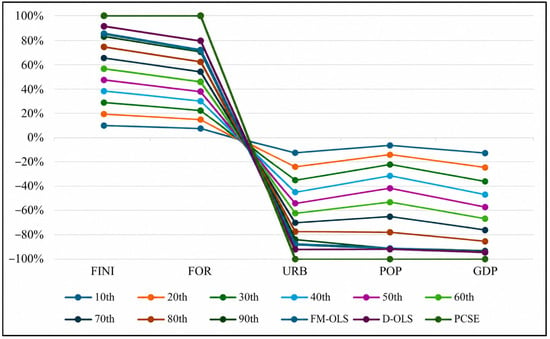
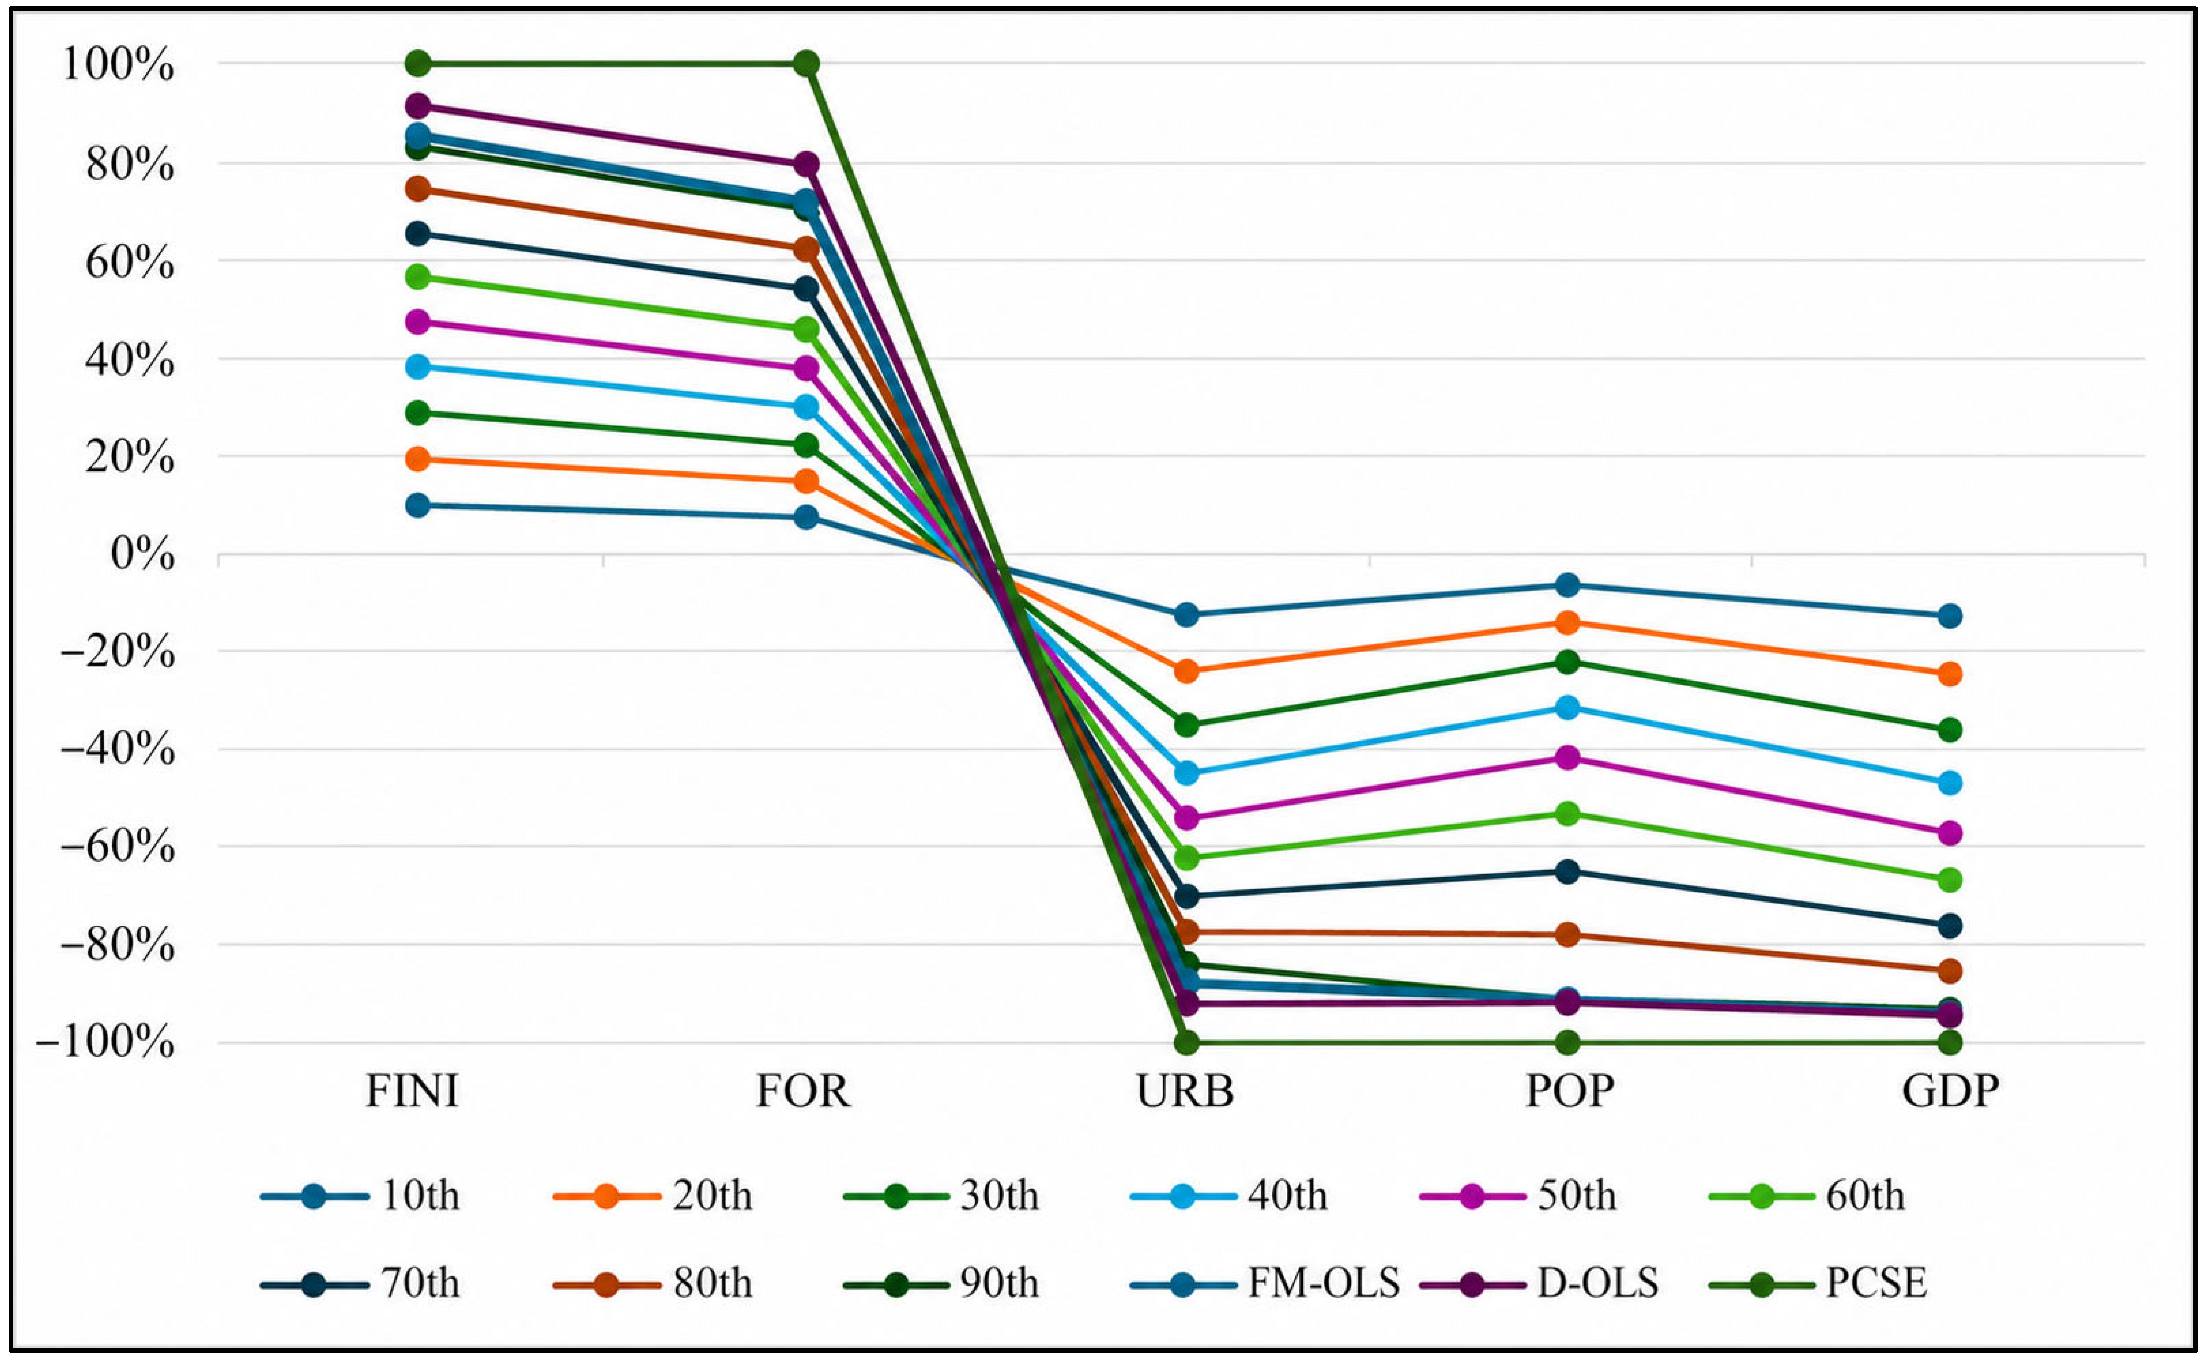
Economic growth exhibits a strong, negative, and statistically significant effect in all three estimators, with the PCSE results confirming the magnitude and direction of the relationship. These findings robustly support the MMQR results, indicating that economic expansion continues to exert downward pressure on the ratio of biocapacity to ecological footprint in OECD economies, thereby challenging the assumption that higher income levels automatically lead to environmental improvements [70]. The convergence of results across the four methodological approaches, MMQR, FM-OLS, D-OLS, and PCSE, demonstrates the stability and reliability of the estimated long-run relationships. Figure 3 further synthesizes the estimated impacts of the key determinants of LCF. The bars display the heterogeneous elasticities from the MMQR across quantiles (10th to 90th), while the FM-OLS, D-OLS, and PCSE estimators provide mean-based long-run coefficients. Financial innovation consistently shows a positive effect, whereas economic growth and urbanization exert strong negative influences. The population demonstrates a predominantly negative relationship, while forestry contributes positively, although with comparatively smaller magnitudes. The alignment between the MMQR patterns and robustness results confirms the stability of the core relationships.
Figure 3.
MMQR, FM-OLS, D-OLS, and PCSE results.
5. Conclusions
This study empirically examines the determinants of the ratio of biocapacity to ecological footprint, measured by LCF, in OECD economies using a robust panel framework that accounts for CD, slope heterogeneity, and distributional asymmetries. By employing MMQR as the primary estimator and using FM-OLS, D-OLS, and PCSE as robustness checks, the analysis provides consistent and reliable evidence of both average and heterogeneous effects across different ecological conditions. The results demonstrate that financial innovation is positively associated with the ratio of biocapacity to ecological footprint across all quantiles of the LCF distribution. In contrast, economic growth, urbanization, and population pressure exert significant negative effects, indicating that scale and structural effects continue to dominate efficiency gains in advanced economies. Forestry has a positive but comparatively weaker influence, reflecting the relative stability of forest endowments in OECD countries. These findings highlight a central policy challenge for high-income economies: sustaining economic activity while reversing persistent ecological deficits. The robust role of financial innovation suggests that directing financial sector R&D toward green technologies, sustainable finance instruments, and environmental risk assessment can meaningfully support ecological restoration. Accordingly, policymakers should prioritize regulatory and fiscal incentives that align financial innovation with sustainability objectives. The evidence underscores that improving the ratio of biocapacity to ecological footprint in OECD economies requires a coordinated strategy that integrates financial innovation with growth management and urban planning, rather than relying solely on economic expansion.
Conversely, the robust and negative relationship between GDP growth and LCF presents a fundamental challenge to conventional growth paradigms within the OECD. The results robustly indicate that the scale and composition effects of economic activity continue to degrade the ratio of biocapacity to ecological footprint, challenging the optimistic latter stage of the environmental Kuznets curve for this region. This necessitates a policy shift from relative decoupling (reducing environmental intensity per unit of GDP) to absolute decoupling (reducing total environmental impact). The key to this is integrating stringent environmental constraints into core economic governance. Implementing comprehensive and rising carbon pricing, phasing out subsidies for fossil fuels and ecologically harmful activities, and embedding mandatory nature-related financial disclosures are essential steps to ensure that economic signals promote a regenerative, rather than extractive, relationship with natural capital. The detrimental impacts of urbanization and population pressure further delineate critical areas for intervention. Policies must aggressively promote compact, transit-oriented development integrated with green infrastructure. Mandating green building standards, preserving and creating urban green spaces, and investing in zero-emission public transportation are crucial for mitigating the environmental footprints of highly urbanized OECD societies. Regarding the population, the focus for these largely slow-growing economies should pivot from aggregate numbers to the structure and patterns of consumption. Policies aimed at promoting sustainable diets, extending product lifespans through right-to-repair legislation, and shifting tax burdens from labor to resource use are essential for reducing the per capita ecological footprint of affluent aging populations.
Therefore, improving LCF in OECD economies requires a systemic and integrated policy approach that goes beyond siloed environmental measures. It requires the strategic harnessing of financial innovation for ecological ends, a decisive reorientation of economic governance to prioritize well-being within planetary boundaries, and the intelligent design of urban spaces and consumption systems. Empirical evidence suggests that incremental change is insufficient. A transformative agenda that aligns financial, economic, and urban systems with the biophysical realities of the ratio of biocapacity to ecological footprint is imperative for these nations to achieve genuine, measurable sustainability and transition from an ecological deficit to a surplus. This paper has limitations that provide avenues for future research. While using secondary data and R&D intensity as proxies for financial innovation is robust, it may not capture all aspects of green fintech development. The national-level analysis may overlook subnational heterogeneity, and the model could benefit from additional controls, such as the energy mix, technological development, and environmental policy stringency, to reduce omitted-variable bias. Future research could construct multi-dimensional indices of financial innovation, incorporate metrics such as green bond market depth or ESG-aligned digital finance, and extend the analysis to sub-national or sectoral data to uncover localized drivers of ecological balance. Including additional explanatory variables, such as material consumption, circular economy indicators, or social capital, and employing advanced methods, such as non-linear causality tests or spatial econometrics, could further refine the understanding of these complex relationships. Finally, applying this framework to other regions, including emerging economies, would provide valuable comparative insights into pathways toward ecological sustainability.
Author Contributions
Conceptualization, M. and A.M.; methodology, M.; software, A.M.; validation, M., C.Y. and A.M.; formal analysis, A.M.; investigation, C.Y.; resources, C.Y.; data curation, M.; writing—original draft preparation, M.; writing—review and editing, A.M.; visualization, M.; supervision, C.Y.; project administration, C.Y.; funding acquisition, A.M. All authors have read and agreed to the published version of the manuscript.
Funding
This work was supported by the Beijing Natural Science Foundation under the International Scientists “Huizhi” project (grant no. IS25100).
Institutional Review Board Statement
Not applicable.
Informed Consent Statement
Not applicable.
Data Availability Statement
The authors will make the raw data supporting the conclusions of this article available upon reasonable request.
Conflicts of Interest
The authors declare no conflicts of interest.
References
- Shah, S.A.R.; Abbas, N.; Serbanescu, L.; Niu, R.; Nassani, A.A. The Key Challenges and Best Alternatives to Environmental Sustainability: A Comprehensive Study. Sci. Rep. 2025, 15, 7042. [Google Scholar] [CrossRef] [Scilit]
- Siche, R.; Agostinho, F.; Ortega, E. Emergy Net Primary Production (ENPP) as Basis for Calculation of Ecological Footprint. Ecol. Indic. 2010, 10, 475–483. [Google Scholar] [CrossRef] [Scilit]
- Singh, A.K. Indicators and Indices for Sustainability Assessment. In Quantitative Assessment of Sustainability and Sustainable Development; Springer: Cham, Switzerland, 2025; pp. 63–124. [Google Scholar]
- David, L.K.; Wang, J.; Brooks, W.; Angel, V. Digital Transformation and Socio-Economic Development in Emerging Economies: A Multinational Analysis. Technol. Soc. 2025, 81, 102834. [Google Scholar] [CrossRef] [Scilit]
- GFN Global Footprint Network. Available online: https://data.footprintnetwork.org/?_ga=2.119469760.875854760.1592913814-1106911989.1586515594#/ (accessed on 1 June 2025).
- Ghita, S.I.; Saseanu, A.S.; Gogonea, R.M.; Huidumac-Petrescu, C.E. Perspectives of Ecological Footprint in European Context under the Impact of Information Society and Sustainable Development. Sustainability 2018, 10, 3224. [Google Scholar] [CrossRef] [Scilit]
- Guloglu, B.; Emre Caglar, A.; Korkut Pata, U. Analyzing the Determinants of the Load Capacity Factor in OECD Countries: Evidence from Advanced Quantile Panel Data Methods. Gondwana Res. 2023, 118, 92–104. [Google Scholar] [CrossRef] [Scilit]
- Martiny, A.; Taglialatela, J.; Testa, F.; Iraldo, F. Determinants of Environmental Social and Governance (ESG) Performance: A Systematic Literature Review. J. Clean. Prod. 2024, 456, 142213. [Google Scholar] [CrossRef] [Scilit]
- Soni, H.; Yadav, R.K.; Patra, S.K. Global Impact of Urbanization on Ecosystems: A Comprehensive Bibliometric Analysis. Nat. Hazards Res. 2025, 5, 21–35. [Google Scholar] [CrossRef] [Scilit]
- Maçaira, P.M.; Tavares Thomé, A.M.; Cyrino Oliveira, F.L.; Carvalho Ferrer, A.L. Time Series Analysis with Explanatory Variables: A Systematic Literature Review. Environ. Model. Softw. 2018, 107, 199–209. [Google Scholar] [CrossRef] [Scilit]
- Majeed, A.; Xie, Y.; Gao, C.; Du, A.M. Muniba Examining the Role of Artificial Intelligence, Financial Innovation, and Green Energy Transition in Enhancing Environmental Quality. Int. Rev. Econ. Financ. 2025, 100, 104092. [Google Scholar] [CrossRef] [Scilit]
- Murray, L.T.; Oswalt, S.N.; Goeking, S.A.; Renwick, K.M. Forest Definitions Applied for National United States Forest Reporting: Status, Gaps, and Opportunities. Trees For. People 2025, 20, 100839. [Google Scholar] [CrossRef] [Scilit]
- Dashora, L.K.; Firoz, C.M.; Shaw, R. Understanding Urbanization, Urban Sustainability, and Environmental Transition Challenges in Global South. In Urban Sustainability; Springer: Singapore, 2025; pp. 1–8. [Google Scholar]
- Brida, J.G.; Alvarez, E.; Cayssials, G.; Mednik, M. How Does Population Growth Affect Economic Growth and Vice Versa? An Empirical Analysis. Rev. Econ. Political Sci. 2024, 9, 265–297. [Google Scholar] [CrossRef] [Scilit]
- Huang, G.; Huang, P.H.; Khattak, S.I.; Khan, A. Load Capacity Factor as Metrics for Land and Forests Sustainability Assessment in G20 Economies: Fresh Insight from Policy, Technology, and Economy Perspectives. Forests 2025, 16, 1654. [Google Scholar] [CrossRef] [Scilit]
- Hassan, A.; Ibrahim, R.L.; Raimi, L.; Omokanmi, O.J.; S Senathirajah, A.R.B. Balancing Growth and Sustainability: Can Green Innovation Curb the Ecological Impact of Resource-Rich Economies? Sustainability 2025, 17, 4579. [Google Scholar] [CrossRef] [Scilit]
- Alamandi, M. Sustainable Innovation Management: Balancing Economic Growth and Environmental Responsibility. Sustainability 2025, 17, 4362. [Google Scholar] [CrossRef] [Scilit]
- Majeed, A.; Wang, J.; Zhou, Y. Muniba The Symmetric Effect of Financial Development, Human Capital and Urbanization on Ecological Footprint: Insights from BRICST Economies. Sustainability 2024, 16, 5051. [Google Scholar] [CrossRef] [Scilit]
- Sarabdeen, M.; Elhaj, M.; Alofaysan, H. Do Digital Adaptation, Energy Transition, Export Diversification, and Income Inequality Accelerate towards Load Capacity Factors across the Globe? Energies 2024, 17, 3981. [Google Scholar] [CrossRef] [Scilit]
- Mamuti, A.; Kadiu, F.; Sherifi, I.; Romānova, I.; Grima, S. Unravelling the Link Between Financialisation and Economic Growth: Evidence from Croatia. Risks 2025, 13, 15. [Google Scholar] [CrossRef] [Scilit]
- OECD. Analytical Business Enterprise Research and Development Database. 2025. Available online: https://www.oecd.org/en/data/datasets/analytical-business-enterprise-research-and-development.html (accessed on 1 October 2025).
- Pal, S.; Vankila, S.; Fernandes, M.N. Interplay of Financial Inclusion and Economic Growth in Emerging Economies. World Dev. Sustain. 2025, 6, 100201. [Google Scholar] [CrossRef] [Scilit]
- Li, C.; Wu, J.; Zhang, F.; Huang, X. Forest Carbon Sinks in Chinese Provinces and Their Impact on Sustainable Development Goals. Forests 2025, 16, 83. [Google Scholar] [CrossRef] [Scilit]
- Tillaguango, B.; Alvarado, R.; Ahmad, M.; Murshed, M.; Işık, C. Applying the Forest Load Capacity Factor to Assess Environmental Sustainability in the Global South. For. Policy Econ. 2025, 180, 103631. [Google Scholar] [CrossRef] [Scilit]
- Aslanoğlu, R.; Kazak, J.K.; Szewrański, S.; Świąder, M.; Arciniegas, G.; Chrobak, G.; Jakóbiak, A.; Turhan, E. Ten Questions Concerning the Role of Urban Greenery in Shaping the Future of Urban Areas. Build. Environ. 2025, 267, 112154. [Google Scholar] [CrossRef] [Scilit]
- Zhu, Z.G.; Zhang, Y.; Obuobi, B. The Impact of Forest Rents on Ecological Footprints in China: The Moderating Role of Government Effectiveness. Forests 2025, 16, 415. [Google Scholar] [CrossRef] [Scilit]
- Jaiswal, N.; Chowdhury, A.R.; Jayakumar, S. Urban Biodiversity: Threats and Conservation Strategies. In Urban Book Series; Springer: Cham, Switzerland, 2026; Volume Part F1251, pp. 97–123. [Google Scholar]
- Ren, Q.; He, C.; Huang, Q.; Zhang, D.; Shi, P.; Lu, W. Impacts of Global Urban Expansion on Natural Habitats Undermine the 2050 Vision for Biodiversity. Resour. Conserv. Recycl. 2023, 190, 106834. [Google Scholar] [CrossRef] [Scilit]
- Zhen, F.; Liu, M.; Yang, R. Deriving the Impact Mechanism of Urban Green Space Environment on Community Social Capital Based on Multi-Source Data Integration: A Case Study of Nanjing City, China. Comput. Urban Sci. 2025, 5, 5. [Google Scholar] [CrossRef] [Scilit]
- Li, X.; Song, W.; Cao, S.; Mo, Y.; Du, M.; He, Z. The Impact of Multidimensional Urbanization on Sustainable Development Goals (SDGs): A Long-Term Analysis of the 31 Provinces in China. Ecol. Indic. 2024, 169, 112822. [Google Scholar] [CrossRef] [Scilit]
- Wu, X.; Majeed, A.; Vasbieva, D.G.; Yameogo, C.E.W.; Hussain, N. Natural Resources Abundance, Economic Globalization, and Carbon Emissions: Advancing Sustainable Development Agenda. Sustain. Dev. 2021, 29, 1037–1048. [Google Scholar] [CrossRef] [Scilit]
- Aziz, G.; Sarwar, S.; Hussan, M.W.; Saeed, A. The Importance of Extended-STIRPAT in Responding to the Environmental Footprint: Inclusion of Environmental Technologies and Environmental Taxation. Energy Strategy Rev. 2023, 50, 101216. [Google Scholar] [CrossRef] [Scilit]
- Savaş, Y. Examining the Link between Load Capacity and Income Inequality: Evidence from OECD Countries. Environ. Dev. Sustain. 2025, 27, 8065–8083. [Google Scholar] [CrossRef] [Scilit]
- Muttarak, R. Demographic Perspectives in Research on Global Environmental Change. Popul. Stud. 2021, 75, 77–104. [Google Scholar] [CrossRef] [Scilit]
- Almeida, D.; Carvalho, L.; Ferreira, P.; Dionísio, A.; Haq, I.U. Global Dynamics of Environmental Kuznets Curve: A Cross-Correlation Analysis of Income and CO2 Emissions. Sustainability 2024, 16, 9089. [Google Scholar] [CrossRef] [Scilit]
- Yu, J.; Majeed, A.; Liu, Y. Rethinking Foreign Direct Investment’s Role in Sustainable Development: Insights from the E-7 Economies Using Advanced Panel Data Methodologies. Sustainability 2025, 17, 3757. [Google Scholar] [CrossRef] [Scilit]
- Gava, E.; Seabela, M.; Ogujiuba, K. Energy Efficiency, Consumption, and Economic Growth: A Causal Analysis in the South African Economy. Economies 2025, 13, 118. [Google Scholar] [CrossRef] [Scilit]
- An, R.; Hu, X.; Sun, S. The Nonlinear Relationship Between Urbanization and Ecological Environment in China Under the PSR (Pressure-State-Response) Model: Inflection Point Identification and Policy Pathways. Sustainability 2025, 17, 4450. [Google Scholar] [CrossRef] [Scilit]
- Kwilinski, A.; Lyulyov, O.; Pimonenko, T. The Role of Green Finance in Attaining Environmental Sustainability within a Country’s ESG Performance. J. Innov. Knowl. 2025, 10, 100674. [Google Scholar] [CrossRef] [Scilit]
- Wang, Z.; Gao, L.; Wei, Z.; Majeed, A.; Alam, I. How FDI and Technology Innovation Mitigate CO2 Emissions in High-Tech Industries: Evidence from Province-Level Data of China. Environ. Sci. Pollut. Res. 2022, 29, 4641–4653. [Google Scholar] [CrossRef] [Scilit]
- Zhu, G.; Qi, L.; Shao, H.; Asif, M. Balancing Growth and Sustainability: Green Finance and Renewable Energy Pathways for Resource-Rich Economies. Nat. Resour. Model. 2025, 38, e70012. [Google Scholar] [CrossRef] [Scilit]
- OECD. OECD.Org—OECD. Available online: https://www.oecd.org/ (accessed on 4 December 2025).
- WDI. World Development Indicators|DataBank. 2025. Available online: https://databank.worldbank.org/source/world-development-indicators (accessed on 10 October 2025).
- Jangid, H.; Rao, N.V.M.; Bal, D.P. Revisiting the Load Capacity Curve Hypothesis: Evidence from Fintech, Renewable Energy and Environmental Sustainability in G-20 Economies. Technol. Sustain. 2025, 5, 43–60. [Google Scholar] [CrossRef] [Scilit]
- Zabala, A.; Pascual, U.; García-Barrios, L.E.; Mukherjee, N. Drivers to Adopt Agroforestry and Sustainable Land-Use Innovations: A Review and Framework for Policy. Land Use Policy 2025, 151, 107468. [Google Scholar] [CrossRef] [Scilit]
- West, R.M. Best Practice in Statistics: The Use of Log Transformation. Ann. Clin. Biochem. 2022, 59, 162–165. [Google Scholar] [CrossRef] [Scilit] [PubMed]
- Munir, Q.; Lean, H.H.; Smyth, R. CO2 Emissions, Energy Consumption and Economic Growth in the ASEAN-5 Countries: A Cross-Sectional Dependence Approach. Energy Econ. 2020, 85, 104571. [Google Scholar] [CrossRef] [Scilit]
- Pesaran, M.H. General Diagnostic Tests for Cross Section Dependence in Panels. SSRN Electron. J. 2004, 1229, 1–41. [Google Scholar] [CrossRef] [Scilit]
- Moghaddam, H.; Kunst, R.M. The Role of Natural Gas in Mitigating Greenhouse Gas Emissions: The Environmental Kuznets Curve Hypothesis for Major Gas-Producing Countries. Sustainability 2023, 15, 4266. [Google Scholar] [CrossRef] [Scilit]
- Pesaran, M.H.; Yamagata, T. Testing Slope Homogeneity in Large Panels. J. Econom. 2008, 142, 50–93. [Google Scholar] [CrossRef] [Scilit]
- Pesaran, M.H. A Simple Panel Unit Root Test in the Presence of Cross-section Dependence. J. Appl. Econom. 2007, 22, 265–312. [Google Scholar] [CrossRef] [Scilit]
- Westerlund, J. Testing for Error Correction in Panel Data. Oxf. Bull. Econ. Stat. 2007, 69, 709–748. [Google Scholar] [CrossRef] [Scilit]
- Machado, J.A.F.; Santos Silva, J.M.C. Quantiles via Moments. J. Econom. 2019, 213, 145–173. [Google Scholar] [CrossRef] [Scilit]
- Pedroni, P. Fully Modified OLS for Heterogeneous Cointegrated Panels. Adv. Econom. 2000, 15, 93–130. [Google Scholar] [CrossRef] [Scilit]
- Kao, C.; Chiang, M.H. On the Estimation and Inference of a Cointegrated Regression in Panel Data. Adv. Econom. 2000, 15, 179–222. [Google Scholar] [CrossRef] [Scilit]
- Beck, N.; Katz, J.N. What To Do (and Not to Do) with Time-Series Cross-Section Data. Am. Political Sci. Rev. 1995, 89, 634–647. [Google Scholar] [CrossRef] [Scilit]
- Pesaran, M.H.; Ullah, A.; Yamagata, T. A Bias-Adjusted LM Test of Error Cross-Section Independence. Econom. J. 2008, 11, 105–127. [Google Scholar] [CrossRef] [Scilit]
- Galvao, A.F.; Juhl, T.; Montes-Rojas, G.; Olmo, J. Testing Slope Homogeneity in Quantile Regression Panel Data with an Application to the Cross-Section of Stock Returns. J. Financ. Econom. 2018, 16, 211–243. [Google Scholar] [CrossRef] [Scilit]
- Samour, A.; Radmehr, R.; Ali, E.B.; Shayanmehr, S.; Ofori, E.K.; Porhajašová, J.I.; Babošová, M.; Kačániová, M.; Dimnwobi, S.K. The Role of Financial Inclusion and Technological Innovation in Stimulating Environmental Sustainability in the European Countries: A New Perspective Based on Load Capacity Factor. Heliyon 2024, 10, e39970. [Google Scholar] [CrossRef] [Scilit]
- Balsalobre-Lorente, D.; Topaloglu, E.E.; Nur, T.; Pilař, L. The Management of Environmental Taxation, ICT, and Financial Development over the Load Capacity in Advanced Economies. J. Environ. Manag. 2025, 392, 126878. [Google Scholar] [CrossRef] [Scilit]
- Toledo, E.; Ochoa-Moreno, W.S.; Alvarado, R.; Cuesta, L.; Murshed, M.; Rehman, A. Forest Area: Old and New Factors That Affect Its Dynamics. Sustainability 2022, 14, 3888. [Google Scholar] [CrossRef] [Scilit]
- Lopes, V.; dos Santos, L.C.; Trillo-Santamaría, J.M. The Influence of Forest Fires on Ecological, Economic, and Social Trends in Landscape Dynamics in Portugal. Land 2025, 14, 1273. [Google Scholar] [CrossRef] [Scilit]
- Tunio, F.H.; Nabi, A.A.; Memon, R.U.R.; Fraz, T.R.; Haluza, D. Sustainability in High-Income Countries: Urbanization, Renewables, and Ecological Footprints. Energies 2025, 18, 1599. [Google Scholar] [CrossRef] [Scilit]
- Tal, A. The Environmental Impacts of Overpopulation. Encyclopedia 2025, 5, 45. [Google Scholar] [CrossRef] [Scilit]
- Gherghina, S.C.; Menegaki, A.N.; Mbangezeli, S.; Phiri, A. Exploring the Deep Roots of the Environmental Kuznets Curve (Ekc): Evidence from a Global Sample. Economies 2025, 13, 369. [Google Scholar] [CrossRef] [Scilit]
- Zhuang, L.; Wang, Z. The Green Effect of New Quality Productive Forces: Examined from the Perspectives of Green Finance and Technological Innovation. Sustainability 2025, 17, 10284. [Google Scholar] [CrossRef] [Scilit]
- Raihan, A.; Tuspekova, A. Dynamic Impacts of Economic Growth, Energy Use, Urbanization, Agricultural Productivity, and Forested Area on Carbon Emissions: New Insights from Kazakhstan. World Dev. Sustain. 2022, 1, 100019. [Google Scholar] [CrossRef] [Scilit]
- Chang, G.; Yasin, I.; Naqvi, S.M.M.A. Environmental Sustainability in OECD Nations: The Moderating Impact of Green Innovation on Urbanization and Green Growth. Sustainability 2024, 16, 7047. [Google Scholar] [CrossRef] [Scilit]
- Eweade, B.S. Do Natural Resources, Renewable Energy, Urbanisation, and Economic Growth Drive Brazil’s Ecological Footprint? A Quantile ARDL Approach. Geol. J. 2025. [Google Scholar] [CrossRef] [Scilit]
- Shi, S.; Smith, L. Decoupling Growth from Degradation: A CS-ARDL and MMQR Panel Analysis of Ecological Footprints and Sustainable Economic Growth. Front. Environ. Sci. 2025, 13, 1604011. [Google Scholar] [CrossRef] [Scilit]

Disclaimer/Publisher’s Note: The statements, opinions and data contained in all publications are solely those of the individual author(s) and contributor(s) and not of MDPI and/or the editor(s). MDPI and/or the editor(s) disclaim responsibility for any injury to people or property resulting from any ideas, methods, instructions or products referred to in the content. |
© 2026 by the authors. Licensee MDPI, Basel, Switzerland. This article is an open access article distributed under the terms and conditions of the Creative Commons Attribution (CC BY) license.