


Abstract
The present study examines the relationship between environmental, economic, and bioenergy impacts of renewable energy in Egypt, spanning from 1990 to 2023. The study utilizes three distinct models, concluding that all variables remain stationary at I(0) and I(1). Therefore, analysis is conducted using the Autoregressive Distributed Lag (ARDL) approach. Model 1 captures the relationship between bioenergy production and GDP per capita, as well as the significant impact of capital formation on economic growth. Models 2 and 3 of the study have CO2 emissions as the dependent variable, which indicates that renewable energy, urbanization, GDP per capita, and bioenergy production have a significant impact. Moreover, the short-run analysis conducted using the Error Correction Model (ECM) reveals the model’s long-run convergence. The study’s findings also support the environmental Kuznets curve (EKC) hypothesis, and the interaction term between bioenergy and GDP per capita is found to contribute to carbon dioxide emissions. To achieve a low-carbon and growth-oriented economy, policymakers should encourage investment in renewable energy, as it enhances technological efficiency and fosters sustainable agricultural growth.
1. Introduction
In the modern era, all countries of the world are striving to improve their people’s living standards through higher economic growth. So, the agriculture sector is one of the leading sectors that fulfills the food requirements of the people and produces bioenergy that leads to higher gross domestic product (GDP) per capita. The share of the agriculture sector in the GDP of Egypt is more than 14.8 percent, while this sector provides more than 25 percent of jobs in the labor market [1]. In this regard, the current study focuses on the importance of bioenergy production, its impact on economic growth, and the relationship between bioenergy and GDP per capita in terms of carbon dioxide emissions.
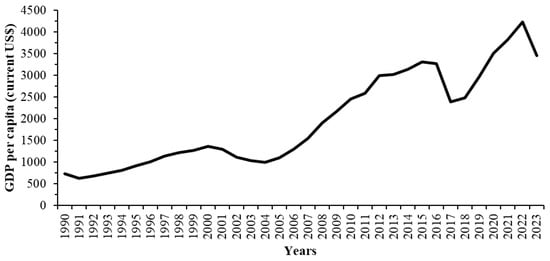
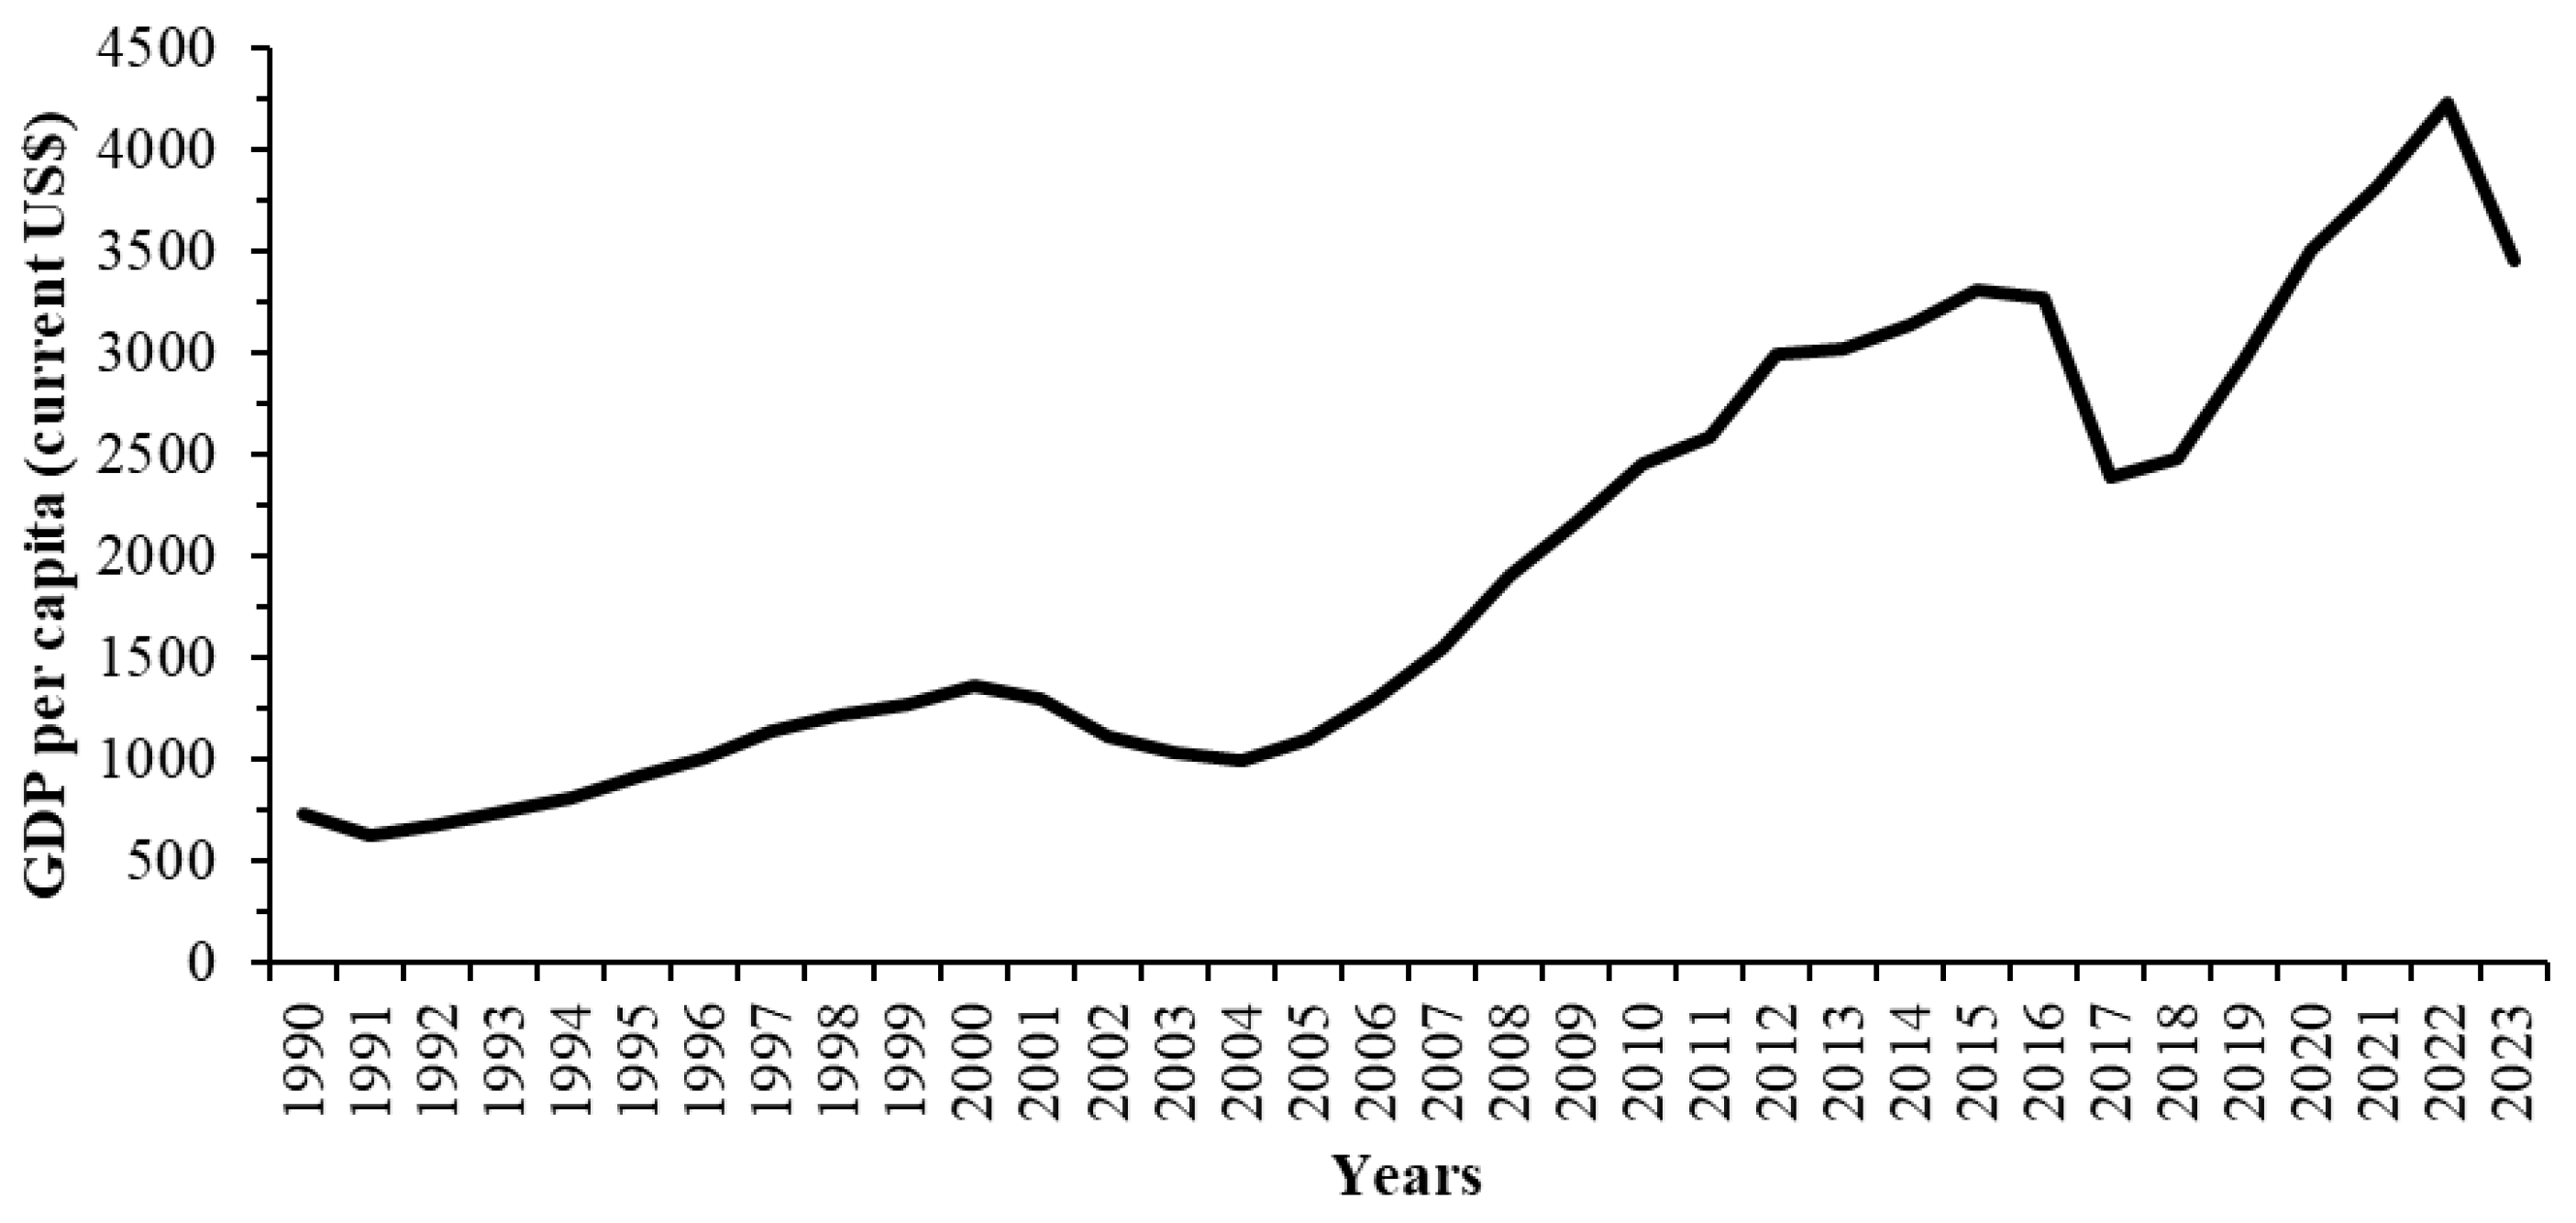
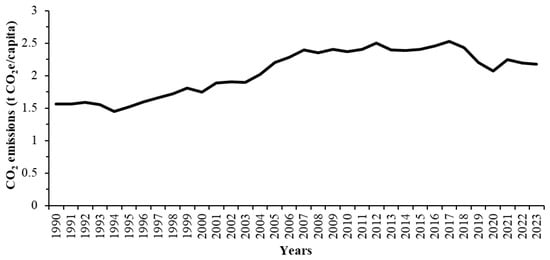
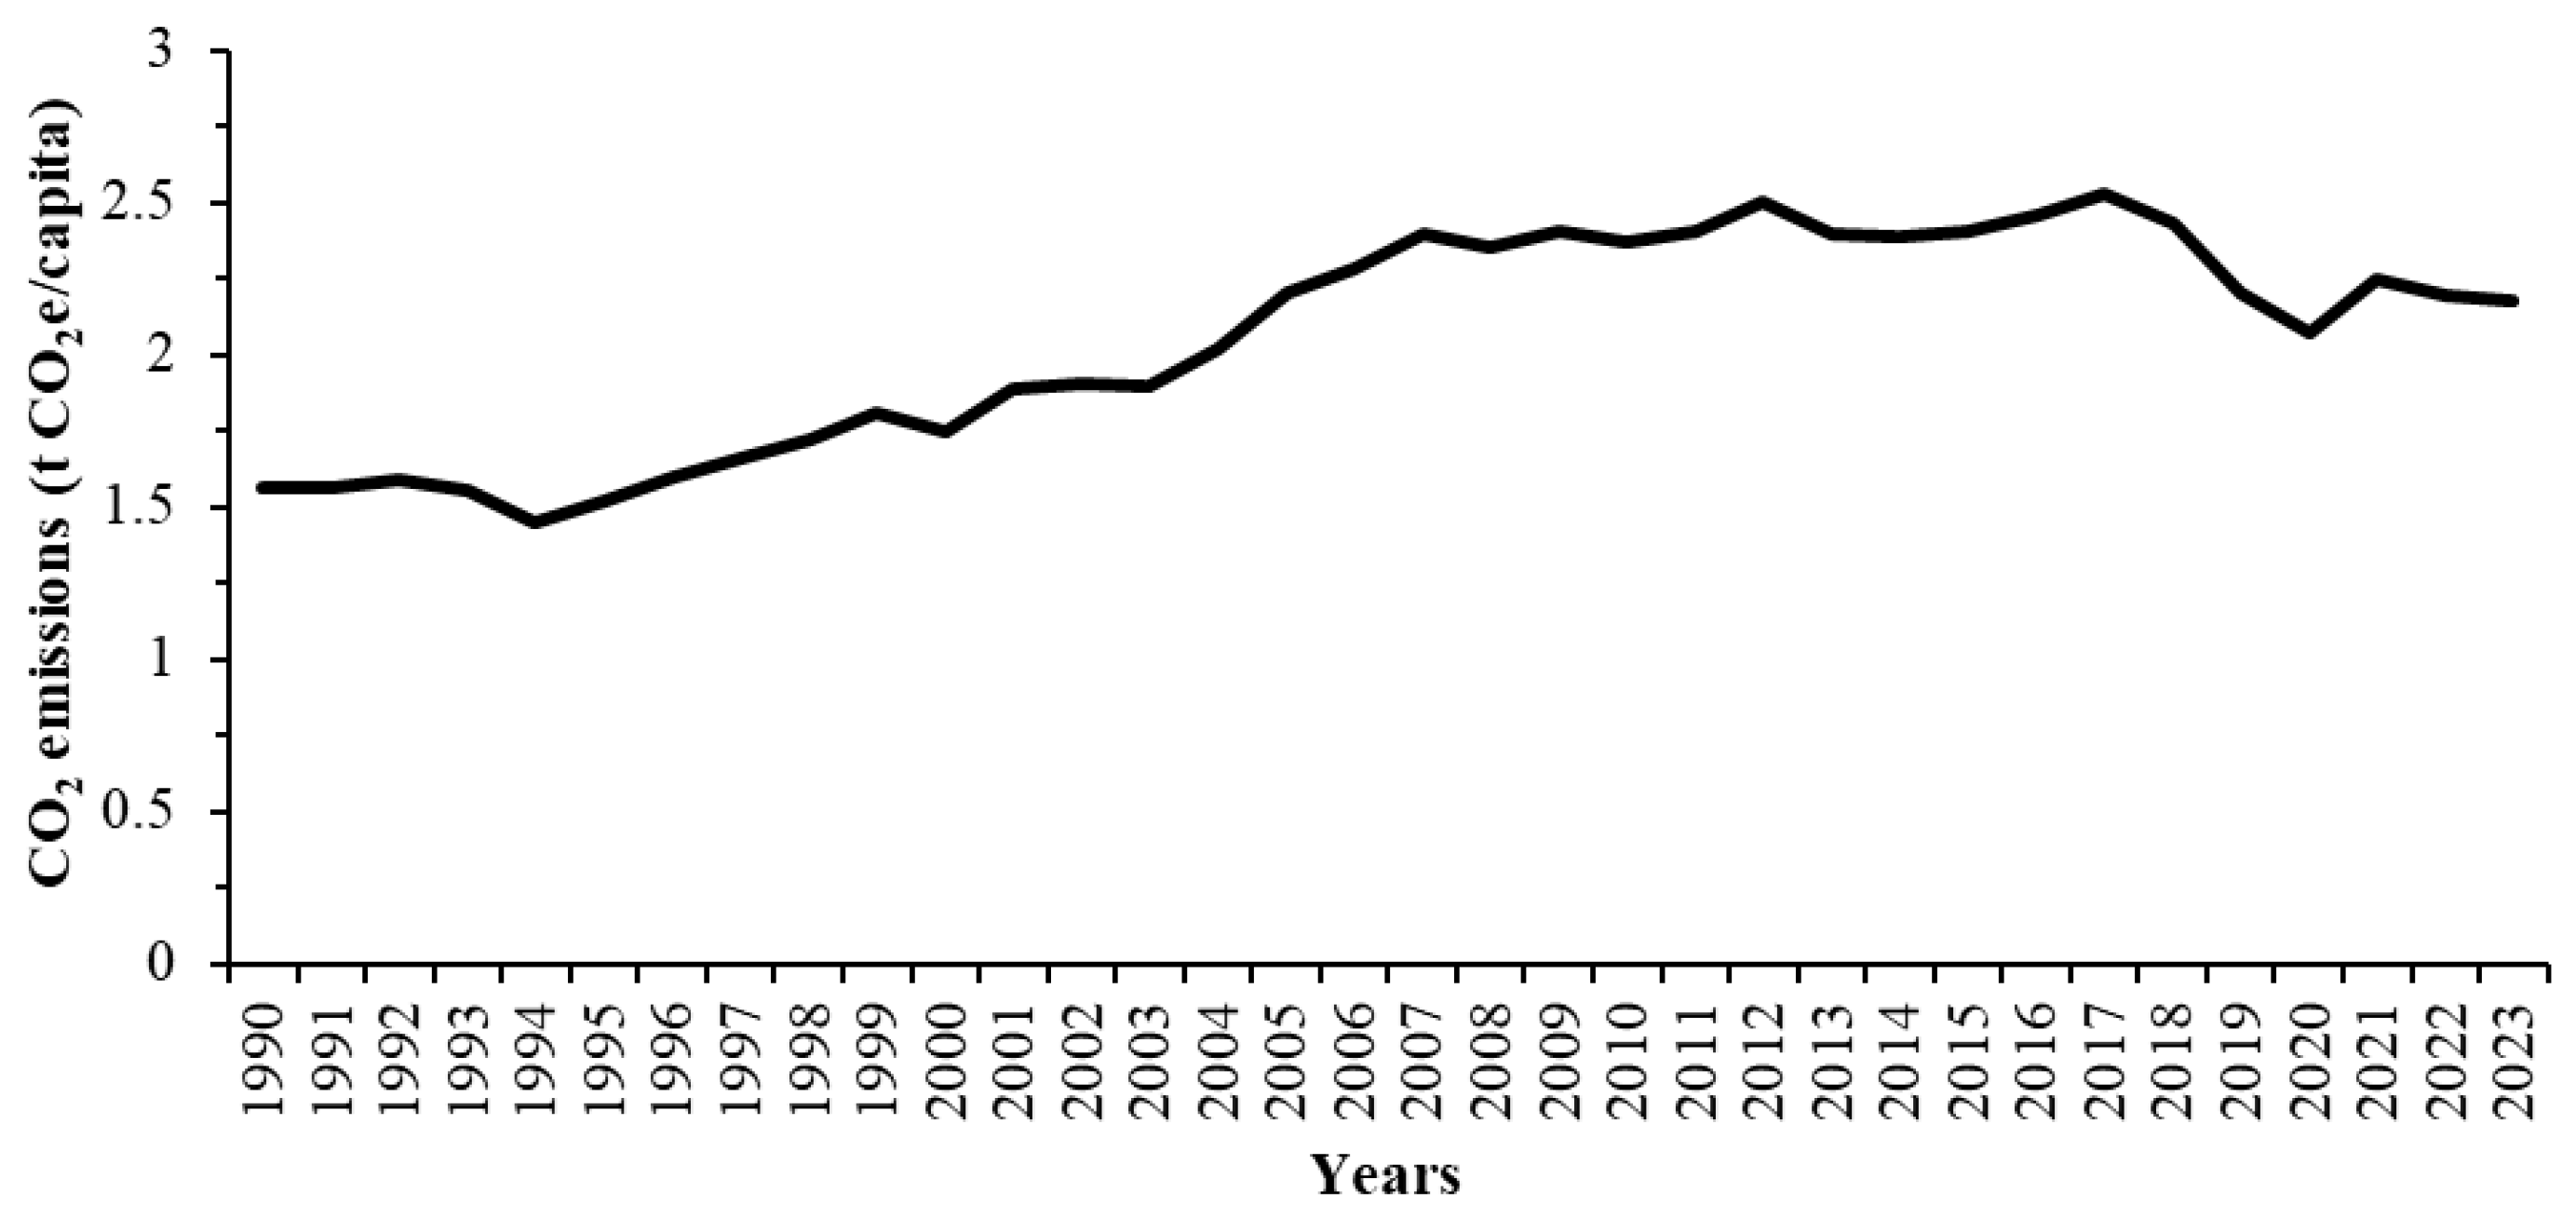
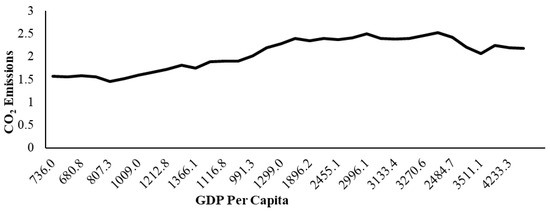
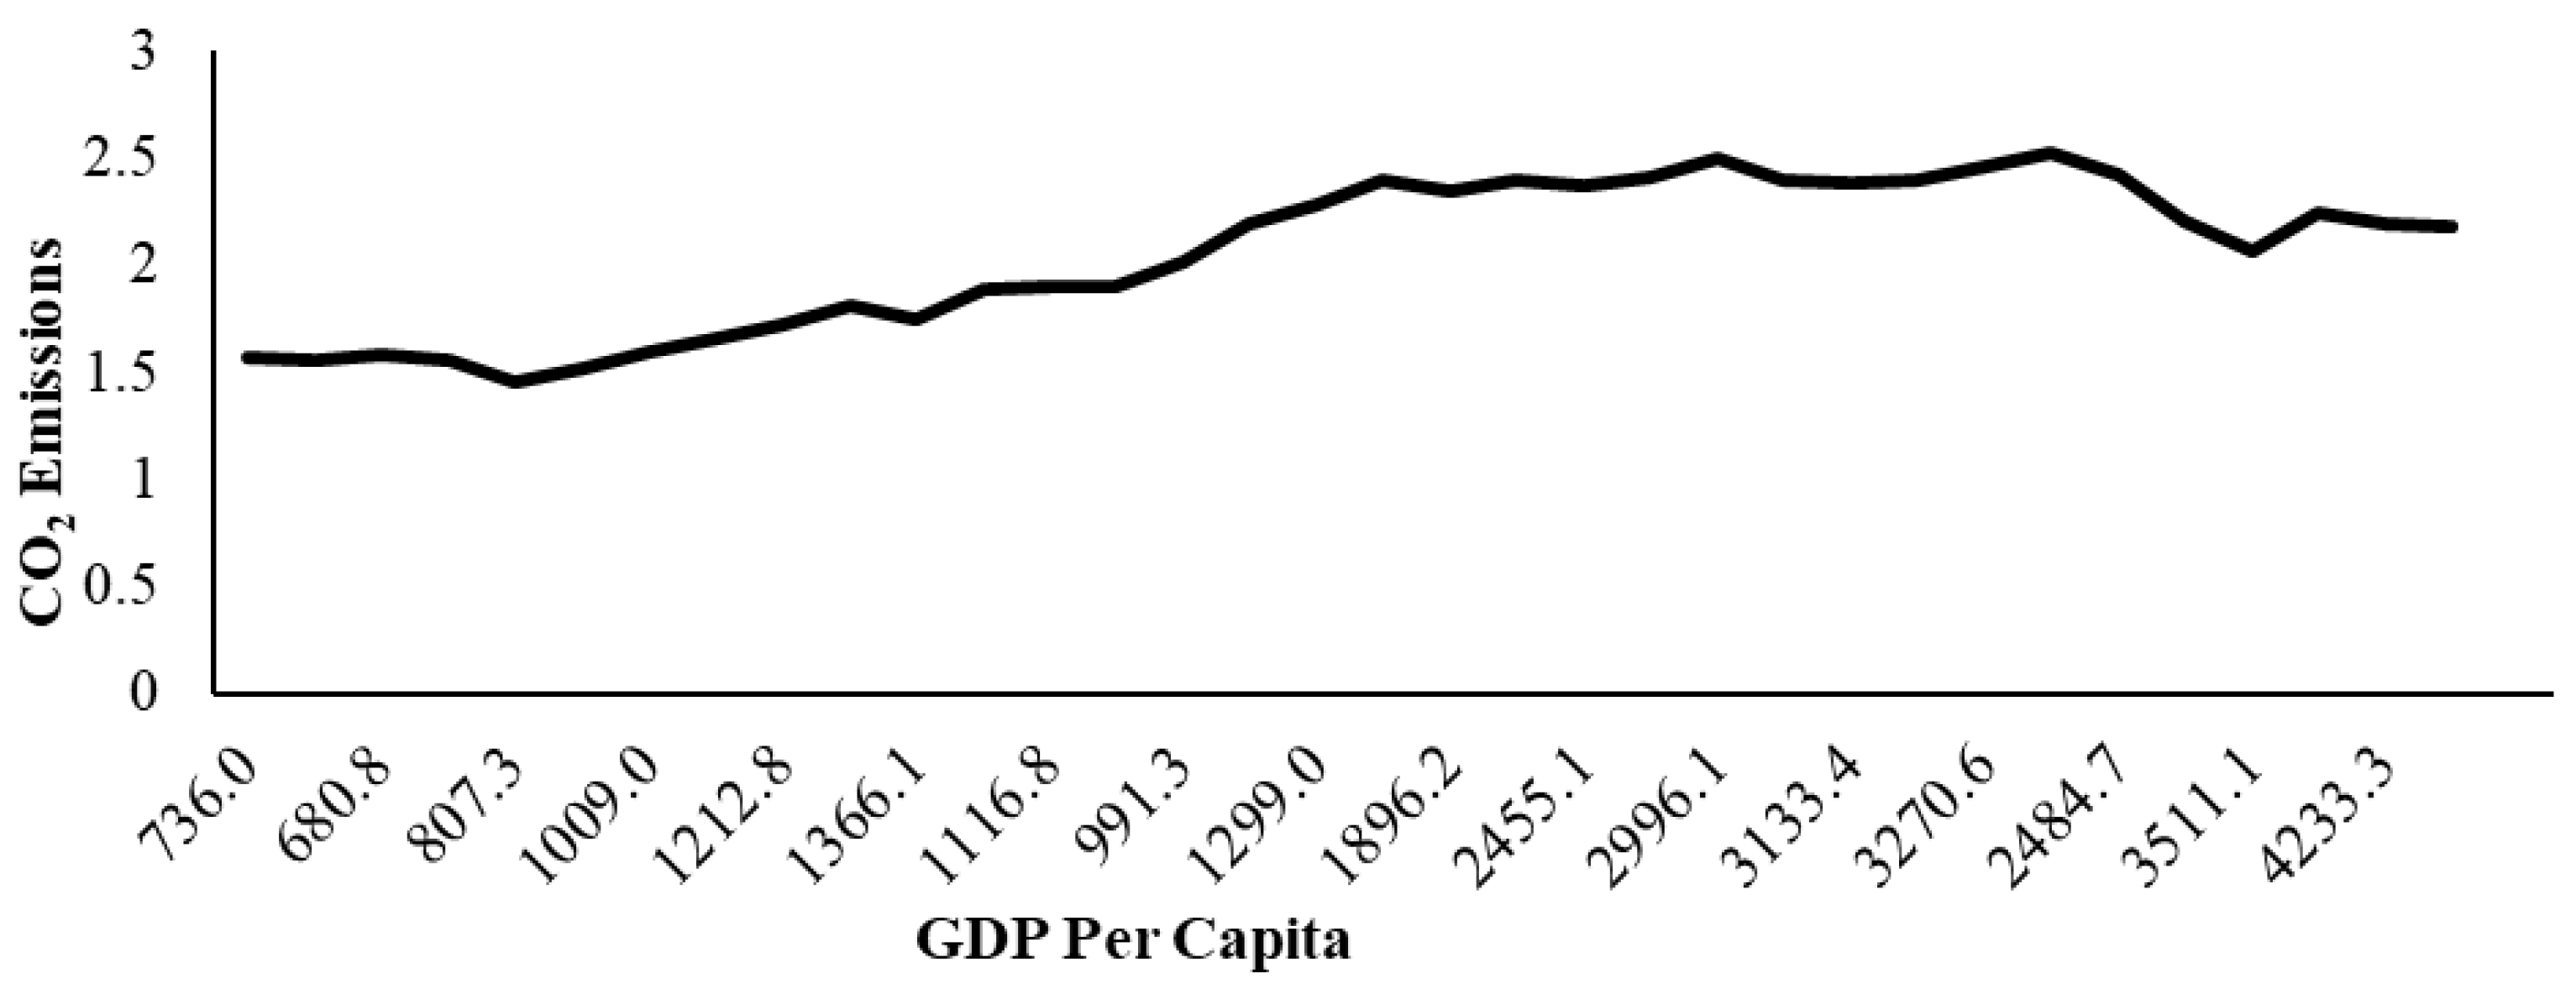
Most studies have conducted analyses of the relationship between GDP per capita and bioenergy production, as seen in the work of Wu et al. [2] and Busu [3]. They focus on the advantages of bioenergy, particularly its renewability and large quantity, which plays a crucial role in energy security. The negative impact of bioenergy could manifest as greenhouse gas emissions; however, its effect on economic growth remains to be estimated. Accordingly, Busu [3] argues that there is a positive relationship between bioenergy and sustainable economic development. Furthermore, it is estimated that the use of bioenergy positively impacts GDP growth and reduces pollution levels. Over time, GDP per capita has increased, as shown in Figure 1, although there has been a downward trend from 2016 to 2018. Figure 2 illustrates CO2 emissions over time and shows the relationship between emissions and GDP per capita.
Figure 1.
GDP per capita over time.
Figure 2.
Carbon dioxide (CO2) emissions over time.
With reference to this discussion, different studies discussed above individually tested the hypothesis, so we need to estimate the causal effect. This study focuses on both aspects using three different models. So, there is a need to investigate how bioenergy development (especially from agricultural waste) contributes to economic growth, environmental quality, and circular economy performance in developing countries. So, the research objective of the study is to analyze the causal relationship between bioenergy production, agricultural waste utilization, and economic growth. Moreover, the study also assesses the environmental benefits of circular bioenergy systems in terms of CO2 emission reduction. Furthermore, we aim to facilitate policymakers to make effective policies to promote growth, considering circular bioenergy markets and rural employment. To keep pace with rapid population growth, renewable energy is an important energy source for sustainable, favorable growth. Moreover, renewable energy sources are rapidly increasing, which also helps to reduce carbon emissions [4,5].
Despite this, the literature includes numerous studies examining the relationship between economic growth and other factors, such as energy use and environmental quality. Existing studies examine the relationship in isolation and assume that the impact of bioenergy on carbon emissions is uniform across income levels. Therefore, we need to examine how economic development affects the production, consumption, and integration of bioenergy into the system. The role of structural factors such as capital formation, labor dynamics, urbanization, and trade openness is very important. So, these factors that shape both income and environmental outcomes are relatively examined in the literature. Over time, the population is increasing, leading to higher electricity demand, but the high energy costs and climate problems are major issues. So, there is a need to see how this sector could be improved. This study addresses this gap and provides a clearer understanding of how the development process mediates the nexus between carbon and bioenergy.
In terms of the study’s significance, policymakers will gain an understanding of how bioenergy affects per capita gross domestic product and the impact of GDP per capita on CO2 emissions. Moreover, in the future, researchers will further develop this concept more rigorously, and the conclusion of this research will serve as the starting point.
2. Literature Review
Economic growth is a crucial pillar of society, significantly contributing to the reshaping of living standards, and bioenergy production could be a key indicator of this. Moreover, the role of gross domestic product per capita also matters in seeing the impact of carbon dioxide emissions. This section explains carbon footprints of existing studies, helping to understand what has been done in this field in terms of research and what remains to be done.
2.1. Bioenergy and per Capita GDP
Said et al. [6] examine how carbon emissions are mitigated by replacing fossil fuels with bioenergy production, resulting in a decrease in environmental pollution. In Egypt, annual biomass waste could amount to 80 million tons, with most of the contribution being from agricultural crop residues. The reduction in carbon emissions from substituting fossil fuels with bioenergy is approximately 30.47 million tons of CO2 annually [7]. The bio-based circular economy integrates the concept of circular economy and bioeconomy. Fossil fuels contribute to economic growth, but also generate greenhouse gas emissions, which in turn lead to global warming and climate change. Moreover, using rice straw as a renewable fuel could reduce fossil fuel consumption and CO2 emissions [8]. The emerging bioeconomy requires new technologies to reduce dependence on fossil fuels, thereby mitigating climate change and enhancing resource efficiency [9]. Along with the world’s commitment to low carbon emissions, energy demand in the transport and other sectors has increased by more than 50% over the last three decades [10]. An empirical study examines the relationship between renewable and non-renewable energy dynamics and climate change indicators in developing economies. The study employs the ARDL approach to investigate how renewable energy production (REP), specifically bioenergy, influences climate variables [11]. Biomass waste can be classified into four categories and yield higher energy output [12]. At the international level, many studies have also been conducted, demonstrating an established relationship between biomass and economic growth [13,14,15].
2.2. Per Capita GDP and CO2 Emissions
Raihan et al. [16] estimate the impact of economic growth, fossil fuel energy consumption and renewable energy consumption on CO2 emissions in Egypt. Their findings reveal that economic growth and the use of fossil fuel energy contribute to environmental damage through CO2 emissions in Egypt. So, increases in the share of renewable energy and agricultural productivity contribute to environmental quality by reducing CO2 emissions. A study by Tucker [17] found a positive relationship between energy consumption and CO2 emissions, which promotes economic development. Moreover, Aldegheishem’s [18] study, spanning 21 years across 137 countries worldwide, examines the relationship between CO2 emissions and GDP, yielding results that indicate a positive correlation between the two. The results also support the argument that the initial CO2 increase is associated with income increases, but after a certain level, it decreases as income continues to rise.
Following this, another study was conducted, which suggests that economic factors and environmental outcomes are strongly related. This study, conducted by Asumadu-Sarkodie and Owusu [19], utilized data from 1965 to 2011 and employed the ARDL technique. The technique was applied because some variables were stationary at I(0) and the remaining variables were stationary at I(1). Results indicate a strong causal relationship between GDP per capita and CO2 emissions. The study’s variables are co-integrated and exhibit a strong long-term relationship, indicating that a 1% increase in gross domestic product is associated with a 1.45% reduction in CO2 emissions, thereby improving the environment. In 2006, a study by Aldy [20] found that CO2 emissions are more relevant in the modern era because environmental degradation is the main issue for economies, and the study’s main findings are highly fruitful for society.
2.3. Renewable Energy and CO2 Emissions
Most countries are suffering due to climate change, including changes in weather patterns, and greenhouse gases are a major contributor, as economic development has been based on fossil fuels for the last century. A study conducted by Mostafaeipour et al. [21] focuses on the relationship between CO2 and renewable energy. The results indicate that, as per the objectives, carbon emissions will be reduced by 7–41% over the next 20 years. A large portion of development was coming from the use of fossil fuels, which damage the environment through climate change and harmful emissions. Electricity is mainly generated from furnace oil, which emits CO2. Over time, most countries have shifted towards renewable energy, successfully mitigating the abrupt environmental damage. The study suggests that renewable energy can reduce national carbon emissions using a dynamic approach that evaluates five policy scenarios. The five policy scenarios include increasing feed-in tariffs, removing subsidies for fossil fuel power plants, and reducing carbon emissions through effective policies [21]. Several studies have focused on renewable energy and carbon emissions [22,23,24].
3. Theoretical Framework
The theoretical foundation of this paper is based on a rich discussion by Nobel laureates. Durlauf et al. [25] explain that Solow [26] neoclassical growth model, as well as further endogenous growth models by Romer [27] and Lucas Jr [28], are relevant. So, these models explain that output growth is primarily driven by physical capital and labor, with technological advancement increasing the per capita income. Moreover, in the next step, growth is explained through the endogenous growth model, which highlights the importance of innovations, human capital, and other policy variables, so that trade and urbanization contribute to productivity. Bioenergy contributes to economic growth through enhanced energy security and technological spillovers in the agriculture sector. Gross capital formation (GCF) represents the investment in physical assets that contribute to the economy’s productive capacity. The agricultural labor force also contributes to ensuring food security and value addition.
The bioenergy capacity indicates a country’s ability for its ecosystems to produce resources and capture waste. The neoclassical economist contributed significantly to economics. The economic growth theory developed by Solow [26] in 1956 explains that sustainable economic growth stems from various factors, including technology, and the same era also focused on the importance of natural resources. A study conducted by Wackernagel and Rees [29] suggests that sustainable ecological capacity has a positive correlation with human development. Moreover, studies conducted by Barro [30] and Solow [26] indicate that capital formation is a crucial pillar of the economy, thereby increasing productive capacity. The above studies explain the positive relationship between investment and economic growth. A book written by Barro and Sala-i-Martin [31] explains the impact of labor force on productivity and productive capacity.
Agglomeration promotion is considered through urbanization that leads to improved efficiency and innovation [32]. Trade contributes to economic growth through access to foreign markets, while methane emissions are typically considered by-products of agricultural and industrial sectors. More environmental degradation leads to reduced sustainable growth, and the environmental Kuznets curve is the best approach [33]. The circular economy framework addresses resource efficiency, encompassing the minimization of waste and the productive use of resources. Under this framework, circular bioenergy refers to the systematic conversion of waste into renewable energy inputs that align with the agricultural production system. Moreover, the agricultural waste recycled (AWR) and agricultural residues generated (ARG) produce bioenergy through waste generation, recycling behavior, and energy recovery in the agriculture sector [34].
3.1. Data Description
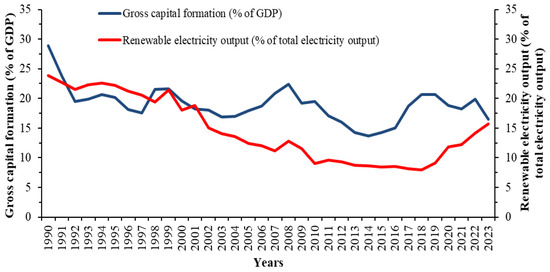
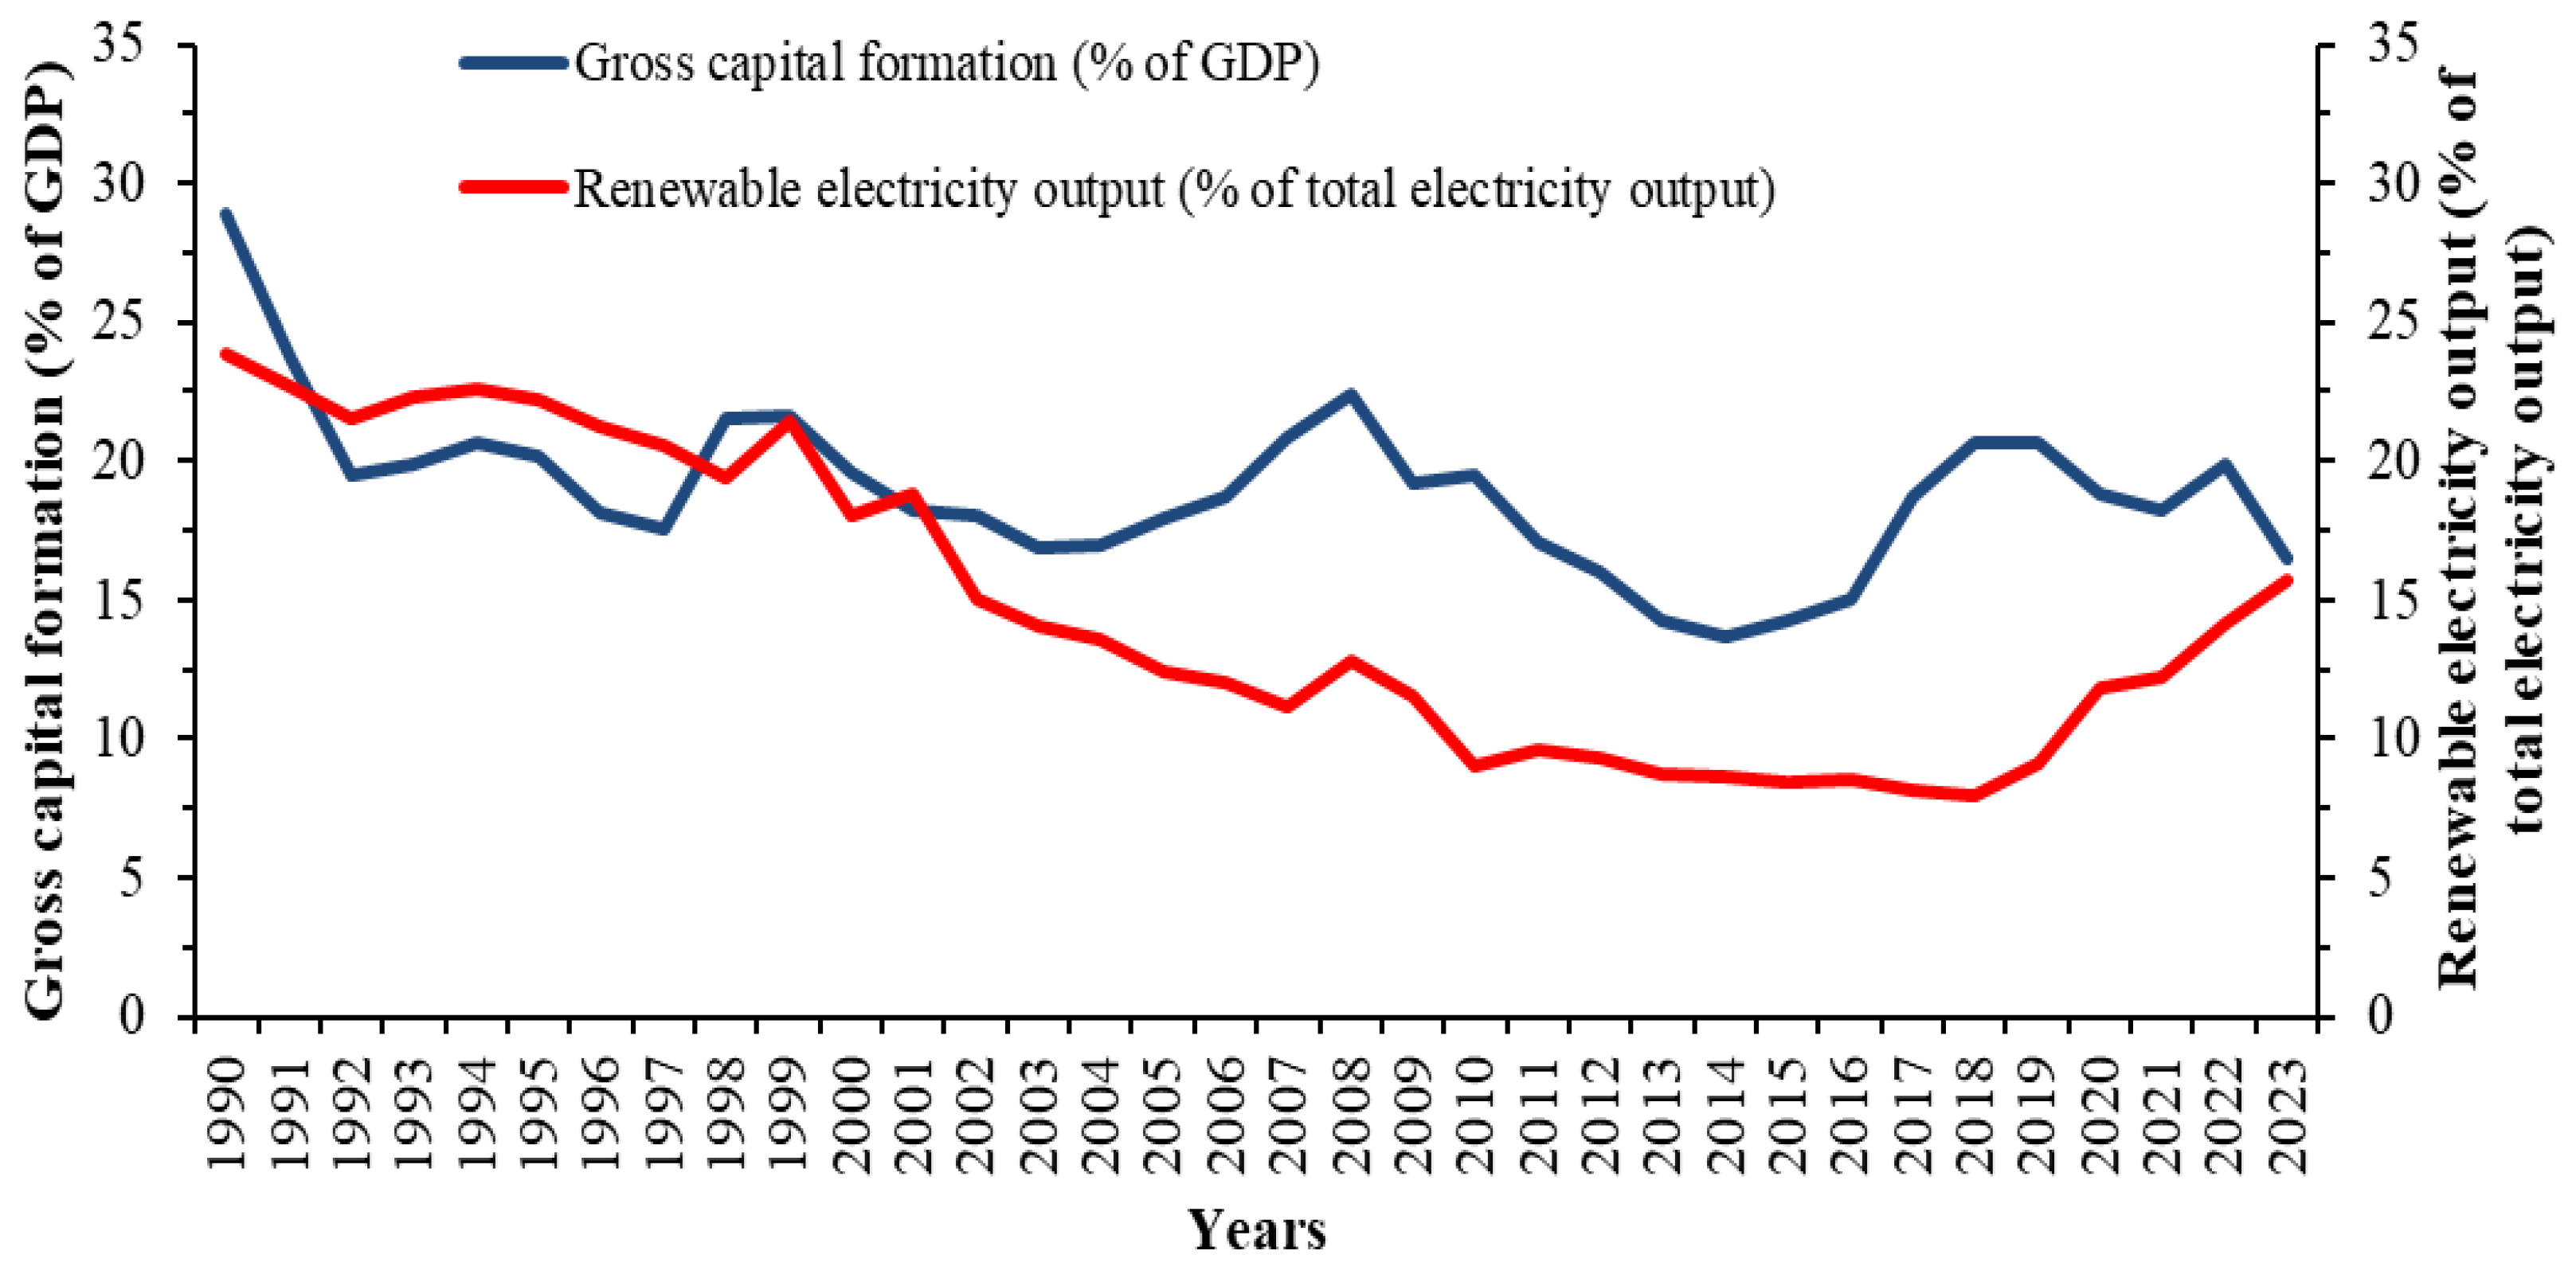
The study utilizes a secondary data set from 1990 to 2023 collected from various sources, including the World Development Indicator (WDI) and FAO. The variables are GDP per capita in US dollars, gross capital formation as a percentage of GDP, employment in agriculture percentage of total employment, carbon dioxide (CO2) emissions excluding LULUCF per capita, methane (CH4) emissions from agriculture, forest area percentage of land area, renewable electricity output percentage of total electricity output, renewable energy consumption percentage of total final energy consummation, agricultural residual generated in tons, agricultural waste recycled in percentage, bioenergy production and material recovery rate. Capital formation and renewable electricity output as a percentage of total electricity output are crucial factors in the economy, and the current study includes gross capital formation as a percentage of GDP. Figure 3 shows the over-time pattern.
Figure 3.
Over-time pattern of capital formation and renewable energy output.
The above figure shows that renewable electricity production has been increasing in recent years, which indicates the fruitful decision-making by the policymakers in favor of the economy, leading to a reduction in CO2 emissions. Table 1 defines the variables and descriptions of the variables.
Table 1.
Descriptions of the variables.
3.2. Models of the Study
The current study estimates three different models to capture the long-term relationship. The first model’s dependent variable is gross domestic product per capita, and the regressors are gross capital formation (KFORM), bioenergy production (BIOCAP), labor force (LAB), urbanization rate (URB) and trade openness (Trade).
The per capita gross domestic product refers to the average income of a citizen, calculated by dividing the total GDP by the total population. The components of trade openness are imports and exports, so it is the share of total trade in GDP, calculated as the sum of exports and imports, divided by GDP. Moreover, the second model explains the impact of per capita GDP, bioenergy production and urbanization on per capita carbon dioxide (CO2). This model includes per capita GDP and the squared per capita GDP to test the environmental Kuznets curve (EKC), which examines the relationship between CO2 emissions and GDP, initially increasing with GDP and then decreasing after a certain threshold is reached. Moreover, forest area also contributes significantly to the environment, as denoted by FA in Equation (2).
The third model explains the relationship beyond the variables included in model 2, with the inclusion of the interaction term of GDP per capita and bioenergy production on carbon emissions (CO2).
REO refers to renewable electricity output, while REC stands for renewable energy consumption. Moreover, ARG stands for agricultural residues generated and AWR stands for agricultural waste recycled.
The inclusion of variables such as forest area, GDP, and related variables in these models is based on theoretical justification and empirical relationships. Theory explains that forest area acts as a carbon sink, leading to reduced emissions. The environmental Kuznets curve (EKC) theory supports these justifications, and this study also estimates it.
3.3. Methodology
Before going into estimation, we need to test all variables for stationarity using the Augmented Dickey–Fuller (ADF) test. To estimate the long-run relationship among the variables, the ARDL (Autoregressive Distributed Lag) technique is employed. To capture short-run relations, the Error Correction Model (ECM) will be employed to examine convergence. This methodology is more flexible because it works well when the variables are integrated in a different order. The technique is best when we have a small dataset and is compatible with the bounds-testing approach for identifying the long-run relationship. Along with the long-run relationship, the ECM is used to explain how quickly the model converges to equilibrium. In this regard, error correction terms would be negative and significant, indicating convergence. The hypotheses of the study are given below.
H1.
Higher bioenergy production/share leads to higher GDP per capita (positive long-run effect).
H2.
Bioenergy reduces CO2 emissions per capita (negative long-run effect).
H3.
The effect of GDP on emissions is moderated (reduced) by bioenergy—i.e., bioenergy weakens the growth emissions relationship.
H4.
There are bi-directional causal relationships between bioenergy and economic growth (feedback effects).
As discussed, the ARDL approach was developed and launched in 2001 by Pesaran, Shin and Smith [35]. This approach was developed to overcome the limitations of traditional cointegration methods, such as the Engle-Granger and Johansen approaches. The traditional cointegration techniques require that all integrated variables be of the same order, such as I(1), whereas this model accommodates both I(0) and I(1) variables.
4. Results and Discussion
Thestudy begins with a stationarity assessment to determine the suitability of time series data for econometric analysis. For this determination, the study engages the Augmented Dickey–Fuller (ADF) test on all variables, and the results indicate that each series is non-stationary at the level or in first difference.
Table 2 presents the results of the unit root analysis for all variables, using three models. Some variables are stationary at the level, while the remaining ones are in first difference. The variables of the first model are GDP per capita, BIOCAP, capital formation, labor force, urbanization, trade openness, methane (CH4) and renewable energy output. In this scenario, the GDP per capita, labor force, trade openness, CH4 and renewable energy output are stationary at the first difference, and the remaining variables are stationary at the level. The following Equations (4) and (5) explain how ADF analysis works econometrically:
Table 2.
Unit root analysis for stationary.
All variables employ the same econometric methods, such as those that assume the mean and variance remain constant. Without this analysis, the regression results could be spurious, meaning they might be significant even though there is no real connection. The null hypothesis posits that the series has a unit root, like a non-stationary series, whereas the alternative hypothesis posits that the series is stationary. Using the ADF test, we reject the null hypothesis, meaning the series is stationary and can be used in regression.
Furthermore, the second model’s variables are also stationary at both the level and the first difference; therefore, this model will utilize the ARDL technique, just as the first model did. Moreover, the third model’s variables are also stationary at the level and in first differences, with agricultural waste recycled stationary at the level. Finally, the variables are stationary at different levels, so all models will employ the ARDL technique to capture the long-run relationship.
For the generalized ARDL (p, q) model, the combined variables are some stationaries at the level and first difference. Here, the dependent variable is a function of its lagged values and the current and lagged values of other exogenous variables of the model. Here, p lags are used for the dependent variable, and q lags are used for the exogenous variables.
The long-run relationship is determined by the ARDL + bounds test.
So, the bound test established by Pesaran et al. [35] examines the long-run relationship between GDP per capita and exogenous variables. The null hypothesis is that there is no relationship, and the alternative hypothesis posits cointegration.
Alternative Hypothesis:
So, if F > upper critical value, that means rejecting H0 leads to cointegration.
If F < lower critical value, that means do not reject H0 leads to cointegration.
Table 3 shows the results of lag selection using the AIC. Results show that two lags are optimal for establishing a long-run relationship. The steric values indicate that two lags will be used for the ARDL approach. For the lag length of models 2 and 3, see Appendix A.1 and Appendix A.2. In ARDL, the choice of lag length is crucial because it determines how many past values of the dependent and independent variables are needed to capture the dynamic relationship. There are some criteria to choose the appropriate lags, such as Akaike Information Criterion (AIC), which chooses the lag length to minimize information loss, and this is used when we have a small sample size. The remaining criteria are the Schwarz Bayesian Criterion (SBC), which is more conservative, and the Hannan-Quinn Criterion (HQ), a compromise between AIC and BIC.
Table 3.
Lag selection criteria.
Table 4 shows the short-run and long-run ARDL estimates across three models. In the long run, the results suggest a positive and significant impact of capital formation and bioenergy production on GDP per capita. Moreover, the results are significant, suggesting that the use of renewable energy and increased investment in physical capital contribute meaningfully to higher per capita GDP. Renewable electricity output also shows a positive and strong impact of GDP per capita, emphasizing the importance of renewable energy. On the other hand, agricultural methane emissions yield negative, significant results, suggesting that environmental degradation imposes substantial economic costs. Therefore, the coefficients of labor force, urbanization and trade openness are statistically insignificant, indicating that they do not play a meaningful role in economic growth. Finally, error correction terms are negative and significant, indicating a strong long-term relationship among the variables and suggesting that approximately 4.9% of short-run disequilibrium is corrected each year.
Table 4.
Short-run and long-run ARDL estimates across three models.
The Error Correction Model (ECM), ECM (−1), captures the speed of deviation from long-run equilibrium and corrects the model in the short run. In all three models, the ECM coefficient is negative and significant, indicating that the dependent variable adjusts toward its long-run equilibrium after a shock. In the first model, GDP per capita is the dependent variable, with a value of −0.049, a t-stat of 2.29, and a negative sign indicating that the system is stable and the long-run model will be corrected over time. The magnitude is very small, such as 4.9%, suggesting that the adjustment will take too long; almost 5% of the disequilibrium is corrected in each period. The value of the second model is −0.890 with a t-value of 4.3, indicating a very rapid adjustment. The third model value is −0.18 with a t-value of 6.32, indicating a moderate speed of adjustment, so the long-run path will be settled gradually.
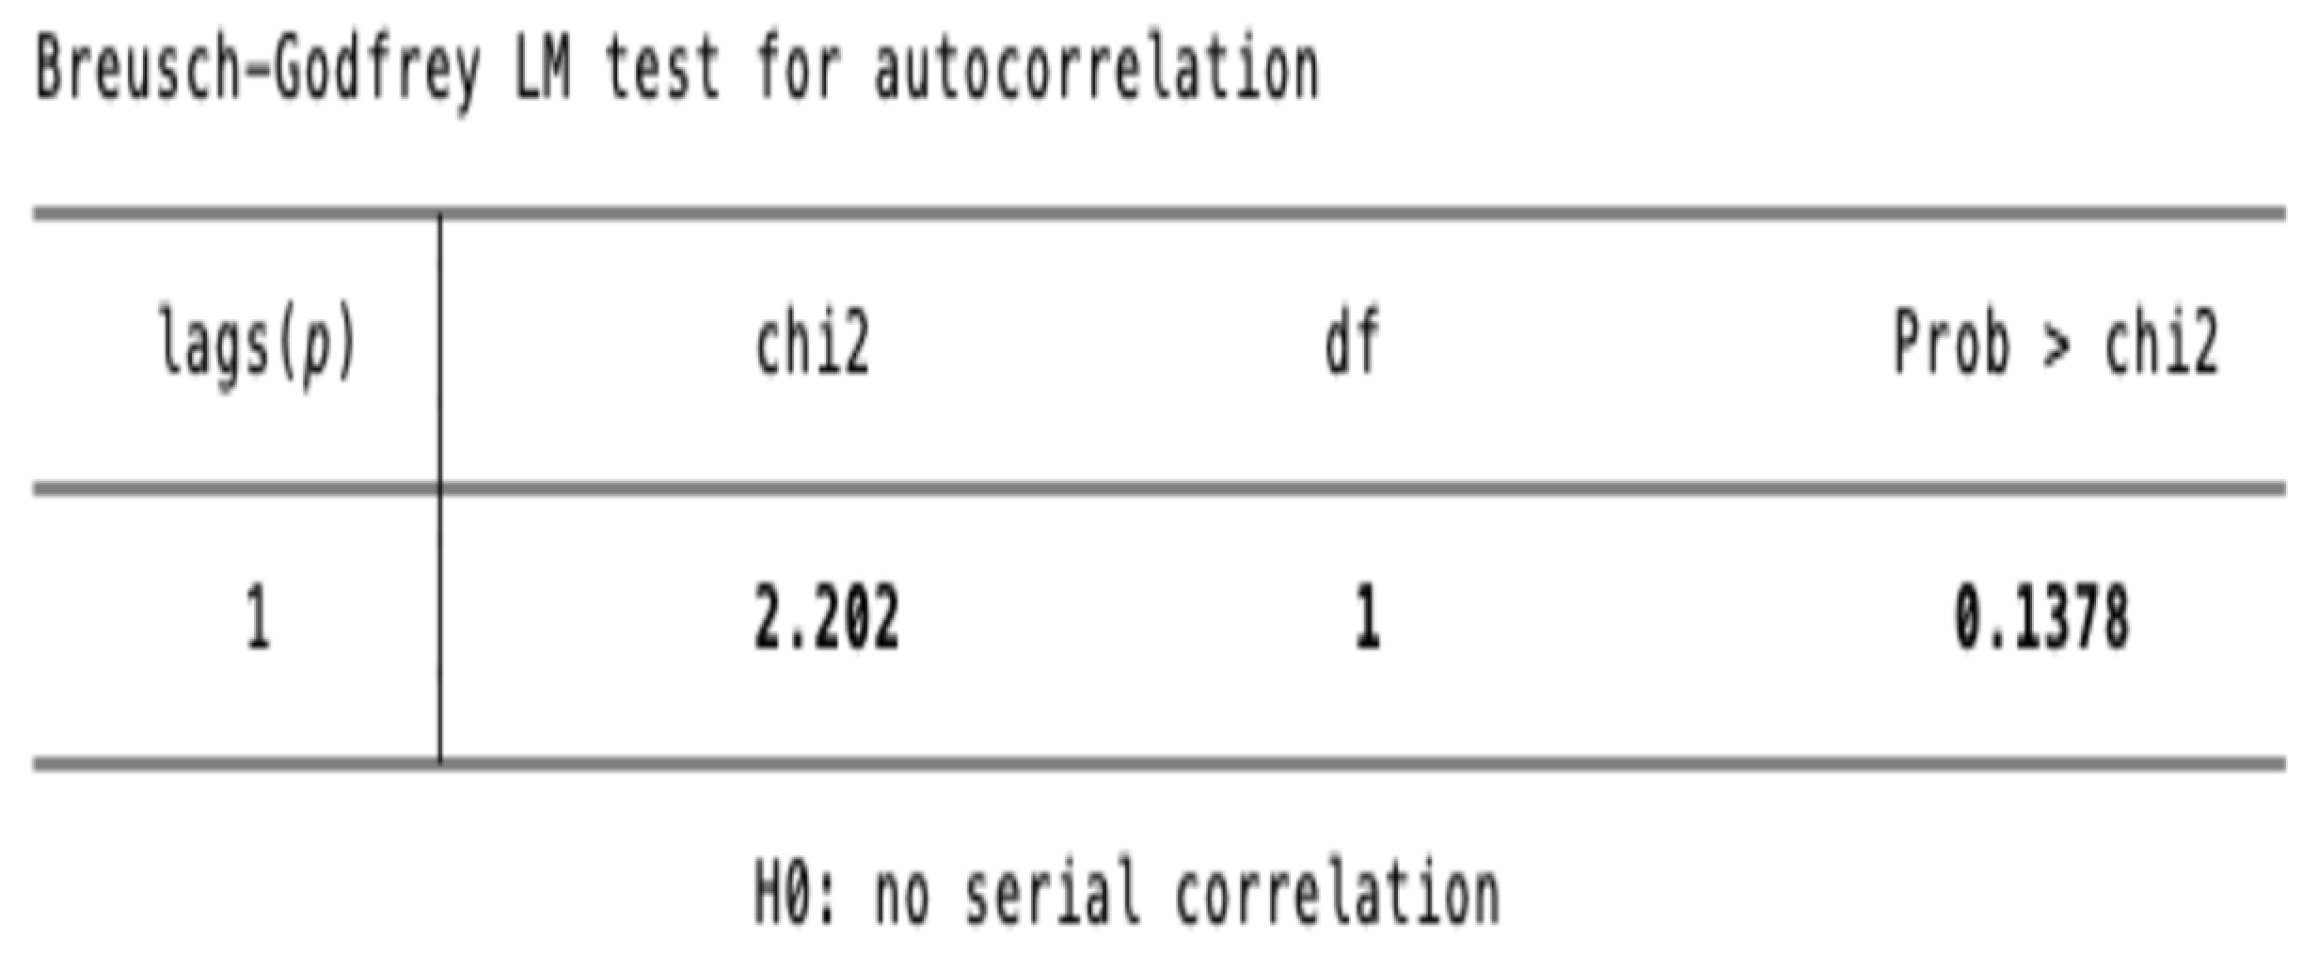
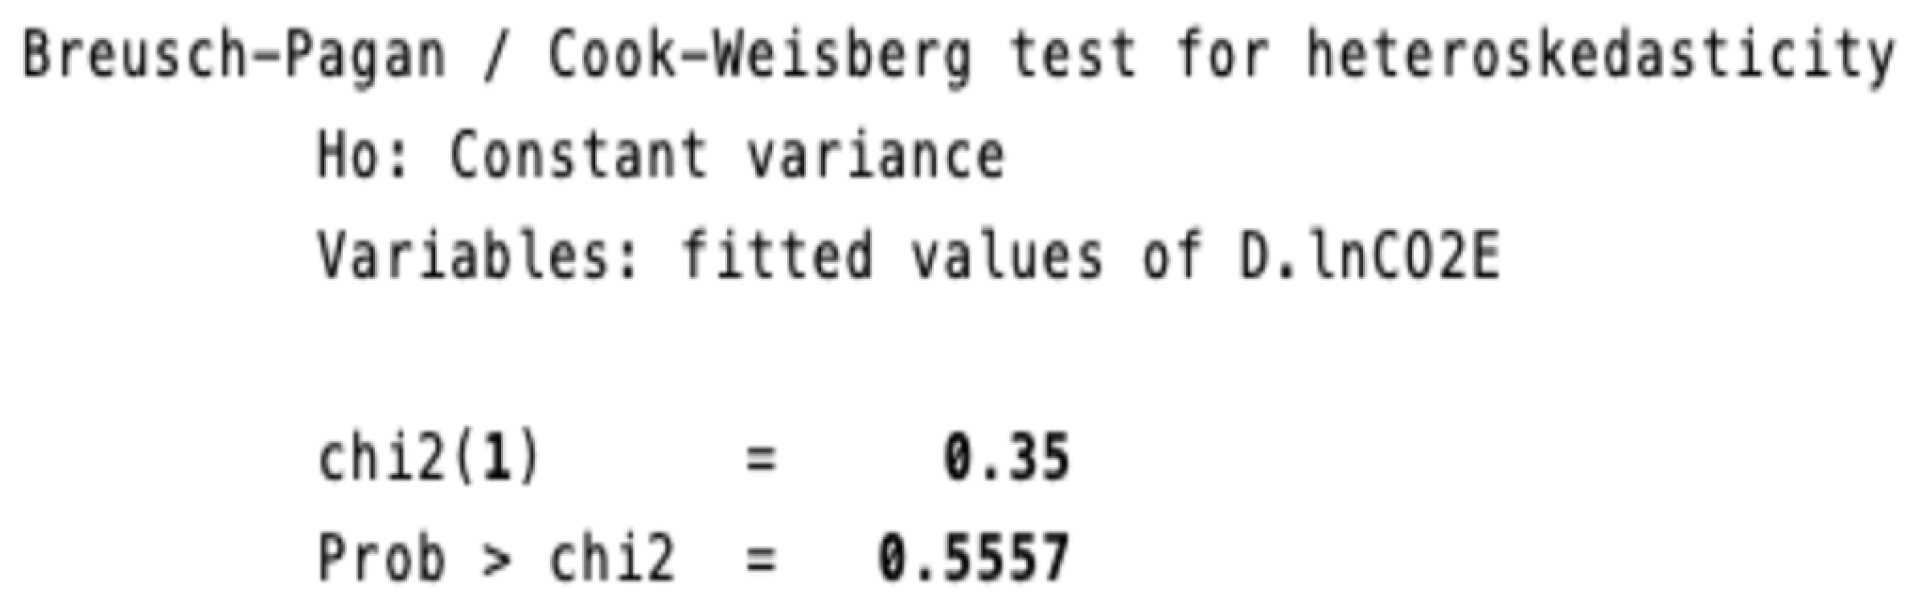
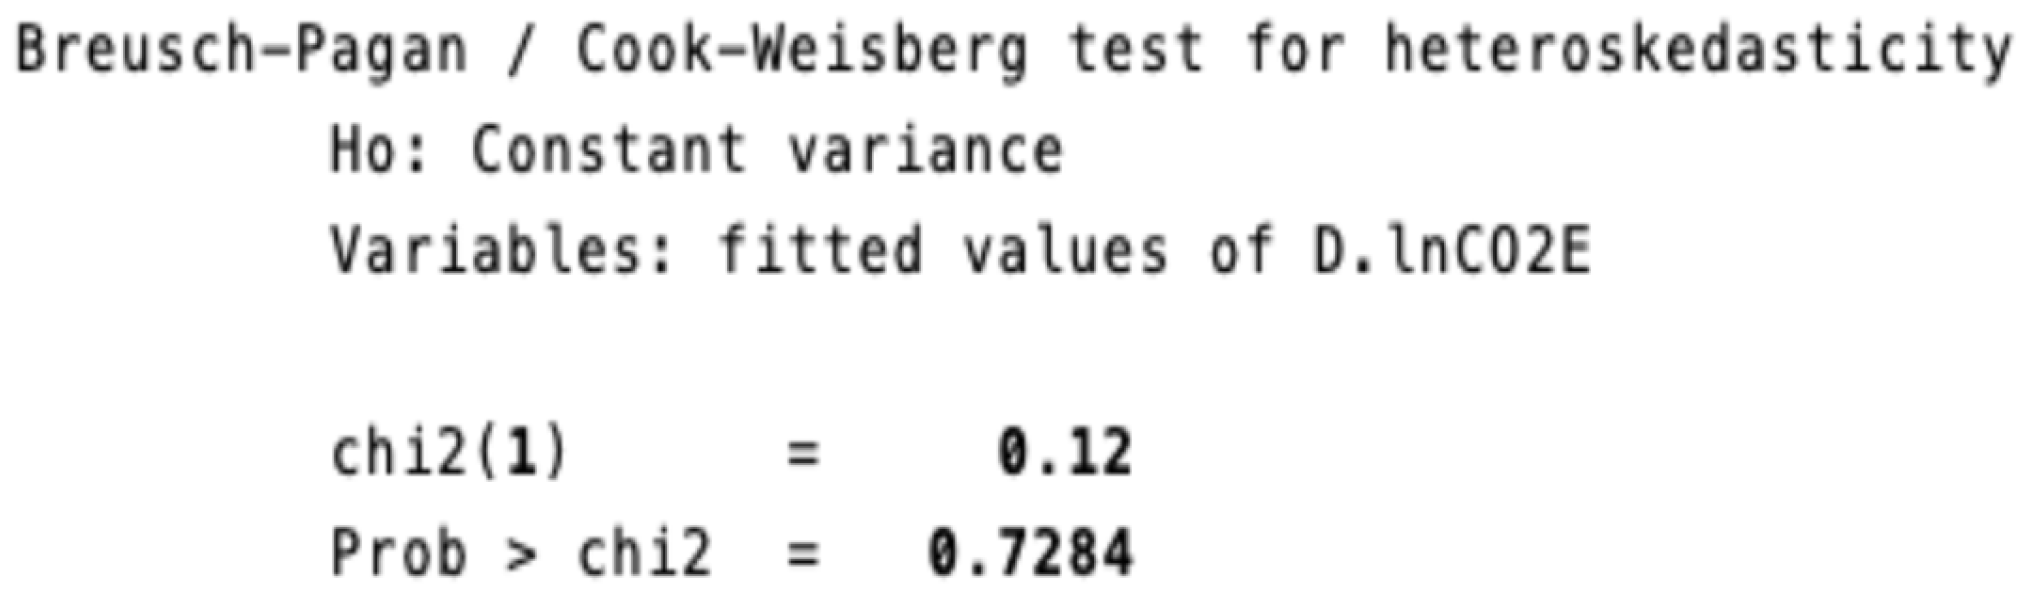
In light of this study, the focus is on expanding bioenergy and its impact on economic growth. The analysis conducted in Argentina suggests that higher production results in a direct increase in gross domestic product (GDP) of 4% and an indirect increase of more than 18% [36]. Most countries have focused on biomass production for industrial use, including bio-products [37]. To test for serial correlation and heteroskedasticity, different diagnostic tests are performed. For serial correlation, the Breusch–Godfrey LM, and for heteroskedasticity, the Breusch–Pagan tests were employed, indicating that no serial correlation or heteroskedasticity problems exist (see Appendix A). The results of the study align with the international literature, which illustrates the strength and importance of this study, such as [38,39,40].
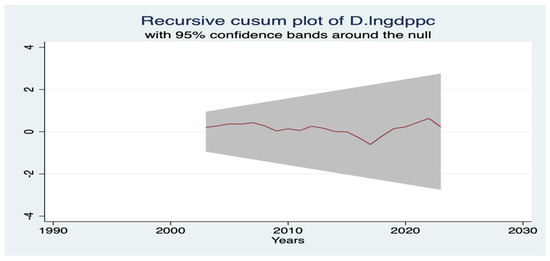
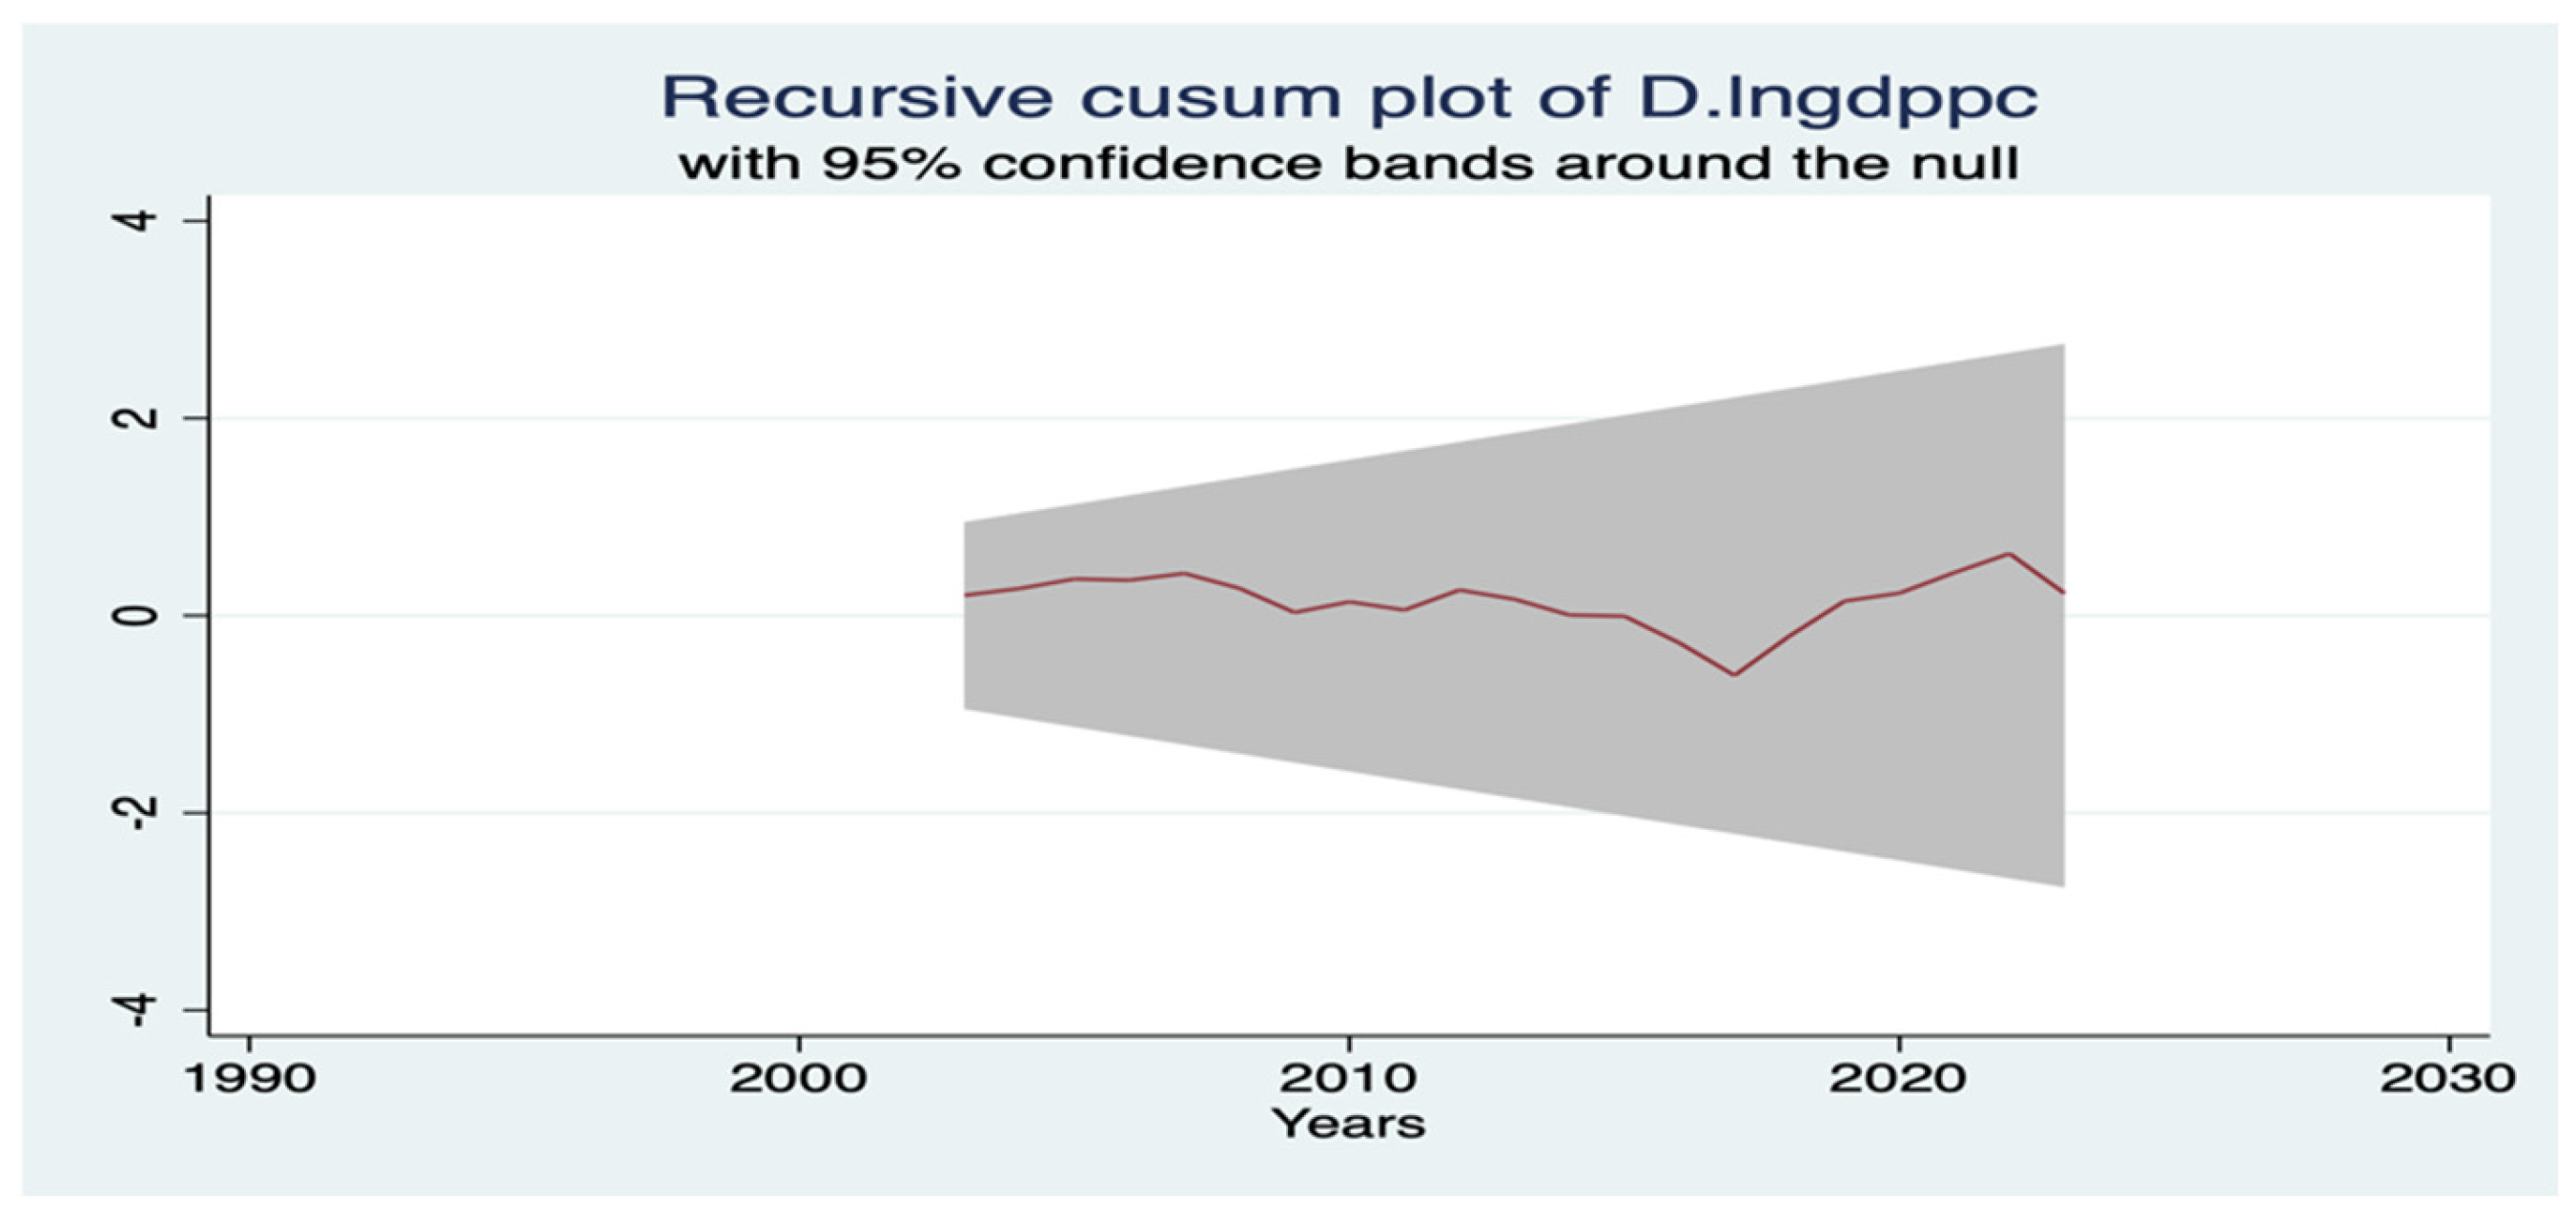
Figure 4 illustrates the cumulative sum of residuals from 1990 to 2023 for the first model, highlighting the fluctuations that occur over this period. The model suggests that it is structurally stable and capable of capturing the dynamic behavior of GDP per capita over time.
Figure 4.
Stability parameter.
The CUSUM test assesses the stability of the model, with the null hypothesis that there is no structural break in the data. Since the test value of 0.2899 is less than all critical values, we cannot reject the null hypothesis. The parameters are stable over time, and the estimated ARDL model is structurally reliable. The results indicate that the model is stable, meaning the relationship between GDPPC and other explanatory variables does not fluctuate over time. The solid line represents the cumulative sum of recursive residuals, and the shaded grey area denotes the 5% significance bounds.
Figure 5 illustrates the relationship between GDP per capita and CO2 emissions, where an increase in GDP per capita is accompanied by an increase in CO2 emissions, because current growth is largely dependent on fossil fuels.
Figure 5.
The environmental Kuznets curve.
The second model explains the impact of bioenergy production on carbon dioxide emissions, indicating a positive but insignificant effect of bioenergy on carbon emissions. Moreover, per capita GDP has a positive and significant impact on carbon dioxide emissions, while there is no relationship between renewable energy output and emissions; however, renewable energy consumption has a positive and significant relationship. Furthermore, urbanization contributes positively to carbon emissions, and forest area does not contribute much more to the reduction.
The third model treats CO2 emissions as the dependent variable, in which bioenergy production contributes almost nothing to carbon emissions. Moreover, there is a positive and significant impact of GDP per capita, along with a negative impact of renewable energy consumption, on carbon dioxide emissions, as the use of renewable energy contributes less to carbon emissions. Furthermore, the generation of agricultural residuals, the recycling of agricultural waste, and the combined impact of GDP per capita and bioenergy have no significant effect on carbon emissions. Different studies focused on bioenergy, such as [41,42,43].
As shown in Table 5, the F-stat value is 3.663, which is above the 5% I(1) bound of 3.50, which means we reject the null hypothesis that a long-run relationship exists. The ARDL bounds test indicates a long-run relationship among the variables. Results also indicate that cointegration is at 5% significance level. The F-statistic for model 2 is 7.659, which exceeds 4.26, indicating that we reject the null hypothesis and support the long-run result. The third model’s F-stat is 9.646, which is higher than 3.97, indicating rejection of the null hypothesis and validation of the long-run result.
Table 5.
ARDL bound test.
Overall, the ARDL bounds test results confirm the presence of long-run cointegration in all three models. The values of the first and second models exceed the upper bound from conventional significance levels, confirming the strong long-run relationships. Finally, the third model also has an F-statistic of 9.64, indicating robust evidence of long-run cointegration. Several studies have highlighted the importance of the ARDL and CUSUM methods for stability, as well as the ARDL bound test [44,45,46].
The results of the study confirm hypothesis 1, indicating a strong, positive relationship between GDP per capita and bioenergy production. Economic growth is the main pillar of society, and bioenergy contributes positively by fostering participation across all aspects, including the job market. Over time, the whole world will be working bioenergetically to increase economic growth and reduce the usage of fossil fuels. The results of the study indicate that competitiveness not only boosts bioenergy but also contributes to reducing global warming [41].
The results of the study also support this hypothesis, that higher bioenergy production leads to a reduction in per capita GDP in the long run. The significant negative coefficient suggests that increased bioenergy will mitigate environmental pressures from fossil fuel use and promote cleaner energy generation. One study supports these results, such as bioenergy deployment, in climate change mitigation [47].
The current study also supports this hypothesis that bioenergy moderates the effect of GDP on CO2 emissions. The interaction term between GDP per capita and bioenergy production is significant, but the magnitude is low; the results indicate that higher bioenergy output decreases the environmental impact of economic growth. The existence of a bidirectional causal relationship between bioenergy production and economic growth indicates feedback effects.
So, the key mechanism of connection begins with a higher GDP, which leads to high energy demand, where bioenergy supplements fossil fuels rather than replacing them to achieve a dominantly green effect. The results of the study suggest that the impact of bioenergy in Egypt is closely linked to the structure of the economy, particularly mechanisms related to land-use change emissions [48]. In Egypt, arable land is limited, and the ecological system is under pressure; therefore, this land conversion could release a significant amount of stored carbon. Beyond the direct impact, an indirect channel explains the positive linkage between bioenergy and GDP. Production of bioenergy from agricultural residues contributes to lower soil carbon emissions in other practices. An increase in income stimulates both energy and food demand, while bioenergy expansion intensifies competition for land and biomass resources.
5. Conclusions and Policy Recommendations
This study shows comprehensive results on dynamic linkages between bioenergy production. The study estimated three models related to environmental degradation, renewable energy, and economic output using the ARDL technique, as some variables are stationary at I(0) and the remaining variables are stationary at I(1). The first model treats GDP per capita as the dependent variable, and a positive impact of bioenergy on economic growth indicates that, in the future, renewable energy is likely to drive economic growth. Moreover, capital formation, renewable energy output, and methane emissions also show a positive and significant impact, but trade openness, labor force, and urbanization remain insignificant. Overall, the model’s findings support economic growth driven by renewable energy rather than fossil fuels.
The second model uses CO2 emissions as the dependent variable and GDP per capita as the independent variable. Results indicate that GDP per capita has a positive and significant impact on CO2, which suggests that current growth is largely driven by fossil fuels and requires reductions. Consequently, more investment should be directed towards alternative sources. Along with this, renewable energy consumption and urbanization have a positive and significant impact on carbon dioxide emissions. The results indicate a positive impact of GDP per capita but a negative impact of its squared term, supporting the environmental Kuznets curve (EKC) hypothesis. Initially, as income rises, CO2 emissions also rise, but beyond a certain level, as income increases, CO2 emissions decrease due to the adoption of cleaner technologies. Urbanization is a big challenge for economies because high population density leads to higher energy demand and creates problems for policymakers.
The final model also includes CO2 emissions as the dependent variable, and the independent variables are extended to include an interaction term between bioenergy production and GDP per capita. GDP per capita has a positive, statistically significant impact on CO2 emissions, whereas bioenergy and renewable energy have negative impacts. Based on the study’s findings, several suggestions are offered for policymakers who can benefit from this study and implement measures to improve society.
This study contributes to integrating environmental and economic perspectives within a unified empirical framework. Overall, three models cover the economic channel and environmental dimensions, offering a coherent and complementary contribution, such as the role of bioenergy in economic growth.
Therefore, policymakers should implement effective policies in favor of renewable energy and bioenergy that promote technological advancements, and the government should establish stringent regulations to achieve sustainable economic growth. These factors will promote economic growth through public–private partnerships and the use of low-carbon energy.
Author Contributions
A.A.R.: Conceptualization, Software, Validation, Formal Analysis, Data Curation, writing—original draft preparation; Y.L.: Resources, Project Administration, Visualization; M.Z.: Supervision, Project Administration, Funding Acquisition, visualization; A.M.M.: Writing—Review and Editing, Data Curation, Formal Analysis. All authors have read and agreed to the published version of the manuscript.
Funding
This research was funded by the Talented Young Scientist Program (TYSP) of the China Science and Technology Exchange Center (CSTEC), hosted by Biogas Institute of Ministry of Agriculture and Rural Affairs (BIOMA) (Grant No. P24R51025).
Institutional Review Board Statement
Not applicable.
Informed Consent Statement
Not applicable.
Data Availability Statement
The original contributions presented in this study are included in the article. Further inquiries can be directed to the corresponding author.
Conflicts of Interest
The authors declare no conflicts of interest.
Appendix A
Appendix A.1. Model 2
Table A1.
Lag selection criteria.
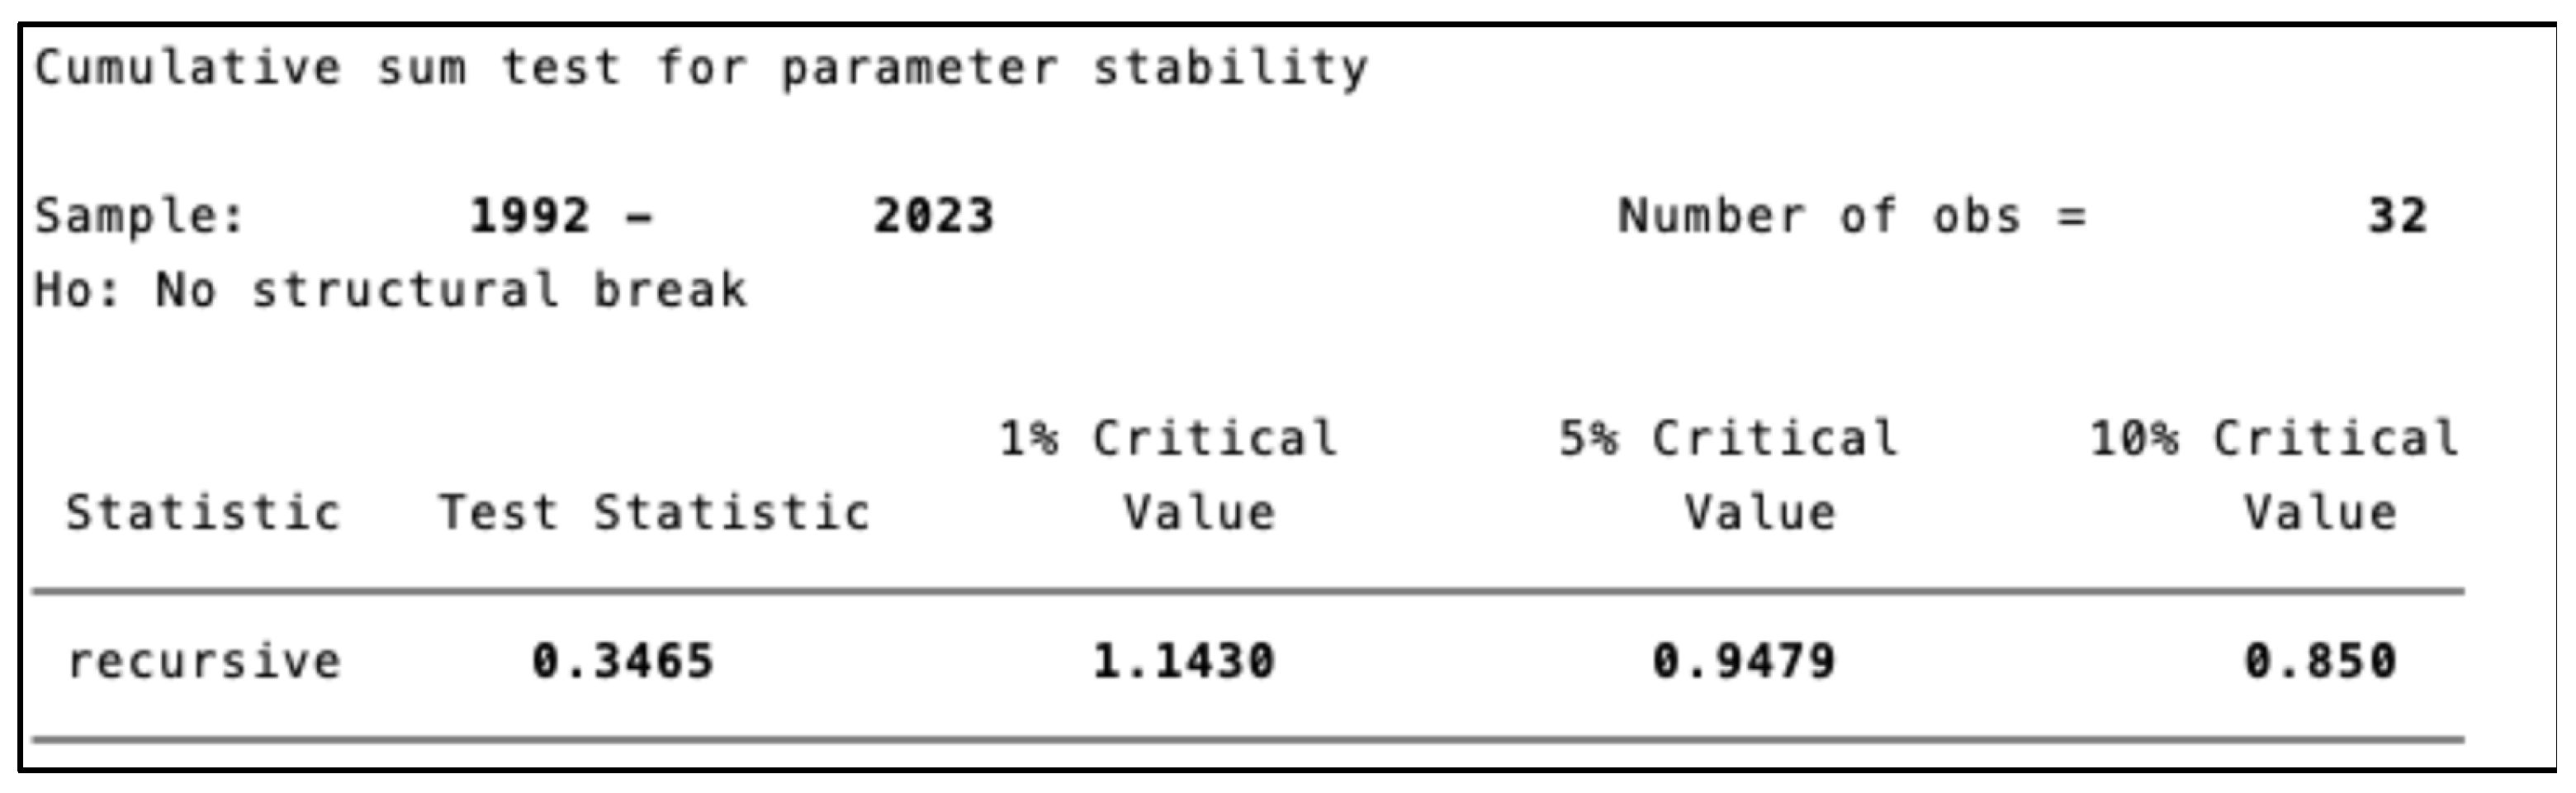
Figure A1.
Stability model.
Appendix A.2. Model 3
Table A2.
Lag selection criteria.
Appendix A.3
Figure A2.
Test for autocorrelation.
Appendix A.4
Figure A3.
Breusch-Pagan/Cook-Weisberg test of heteroskedasticity.
Appendix A.5
Figure A4.
Breusch-Pagan/Cook-Weisberg test.
References
- Ahmed, O.; Sallam, W. Studying the volatility effect of agricultural exports on agriculture share of GDP: The case of Egypt. Afr. J. Agric. Res. 2018, 13, 345–352. [Google Scholar] [CrossRef] [Scilit]
- Wu, Y.; Zhao, F.; Liu, S.; Wang, L.; Qiu, L.; Alexandrov, G.; Jothiprakash, V. Bioenergy production and environmental impacts. Geosci. Lett. 2018, 5, 14. [Google Scholar] [CrossRef] [Scilit]
- Busu, M. Assessment of the impact of bioenergy on sustainable economic development. Energies 2019, 12, 578. [Google Scholar] [CrossRef] [Scilit]
- Abubakr, H.; Vasquez, J.C.; Mahmoud, K.; Darwish, M.M.; Guerrero, J.M. Comprehensive review on renewable energy sources in Egypt—Current status, grid codes and future vision. IEEE Access 2022, 10, 4081–4101. [Google Scholar] [CrossRef] [Scilit]
- Hassaan, M.A.; Abdrabo, M.A.K.A.; Hussein, H.A.; Ghanem, A.A.A.; Abdel-Latif, H. Potential impacts of climate change on renewable energy in Egypt. Environ. Monit. Assess. 2024, 196, 268. [Google Scholar] [CrossRef] [Scilit]
- Said, N.; Alrowais, R.; Abdel-Daiem, M.M.; Mostafa, N.A. Bio-Waste to Bioenergy: Critical Assessment of Sustainable Energy Supply Chain in Egypt. Resources 2025, 14, 131. [Google Scholar] [CrossRef] [Scilit]
- Piccinetti, L.; Rezk, M.R.A.; Kapiel, T.Y.; Salem, N.; Khasawneh, A.; Santoro, D.; Sakr, M.M. Circular bioeconomy in Egypt: The current state, challenges, and future directions. Insights Reg. Dev 2023, 5, 97–112. [Google Scholar] [CrossRef] [Scilit]
- Abdel daiem, M.M.; Said, N. Assessment and contribution of biomass residues to renewable energy resources in Egypt. In Alternative Energy Resources in the MENA Region; Springer: Berlin/Heidelberg, Germany, 2022; pp. 345–372. [Google Scholar]
- Popp, M.; Grasu, S.; Popa, M.G. The impact of biomass production on economic growth at the EU level. West. Balk. J. Agric. Econ. Rural Dev. 2023, 5, 179–193. [Google Scholar] [CrossRef] [Scilit]
- Perišić, M.; Barceló, E.; Dimic-Misic, K.; Imani, M.; Spasojević Brkić, V. The role of bioeconomy in the future energy scenario: A state-of-the-art review. Sustainability 2022, 14, 560. [Google Scholar] [CrossRef] [Scilit]
- Güllü, M.; Acaroğlu, H. Bioenergy replacing fossil fuels and its role in global warming mitigation through climate change and economic growth in Turkey. In Microbial Biotechnology for Bioenergy; Elsevier: Amsterdam, The Netherlands, 2024; pp. 377–393. [Google Scholar]
- Zhu, J.; Fei, X.; Yin, K. Assessment of waste-to-energy conversion technologies for biomass waste under different shared socioeconomic pathways. Energy Environ. Sustain. 2025, 1, 100021. [Google Scholar] [CrossRef] [Scilit]
- Alfalih, A.A. Investigating the impacts of biomass energy consumption and natural resource rent on economic growth under various regimes in emerging economies. Environ. Sci. Pollut. Res. 2023, 30, 35698–35714. [Google Scholar] [CrossRef] [Scilit]
- Jiang, Z.; Mahmud, A.R.; Maneengam, A.; Nassani, A.A.; Haffar, M.; Cong, P.T. Non linear effect of Biomass, fossil fuels and renewable energy usage on the economic Growth: Managing sustainable development through energy sector. Fuel 2022, 326, 124943. [Google Scholar] [CrossRef] [Scilit]
- Kevser, M.; Tekbaş, M.; Doğan, M.; Koyluoglu, S. Nexus among biomass energy consumption, economic growth, and financial development: Evidence from selected 15 countries. Energy Rep. 2022, 8, 8372–8380. [Google Scholar] [CrossRef] [Scilit]
- Raihan, A.; Ibrahim, S.; Muhtasim, D.A. Dynamic impacts of economic growth, energy use, tourism, and agricultural productivity on carbon dioxide emissions in Egypt. World Dev. Sustain. 2023, 2, 100059. [Google Scholar] [CrossRef] [Scilit]
- Tucker, M. Carbon dioxide emissions and global GDP. Ecol. Econ. 1995, 15, 215–223. [Google Scholar] [CrossRef] [Scilit]
- Aldegheishem, A. The relationship between urbanization, energy consumption, economic growth, and carbon dioxide emissions in middle eastern countries: Saudi Arabia, Jordan and Egypt. Environ. Res. Commun. 2024, 6, 065011. [Google Scholar] [CrossRef] [Scilit]
- Asumadu-Sarkodie, S.; Owusu, P. Carbon dioxide emissions, GDP per capita, industrialization and population: An evidence from Rwanda. Environ. Eng. Res. 2017, 22, 116–124. [Google Scholar] [CrossRef] [Scilit]
- Aldy, J.E. Per capita carbon dioxide emissions: Convergence or divergence? Environ. Resour. Econ. 2006, 33, 533–555. [Google Scholar] [CrossRef] [Scilit]
- Mostafaeipour, A.; Bidokhti, A.; Fakhrzad, M.-B.; Sadegheih, A.; Mehrjerdi, Y.Z. A new model for the use of renewable electricity to reduce carbon dioxide emissions. Energy 2022, 238, 121602. [Google Scholar] [CrossRef] [Scilit]
- Asumadu-Sarkodie, S.; Owusu, P.A. The relationship between carbon dioxide emissions, electricity production and consumption in Ghana. Energy Sources Part B Econ. Plan. Policy 2017, 12, 547–558. [Google Scholar] [CrossRef] [Scilit]
- Marrasso, E.; Roselli, C.; Sasso, M. Electric efficiency indicators and carbon dioxide emission factors for power generation by fossil and renewable energy sources on hourly basis. Energy Convers. Manag. 2019, 196, 1369–1384. [Google Scholar] [CrossRef] [Scilit]
- Adu, D.; Jianguo, D.; Asomani, S.N.; Abbey, A. Energy generation and carbon dioxide emission—The role of renewable energy for green development. Energy Rep. 2024, 12, 1420–1430. [Google Scholar] [CrossRef] [Scilit]
- Durlauf, S.N.; Kourtellos, A.; Minkin, A. The local Solow growth model. Eur. Econ. Rev. 2001, 45, 928–940. [Google Scholar] [CrossRef] [Scilit]
- Solow, R.M. A contribution to the theory of economic growth. Q. J. Econ. 1956, 70, 65–94. [Google Scholar] [CrossRef] [Scilit]
- Romer, P.M. Increasing returns and long-run growth. J. Political Econ. 1986, 94, 1002–1037. [Google Scholar] [CrossRef] [Scilit]
- Lucas, R.E., Jr. On the mechanics of economic development. J. Monet. Econ. 1988, 22, 3–42. [Google Scholar] [CrossRef] [Scilit]
- Wackernagel, M.; Rees, W. Our Ecological Footprint: Reducing Human Impact on the Earth; New Society Publishers: Gabriola Island, BC, Canada, 1998; Volume 9. [Google Scholar]
- Barro, R.J. Inequality, Growth, and Investment; National Bureau of Economic Research: Cambridge, MA, USA, 1999. [Google Scholar]
- Barro, R.J.; Sala-i-Martin, X.I. Economic Growth; MIT Press: Cambridge, MA, USA, 2025. [Google Scholar]
- Henderson, J.V. Urbanization and the Geography of Development. World Bank Policy Research Working Paper. 2014. Available online: https://openknowledge.worldbank.org/server/api/core/bitstreams/d670576f-c058-5456-adbf-75957658d0b5/content (accessed on 10 October 2025).
- Grossman, G.M.; Krueger, A.B. Economic growth and the environment. Q. J. Econ. 1995, 110, 353–377. [Google Scholar] [CrossRef] [Scilit]
- Singh, S.; Singh, P.; Sharma, A.; Choudhury, M. Agriculture Waste Management and Bioresource: The Circular Economy Perspective; John Wiley & Sons: Hoboken, NJ, USA, 2022. [Google Scholar]
- Pesaran, M.H.; Shin, Y.; Smith, R.J. Bounds testing approaches to the analysis of level relationships. J. Appl. Econom. 2001, 16, 289–326. [Google Scholar] [CrossRef] [Scilit]
- Wicke, B.; Smeets, E.; Tabeau, A.; Hilbert, J.; Faaij, A. Macroeconomic impacts of bioenergy production on surplus agricultural land—A case study of Argentina. Renew. Sustain. Energy Rev. 2009, 13, 2463–2473. [Google Scholar] [CrossRef] [Scilit]
- Rutz, D.; Janssen, R. Socio-Economic Impacts of Bioenergy Production; Springer: Berlin/Heidelberg, Germany, 2014. [Google Scholar]
- Sikder, M.; Wang, C.; Yao, X.; Huai, X.; Wu, L.; KwameYeboah, F.; Wood, J.; Zhao, Y.; Dou, X. The integrated impact of GDP growth, industrialization, energy use, and urbanization on CO2 emissions in developing countries: Evidence from the panel ARDL approach. Sci. Total Environ. 2022, 837, 155795. [Google Scholar] [CrossRef] [Scilit]
- Kang, M.; Kang, S. Energy intensity efficiency and the effect of changes in GDP and CO2 emission. Energy Effic. 2022, 15, 8. [Google Scholar] [CrossRef] [Scilit]
- Mirziyoyeva, Z.; Salahodjaev, R. Renewable energy, GDP and CO2 emissions in high-globalized countries. Front. Energy Res. 2023, 11, 1123269. [Google Scholar] [CrossRef] [Scilit]
- Alsaleh, M.; Zubair, A.O.; Abdul-Rahim, A.S. The impact of global competitiveness on the growth of bioenergy industry in EU-28 region. Sustain. Dev. 2020, 28, 1304–1316. [Google Scholar] [CrossRef] [Scilit]
- Cîrstea, Ş.D.; Cîrstea, A.; Popa, I.E.; Radu, G. The role of bioenergy in transition to a sustainable bioeconomy—Study on EU countries. Amfiteatru Econ. 2019, 21, 75–89. [Google Scholar] [CrossRef] [Scilit]
- Şahin, B.; Aslan, S.; Ceylan, Z.D.; Karaoğlu, S.Y. Sustainability and socioeconomic impacts of bioenergy. Bioenergy Stud. Black Sea Agric. Res. Inst. 2021, 1, 37–42. [Google Scholar] [CrossRef] [Scilit]
- Alam, M.B.; Hossain, M.S. Investigating the connections between China’s economic growth, use of renewable energy, and research and development concerning CO2 emissions: An ARDL Bound Test Approach. Technol. Forecast. Soc. Change 2024, 201, 123220. [Google Scholar] [CrossRef] [Scilit]
- Deka, A.; Cavusoglu, B.; Dube, S.; Rukani, S.; Kadir, M.O. Examining the effect of renewable energy on exchange rate in the emerging economies with dynamic ARDL bounds test approach. Renew. Energy Focus 2023, 44, 237–243. [Google Scholar] [CrossRef] [Scilit]
- Usman, M.; Kousar, R.; Makhdum, M.S.A.; Yaseen, M.R.; Nadeem, A.M. Do financial development, economic growth, energy consumption, and trade openness contribute to increase carbon emission in Pakistan? An insight based on ARDL bound testing approach. Environ. Dev. Sustain. 2023, 25, 444–473. [Google Scholar] [CrossRef] [Scilit]
- Creutzig, F.; Ravindranath, N.H.; Berndes, G.; Bolwig, S.; Bright, R.; Cherubini, F.; Chum, H.; Corbera, E.; Delucchi, M.; Faaij, A. Bioenergy and climate change mitigation: An assessment. Gcb Bioenergy 2015, 7, 916–944. [Google Scholar] [CrossRef] [Scilit]
- Abdulrahman, A.O.; Huisingh, D. The role of biomass as a cleaner energy source in Egypt’s energy mix. J. Clean. Prod. 2018, 172, 3918–3930. [Google Scholar] [CrossRef] [Scilit]

Disclaimer/Publisher’s Note: The statements, opinions and data contained in all publications are solely those of the individual author(s) and contributor(s) and not of MDPI and/or the editor(s). MDPI and/or the editor(s) disclaim responsibility for any injury to people or property resulting from any ideas, methods, instructions or products referred to in the content. |
© 2026 by the authors. Licensee MDPI, Basel, Switzerland. This article is an open access article distributed under the terms and conditions of the Creative Commons Attribution (CC BY) license.