Abstract
This article examines the potential risk of impaired visibility for drivers caused by sunlight reflecting off the surfaces of PV panels installed within the right-of-way of motorways and expressways. A literature review was conducted to describe the current state of knowledge and identify the requirements applicable to this area. The procedures for measuring the reflective properties of PV panels using a goniophotometer and a luminance camera (imaging luminance measuring device—ILMD) were evaluated. The measurement results for three PV panels with different surface structures are presented, allowing the properties of PV panels to be determined in terms of their potential impact on driver safety. A computer application was developed to determine whether the sun’s rays will reflect off a photovoltaic panel’s surface toward a vehicle’s direction of travel. The application graphically displays information on whether the sun will be reflected in the direction of a moving vehicle and whether this reflection poses a threat to driver safety. A comprehensive procedure for assessing the risk of glare caused by sunlight reflecting off the surfaces of photovoltaic panels was developed, along with detailed requirements. This study supports sustainable development by promoting renewable energy deployment in motorway corridors while simultaneously ensuring road safety. It integrates environmental (renewable energy use), social (driver safety), and technical (quantitative glare assessment methods) dimensions of sustainability.
1. Introduction
The network of national roads, especially expressways and motorways, is developing rapidly in Poland. There is also a rapid development of RES (renewable energy sources) installations. Areas surrounding roads are good locations for such installations because they have the appropriate infrastructure and the owner has rights to the land along the road (right-of-way) [1,2]. The Polish government agency, the General Directorate for National Roads and Motorways, wants to use roadside locations, such as right-of-way areas, noise barriers, and rest areas, for RES installations.
The General Directorate for National Roads and Motorways (Polish: Generalna Dyrekcja Dróg Krajowych i Autostrad, GDDKiA) is the central authority of the national administration responsible for managing national roads and implementing the state budget in Poland. The Poznan University of Technology has received funding for a project entitled “Methods of obtaining and using electricity from renewable energy sources (RES) located in the road right-of-way.” The project is co-financed by the General Directorate for National Roads and Motorways (GDDKiA) and the Polish National Centre for Research and Development. The project aims to develop guidelines for a system that utilizes RES in all available technologies to generate and use electricity within the areas designated as road right-of-way by GDDKiA. The guidelines will take into account factors related to road traffic safety and environmental protection regulations. Locations that pose a risk of dazzling drivers with sun reflections or obstructing visibility will be excluded. Additionally, the project will address electricity generation, usage, and potential storage options, along with a technical and economic analysis of the proposed solutions. Since the project stipulates the need to assess the “risk of dazzling drivers with sun glare,” one of its tasks is to assess the risk of glare caused by light reflected from photovoltaic panels.
GDDKiA commissioned the study because Poland has not adopted requirements for assessing the risk of glare to drivers caused by solar reflection from PV panels. Furthermore, no clear guidelines or recommendations were found in the international literature. Furthermore, PV panel manufacturers do not always have technical data allowing for a clear determination of their reflective properties, which is essential for the assessment. The client also lacks an application that would allow for the design of such an installation. No commercial version of such an application was found to be available for purchase. Therefore, the following research objectives and tasks were defined:
- To review the literature on the issue of assessing glare caused by light reflecting off the surface of PV panels (Section 2). PV panels (photovoltaic panels), often just referred to as solar panels, are devices that convert sunlight directly into electricity.
- To create a laboratory setup and measure the reflectance characteristics of PV panels (Section 3).
- To create an application that allows for the verification of whether sunlight will be reflected from the surface of a PV panel towards a vehicle traveling on the road (Section 4).
- To develop a procedure for assessing the potential glare risk caused by sunlight reflecting off the surface of PV panels (Section 5).
2. Research Status
Assessing the potential hazards associated with glare and dazzle emitted by photovoltaic panels is a key element in ensuring air and road traffic safety. A flash can be defined as a momentary, intense reflection of light, while glare is a more continuous source of excessive brightness relative to the surrounding lighting [3,4,5].
The hazards associated with glare caused by PV panels primarily include [6]:
- Temporary inability to observe the road (e.g., short-term glare);
- Distraction of the driver (e.g., afterimages following an intense flash);
- Delayed reaction to road events, which may increase the risk of collisions or accidents.
In lighting engineering, glare is defined as an undesirable phenomenon that occurs in both artificial lighting, indoors and outdoors, and in daylight indoors. Designers should minimize glare in all cases. Glare is a condition in the visual process in which an observer may experience inconvenience, trouble, awkwardness (discomfort glare), a reduction in visual performance (disability glare), or the loss of observation (blinding glare). Discomfort glare is caused by excessively high luminance values of objects in the field of view and excessive luminance contrast between the observed object and the background. The mechanism of disability glare involves the scattering of high luminous flux values in the eye, creating a so-called haze luminance (veiling luminance) that reduces retinal sensitivity. It is believed that disability glare depends on the illuminance value at the observer’s eye surface. Reflection of light from PV panels can cause both phenomena. If the observer is farther from the potential glare source, discomfort glare is more likely to occur. At closer distances, as the illuminance value at the eye surface increases, disability glare is more likely to occur.
Several measures have been developed to assess glare. In artificially lit interiors, discomfort glare is assessed by calculating the UGR (unified glare rating) index [7]. For daylight, the DGP (daylight glare probability) measure has been developed [8]. For outdoor workplaces illuminated by artificial light, disability glare assessment, for example, the TI (threshold increment) measure, is used [9]. In all the above cases, to calculate the index determining the degree of glare, the following parameters must be determined:
- The vertical illuminance at eye-level [lx] or the luminance of the i-th glare source [cd/m2];
- The solid angle subtended by the i-th glare source [sr];
- The Guth’s position index of the i-th source in the visual field;
- Background luminance [cd/m2] (not determined for DGP).
It is important to note that, in most cases, the degree of glare is considered to depend on the degree of adaptation to the brightness of the environment. In addition, the methods developed assume that the glare source is in the field of view but not in the line of sight of the observer. The methods developed and mentioned above cannot be used directly to assess glare from sunlight reflected by PV panels.
Previous studies on the impact of glare from PV panels have primarily focused on health risks, such as the possibility of permanent retinal damage from prolonged exposure to intense light sources [10,11]. Although these issues remain important in the context of health protection, other mechanisms of impact are equally important in road and air transport. The most critical factor from an operational safety perspective is the short-term loss of vision caused by disability glare, a phenomenon in which visual sensitivity and contrast are reduced due to light scattering in the eyeball [12,13,14].
This type of glare does not usually lead to permanent changes in the structure of the eye but causes temporary disturbances in visual perception. The result is a deterioration in the ability to assess the situation, longer reaction times, and an increased risk of incorrect decisions by the driver or pilot. This phenomenon should be distinguished from discomfort glare, which is mainly associated with a feeling of discomfort and irritation but does not always cause a real reduction in visual ability [15].
Aviation literature (FAA, ICAO, and EASA) pays particular attention to the risk of glare for pilots during landing approaches, when reflections from photovoltaic panels, water reservoirs, or building facades can temporarily obscure the visibility of the runway and reference points [16]. This situation is relatively well defined, as both the runway location and the approach directions are known and can be clearly mapped in simulation analyses.
In the case of road transport, the problem is much more complex. The directions of vehicle movement and drivers’ lines of sight constantly change depending on the road geometry, driving speed, maneuvers performed, and traffic conditions. This means that potential sources of glare, such as light reflections from photovoltaic panels, glass facades, or road surfaces, can appear suddenly and unpredictably. This variability makes the analysis of glare in road traffic significantly more challenging than in aviation, thus requiring the use of dynamic risk assessment models that take into account various traffic scenarios and drivers’ visual perception [17].
The literature identifies two quantities responsible for the risk posed by light reflection from PVs:
- Irradiance on the retina [W/m2], which, depending on the value, can cause permanent eye damage, retinal burns, or temporary visual impairment, flash blindness, secondary images, and afterimages [6];
- Luminance of the observed surface [cd/m2], which is used to describe phenomena such as impaired vision or distraction from the object of observation [18,19].
The value of the irradiance on the corneal surface depends on:
- The size of the glare source;
- The diameter of the pupil;
- The transmittance coefficient of the eye.
If we assume average values for the irradiance on the Earth’s surface (DNI—direct normal irradiance of 1000 W/m2) and the subtended sun angle size of 9.4 mrd, then looking directly at the sun, the irradiance on the retina will be 8 W/cm2. When looking at objects with very high luminance (such as the sun), we instinctively look away or close our eyes. The typical blink response time is assumed to be 0.15 s. With this observation time, an irradiance of 8 W/cm2 will cause an afterimage [12,13,14]. This value is below the threshold for permanent eye damage caused by retinal burn [5,10,11]. A change in the impact on the eye (greater or lesser) occurs when the irradiance and subtended source angle change. A greater risk will occur in concentrating solar power plants, which can increase irradiance and the subtended source angle. The reflection of sunlight from a flat PV panel surface will reduce the impact.
The second variable taken into account when assessing the impact of light reflected from the PV surface is luminance. There are established requirements for the luminance limits of light sources to reduce glare. These requirements are related to the design of indoor or outdoor lighting. They assume different values for both the luminance of light sources and the background luminance, which affects the adaptation process. In addition, high luminance values of various objects along the road not only pose a risk of glare or blindness but also affect drivers’ performance. Research has shown the impact of roadside advertisements, in particular electronic LED billboards, on drivers’ visual performance [17]. Driver distractions and reduced reaction time to sudden events on the road have been observed. Another problem is the direction from which a high-luminance object is visible. High-luminance devices should not be installed in the direction of vehicle traffic or in the directions where drivers typically look to observe other vehicles or other traffic participants.
There are no clear requirements regarding the limitation of luminance during the day for objects located along roads. Studies conducted on digital billboards mainly focused on determining the luminance limit values for nighttime conditions. It is obvious that the luminance of digital billboards should be limited, especially at night. However, several recommendations exist regarding the luminance of digital billboards during the day. In the USA, depending on the city and state, luminance limits range from 2.5 × 10³ cd/m2 to 5 × 10³ cd/m2 [20]. A team from Poznan University of Technology set the limit at 5 × 10³ cd/m2 [17]. Based on these requirements, the Polish Ministry of Infrastructure adopted a draft regulation setting the limit at 4 × 10³ cd/m2 (the draft has not yet been approved).
The European Union Aviation Safety Agency has determined that the maximum permissible PV luminance in airport areas is 2 × 10⁴ cd/m2 [19]. No justification for this value was provided. In a report by the German Commission for Radiation Protection on Glare [21], glare is described as a situation in which the intensity of incident light is so high that the human eye cannot adapt to it and the person experiences blindness. In practice, it is assumed that the critical luminance leading to this effect is approximately 1.6 × 10⁵ cd/m2. However, at certain luminance contrasts, levels of around 104 cd/m2 can cause similar reactions [22]. In other countries, although glare is also a concern, no clear luminance thresholds have been defined [23]. Previous studies have questioned the validity of existing glare assessment criteria [24]. Nevertheless, the threshold value given in [21] is commonly used in the literature on this subject [18]. Other studies based on the above-cited literature assume slightly different luminance thresholds, which can result in glare ranging from 5 × 10⁴ to 105 cd/m2 [25]. It is known that the degree of glare depends not only on the luminance value of the glare source but also on the luminance of the surroundings and the process of adaptation of the eye to a given level of brightness in the surroundings. The above recommendations regarding the luminance value of the glare source do not take into account the influence of the surroundings’ luminance on glare.
An analysis of the literature shows that several luminance values are given that can cause glare in outdoor areas. The levels given are (A) 104 cd/m2, (B) 2 × 10⁴ cd/m2 and (C) 1.6 × 10⁵ cd/m2. Moreover, we believe that the luminance limit values for electronic LED billboards (ranging from 2.5 × 10³ to 5 × 10³ cd/m2) should not be adopted for installations with flat PV panels. Electronic LED billboards usually have large surface areas, while the image of the sun’s luminance reflected from PV panels is much smaller.
The luminance of the sun’s surface can reach values of around 1.6 × 10⁹ cd/m2. The reflective properties of PV panels determine both the luminance value seen by the observer and the irradiance value on the surface of the eye.
Another factor taken into account is the angular distance of the potential glare source from the direction of observation. The further away the glare source is from the direction of observation, the lower the risk of glare. This is a well-known phenomenon used in determining glare assessment methods. For discomfort glare, the Guth index is used, and for disability glare, the angle between the direction of observation and the glare source is used directly [7,9]. In a study using a flight simulator, pilots were exposed to glare sources during the landing approach at angles of 0, 25, 50, and 90 degrees from the approach line. It was noted that if the glare source is located at a distance greater than 25 degrees, it does not pose a threat to the pilot’s safety on approach to landing [26].
There are known examples of PV panels being used on roadside noise barriers. However, the results of studies are contradictory [27,28,29]. In Australia, drivers complained of glare caused by PV panels tilted at 60 degrees. The panels were covered with an anti-reflective film, which reduced their efficiency in generating electricity. In another location in Australia, complaints from drivers led to the dismantling of the PV panel installation. The German road authority, on the other hand, concluded that PV panels installed behind safety barriers do not cause glare or distract drivers. In the Netherlands, the road authority is looking into this issue and has not issued any recommendations.
One way to reduce glare is to cover PV panels with anti-reflective coatings. New technologies reduce light reflection without affecting energy production efficiency [30,31,32]. However, light reflection is measured at normal incidence [31]. As the angle of incidence increases, reflection increases rapidly [32]. This is a normal phenomenon resulting from the reflection of light at the boundary between two media with different refractive indices. If light is reflected at a greater angle, anti-reflective coatings cannot effectively reduce reflection. Glasses with a strong, structural surface may be better, as their light-scattering effect is more effective than that of anti-reflective coatings [33].
3. Measurement of the Reflectance of Photovoltaic Modules
For non-ideal (directional-diffuse) reflection, due to the influence of the direction of light incidence on the reflection characteristics, it is not possible to define a single reflection coefficient value (for example, reflectance). For such materials, the reflection is presented in the form of a scattering indicatrix, either as a single graph or as a set of graphs showing, for example, the change in luminance or luminance coefficient for different angles of light incidence within the accepted range of observation angles (Figure 1). Most PV panels are made from this type of material.
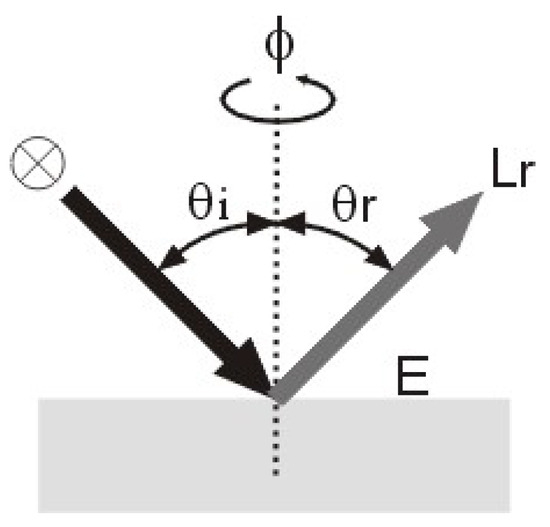
Figure 1.
Illustration of angles in the measurement of luminance coefficient: —angle of incidence of light, —angle of observation, —azimuth angle, —luminance of a surface element, —illuminance on that surface.
Very often, the scattering indicatrix is described using the definition of the luminance coefficient (1), which is the ratio of the luminance of a surface element in a given direction to the illuminance on that surface .
The function derived from luminance measurements is also known as the bidirectional reflectance distribution function (BRDF) [18,33,34]. Accurate measurement of the full BRDF characteristics requires the use of complex and very expensive equipment [35,36,37]. Examples of simpler devices for performing measurements in the laboratory or field can be found in [38,39]. For the purposes of this work, a measuring device was constructed from components already in the authors’ possession (Figure 2). These devices should be part of the equipment of every photometric laboratory. The laboratory setup was constructed from the following components:
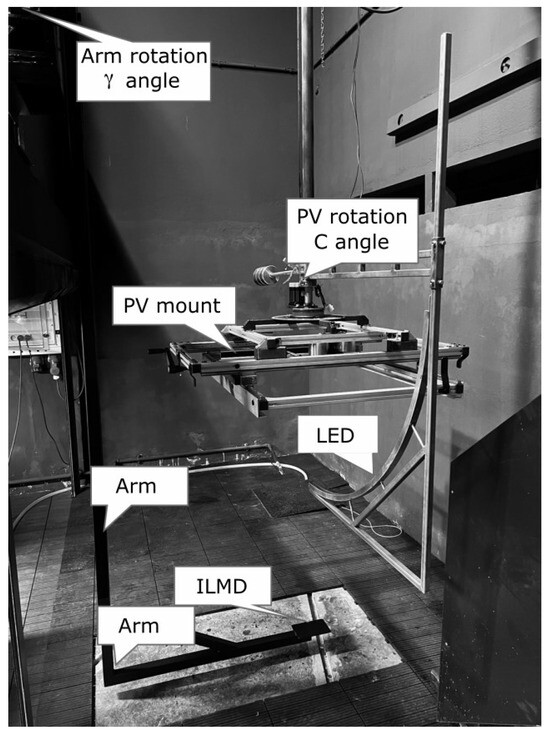
Figure 2.
Laboratory station for measuring luminance coefficient.
- A goniometer with a movable arm was placed in a C-y configuration (C-planes—vertical measurement planes around the fixture; γ (gamma) angle—elevation angle from the vertical axis). The arm length was 2.5 m.
- A luminance camera (ILMD) was mounted at the end of the arm. The device used was a LMK 98-4 Techno Team (Ilmenau, Germany) camera with a CCD Sony DX4 sensor 1360 (H) × 1040 (V) pixels, 12-bit resolution with a full-size filter matched to the V(λ) function for measuring luminance and a 25 mm focal length lens.
- A strip of controllable LEDs (LED5050, 144 per meter, SK6812 RGBW, BTF-Lighting, Shenzen, China) was placed in a quarter-circle-shaped aluminum profile with an 80 cm radius. The illumination of each subsequent diode changes the angle of incidence of light by 0.5 degrees. The size of the luminous surface of the light sources used corresponds to the angular size of the solar disk.
- A holder (PV mount) was placed to secure the PV panel in position with the active surface facing down.
Light is partially or completely polarized upon reflection from a smooth dielectric surface. Our research did not take into account light polarization because we assumed that the observer (the human eye) does not react to polarized light. Photoreceptors (cones and rods) respond to light intensity and wavelength but do not analyze the direction of electric field vibrations. Polarized and unpolarized light of the same intensity appear virtually identical to humans. Though the examination of light polarization degrees is beyond the scope of this article, it offers potential for future research. If partially polarized light reaches the observer after reflection from PV panels, it can be reduced with a polarization filter (polarizing sunglasses or a polarizing filter on a car windshield). A car windshield can also change the perception of the road and surroundings, but we did not include it in this research; its inclusion may be the subject of further research.
Technically advanced devices [35] determine the luminance coefficient q using radiometric spectral values. Then, the unit of this quantity is reduced to sr−1. In the simplified method presented in this article, photometric quantities, illuminance in lux, and luminance in cd/m2 were measured. To emphasize this assumption, the unit of the luminance index is cd/m2 lx.
Luminance coefficients were measured for the following PV panels (Figure 3):
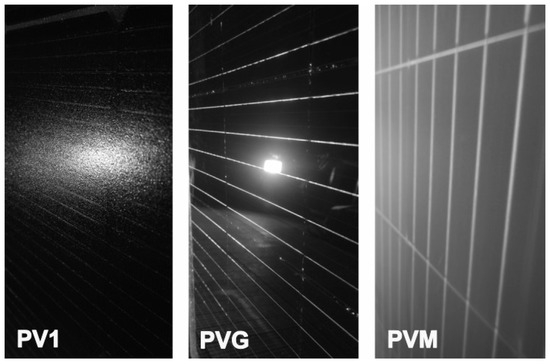
Figure 3.
Photos of PV panels whose reflective characteristics were measured.
- PV1—PV panel used to build the test installation; the PV1 panel has a glass surface with a certain degree of roughness.
- PVG—PV panel covered with glass with a smooth surface.
- PVM—PV panel covered with glass with a matt surface.
The use of an imaging luminance measuring device (ILMD) to measure the luminance coefficient is a new idea, although such attempts have already been made [38]. Using ILMD, it is possible to observe the recorded luminance image reflected from the PV panel surface (Figure 3). This allows for control of the shape and position of the surface from which the average luminance is calculated. Two versions of the shape of this surface were considered. In the first version, the average luminance value was calculated from a circular surface covering the cone angle at 2 degrees, 1 degree, and 0.5 degrees. After analyzing the first series of measurements, it was decided that the cone angle would be limited to 0.5 degrees and 0.25 degrees (Figure 4).
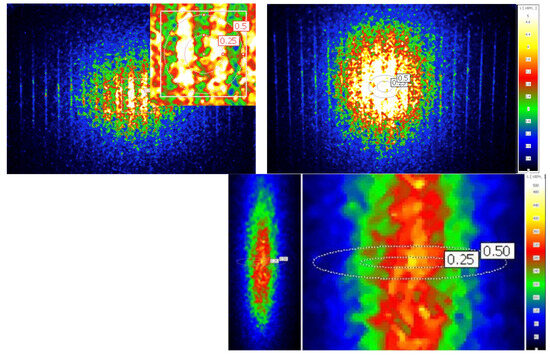
Figure 4.
Luminance distribution on the surface of the PV1 panel for an angle of incidence equal to the angle of observation for angle values, from left to right, of 10°, 45°, and 80°. Two figures have been enlarged (10° and 80°) to show the ellipses marking the luminance measurement field.
The field of view of the standard luminance meter is cone-shaped. When the observation angle is zero, the intersection of the cone with the plane forms a circle. When the observation angle increases, the intersection of the cone with the plane will form an ellipse. The surface area of this ellipse will increase as the observation angle increases. This means that the luminance measurement field on the surface of the PV panel will continue to increase over time. It was assumed that the luminance measurement field would remain the same at all times. Therefore, for observation angles greater than zero degrees, the measurement area will be elliptical. However, the size of this ellipse will decrease. The major axis of the ellipse will decrease with the cosine of the observation angle, while the minor axis will remain constant.
Ultimately, the results were determined for ellipses with a cone angle of 0.25 degrees. This angle is small enough to capture changes in maximum luminance and large enough that the surface roughness does not affect the result. Examples of the luminance images obtained for the PV1 panel for different viewing angles and angles of incidence (10°, 45°, and 80°) are shown in Figure 4.
Please note that the figure showing the measured luminance distribution for an angle value of 80° has a different scale. As the angle of incidence increases, the luminance value also increases. For viewing angles varying near the angle of incidence of light, the changes in luminance are usually very large. For this reason, a variable observation angle step was used when performing the measurements:
- ;
- ;
- .
Figure 5 shows three luminance coefficient curves for the PV1 panel. The curves were determined for three angles of incidence: 10°, 45°, and 80°. It is clear that as the angle increases, the maximum luminance value also increases. This is because the total and directional reflectance increase. This increase is not clearly visible between angle values of 10° and 45°; it can only be observed at an angle of 80°. To show the luminance values and the differences between the graphs for angles of 10° and 45°, a second figure with a different scale on the vertical axis is presented.
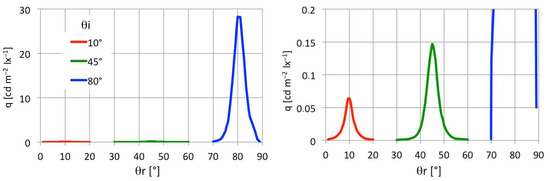
Figure 5.
Luminance coefficient of PV1 panel, angles of light incidence 10°, 45°, and 80°.
Figure 6 shows the luminance coefficient values at the peak of the curve for a given angle of incidence . These values were measured by setting the luminance meter at an incidence angle equal to the observation angle . This graph shows how the maximum luminance changes with the angle of incidence. An analogy can be seen in the expected change in reflectance and in Figure 5.
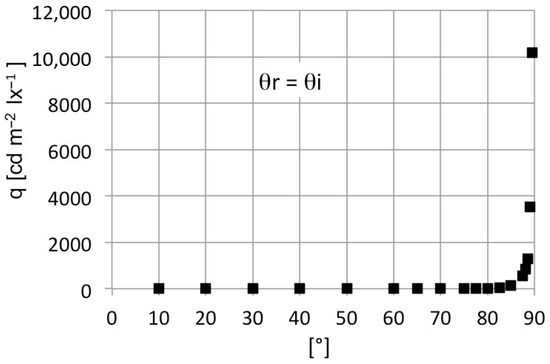
Figure 6.
PV1 panel. Change in maximum luminance (luminance coefficient peak) with a change in the angle of incidence of light.
For panel PV1, measurements were also taken at the azimuth angles (Figure 1) of 30° and 45°. However, no significant differences in the results were observed. Changing the angle required rotating the panel around the Z axis.
Figure 7 shows the luminance coefficient curves for the PVG panel at three angles of incidence: 10°, 45°, and 80°. The full width at half maximum (FWHM) of these curves is clearly smaller than for the PV1 panel. This is because the directional reflection component is greater from a smooth glass surface than from a rough surface (PV1). In this case, the width of the curves depends on the angular size of the light source. As before, the maximum luminance value increases with increasing light incidence angle. However, the maximum luminance value is significantly higher.
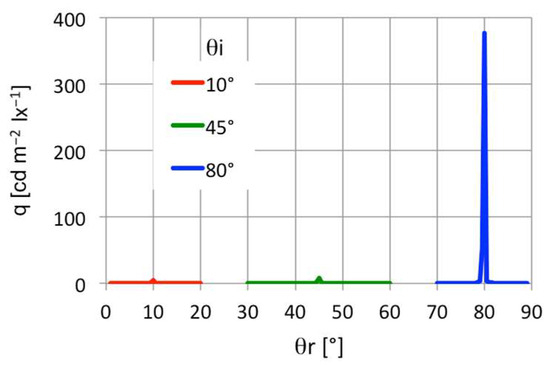
Figure 7.
Luminance coefficient of PVG panel for angles of light incidence of 10°, 45°, and 80°.
Figure 8 shows luminance graphs for a PVM panel at angles of incidence of 10°, 45°, and 80°. The large difference in luminance values between these curves makes it necessary to present an additional figure with a different vertical-axis scale.
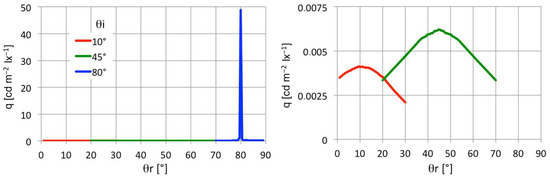
Figure 8.
Luminance coefficient of PVM panel for angles of light incidence of 10°, 45°, and 80°.
The full width at half maximum (FWHM) of these curves is clearly greater. The predominant share of the diffuse component is visible. The maximum luminance value is relatively small, which is due to diffusion through the frosted glass surface. The increase in luminance for a light incidence angle of 80° may seem surprising/unexpected. It can be observed that as the angle of incidence increases, the directional component of reflection increases significantly, exceeding that for the PV1 panel. This is a valuable observation because even for panels with a frosted surface, there is a risk of glare when the angle of incidence of sunlight is large (above 80°), approaching the tangent of the PV panel’s surface. Figure 9 shows the changes in maximum luminance measured for observation angles equal to the angles of incidence.
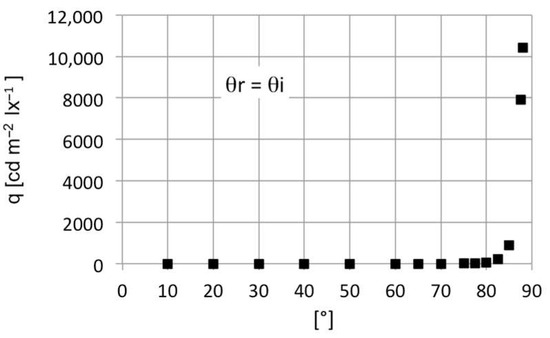
Figure 9.
PVM panel. Change in maximum luminance (luminance coefficient peak) with a change in the angle of incidence.
Measurements were taken for three PV panels with different surface finishes. These three PV panels were considered for use in a pilot installation built to test the solutions. Panel PV1 is an example of a panel with a rough surface structure, which is most often chosen for RES installations. We did not have access to PV panels with anti-reflective coatings. Performing measurements for this type of panel would be interesting but would not provide any new information. Based on a literature review, even panels with anti-reflective coatings exhibit high reflectance values at angles of incidence exceeding 70 degrees [30,31,32]. At such large angles of incidence, panels with anti-reflective coatings exhibit similar reflectance properties to panels without these special coatings. Our contribution to knowledge of the reflectance properties of PV panels is the demonstration that, regardless of surface finish (even on a matte surface), reflectance increases dramatically at angles of incidence above 70 degrees.
We believe that presenting the reflective characteristics of PV panels using the luminance coefficient (BRDF) is a good idea. Knowing the value of the luminance coefficient, it is sufficient to multiply it by the illuminance value for a given position of the sun and the position and angle of inclination of the PV panel to obtain the luminance value of the PV panel surface in the direction of the observer. Table 1 summarizes the maximum luminance index values for the three panels tested at incidence angle values of 10, 45, 80, and 85 degrees, along with the corresponding luminance values. To calculate the luminance value, it was assumed that the sun is capable of producing 100,000 lx on the Earth’s surface.

Table 1.
Luminance coefficient q and luminance values for three PV panels for a solar illuminance of 100,000 lx on the Earth’s surface. The table shows the luminance coefficient values that occur at an observation angle equal to the angle of incidence, .
The luminance values presented in Table 1 are maximum values. If, at a given location during a specific time of year and day, the sunlight intensity is lower, the luminance value of the PV panel will also decrease. Analyzing the figures presented and the luminance index value from Table 1, it can be concluded that:
- As the angle of incidence of light increases, the luminance coefficient and luminance value increase;
- This relationship applies to all PV panels regardless of the type of surface;
- Even for a PVM panel, which has a matte surface, the luminance coefficient begins to increase rapidly above an angle of 70°;
- The lowest luminance limit (A), 104 cd/m2, will be exceeded for PV1 for a reflection angle greater than 45°, for PVG for any angle, and for PVM for a reflection angle greater than 72°;
- The maximum luminance limit (C) 1.6 × 10⁵ cd/m2 will be exceeded for PV1 for a reflection angle greater than 73°, for PVG for any angle, and for PVM for a reflection angle greater than 77°.
4. Application Software
The computer application PVSunReflection v 1.0 allows verification of whether the sun’s rays will be reflected from the photovoltaic panel’s surface toward the vehicle’s direction of movement. It allows the designer to check whether the photovoltaic panels installed in a given location (for a specific longitude and latitude) and position (specific height and tilt angle) and at the position of the sun (for successive days, hours, and minutes of the year) will experience direct reflection of the sun.
The calculations performed in the application allow the determination of whether, for a specific location of the sun at the observation point on given days, hours, and minutes, there will be a directional reflection to the observer throughout the year. All coordinates determining the location of PV panels, including their inclination, location, and direction of observation, are obtained by the program member from editable *.csv files. This solution allows data to be entered not only through the program’s graphical interface but also from external sources, e.g., a geographic information system (GIS). Following the calculations, a result file is generated containing the days/hours/minutes during the year when sunlight reflects directionally off the PV panels towards the observer. Additionally, this file includes a graph that visually presents these results.
The application is supplemented by a graphical interface that allows the user to graphically define (on satellite/tile maps) the location of PV panels, along with their inclination and the geographical data of observers. Users can then save this generated data into the previously discussed .csv files and launch the main part of the application for calculations. The application is deliberately divided into an executive module and a graphical module. The former loads input data from the PV.csv and observer.csv files to perform calculations based on data obtained from an external source, e.g., GIS software. This module performs the following operations:
- Calculates the position of the sun for the specified location;
- Reads data from batch files (PV.csv, observer.csv);
- Converts WGS84 geographic coordinates to UTM (world coordinates specified in meters);
- Performs calculations of the geometry of the system to determine if and when there is a directional reflection towards the observer;
- Generates the result file date_time.csv;
- Graphically presents the obtained calculation results.
The graphical module, whose interface is shown in Figure 10, displays an OpenStreetMap. The user sets the position of the PV module base, its height, and its tilt. After clicking the SavePV.csv button, the data is saved to the PV.csv file, which is necessary to perform the calculations of the executive unit. A similar procedure applies to the observer’s location data.
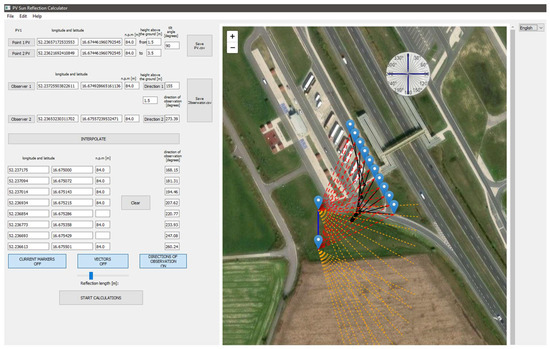
Figure 10.
Appearance of the application’s graphical interface. Black solid lines—driver’s observation directions. Red dashed lines—lines between driver position and PV panel position. Yellow dashed lines—lines indicate areas at risk of vehicle light reflection.
A feature was added to the application that allows users to assess the risk posed by car headlights reflecting off the surface of PV panels. This risk is assessed by observing the application’s graphical interface. The screen shows areas that pose a potential hazard. If car lights are present in these areas, they may cause reflections in the direction of the defined observers. Yellow lines indicate areas at risk of vehicle light reflection.
The results are saved in a text file and presented graphically (Figure 11).
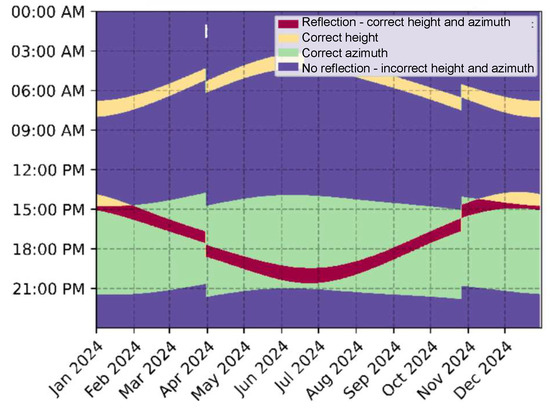
Figure 11.
Results presented in a graph. The visible shift in March and October is related to the change between summer and winter.
Figure 11 shows the results in graphical form, with the following colors:
- Blue—there will be no reflection of the sun towards the observer due to the inappropriate position of the PV panel in terms of height (vertical axis Z) and azimuth (rotation around the vertical axis Z);
- Yellow—correct height;
- Green—correct azimuth;
- Red—reflection towards the observer occurs at the correct height and azimuth.
Not all PV panel locations will experience reflection toward the defined observers (red color in Figure 11). Furthermore, the presence of reflection towards observers does not necessarily indicate that glare will occur. The red color in Figure 11 indicates the possibility of glare.
Glare is a subjective visual experience. Luminance thresholds described in the literature cannot be used directly to define glare requirements. The luminance of an object located in the field of view is only one component determining glare. Other components include the subtended glare source angle size and its distance from the viewing direction. These two components can be calculated. However, it is impossible to predict the PV panel’s background luminance (ambient luminance) at the design stage of a PV installation. Daylight is highly variable, and the designer cannot predict the component related to background luminance. For this reason, it was decided that driver protection should involve removing objects from the field of view whose luminance value does not necessarily cause glare. However, the presence of such an object in the field of view can distract the driver from the road and contribute to a deterioration in their own safety and that of other road users. Therefore, the lowest of the well-documented values, commonly accepted in practice for requirements related to the protection of pilots on the approach path, was adopted as the luminance threshold—(B) 2 × 10⁴ cd/m2.
When determining the assumptions for establishing the GLARE parameter, it was presumed that the luminance of PV panels may pose a threat, even if it is not very high and is lower than the threshold that could cause afterimages. This is due to the complexity of visual tasks that occur on the road, the presence of different road users, the occurrence of conflict zones, and the difficulty of navigational tasks defined as the degree of effort necessary by the road user, as a result of the information presented, to select a route and lane and to maintain or change speed and position on the carriageway. It is assumed that the following conditions cause the GLARE parameter to be true:
- The luminance of the PV panel surface, calculated as the quotient of the luminance coefficient q and the illuminance of sunlight on the PV surface, is greater than 2 × 10⁴ cd/m2.
- The glare source (PV panels) is within the field of view at an angle of +/− 25 degrees from the direction of observation.
- At angles greater than 25 degrees, the luminance of the PV panel is greater than 2 × 10⁴ divided by the cosine of the angle between the direction of vision and the direction of the glare source.
The impact of PV installations on road safety depends on the designer’s attention to detail. Using the PVSunReflection application or another tool, designers should:
- Determine the main directions of observation.
- Take into account additional observation directions resulting from the need to observe not only the road that the driver sees in front of them, but also the directions from which other road users (drivers, pedestrians, cyclists) may appear, e.g., at intersections.
- Take into account all directions in which vehicle lights may be reflected. Such reflections can pose a hazard, as the unexpected appearance of lights may cause the driver to become nervous and misinterpret the situation. Many cars already have matrix lights that should dim when another vehicle is detected but will not dim in the event of reflection from PV panels.
5. Conclusions
PV panel installations appearing along roads may pose a safety hazard to road traffic. The literature contains research results that enable us to assess the safety risk posed by PV installations located near airports.
We also know which irradiance values can cause retinal damage or afterimages. In road traffic, we encounter different users, varying speed values, and conflict zones, all of which can make the driver’s visual task very difficult and complicated. The presence of additional sources of reflected light in the field of vision further complicates this task and may compromise safety for various road users.
This article presents proposals for requirements to be implemented when designing PV installation locations to ensure road safety. It was assumed that luminance below that causing afterimages may pose a hazard, as it hinders road observation and distracts the driver. Based on a review of the literature, a luminance limit of 2 × 10⁴ cd/m2 was proposed. Based on this value, a detailed procedure for assessing the approval of PV installations for placement along roads is presented.
The article describes the procedure for measuring the reflective properties of PV panels using a goniophotometer and an imaging luminance measuring device (ILMD). The results of measurements for three PV panels with different surface structures are presented. It has been shown that, even for panels with a rough surface, the luminance coefficient and, consequently, the luminance of the image of the sun reflected from the PV panel can be very high. This occurs when the angle of incidence exceeds 70 degrees.
The PVSunReflection application was created to determine the directions in which sunlight will reflect off the surfaces of PV panels. The application presents the calculation results graphically. The application takes into account the assumptions and sets the GLARE parameter to true when conditions indicate the installation poses a hazard. In such a case, the designer makes a decision to change the position of the PV panels. The application accounts for the directional reflection of vehicle lights. Such reflections can pose a hazard, as unexpected lights may cause drivers to become nervous if they misinterpret the incident. Designers are provided with a tool that enables a comprehensive assessment of the impact of PV installations on road safety due to the possibility of glare.
A comprehensive procedure for assessing the potential risk of glare caused by sunlight reflecting off the surface of PV panels was developed, along with specific requirements. It was assumed that the luminance of PV panel surfaces within the field of view at an angle of +/− 25 degrees from the direction of observation cannot exceed 2 × 10⁴ cd/m2. At angles greater than 25 degrees, the luminance of the PV panel must not exceed 2 × 10⁴ divided by the cosine of the angle between the viewing direction and the direction of the glare source.
The authors suggest the potential for continued research, which could include:
- Attempting to determine ambient luminance for various longitudes and latitudes, seasons, and times of day, taking into account the diversity of landscapes in which PV installations may be located. Such studies could involve adopting certain assumptions and performing multiple simulations with several daylight sky models. We believe that luminance knowledge is essential for determining the luminance thresholds of PV panel surfaces.
- Designing and conducting experimental studies involving observers in a laboratory setting that includes PV panels and the surrounding background with specific luminance values. Such studies could involve determining the impact of luminance, angular size, and position of PV panels on drivers’ visual performance.
Author Contributions
Conceptualization, K.W.; methodology, K.W.; software, P.S.; validation, K.W. and M.S.; investigation, K.W. and P.S.; resources, P.S.; data curation, P.S. and K.W.; writing—original draft preparation, K.W.; writing—review and editing, M.S.; visualization, K.W.; supervision, M.S.; project administration, K.W. All authors have read and agreed to the published version of the manuscript.
Funding
This research was funded by the National Centre for Research and Development (Narodowe Centrum Badań i Rozwoju) and the General Directorate for National Roads and Motorways (Generalna Dyrekcja Dróg Krajowych i Autostrad), grant number RID2/0004/2022, entitled “A comprehensive system for acquiring, storing and distributing electricity from renewable sources with the use of infrastructure located in the road lane”.
Institutional Review Board Statement
Not applicable.
Informed Consent Statement
Not applicable.
Data Availability Statement
The original contributions presented in this study are included in the article. Further inquiries can be directed to the corresponding author.
Conflicts of Interest
The authors declare no conflicts of interest. The funders had no role in the design of the study; in the collection, analyses, or interpretation of data; in the writing of the manuscript; or in the decision to publish the results.
References
- Kurz, D.; Bugała, A.; Głuchy, D.; Kasprzyk, L.; Szymenderski, J.; Tomczewski, A.; Trzmiel, G. The Use of Renewable Energy Sources in Road Construction and Public Transport: A Review. Energies 2024, 17, 2141. [Google Scholar] [CrossRef]
- Tomczewski, A.; Mikulski, S.; Szymenderski, J. Application of the Analytic Hierarchy Process Method to Select the Final Solution for Multi-Criteria Optimization of the Structure of a Hybrid Generation System with Energy Storage. Energies 2024, 17, 6435. [Google Scholar] [CrossRef]
- Brumleve, T.D. Eye Hazard and Glint Evaluation for the 5-MWt Solar Thermal Test Facility; Report N° SAND76-8022; Sandia National Laboratories: Albuquerque, NM, USA, 1977. Available online: https://www.osti.gov/servlets/purl/7287546 (accessed on 20 December 2025).
- Brumleve, T.D. 10 MWe Solar Thermal Central Receiver Pilot Plant: Beam Safety Tests and Analyses; Report No. SAND83-8035; Sandia National Laboratories: Albuquerque, NM, USA, 1984. [CrossRef]
- Sliney, D.H.; Freasier, B.C. Evaluation of Optical Radiation Hazards. Appl. Opt. 1973, 12, 1–24. [Google Scholar] [CrossRef] [PubMed]
- Ho, C.K.; Ghanbari, C.M.; Diver, R.B. Methodology to Assess Potential Glint and Glare Hazards from Concentrating Solar Power Plants: Analytical Models and Experimental Validation. In Proceedings of the ASME 2010 4th International Conference on Energy Sustainability, Phoenix, AZ, USA, 17–22 May 2010. [Google Scholar] [CrossRef]
- CIE 117-1995; Discomfort Glare in Interior Lighting. CIE Central Bureau: Vienna, Austria, 1995.
- Wienold, J.; Christoffersen, J. Evaluation methods and development of a new glare prediction model for daylight environments with the use of CCD cameras. Energy Build. 2006, 38, 743–757. [Google Scholar] [CrossRef]
- CIE 146/147:2002; CIE Collection on Glare 2002. CIE Central Bureau: Vienna, Austria, 2002.
- Sliney, D.H. An Evaluation of the Potential Hazards of the Point Focusing Solar Concentrators at the JPL-Edwards Test Site; JPL Consulting Agreement No. JF 714696; Jet Propulsion Laboratory, California Institute of Technology: Pasadena, CA, USA, 1980.
- Delori, F.C.; Webb, R.H.; Sliney, D.H. Maximum Permissible Exposures for Ocular Safety (ANSI 2000), with Emphasis on Ophthalmic Devices. J. Opt. Soc. Am. A 2007, 24, 1250–1265. [Google Scholar] [CrossRef] [PubMed]
- Metcalf, R.D.; Horn, R.E. Visual Recovery Times from High-In-Tensity Flashes of Light; Technical Report No. 58232; Air Force Aerospace Medical Research Lab, Wright Air Development Center: Dayton, OH, USA, 1958.
- Severin, S.L.; Newton, N.L.; Culver, J.F. An Experimental Approach to Flash Blindness. Aerosp. Med. 1962, 33, 1199–1205. [Google Scholar] [PubMed]
- Saur, R.L.; Dobrash, S.M. Duration of Afterimage Disability After Viewing Simulated Sun Reflections. Appl. Opt. 1969, 8, 1799–1801. [Google Scholar] [CrossRef] [PubMed]
- Quek, G.; Wienold, J.; Khanie, M.S.; Erell, E.; Kaftan, E.; Tzempelikos, A.; Konstantzos, I.; Christoffersen, J.; Kuhn, T.; Andersen, M. Comparing performance of discomfort glare metrics in high and low adaptation levels. Build. Environ. 2021, 206, 108335. [Google Scholar] [CrossRef]
- Federal Aviation Administration. Technical Guidance for Evaluating Selected Solar Technologies on Airports; Federal Aviation Administration Airport Planning and Environmental Division (APP-400): Washington, DC, USA, 2018. Available online: https://www.faa.gov/sites/faa.gov/files/airports/environmental/FAA-Airport-Solar-Guide-2018.pdf (accessed on 18 August 2025).
- Domke, K.; Wandachowicz, K.; Zalesińska, M.; Mroczkowska, S.; Skrzypczak, P. Digital billboards and road safety. In Light in Engineering, Architecture and the Environment; Domke, K., Brebbia, C.A., Eds.; WIT Press: Southampton, UK, 2011; pp. 119–131. [Google Scholar]
- Moereke, J.; Borowski, P.; Grünsteidl, S.; Palm, J.; Sapkota, S.B.; Dalibor, T. Light reflection analysis of PV modules: Comparison to building facades and assessing the possibility of glare. In Proceedings of the 8th World Conference on Photovoltaic Energy Conversion (WCPEC-8), Washington, DC, USA, 26–30 September 2022. [Google Scholar]
- European Union Aviation Safety Agency. Certification Specifications and Guidance Material for Aerodrome Design; EASA: Cologne, Germany, 2025. Available online: https://www.easa.europa.eu/en/downloads/125398/en (accessed on 18 August 2025).
- New York State Department of Transportation. Criteria for Regulating Off-Premises Commercial Electronic Variable Message Signs (CEVMS) in New York State; New York State Department of Transportation: Albany, NY, USA, 2025. Available online: https://www.dot.ny.gov/divisions/engineering/real-estate/repository/cevms-criteria-for-website.pdf (accessed on 20 December 2025).
- Strahlenschutzkommission. Blendung Durch Natürliche und Neue Künstliche Lichtquellen und Ihre Gefahren. Empfehlung der Strahlenschutzkommission vom 16./17. Februar 2006; Bundesministerium für Umwelt, Naturschutz und nukleare Sicherheit: Berlin, Germany, 2006. Available online: http://www.ssk.de/de/werke/2006/volltext/ssk0601.pdf (accessed on 20 December 2025).
- Wittlich, M. Blendung–Theoretischer Hintergrund, Institut für Arbeitsschutz der Deutschen; Gesetzlichen Unfallversicherung (IFA): Sankt Augustin, Germany, 2010. Available online: https://www.dguv.de/medien/ifa/de/fac/strahl/pdf/blendung_theorie.pdf (accessed on 20 December 2025).
- Hjorth, E.; Wochele, F. Glare from Photovoltaic Systems. Master’s Thesis, Lund University, Lund, Sweden, 2017. EEBD-15/17. [Google Scholar]
- Battaglia, M.; Brunold, S.; Bohren, A.; Ruesch, F. Quantification of glare from sunlight reflected on solar installations. In Proceedings of the 32nd European Photovoltaic Solar Energy Conference and Exhibition, Munich, Germany, 20–24 June 2016; pp. 2503–2507. [Google Scholar]
- Bucher, C.; Wüthrich, P.; Danaci, S.; Wandel, J. Glare Hazard Analysis of Novel BIPV Module Technologies. In Proceedings of the ISES Solar World Congress, Online, 29 August–2 September 2021. [Google Scholar] [CrossRef]
- Rogers, J.; Ho, C.K.; Mead, A.; Millan, A.; Beben, M.; Herndon, G. Evaluation of Glare as a Hazard for General Aviation Pilots on Final Approach; Federal Aviation Administration: Washington, DC, USA, 2015. Available online: https://www.researchgate.net/publication/328772193 (accessed on 18 October 2025).
- Poe, C.; Plovnick, A.; Hodges, T.; Hastings, A.; Dresley, S.; John, A. Highway Renewable Energy: Photovoltaic Noise Barriers; John, A., Ed.; FHWA-HEP-17-088; Volpe National Transportation Systems Center: Cambridge, MA, USA, 2017. Available online: https://rosap.ntl.bts.gov/view/dot/32521 (accessed on 10 October 2025).
- Wu, Q.; Zhang, X.; Wang, Q. Integrating Renewable Energy in Transportation: Challenges, Solutions, and Future Prospects on Photovoltaic Noise Barriers. Sustainability 2024, 16, 2358. [Google Scholar] [CrossRef]
- Ungureanu, V.-I.; Miclea, R.-C.; Korodi, A.; Silea, I. A Novel Approach against Sun Glare to Enhance Driver Safety. Appl. Sci. 2020, 10, 3032. [Google Scholar] [CrossRef]
- Lin, S.; Zhang, J.; Ai, L.; Lu, Y.; Wang, L.; Song, W. Advances in antireflection coatings on photovoltaic glass. Mater. Rep. 2019, 33, 3588–3595. [Google Scholar] [CrossRef]
- Law, A.M.; Kujovic, L.; Togay, M.; Greenhalgh, R.C.; Infante-Ortega, L.C.; Liu, X.; Walls, J.M. A Broadband Multilayer Antireflection Coating for Thin Film CdSeTe/CdTe Solar Cells. IEEE J. Photovolt. 2024, 14, 305–310. [Google Scholar] [CrossRef]
- Law, A.M.; Bukhari, F.; Jones, L.O.; Isherwood, P.J.M.; Walls, J.M. Multilayer Antireflection Coatings for Cover Glass on Silicon Solar Modules. IEEE J. Photovolt. 2022, 12, 1205–1210. [Google Scholar] [CrossRef]
- Ruesch, F.; Bohren, A.; Battaglia, M.; Brunold, S. Quantification of Glare from Reflected Sunlight of Solar Installations. Energy Procedia 2016, 91, 997–1004. [Google Scholar] [CrossRef]
- Bitterling, M.; Bern, G.; Wilson, H.R.; Heimsath, A.; Nitz, P. Physical models of the bidirectional reflectance of solar receiver coatings. Sol. Energy 2020, 209, 653–661. [Google Scholar] [CrossRef]
- Apian-Bennewitz, P. Design and Construction of a Device for Measuring Light-Scattering on Anisotropic Materials. arXiv 2021, arXiv:2105.15112. [Google Scholar] [CrossRef]
- Wang, H.; Zhang, W.; Dong, A. Measurement and modeling of Bidirectional Reflectance Distribution Function (BRDF) on material surface. Measurement 2013, 46, 3654–3661. [Google Scholar] [CrossRef]
- Boucher, Y.; Cosnefroy, H.; Petit, A.D.; Serrot, G.; Briottet, X. Comparison of measured and modeled BRDF of natural targets. In Proceedings of the SPIE—The International Society for Optical Engineering, Denver, CO, USA, 18–23 July 1999. [Google Scholar] [CrossRef]
- Bucher, C.; Bohren, A.; Hess, D.; Hassani, S.E.; Hügi, M. Two-Dimensional Representation of the Bidirectinal Reflectance Distribution Function of Photovoltaic Modules. In Proceedings of the Conference: European Photovoltaic Solar Energy Conference and Exhibition (EU PVSEC), Lisbon, Portugal, 18–22 September 2023. [Google Scholar] [CrossRef]
- Ben-Ezra, M.; Wang, J.; Wilburn, B.; Li, X.; Ma, L.L. An LED-only BRDF measurement device. In Proceedings of the IEEE Computer Society Conference on Computer Vision and Pattern Recognition, Anchorage, AK, USA, 23–28 June 2008. [Google Scholar] [CrossRef]


Disclaimer/Publisher’s Note: The statements, opinions and data contained in all publications are solely those of the individual author(s) and contributor(s) and not of MDPI and/or the editor(s). MDPI and/or the editor(s) disclaim responsibility for any injury to people or property resulting from any ideas, methods, instructions or products referred to in the content. |
© 2026 by the authors. Licensee MDPI, Basel, Switzerland. This article is an open access article distributed under the terms and conditions of the Creative Commons Attribution (CC BY) license.