Article

Using the InVEST-PLUS-GeoDetector Model to Predict and Analyze the Pattern of Ecosystem Carbon Storage in the Dongting Lake Basin, China


1
College of Forestry, Central South University of Forestry and Technology, Changsha 410004, China
2
School of Materials and Energy, Central South University of Forestry and Technology, Changsha 410004, China
3
School of Low-Altitude Economy, Central South University of Forestry and Technology, Changsha 410004, China
*
Authors to whom correspondence should be addressed.
These authors contributed equally to this work.
Sustainability 2026, 18(5), 2543; https://doi.org/10.3390/su18052543
Submission received: 17 January 2026 / Revised: 22 February 2026 / Accepted: 3 March 2026 / Published: 5 March 2026
(This article belongs to the Special Issue Analysis of Energy Systems from the Perspective of Sustainability)

Abstract

Guaranteeing the ecological security of the Dongting Lake Basin is of paramount importance for national-scale programs, such as the Yangtze River Economic Belt and aquatic conservation projects. Within this framework, carbon storage and its determining drivers act as essential indicators of regional ecological stability. However, the historical trajectory of carbon pools and their response to future multi-scenario land-use transitions remain insufficiently understood. Therefore, this study aims to quantify the spatiotemporal evolution of carbon storage in the Dongting Lake Basin from 2000 to 2020 and project its future dynamics under diverse development pathways. This study, utilizing land use data from 2000 to 2020 and the carbon density database of the Dongting Lake Basin, assessed land use changes over two decades and determined the spatiotemporal distribution of carbon storage. Additionally, using 17 driving factors and various spatial policies, the study projected the land use and land cover changes (LUCC) for 2030 under four scenarios: natural development, ecological protection, economic development, and planned development. The spatiotemporal distribution of carbon storage and its response mechanisms were analyzed for each scenario. The results showed that carbon storage was directly impacted by LUCC, with an overall “decrease-increase-decrease” trend from 2000 to 2020, resulting in a net increase of 3.685 × 10⁶ t. By 2030, the changes in carbon storage under the natural development, ecological protection scenario, economic development, and planned development scenarios were projected to be −1.008 × 10⁷ t, 1.276 × 10⁷ t, 3.292 × 10⁸ t, and −1.200 × 10⁵ t, respectively. Notably, the ecological protection scenario showed a significant positive growth in carbon storage, primarily driven by an increase in forest and wetland areas. Additionally, the spatial distribution of carbon storage exhibited a pattern of “high in the west and low in the east”. These results imply that to achieve the “Dual Carbon Strategy”, future land use planning in the Dongting Lake Basin should prioritize ecological protection and planned development models, including strict control of construction land expansion, increasing ecological land area, and enhancing carbon storage.

1. Introduction

Driven by global climate mitigation efforts, China formally announced during the September 2020 UN General Assembly its intention to have CO2 emissions culminate prior to 2030 and realize carbon-neutrality by 2060 [1]. The successful attainment of these strategic milestones is largely predicated on the functionality of terrestrial ecosystems, which act as vital reservoirs for atmospheric CO2 and exert a profound influence on the stability of the global climate system [2]. Terrestrial ecosystems sequester approximately 28% of annual anthropogenic carbon emissions, with carbon storage serving as a fundamental metric for evaluating this efficiency [3]. While carbon pools respond to various environmental factors, land-use transition remains the primary driver of these shifts, particularly as soil—the largest terrestrial carbon reservoir—accounts for over 80% of total storage [4,5,6]. Theoretically, these dynamics are governed by the “pattern-process-function” mechanism and humanland coordination theory, where land-use transitions signify a fundamental reorganization of regional biogeochemical cycles [7]. Enhancing the carbon storage capacity of terrestrial ecosystems is essential for regulating regional climates, understanding land use dynamics, exploring the factors driving changes in carbon storage, and supporting ecological protection alongside sustainable economic and social development [8,9].
As China’s second most expansive freshwater body, Dongting Lake is nestled within the Dongting Lake Basin, which represents a prominent sub-watershed across the Yangtze River’s middle and lower segments. This region is distinguished as a high-priority ecoregion within the Global 200 preservation list [10]. Featuring three Ramsar-designated wetlands, the Basin’s contribution to international biological diversity is paramount. Moreover, the area serves as a pivotal migratory corridor and wintering refuge for waterbirds traversing the East Asian-Australasian Flyway [11]. Beyond its ecological status, it acts as a premier agricultural hub for national grain supplies. The Basin facilitates indispensable natural functions, including flood mitigation, water filtration, climate moderation, and habitat maintenance [12]. However, the region currently faces a critical scientific and managerial dilemma: the inherent conflict between agricultural intensification for food security and the preservation of high-value carbon sinks in wetlands and forests [13,14]. Historically, the high correlation between intensive land utilization in urban agglomerations and carbon emission intensity has triggered imbalances in regional carbon storage patterns [15,16]. This makes the Dongting Lake Basin a significant study for exploring the trade-offs between anthropogenic development and carbon neutrality goals. Consequently, protecting the Dongting Lake Basin is essential for the integrated protection of the Yangtze River [17,18,19].
Different modeling approaches have been used to determine the dynamic evolution of carbon sequestration and its underlying determinants. For instance, the synergistic application of the Patch-generating Land Use Simulation (PLUS) [20], the InVEST suite [21], and the GeoDetector spatial statistical tool [22] provides a robust framework for deciphering carbon fluctuations across multiple scales. Within this integrated architecture, the PLUS algorithm facilitates high-fidelity simulations of landscape transitions, establishing a solid empirical base for future projections. Meanwhile, the InVEST platform elucidates the quantitative nexus between land-use configurations and carbon density, enabling the precise mapping of sequestered carbon. Finally, the GeoDetector tool identifies the correlations between biophysical or socioeconomic variables and carbon storage, highlighting how singular and interactive forces drive regional carbon dynamics.
In recent years, researchers have increasingly integrated the InVEST framework into diverse land-use modeling platforms to examine how LUCC alters carbon sequestration. For instance, the PLUS-InVEST synergy was utilized to anticipate carbon stock variations in the Beibu Gulf metropolitan area through 2060 [23], as well as to scrutinize landscape transformations across Liaoning Province [24]. Similarly, the fusion of CA-Markov and InVEST was deployed to evaluate the efficacy of ecological restoration on carbon stocks within the arid Heihe River Basin [25]. Beyond biomass estimation, the GeoDetector approach has been instrumental in dissecting how demographic density and vegetative mantle govern carbon distribution in the Yellow River’s middle reaches [26]. Furthermore, spatial analysis in Hefei revealed that terrain and productivity significantly shape habitat suitability [27], while social factors like population concentration principally drive land-use transitions in Zhuhai [28]. Collectively, these studies demonstrate that urbanization is a primary driver of carbon loss, yet they often overlook the specific ‘humanland’ contradictions in complex river-lake basins. Addressing this gap is essential for balancing agricultural productivity with carbon sequestration in the Dongting Lake Basin.
This study assesses the spatiotemporal transitions of land-use patterns and carbon sequestration capacity across the Dongting Lake Basin from 2000 to 2020. This specific interval was designated to capture the profound landscape restructuring resulting from rapid urbanization and landmark ecological initiatives, such as the “Returning Farmland to Lake [29]” and “Grain for Green” programs [30]. By scrutinizing the impacts of landscape shifts—specifically the expansion of built-up areas and the preservation of forest-wetland complexes—this study coupled the PLUS and InVEST frameworks to simulate future carbon trajectories for 2030 under four divergent scenarios. Furthermore, the Geodetector framework was implemented to untangle the latent determinants and interactive mechanisms governing the observed spatial heterogeneity. The findings of this study will help optimize land use patterns, ecological protection, and balanced economic development, providing quantitative support and strategic guidance for achieving carbon neutrality regionally.
Based on this, this study investigated the spatiotemporal evolution of carbon storage and its underlying driving mechanisms in the Dongting Lake Basin to support regional carbon management and ecological security. The questions addressed in this study were as follows:
Q1. What are the spatiotemporal evolution characteristics of land use and carbon storage within the Dongting Lake Basin during the 2000–2020 period?
Q2. What are the primary driving factors, and how do their interactions influence the spatial heterogeneity of carbon storage in the Dongting Lake Basin?
Q3. How will regional carbon sequestration fluctuate under different land-use simulation trajectories by 2030, and what strategies can effectively balance economic expansion with carbon storage goals?

2. Materials and Methods

2.1. Study Area

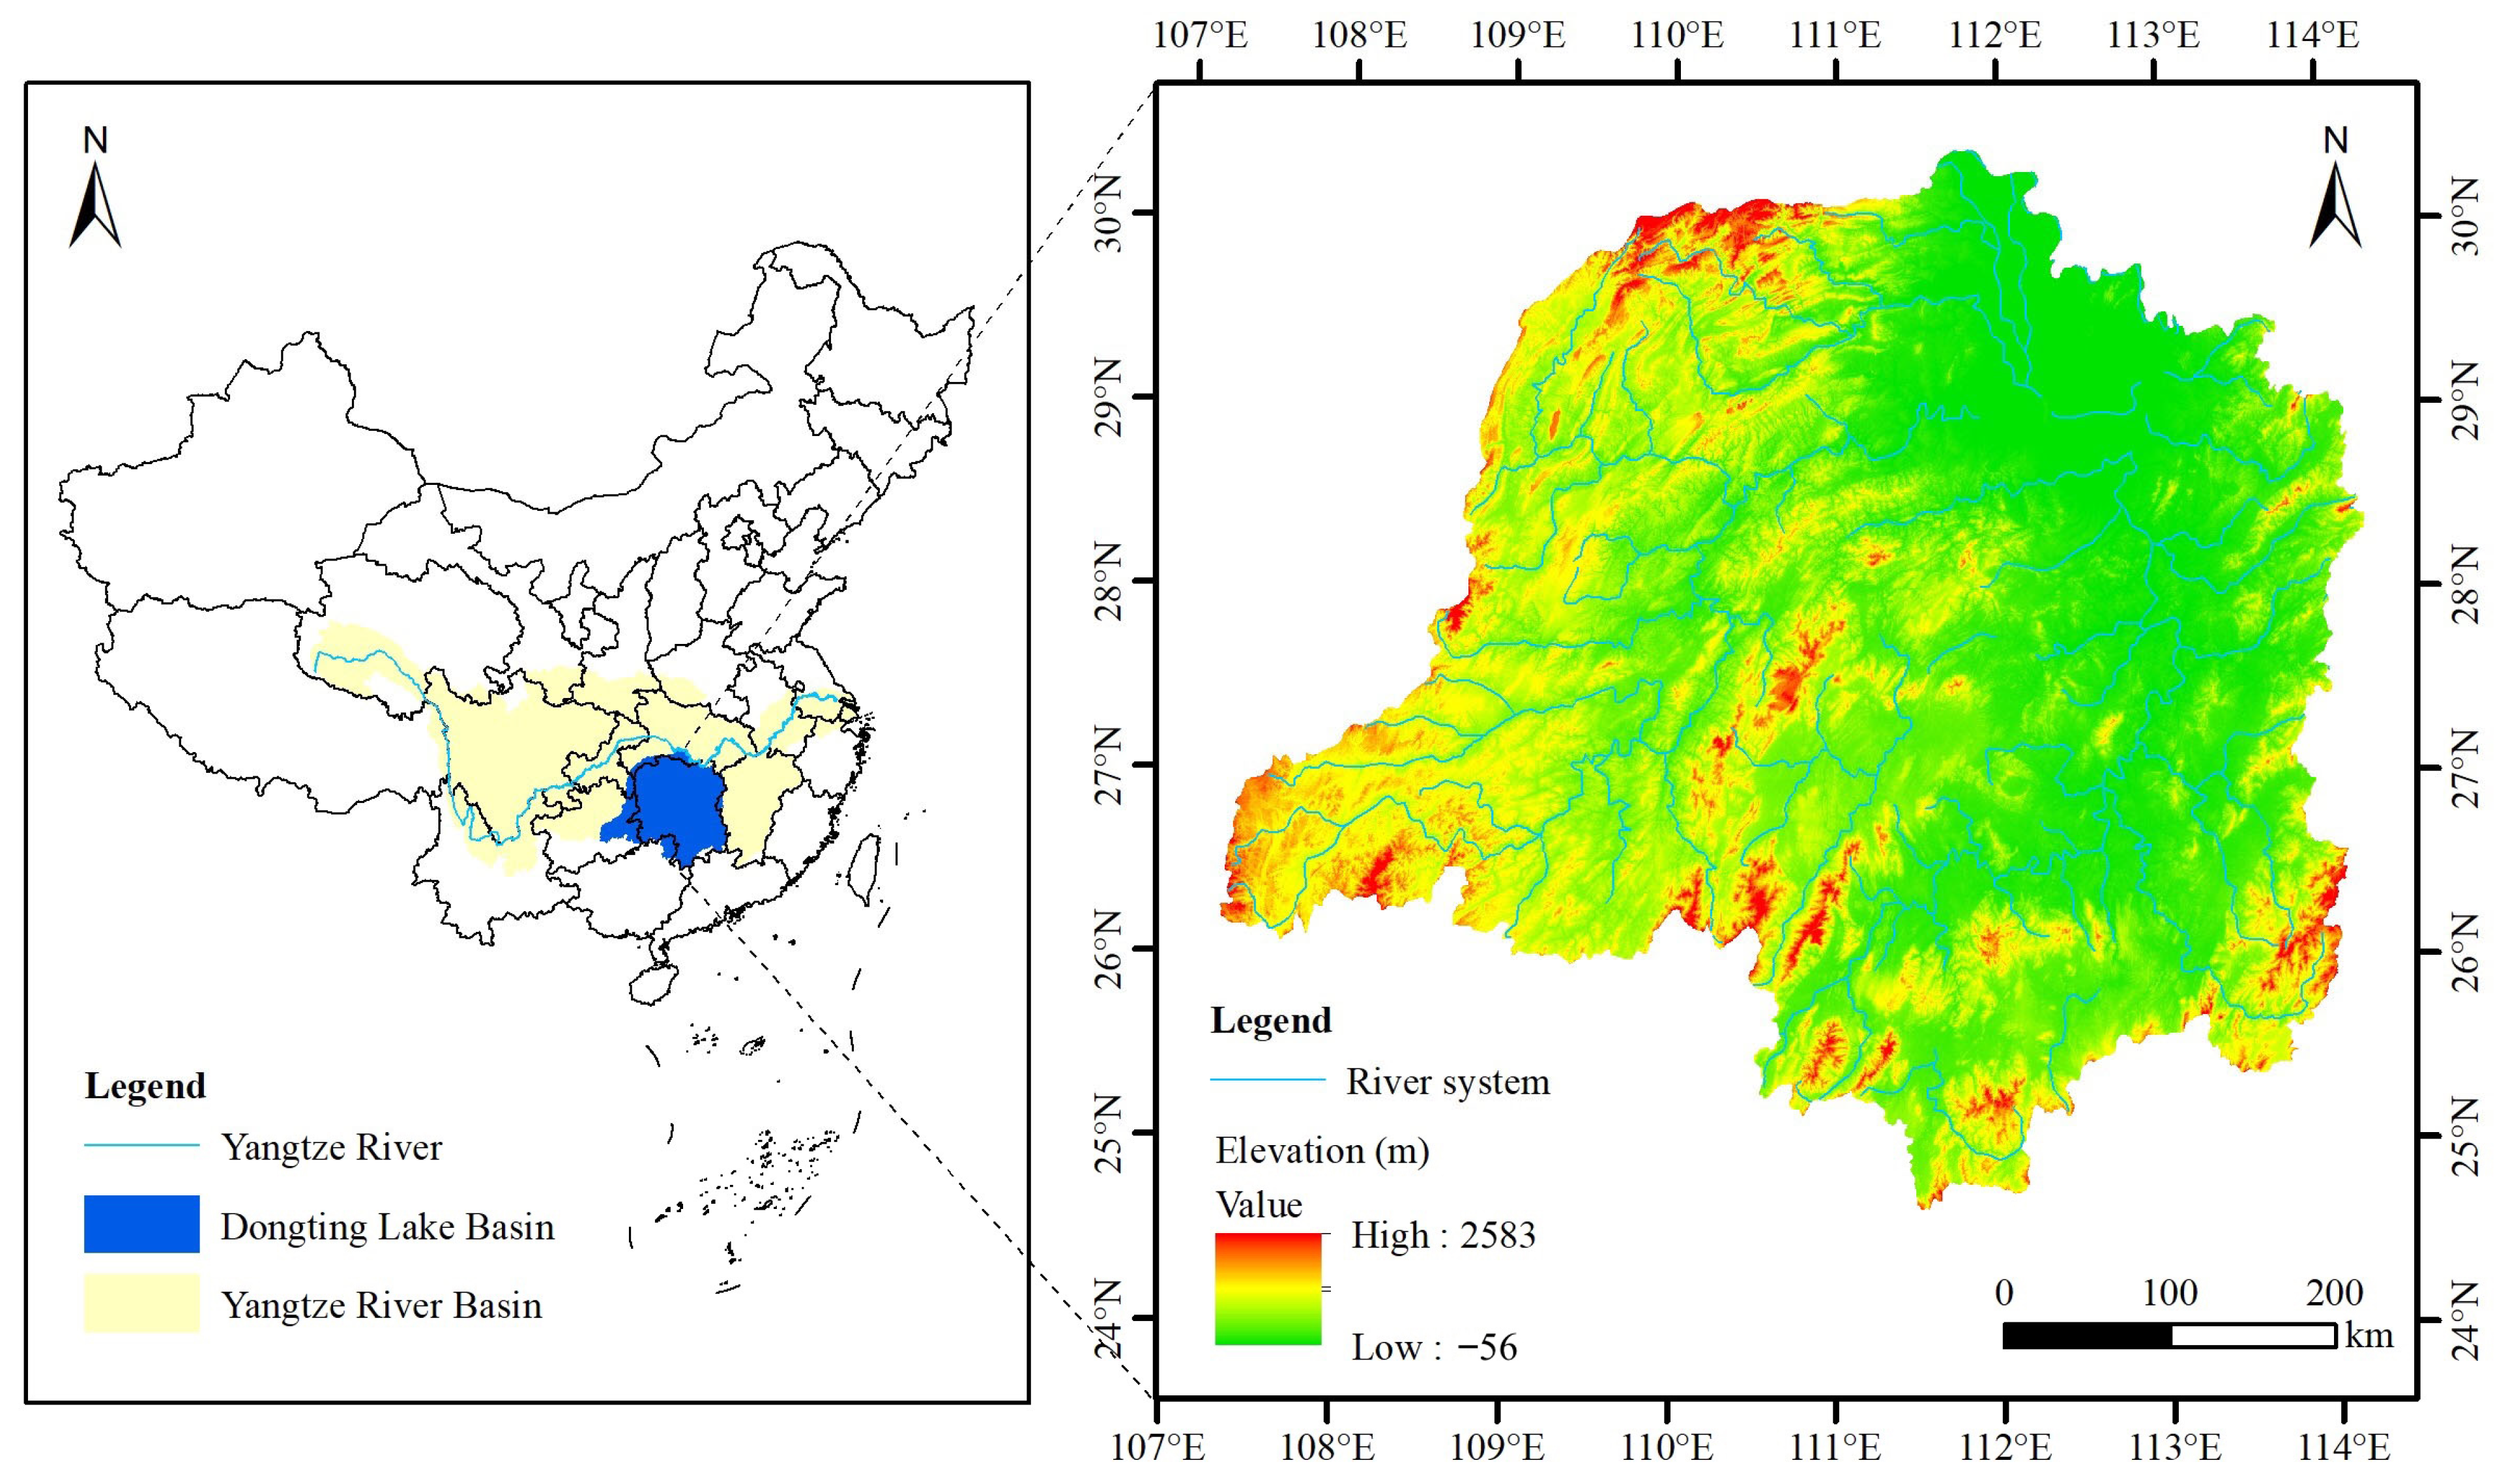
The Dongting Lake Basin (24°38′–30°24′ N, 107°16′–114°15′ E) occupies a central-southern position within China. It is situated between the Yangtze River’s middle reaches to the north and the Nanling Mountains to the south (Figure 1). Spanning approximately 260,000 km2, or 14% of the entire Yangtze River drainage area—this region constitutes a vital hydrological network anchored by Dongting Lake [31]. As a strategic hydrological crossroads, the Basin facilitates the convergence of the Xiang, Zi, Yuan, and Li rivers. This intricate drainage network functions as an indispensable nexus for regional water circulation while simultaneously safeguarding the broader ecological integrity of the Yangtze River system [32]. Marked by substantial topographic heterogeneity, the Basin’s geomorphology transitions from rugged mountain ranges in the west to a mosaic of rolling hills and tectonic depressions across the central-southern zones, ultimately flattening into expansive low-lying plains in the northern sector. This physical landscape is governed by a characteristic subtropical monsoonal regime, defined by well-demarcated seasonal shifts and copious meteoric precipitation totaling 1200–1700 mm per annum. Furthermore, the region maintains a stable thermal profile, with mean yearly temperatures typically fluctuating within the 16–17 °C interval. These conditions support rich biodiversity, with forests and wetlands providing valuable habitats for numerous flora and fauna, contributing to their significant ecological and economic value [33]. Because of its ecological and economic significance, the Dongting Lake Basin is designated as a priority area for environmental conservation within the Chinese national framework.

2.2. Data Sources

The 2000–2020 study period was chosen to capture the most representative period of landscape reorganization and socioeconomic transition in the Dongting Lake Basin. With the objective of characterizing these trends, land-use datasets for 2000, 2005, 2010, 2015, and 2020—were systematically partitioned into seven categories: cropland, forestland, grassland, water, construction land, unused land, and wetland. The acquired data were processed through geometric correction, mosaicking, cropping, reclassification, and remote sensing imagery projection transformation. All the datasets were standardized to the WGS1984 UTM Zone 50N coordinate system on the ArcGIS 10.4 platform, ensuring consistent dimensions and accuracy. To optimize spatial resolution and data processing efficiency, the data were resampled to 90 m × 90 m resolution after multiple trials (Table 1).

2.3. Methods

2.3.1. Land-Use Prediction Scenarios Setting

This research evaluated projected land-use dynamics within the Dongting Lake Basin spanning 2020 to 2030 across four distinct simulation pathways. For each scenario, future land-use requirements for 2030 were first estimated by integrating linear regression with Markov chain techniques, leveraging historical transition patterns derived from the 2000–2010 and 2010–2020 intervals. The divergence among these pathways stems from the deliberate adjustment of conversion probability matrices or the implementation of specific spatial exclusionary constraints:
(1)
Natural Evolution Scenario (NES): This scenario serves as the baseline, assuming the continuation of historical land-use trends without setting any functional restriction areas or planned development zones. The land demand and transition potential were calculated directly from historical data without further adjustment.
(2)
Ecological Protection Scenario (EPS): Under the EPS scenario, the government prioritizes ecological restoration by enforcing stricter policies on expanding construction land. Such measures include converting cropland to forests and lakes and limiting the conversion of forestlands, grasslands, and wetlands to cropland or construction land. The following transition probabilities were adjusted following the restrictions: cropland and unused land were 60% more likely to convert to forest, wetland, and water bodies and 80% less likely to become construction land. Furthermore, the grasslands were 60% more likely to transition to forestland in order to meet the minimum demand for urbanization.
(3)
Economic Development Scenario (EDS): This scenario prioritized meeting economic and social development needs, increasing demand for cropland and construction land. Based on the NDS, the transition probabilities of all land use types (except water bodies) to cropland and construction land increased by 50%. The planned development zones were established within the Middle Yangtze River City Cluster and the Chengdu-Chongqing Urban Agglomeration. At the same time, in 2020, water bodies were designated as functionally restricted areas to meet water demands for production and domestic use.
(4)
Planned Development Scenario (PDS): Within the actual planning framework, the three scenarios should coexist, balancing ecological, production, and living space development needs. Specifically, key ecological areas, rivers, lakes, and wetlands were designated functional restriction areas, prohibiting the transition of forests, wetlands, and water bodies to other land use types. Based on the NDS, transition probabilities of cropland and unused land to forests, wetlands, and water bodies increased by 30%, while conversion to construction land decreased by 30%. Additionally, the transition probability of grassland to forest increased by 20%.

2.3.2. PLUS

The Patch-generating Land Use Simulation (PLUS) model [20], originally designed by the China University of Geosciences, utilizes a random forest model to analyze the expansion of various land use types and their driving forces. This process determines the development probabilities for each land category and quantifies the contribution of driving factors to their expansion over the specified period. The model formula was expressed as:
P i , k x d = n = 1   m I h n x = d M
where d indicates the transition status, with a value of 1 signifying a conversion to land-use type k and 0 representing all other cases. Here, x constitutes a vector of various independent driving factors. The collective prediction of the ensemble is characterized by the indicator function I (   ) for the decision tree set, where h n ( x ) denotes the specific category output by the n decision tree corresponding to vector x . Lastly, M accounts for the total number of decision trees incorporated within the model.

2.3.3. InVEST

Carbon storage is the total amount of carbon stored in vegetation, soil, and dead organic matter within a given area. It is a key indicator reflecting the carbon storage capacity of an ecosystem. The carbon storage was calculated using the carbon module in the InVEST framework with the following formula:
C i = C i , a b o v e + C i , b e l o w + C i , s o i l + C i , d e a d C t o t a l = i = 1 n C i × A i
where the total carbon storage ( C total ) is an aggregate metric of carbon sequestered across n   =   7 land-use categories. For the i -th type, the area is denoted by A i (hm2), while the carbon density C i (t/hm2) integrates four distinct reservoirs: above-ground ( C i , above ), below-ground ( C i , below ), soil ( C i , soil ), and dead organic matter ( C i , dead ). The parameterization of these densities was based on established literature for the region [34,35,36,37], summarized in Table 2.

2.3.4. GeoDetector

GeoDetector is a tool that identifies spatial variations among geographic objects and analyzes the factors driving these patterns [38]. In this study, the model facilitates two distinct analyses: single-factor detection, which gauges the isolated contribution of each driver to carbon storage patterns, and interaction detection, which evaluates how the synergy between multiple factors shapes spatial variability.
(1)
Single-factor Detection
The Factor Detector determines the degree to which an environmental factor explains the spatial stratification of carbon storage. The magnitude of this influence is measured by the q -statistic, formulated as:
q = 1 h = 1 L n h σ h 2 n σ 2 = 1 S S W S S T S S W = h = 1 L n h σ h 2 S S T = h = 1 L n σ 2
where h   =   1 ,   ,   L denotes the specific strata or sub-regions of the independent variable X ; N h and N represent the number of spatial sampling units within stratum h and across the entire study area, respectively. The terms σ h 2 and σ 2 signify the variance of carbon storage within stratum h and the global variance of the entire region. Correspondingly, SSW and SST correspond to the sum of within-strata variances and the total sum of squares. The q value is restricted to [ 0 ,   1 ] , where a higher value signifies a more robust explanatory capacity of the factor regarding the spatial distribution of carbon storage.
(2)
Interaction Detector
The Interaction Detector evaluates whether the combined influence of two distinct factors ( X 1 and X 2 ) enhances or weakens their individual explanatory power, or if they operate independently. The assessment begins by calculating the individual q -values for each factor— q ( X 1 ) and q ( X 2 ) —and subsequently determining the interaction q -value, q ( X 1 X 2 ) . By comparing the interaction result with the standalone values, the relationship can be classified into several types, including the following:
(1)
Nonlinear enhancement: q ( X 1 X 2 )   >   q ( X 1 )   +   q ( X 2 ) ;
(2)
Dual-factor enhancement: q ( X 1 X 2 )   >   max ( q ( X 1 ) , q ( X 2 ) ) ;
(3)
Weakening: q ( X 1 X 2 )   <   min ( q ( X 1 ) , q ( X 2 ) ) .

3. Results

3.1. Land Use Change from 2000 to 2020

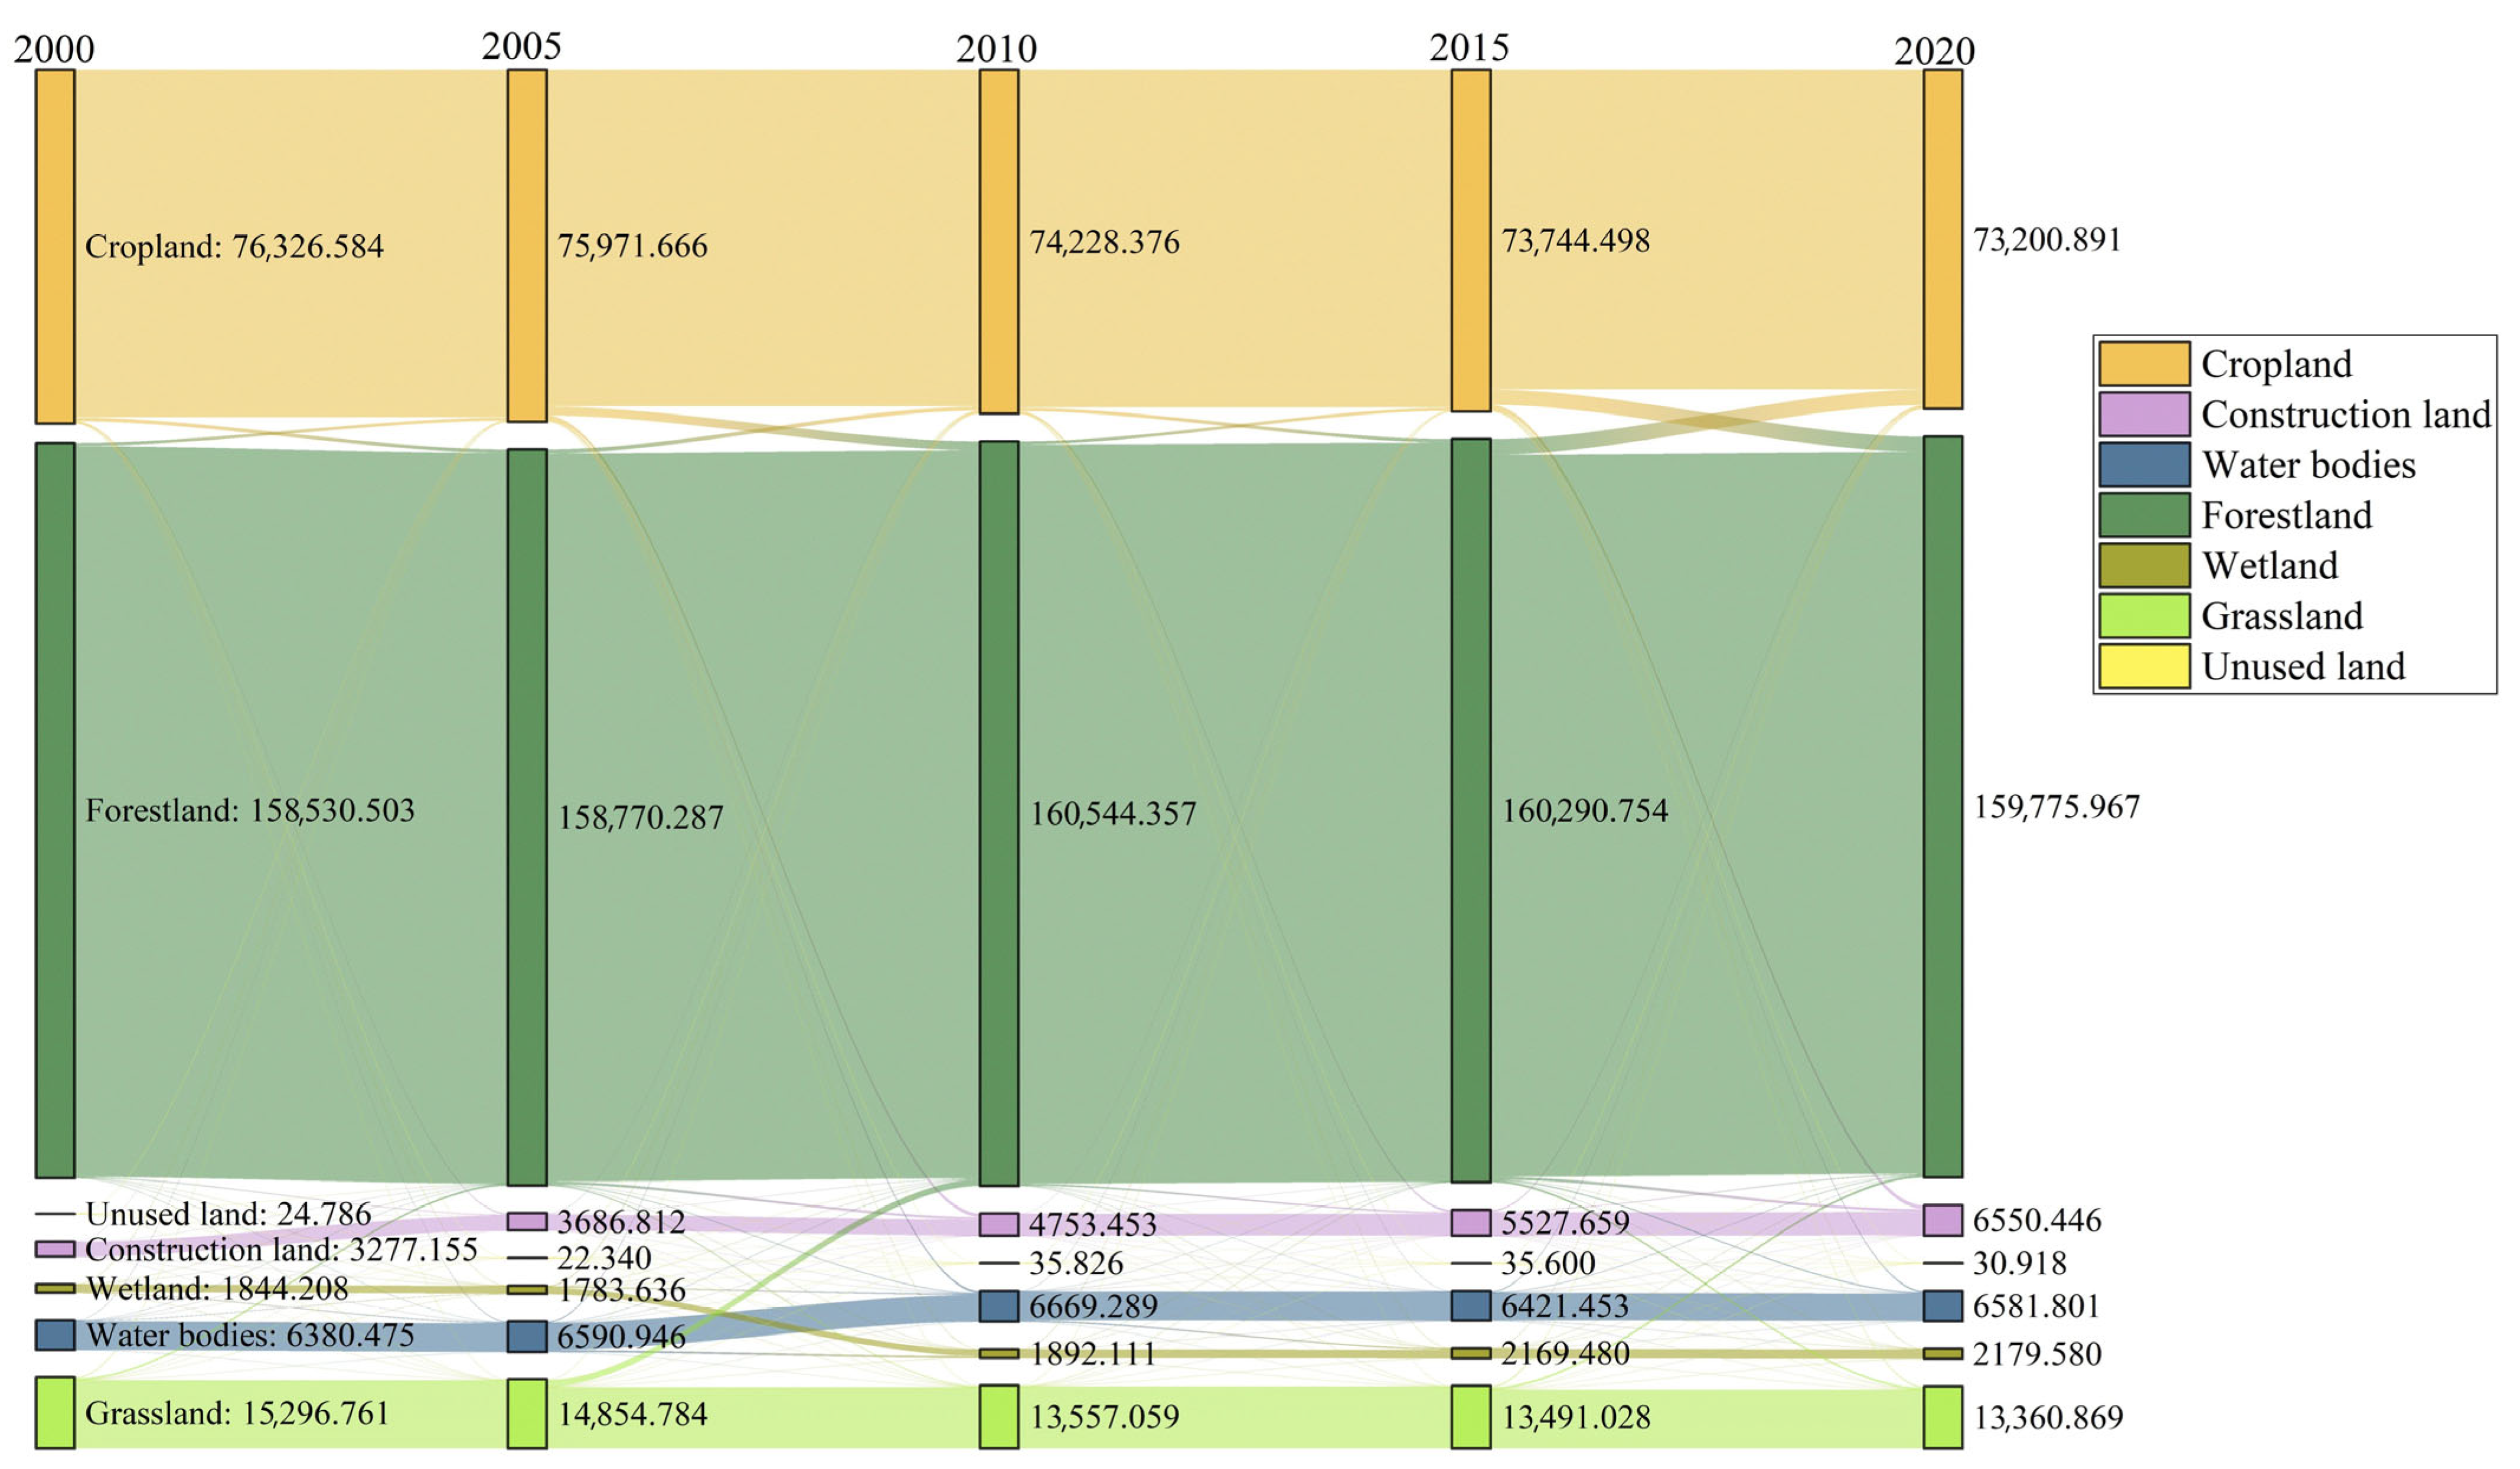
From 2000 to 2020, the land use structure of the Dongting Lake Basin remained largely stable (Figure 2). Forestland consistently covered the largest portion, covering 60.58% to 61.35% of the total area, followed by cropland, covering 27.97% to 29.17%. The primary land use changes included an initial expansion of forestland by 2013.85 km2 from 2000 to 2010, followed by a decrease of 768.39 km2 from 2010 to 2020, reflecting a relatively slow rate of change. However, cropland and grassland areas steadily declined, with reductions of 3125.69 km2 and 1935.89 km2, respectively.
The land use transfer matrix from 2000 to 2020 indicated notable shifts in land use types within the study area, particularly in cropland, forestland, and grassland (Table 3). Cropland exhibited the highest transfer-out rate at 42.23%, predominantly transitioning into forestland and construction land, followed by forestland. The transfer-out rates for other land use types, in descending order, were grassland (14.77%), water bodies (6.49%), wetlands (2.51%), and construction land (2.30%). Unused land had the lowest transfer-out rate at just 0.06%, mainly converting to forestland and cropland.

3.2. Temporal Change in Carbon Storage

Between 2000 and 2020, the carbon storage in the Dongting Lake Basin exhibited a fluctuating trend of “decrease-increase-decrease,” driven by land use changes (Table 4). The total carbon storage for the years 2000, 2005, 2010, 2015, and 2020 were 36.49 × 10⁸ t, 36.48 × 10⁸ t, 36.64 × 10⁸ t, 36.63 × 10⁸ t, and 36.52 × 10⁸ t, respectively. Results showed a decline from 2000 to 2005, a subsequent increase from 2005 to 2010, and a gradual decline from 2010 to 2020. Despite these fluctuations, the overall variation in carbon storage over two decades was relatively small, with a net increase of 3.685 × 10⁶ t.
Carbon storage varied significantly across land types over the study period. Forestland was the largest contributor, with carbon storage increasing from 28.742 × 10⁸ t in 2000 to 29.107 × 10⁸ t in 2010, before declining slightly to 28.967 × 10⁸ t in 2020. In contrast, cropland exhibited a continuous decline in carbon storage, dropping from 6.344 × 10⁸ t in 2000 to 6.084 × 10⁸ t in 2020. Grassland also followed a decreasing trend, while wetland and construction land saw a slight increase. Particularly, carbon storage in construction land nearly doubled, rising from 0.145 × 10⁸ t in 2000 to 0.289 × 10⁸ t in 2020, driven largely by urban expansion.
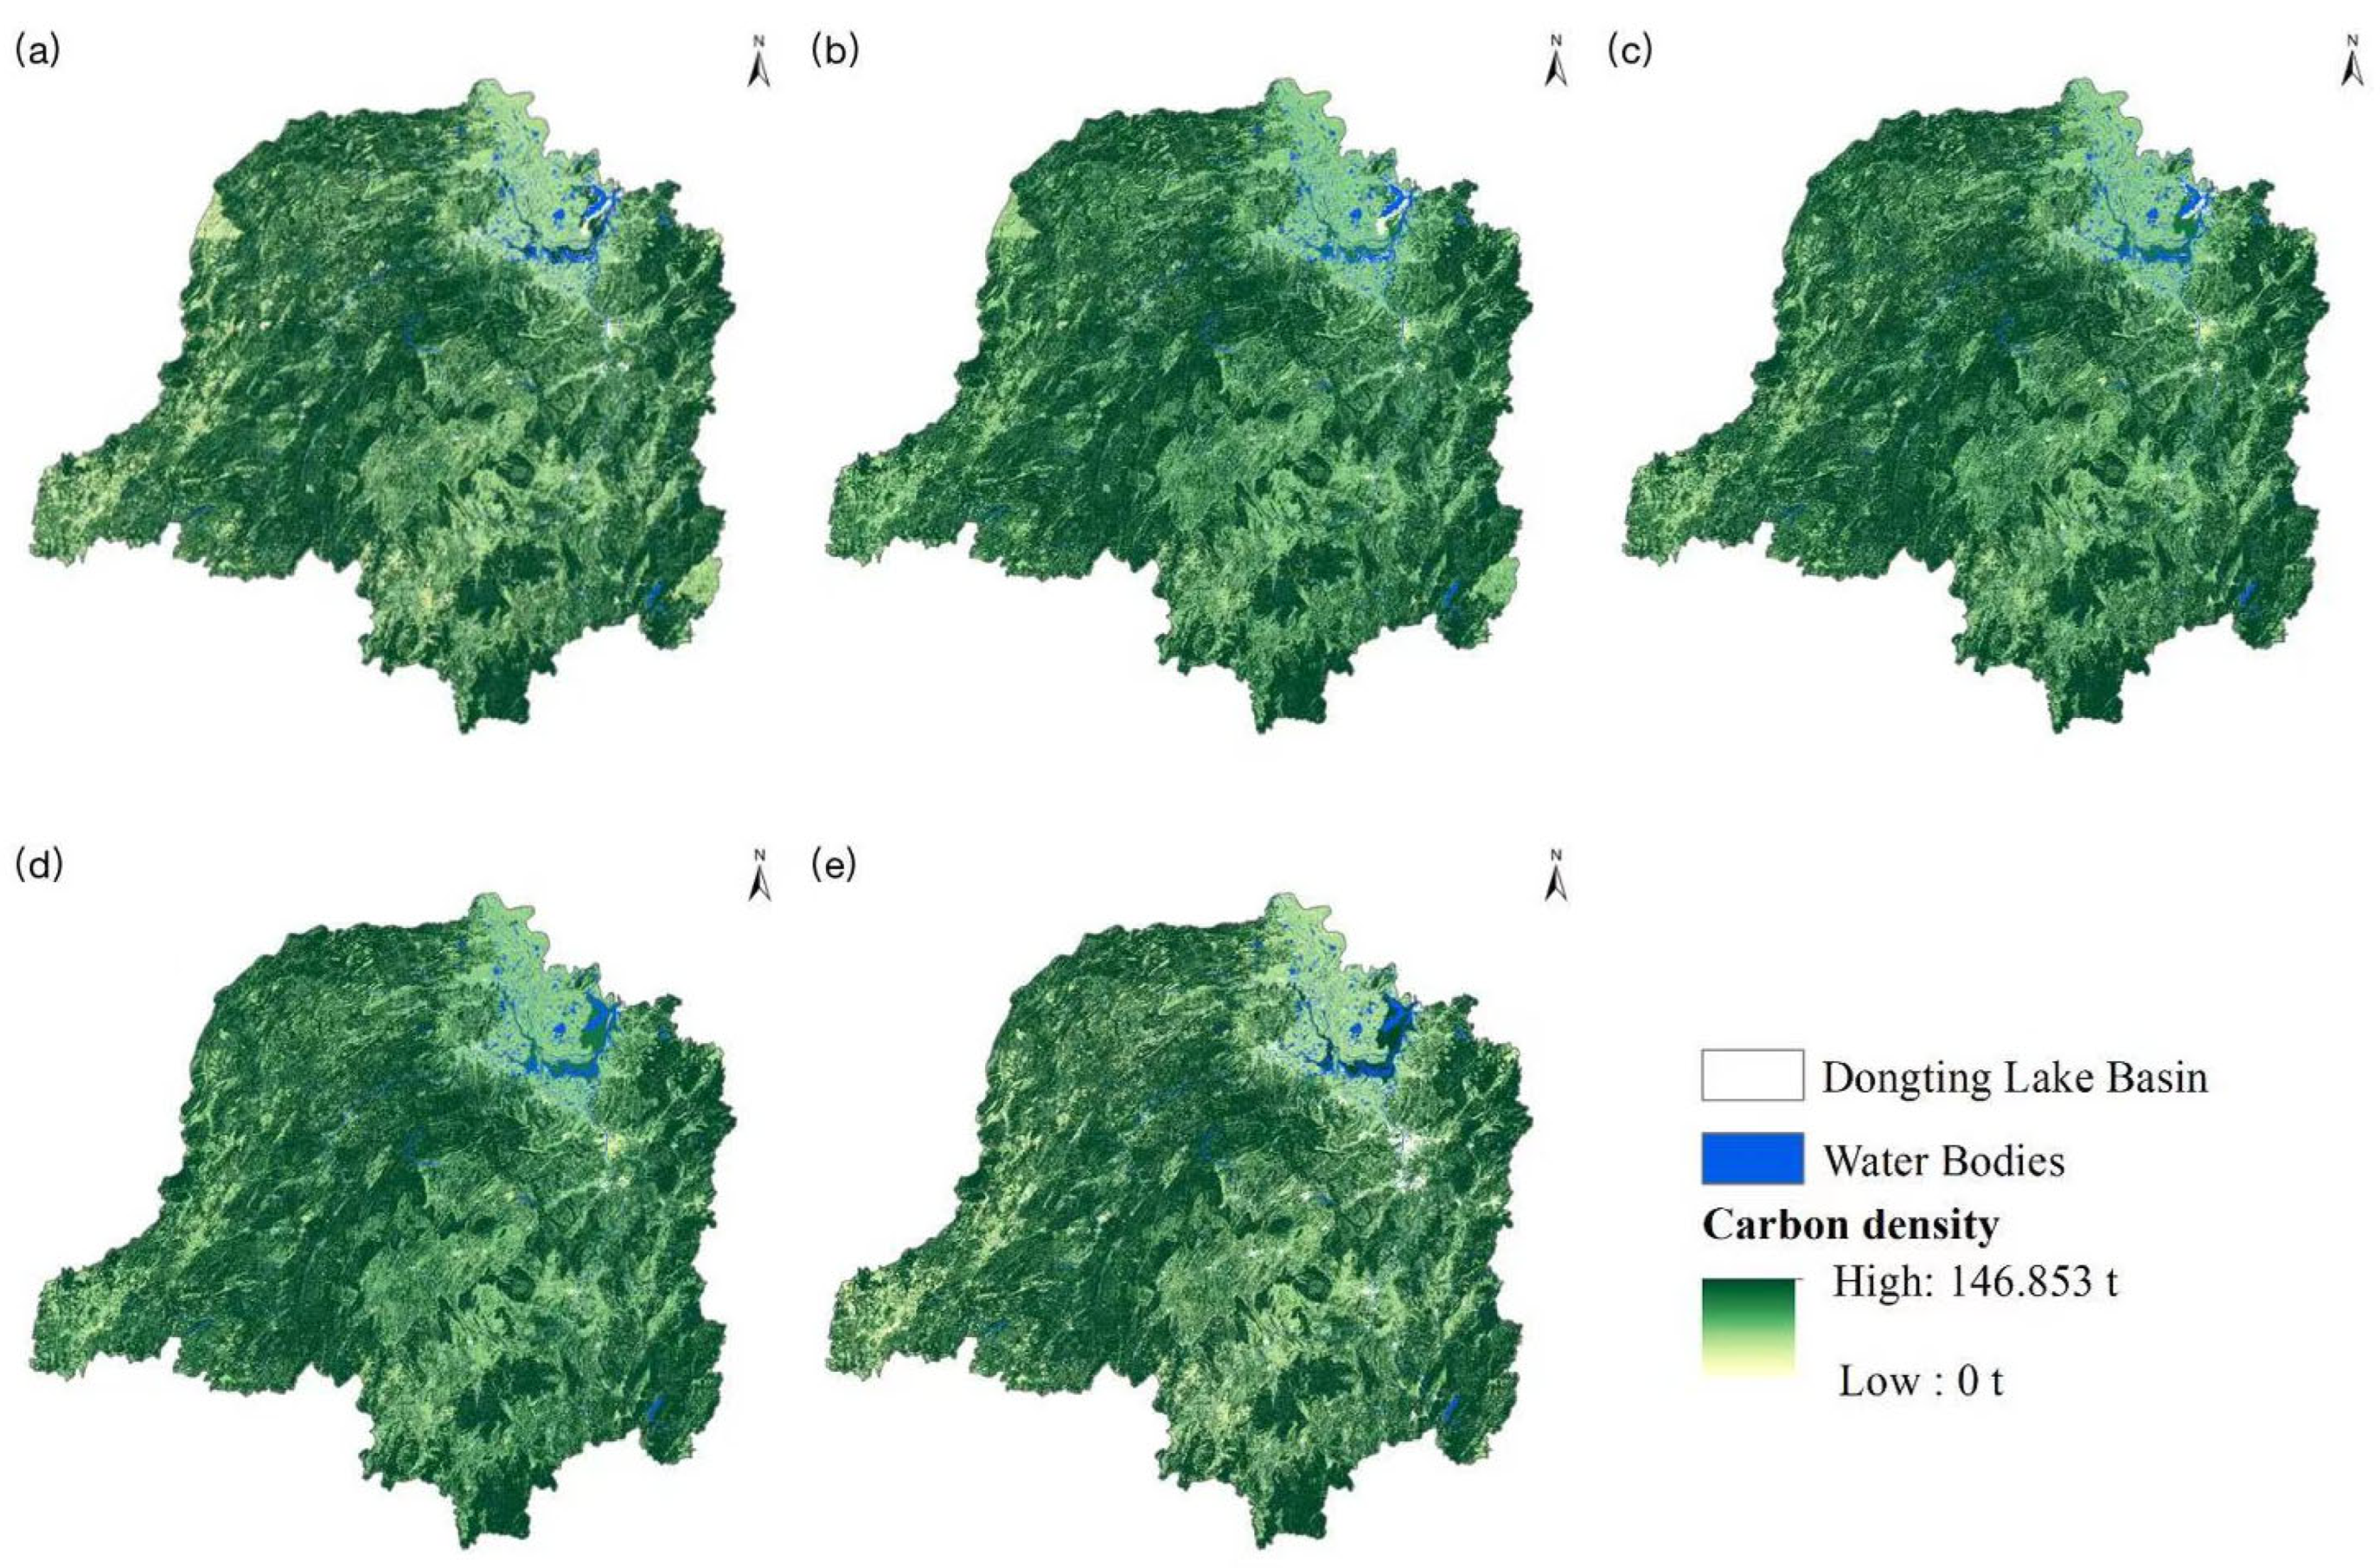
From 2000 to 2020, high carbon storage areas in the Dongting Lake Basin were primarily located in the western part of the Basin, while low carbon storage areas were concentrated in the northeast. This spatial pattern—characterized by “high in the west, low in the east”—aligns with the distribution of land use types. Forestland in the west stored significantly more carbon than cropland in the east (Figure 3). The average annual carbon reserves during this period across the land use types ranked as follows: forestland > cropland > grassland > wetland > construction land > unused land > water areas.

3.3. Variations in Carbon Storage and Driving Forces

The factor detection results (Table 5) revealed that all selected driving factors significantly influenced the spatial distribution of carbon storage in the Dongting Lake Basin (p < 0.01). Among them, NDVI (×16) emerged as the most dominant factor, with its q-statistic consistently exceeding 0.73 across all periods (average q = 0.7357). This was followed by topographic factors such as Slope (×7) and DEM (×6), both of which showed high explanatory power with average q-values of 0.7034 and 0.6799, respectively.
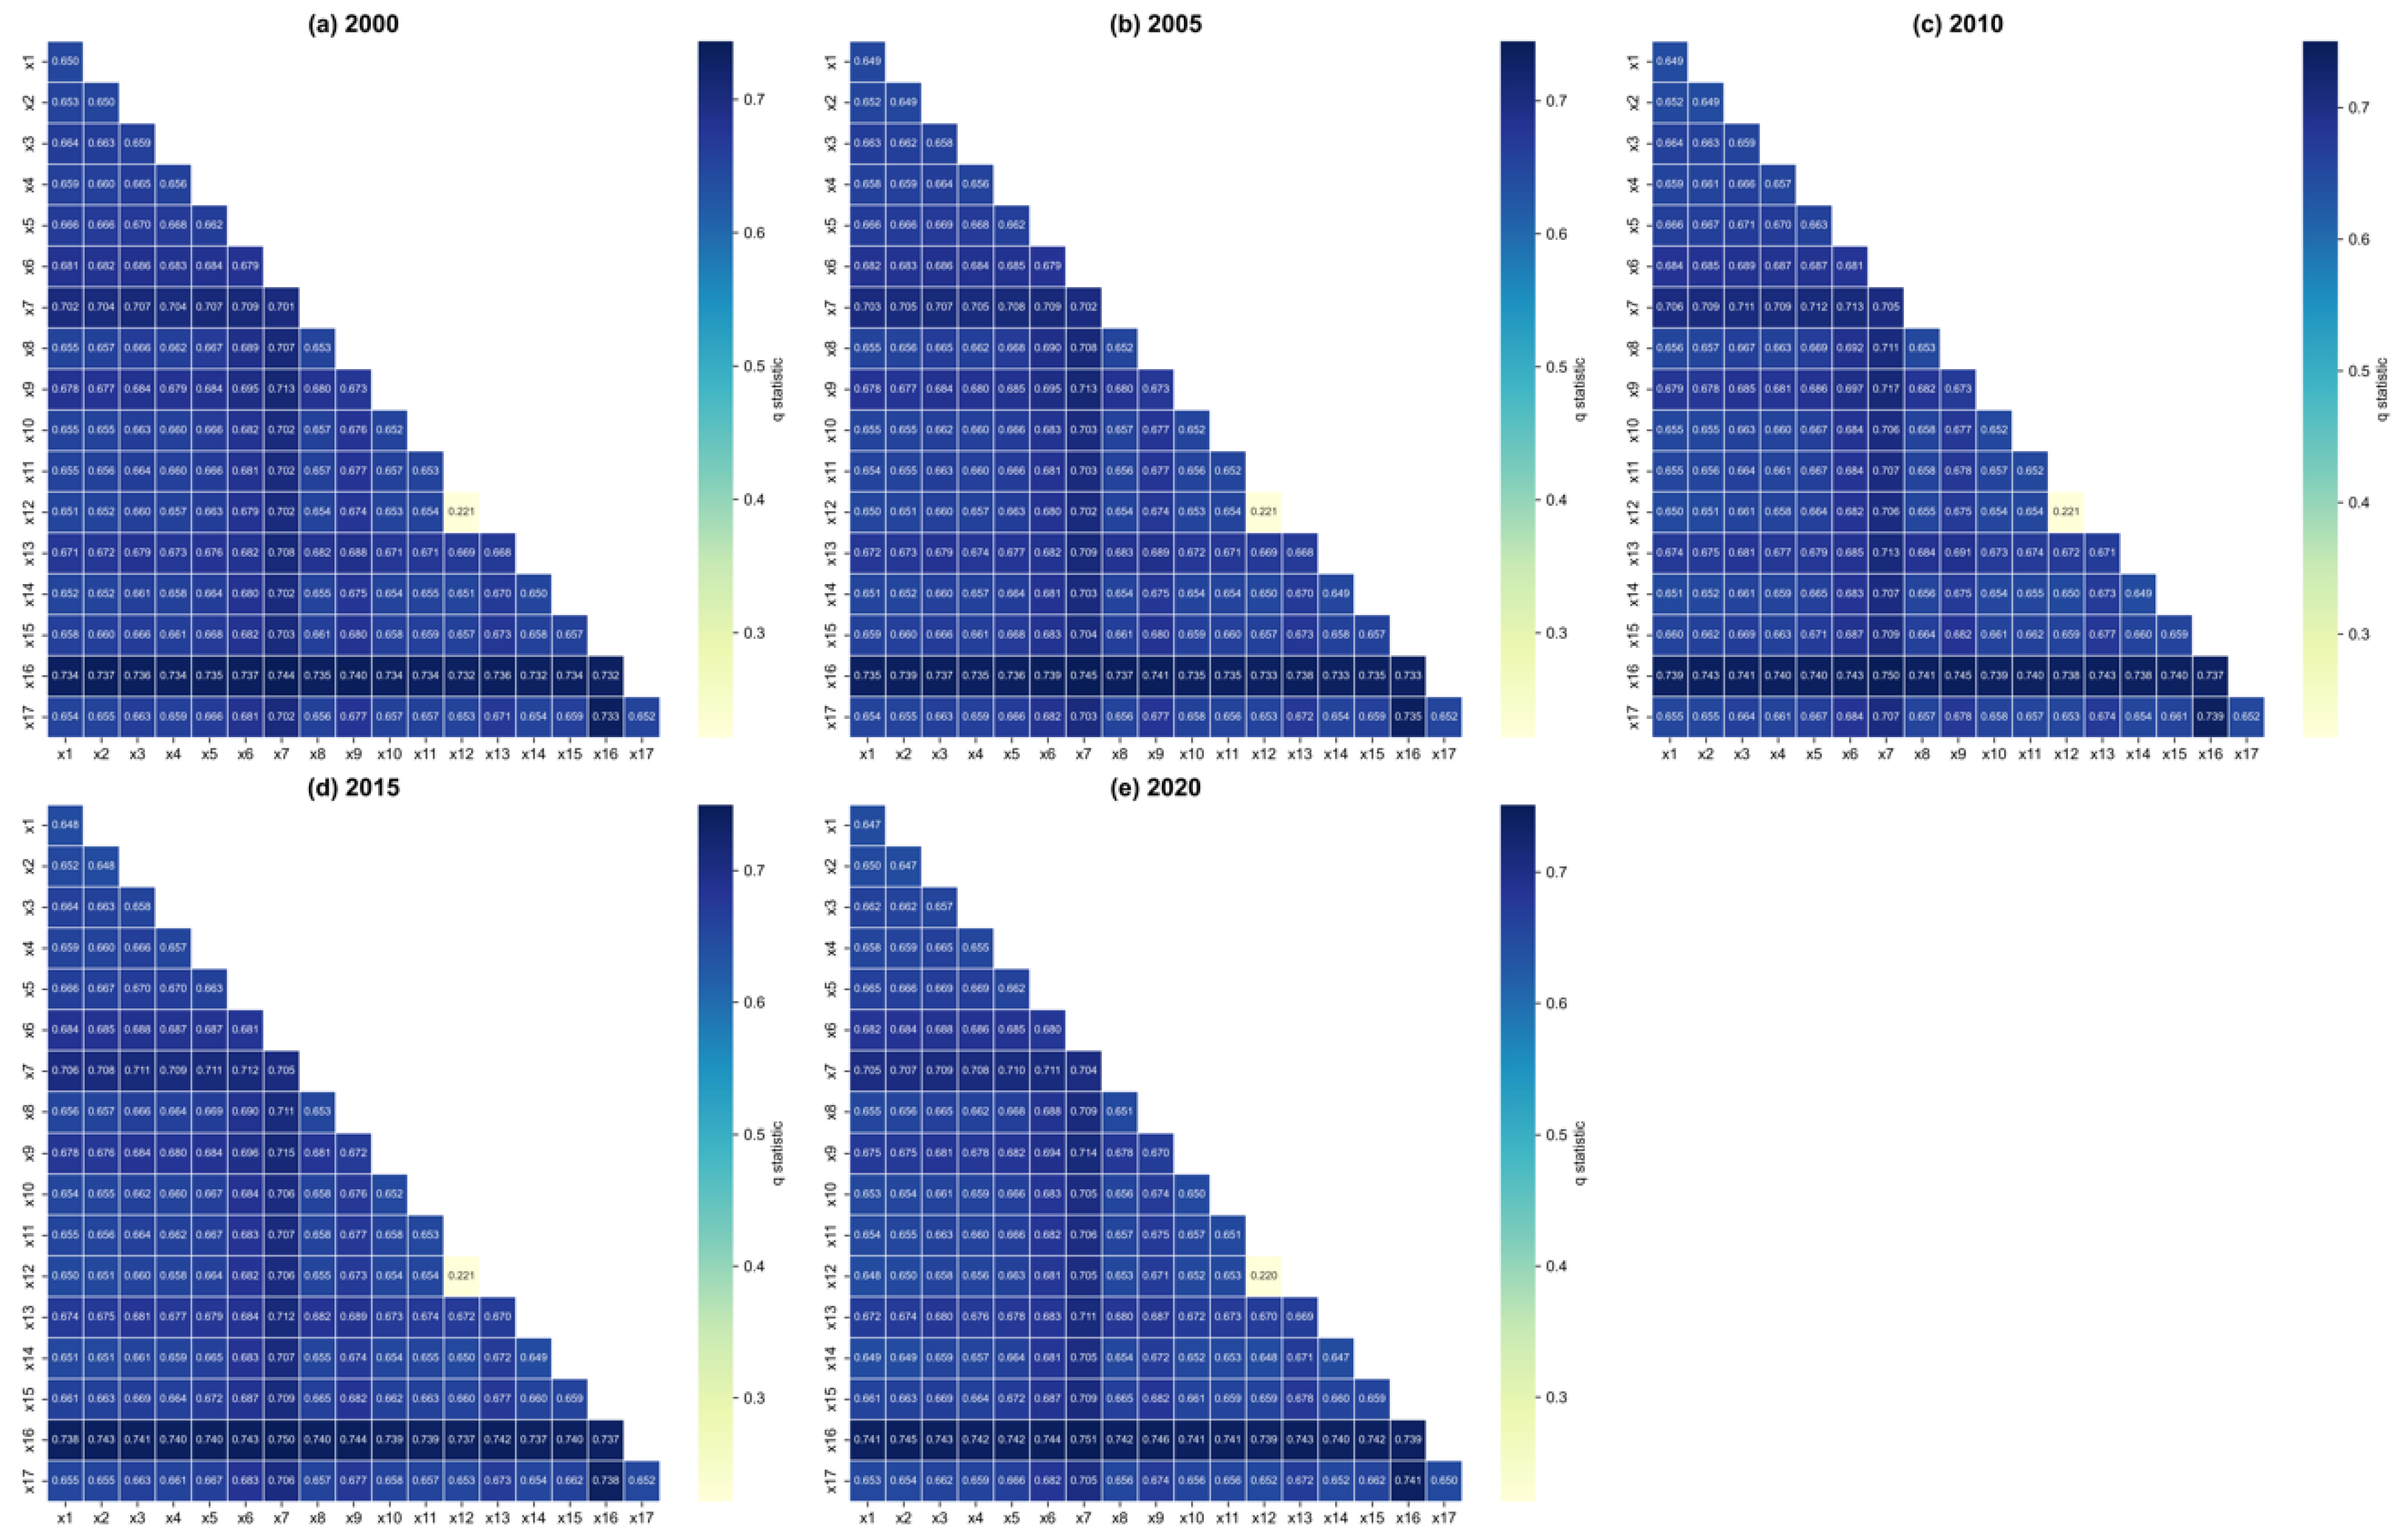
Additionally, the two-factor interactions of drivers influencing carbon storage (Figure 4) further highlighted that, from 2000 to 2020, the interaction between any two driving factors exhibited greater explanatory power for the spatial differentiation of carbon storage than any single factor alone. However, this combined effect was still less than the sum of their explanatory power. This pattern indicates a dual-factor enhancement without evidence of nonlinear weakening, single-linear weakening, independent action, or nonlinear enhancement. The strongest interactive effects from 2000 to 2020 were observed in combinations involving NDVI with soil and slope, all of which had explanatory power exceeding 70%. This further reinforces NDVI’s role as the predominant factor driving the spatial distribution of carbon storage.

3.4. Forecast of Land Use Change for 2030

To ensure the reliability of future simulations, the PLUS model was first validated by utilizing historical land-use data from 2000 and 2010 to reconstruct the 2020 landscape status (Table 6). This validation process yielded a Kappa coefficient of 0.89 and an overall accuracy of 0.96, confirming that the model’s predictive performance aligns with the rigorous requirements of this research. Under the Natural Evolution Scenario (NES), built-up surfaces were projected to expand by 1.621 × 10³ km2 relative to 2020, while cropland and forestland coverage receded by 8.769 × 10² km2 and 4.533 × 10² km2, respectively. In contrast, the Ecological Protection Scenario (EPS) prioritized environmental stewardship, resulting in a substantial augmentation of forestland (1.372 × 10³ km2) and wetland habitats (2.837 × 10² km2), largely at the expense of agricultural land (1.971 × 10³ km2). The Economic Development Scenario (EDS) reflected a paradigm focused on societal infrastructure, characterized by notable increments in both cropland (8.140 × 10² km2) and construction land (2.099 × 10³ km2), albeit coupled with a significant depletion of forest resources (2.642 × 10³ km2). Finally, under the Planned Development Scenario (PDS), cropland area declined by 1.542 × 10³ km2, while both forestland and wetland zones exhibited positive growth of 2.645 × 10² km2 and 2.742 × 10² km2, respectively.

3.5. Changes in Carbon Reserve Under Multiple Scenarios for 2030

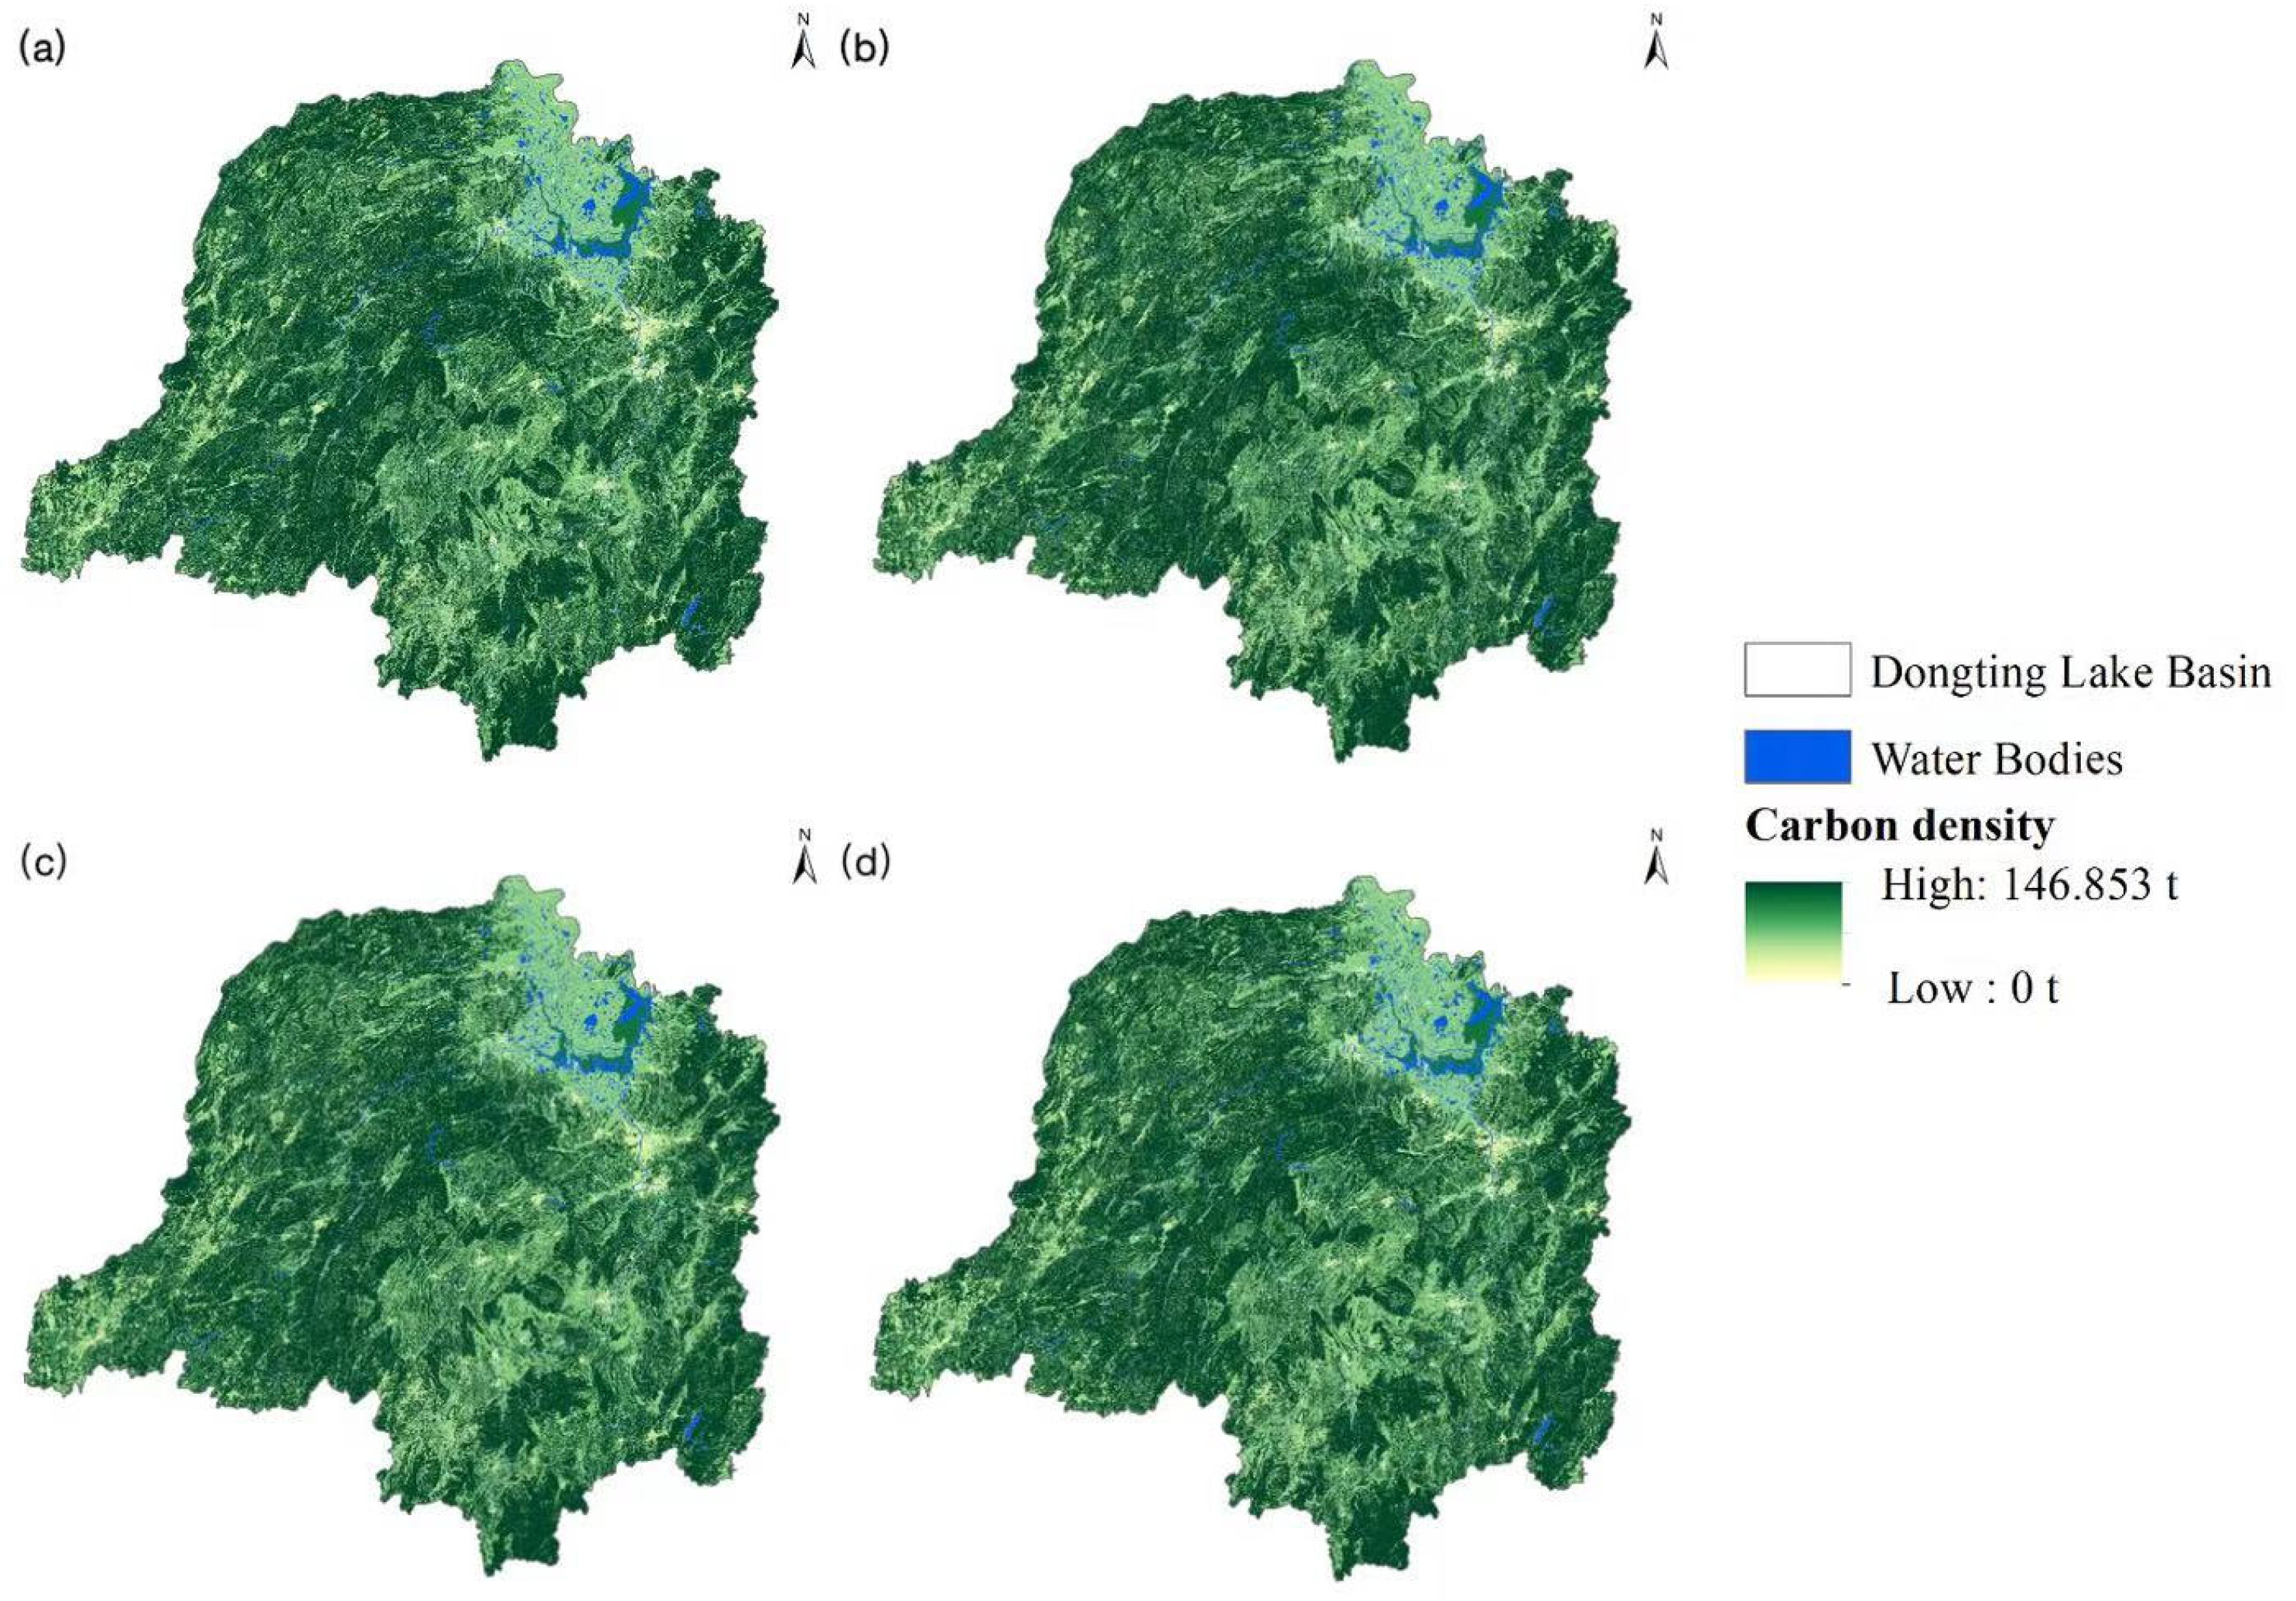
The total carbon storage in the Dongting Lake Basin was predicted to increase only by 1.276 × 10⁷ t under the EPS but was predicted to decrease under the other three scenarios (Table 7). Specifically, EDS resulted in a significant reduction (i.e., 3.292 × 10⁸ t). Across the land use types, grassland had the highest carbon storage, accounting for 78.71% to 79.71% of the total storage, followed by cropland at 16.15% to 16.99%. However, the spatial distribution of carbon storage remained relatively comparable from 2000 to 2000 across all scenarios, with high storage concentrated in forested areas while low storage was found in water bodies and unutilized land (Figure 5).

4. Discussion

4.1. The Responses of Carbon Storage to Land Use Changes from 2000 to 2020

Carbon storage serves as a vital metric for ecosystem service intensity, encapsulating the functional integrity of regional environments [39]. The present investigation analyzed carbon storage trajectories within the Dongting Lake Basin from 2000 to 2020, revealing a tri-phasic “contraction–expansion–contraction” pattern over the two-decade span. Despite this cyclical variability, the region achieved a net carbon stock increment of 3.685 × 10⁶ t, suggesting a reinforced ecosystem service capacity in recent years. However, these trends exhibited significant spatial and temporal heterogeneity, largely governed by transitions in land-use categories. Between 2000 and 2005, carbon storage diminished, primarily driven by the shrinkage of cropland ( 7.633   ×   10 4 km2 to 7.597   ×   10 4 km2), grassland ( 1.530   ×   10 4 km2 to 1.485   ×   10 4 km2), and wetlands ( 1.844   ×   10 3 km2 to 1.784   ×   10 3 km2). These losses were largely precipitated by the proliferation of built-up surfaces, which expanded from 3.277   ×   10 3 km2 to 3.687   ×   10 3 km2, highlighting the adverse anthropogenic footprint on carbon sequestration. Subsequently, from 2005 to 2010, a recovery phase occurred as forestland rose from 1.588   ×   10 5 km2 to 1.605   ×   10 5 km2 and wetlands rebounded to 1.892   ×   10 3 km2.
This augmentation of high-carbon-density landscapes offset previous depletions, underscoring the efficacy of afforestation and hydrological restoration. This gain was reversed from 2010 to 2015 as construction land surged to 5.528   ×   10 3 km2, while cropland and forestland receded to 7.374   ×   10 4 km2 and 1.603   ×   10 5 km2, respectively, illustrating the structural trade-offs necessitated by rapid urbanization. The 2015–2020 interval saw a continued decline, with built-up areas reaching 6.550   ×   10 3 km2. Although wetland conservation efforts increased their extent to 2.180   ×   10 3 km2, the persistent encroachment of impervious surfaces constrained the overall carbon storage potential. Ultimately, these dynamics reflect the tension between urban expansion and ecological stability, where accelerated modernization competes for space with agricultural and natural lands. Nevertheless, an evolving paradigm of environmental stewardship has fostered the expansion of carbon-dense ecological zones, particularly forestlands, indicating an upward shift in regional environmental quality. The revitalization of wetlands and forests demonstrates the constructive impact of recent policy reorientations toward ecological preservation [40]. Furthermore, the moderated decline in agricultural land suggests an emerging equilibrium between food security mandates and environmental protection strategies [41].

4.2. Complex Interactions Between Environmental Factors and Carbon Storage

The results from the single-factor detection indicated that NDVI, which had an average q-value of 0.7357, was the main driver of spatial variation in carbon storage. These findings contrast previous studies that primarily emphasized anthropogenic factors, such as population density and GDP, as driving factors for carbon storage [42]. This discrepancy may be attributed to the unique nature of the Dongting Lake Basin, where the extensive natural vegetation coverage plays a crucial role in shaping the spatial distribution of carbon storage [43]. As a key indicator of vegetation coverage, NDVI can effectively capture the spatial variability of carbon storage in this region [38].
The interactive detection results further showed that between 2000 and 2020, the combined effect of any two driving factors on the spatial distribution of carbon storage exhibited a greater explanatory power than any single factor, following a “dual-factor enhancement” pattern. Notably, the interaction between NDVI and environmental factors, such as soil and slope, explained more than 70% of the spatial variability in carbon storage, reinforcing the role of NDVI as the primary driver of spatial differentiation of carbon storage in the Basin. The strong interaction between NDVI and soil is likely linked to the influence of regional soil types on vegetation cover [44]. Variations in soil nutrient content and water retention capacity directly affect vegetation growth, impacting carbon accumulation and storage [45]. Similarly, a slope can moderate vegetation growth, amplifying its interaction with NDVI [46], highlighting the role of slope in shaping carbon storage patterns.
In summary, NDVI was a key determinant of carbon storage in the Dongting Lake Basin. In addition, it interacted with soil and slope to influence the spatial distribution of carbon storage. These interactions are not merely additive but enhance the spatial variability of carbon storage [47]. Therefore, effective low-carbon development and ecological planning in the Basin should prioritize the combined effects of vegetation cover, soil conditions, and topography to maximize carbon storage.

4.3. Multi-Scenario Forecast of Carbon Storage in the Dongting Lake Basin for 2030

Using the InVEST modeling approach, this study evaluated changes in carbon storage in the Dongting Lake Basin for 2030 under four land-use scenarios: NES, EPS, EDS, and PDS.
(1)
NES: In 2030, the total carbon storage was projected to be 36.428 × 10⁸ t, marking a decline compared to 2020. This decline may primarily be attributed to construction land expansion, encroaching cropland, forestland, and other land-use types with high carbon storage potential. Specifically, carbon storage in cropland decreased from 6.084 × 10⁸ t to 6.011 × 10⁸ t, while forestland saw a reduction from 28.967 × 10⁸ t to 28.885 × 10⁸ t. Grassland and wetland carbon storage also experienced a slight decline. These trends highlight a consistent decline in carbon storage under the NDS, emphasizing the need for ecological protection measures to prevent further losses.
(2)
EPS: By 2030, the total carbon storage was projected to reach 36.65 × 10⁸ t, showing an upward trend. Under this scenario, forestland saw a substantial increase, with carbon storage reaching 29.216 × 10⁸ t—an increase of 2.488 × 10⁷ t compared to 2020. Wetland carbon storage also increased significantly, from 3.270 × 10⁷ t to 3.695 × 10⁷ t. These outcomes underscore that the EPS effectively curtailed the proliferation of built-up surfaces, thereby safeguarding high-carbon-density zones from anthropogenic encroachment and validating the efficacy of habitat conservation initiatives in bolstering regional carbon reservoirs [25,48].
(3)
EDS: In 2030, total carbon storage was projected at 36.20 × 10⁸ t, with a significant decrease of 3.293 × 10⁷ t. This decline is primarily due to the rapid expansion of construction land, which encroached cropland and forestland. Consequently, cropland carbon storage dropped to 6.151 × 10⁸ t, and forestland carbon storage reduced to 28.488 × 10⁸ t. This scenario indicates that prioritizing economic development reduces carbon storage, consistent with Ye et al. [49], who reported a negative correlation between construction land expansion and regional carbon sequestration.
(4)
PDS: The total anticipated carbon storage for 2030 is estimated at 2030 was 36.52 × 10⁸ t. This study quantified the spatiotemporal transitions of land use and carbon storage in the Dongting Lake Basin from 2000 to 2020, highlighting how landscape changes—such as the proliferation of built-up areas and the preservation of forests and wetlands—have reshaped carbon stock dynamics. To simulate future trajectories, the PLUS model was employed to project land-use patterns for 2030 under four divergent scenarios, while the InVEST framework was integrated to predict subsequent fluctuations in carbon storage. Additionally, the Geodetector framework provided a comprehensive analysis of the driving factors governing the spatiotemporal differentiation of carbon storage across the Basin. The objective was to provide a robust scientific foundation for optimizing land-use configurations to bolster ecological integrity and promote balanced economic development. The results offer quantitative insights and strategic guidance for achieving regional carbon neutrality, with a recorded minimum carbon loss of 1.200 × 10⁶ t under the most favorable management trajectory. Specifically, under the PDS, existing forestlands, wetlands, and water bodies are preserved while accommodating essential urbanization demands. Carbon storage within cropland and forestland was estimated at 5.956 × 10⁸ t and 29.015 × 10⁸ t, respectively. Despite moderate urban growth, the strategic prioritization of forest and wetland habitats resulted in a negligible 1.9% reduction in carbon storage compared to the NDS, demonstrating a clear synergy between economic development and carbon sequestration goals.
Of the four scenarios, the EPS proved to be most effective for increasing carbon sequestration, mainly through the protection and expansion of forest and wetland areas. In contrast, the NDS and EDS showed a significant decline in carbon storage, likely due to the expansion of construction land, which encroaches on high carbon density areas, such as croplands and forests. These results are consistent with similar studies in other regions, reinforcing the detrimental impact of unregulated construction on carbon storage [50]. Meanwhile, the PDS achieved a moderate expansion of construction land while protecting forests, wetlands, and water bodies. This approach strikes a favorable balance between ecological preservation and economic growth, supporting regional development while minimizing the impact on carbon storage and maintaining critical carbon sequestration functions.
Studies have suggested that wetlands and water bodies are significant carbon sinks under frequent water-logging conditions. However, when these ecosystems are disturbed by drainage or destruction, the accumulated organic matter decomposes more rapidly, becoming a carbon source [51]. The higher the wetland aggregation, the stronger their carbon sequestration capacity [52]. Therefore, land use policies should prioritize preserving natural wetlands—such as rivers, lakes, and marshes—and maintaining their natural state to enhance regional carbon sequestration. Nevertheless, future land use planning should prioritize ecological protection and planned development. This includes safeguarding forests, limiting the expansion of construction areas, and preserving wetland aggregation to strengthen regional carbon sequestration and reduce carbon loss.

4.4. Limitations and Future Research

This study used existing research to derive carbon pool parameters through model calibration. Unlike the approaches that rely on national carbon density values [53,54], model calibration offers improved regional applicability, though it remains less precise than direct sampling and survey data. The InVEST framework, while useful, has some limitations, such as assuming fixed carbon storage levels for all land use types. This approach overlooks annual differences in carbon density driven by changes in vegetation age structure and soil microbial activity [55]. Furthermore, the 30 m spatial resolution of the input data may introduce minor uncertainties at the complex land-water interfaces of the basin. Therefore, future studies should integrate field sampling with predictive modeling to improve the accuracy of carbon storage assessments. Building on prior studies [56,57,58], this study selected 17 representative indicators but did not account for the potential effects of climate change on future land use changes. Additionally, while the transition mechanisms identified here are specific to the “river-lake” context of the Dongting Lake Basin, their generalizability to other geographical regions requires further validation. Future studies should refine the selection of driving factors and incorporate climate influence on land use dynamics to improve model applicability. Moving forward, we should adopt more comprehensive evaluation methods to track carbon stock changes in the Dongting Lake basin, providing targeted scientific support for its protection and management.

5. Conclusions

This study quantified the spatiotemporal dynamics of carbon storage across the Dongting Lake watershed from 2000 to 2020. Our findings delineate a temporal trajectory marked by non-linear fluctuations—specifically a “declining–recovering–declining” sequence—largely dictated by variations in the NDVI, which emerged as the paramount determinant governing the spatial heterogeneity of carbon stocks. Predictive modeling for 2030 across divergent pathways suggests that land-use policy interventions significantly modulate the carbon-storage efficacy of diverse terrestrial ecosystems. While the Ecological Protection Scenario (EPS) yielded the maximum potential for carbon accumulation, the Planned Development Scenario (PDS) effectively mitigated carbon depletion while concurrently accommodating regional economic objectives. Consequently, we advocate for a management paradigm that prioritizes ecological integrity alongside strategic development to bolster the Basin’s carbon reservoirs. Critical interventions should involve curbing the unchecked proliferation of built-up surfaces and fortifying the preservation of sylvatic and lacustrine habitats, particularly in zones exhibiting high sensitivity to landscape transitions. These insights provide a robust empirical foundation for tailoring regional carbon management and ecological restoration strategies, supporting China’s overarching “carbon neutrality” objectives.

Author Contributions

Q.L. and J.Z.: Writing—original draft, Methodology, Software, Visualization, Investigation. C.Z.: Funding acquisition, Visualization. J.L.: Funding acquisition, Visualization. F.L.: Conceptualization, Writing—review & editing, Investigation, Project administration. H.X.: Funding acquisition, Writing—review, Project administration. All authors have read and agreed to the published version of the manuscript.

Funding

The research received financial support from various sources, including the National Natural Science Foundation of China (42474052), the Hunan Science Fund for Distinguished Young Scholars (2024JJ2100); National Natural Science Foundation project of Hunan Province (2022JJ31000), the National Natural Science Foundation of China (31470642), and the Key R&D Project of the Ministry of Science and Technology of China during the 14th Five-Year Plan (2022YFD220050).

Institutional Review Board Statement

Not applicable.

Informed Consent Statement

Not applicable.

Data Availability Statement

The data presented in this study are available upon request from the corresponding author. The data are not publicly available due to the constraint in the consent.

Conflicts of Interest

The authors declare no conflicts of interest.

References

  1. Yang, Y.; Shi, Y.; Sun, W.; Chang, J.; Zhu, J.; Chen, L.; Wang, X.; Guo, Y.; Zhang, H.; Yu, L.; et al. Terrestrial carbon sinks in China and around the world and their contribution to carbon neutrality. Sci. China Life Sci. 2022, 65, 861–895. [Google Scholar] [CrossRef] [Scilit]
  2. Piao, S.; Yue, C.; Ding, J.; Guo, Z. Perspectives on the role of terrestrial ecosystems in the ‘carbon neutrality’strategy. Sci. China Earth Sci. 2022, 61, 1178–1186. [Google Scholar] [CrossRef] [Scilit]
  3. Xu, L.; Yu, G.; He, N.; Wang, Q.; Gao, Y.; Wen, D.; Li, S.; Niu, S.; Ge, J. Carbon storage in China’s terrestrial ecosystems: A synthesis. Sci. Rep. 2018, 8, 2806. [Google Scholar] [CrossRef] [Scilit] [PubMed]
  4. Mallapaty, S. How China could be carbon neutral by mid-century. Nature 2020, 586, 482–483. [Google Scholar] [CrossRef] [Scilit] [PubMed]
  5. Xu, L.; Yu, G.; He, N. Increased soil organic carbon storage in Chinese terrestrial ecosystems from the 1980s to the 2010s. J. Geogr. Sci. 2019, 29, 49–66. [Google Scholar] [CrossRef] [Scilit]
  6. Fernández-Martínez, M.; Peñuelas, J.; Chevallier, F.; Ciais, P.; Obersteiner, M.; Rödenbeck, C.; Sardans, J.; Vicca, S.; Yang, H.; Sitch, S.; et al. Diagnosing destabilization risk in global land carbon sinks. Nature 2023, 615, 848–853. [Google Scholar] [CrossRef] [Scilit]
  7. Posne, R.S.; Verutes, G.; Koh, I. Global use of ecosystem service models. Ecosyst. Serv. 2016, 17, 131–141. [Google Scholar] [CrossRef] [Scilit]
  8. Caspersen, J.P.; Pacala, S.W.; Jenkins, J.C.; Hurtt, G.C.; Moorcroft, P.R.; Birdsey, R.A. Contributions of Land-Use History to Carbon Accumulation in U.S. Forests. Science 2000, 290, 1148–1151. [Google Scholar] [CrossRef] [Scilit]
  9. Bo-ji, F. Land-use change and ecosystem services:concepts, methods and progress. Prog. Geogr. 2014, 33, 441–446. [Google Scholar]
  10. Olson, D.; Dinerstein, E. The Global 200: A Representation Approach to Conserving the Earth’s Most Biologically Valuable Ecoregions. Conserv. Biol. 1998, 12, 502–515. [Google Scholar] [CrossRef] [Scilit]
  11. Cao, L.; Barter, M.; Lei, G. New Anatidae population estimates for eastern China: Implications for current flyway estimates. Biol. Conserv. 2008, 141, 2301–2309. [Google Scholar] [CrossRef] [Scilit]
  12. Xie, Y.-H.; Chen, X.-S. Effects of Three-Gorge Project on succession of wetland vegetation in Dongting Lake. Res. Agric. Mod. 2008, 29, 684–687. [Google Scholar]
  13. Wang, S.; Feng, H.; Zou, B.; Yang, Z.; Wang, S. Vegetation Greening Enhanced the Regional Terrestrial Carbon Uptake in the Dongting Lake Basin of China. Forests 2023, 14, 768. [Google Scholar] [CrossRef] [Scilit]
  14. Kong, L.; Lu, F.; Rao, E.; Ouyang, Z. Carbon Sink under Different Carbon Density Levels of Forest and Shrub, a Case in Dongting Lake Basin, China. Remote Sens. 2022, 14, 2672. [Google Scholar] [CrossRef] [Scilit]
  15. Zheng, H.; Peng, J.; Qiu, S.; Xu, Z.; Zhou, F.; Xia, P.; Adalibieke, W. Distinguishing the impacts of land use change in intensity and type on ecosystem services trade-offs. J. Environ. Manag. 2022, 316, 115206. [Google Scholar] [CrossRef] [Scilit] [PubMed]
  16. Wu, J.; Jia, P.; Feng, T.; Li, H.; Kuang, H.; Zhang, J. Uncovering the Spatiotemporal Impacts of Built Environment on Traffic Carbon Emissions Using Multi-Source Big Data. Land Use Policy 2023, 129, 106621. [Google Scholar] [CrossRef] [Scilit]
  17. Kong, L.; Hua, Z.; Ouyang, Z. Ecological protection and restoration of forest, wetland, grassland and cropland based on the perspective of ecosystem services: A case study in Dongting Lake Watershed. Acta Ecol. Sin. 2019, 39, 8903–8910. [Google Scholar] [CrossRef] [Scilit]
  18. Liu, M.; Liu, C.; Wang, K.-L. Eco-security in Dongting Lake watershed: Its changes and relevant driving forces. Chin. J. Ecol. 2007, 26, 1271–1276. [Google Scholar]
  19. Sun, Z.; Huang, Q.; Opp, C.; Hennig, T.; Marold, U. Impacts and Implications of Major Changes Caused by the Three Gorges Dam in the Middle Reaches of the Yangtze River, China. Water Resour. Manag. 2012, 26, 3367–3378. [Google Scholar] [CrossRef] [Scilit]
  20. Liang, X.; Guan, Q.; Clarke, K.C.; Liu, S.; Wang, B.; Yao, Y. Understanding the drivers of sustainable land expansion using a patch-generating land use simulation (PLUS) model: A case study in Wuhan, China. Comput. Environ. Urban Syst. 2021, 85, 101569. [Google Scholar] [CrossRef] [Scilit]
  21. Sharp, R.; Chaplin-Kramer, R.; Wood, S.; Guerry, A.; Tallis, H.; Ricketts, T.; Nelson, E.; Ennaanay, D.; Wolny, S.; Olwero, N.; et al. InVEST User’s Guide; The Natural Capital Project: Stanford, CA, USA, 2018. [Google Scholar]
  22. Wang, J.F.; Li, X.H.; Christakos, G.; Liao, Y.L.; Zhang, T.; Gu, X.; Zheng, X.Y. Geographical Detectors-Based Health Risk Assessment and its Application in the Neural Tube Defects Study of the Heshun Region, China. Int. J. Geogr. Inf. Sci. 2010, 24, 107–127. [Google Scholar] [CrossRef] [Scilit]
  23. Qin, M.; Zhao, Y.; Liu, Y.; Jiang, H.; Li, H.; Zhu, Z. Multi-scenario Simulation for 2060 and Driving Factors of the Eco-spatial Carbon Sink in the Beibu Gulf Urban Agglomeration, China. Chin. Geogr. Sci. 2023, 33, 85–101. [Google Scholar] [CrossRef] [Scilit]
  24. Li, P.; Chen, J.; Li, Y.; Wu, W. Using the InVEST-PLUS Model to Predict and Analyze the Pattern of Ecosystem Carbon storage in Liaoning Province, China. Remote Sens. 2023, 15, 4050. [Google Scholar] [CrossRef] [Scilit]
  25. Zhao, M.; He, Z.; Du, J.; Chen, L.; Lin, P.; Fang, S. Assessing the effects of ecological engineering on carbon storage by linking the CA-Markov and InVEST models. Ecol. Indic. 2019, 98, 29–38. [Google Scholar] [CrossRef] [Scilit]
  26. Bi, F.; Wu, Z.; Liang, H.; Du, Z.; Lei, T.; Sun, B. Spatio-temporal Changes and Driving Factors of Carbon Storage in the Middle Reaches of the Yellow River Based on PLUS-InVEST-GeoDetector Model. Environ. Sci. 2025, 46, 4742–4753. [Google Scholar] [CrossRef] [Scilit]
  27. Zhi, F.; Zhou, Z.; Zhao, M.; Yang, Z.; Gao, C. Temporal and Spatial Evolution of Habitat Quality and Influencing Factors in Hefei City Based on InVEST and Geodetector Model. J. Hebei Univ. Environ. Eng. 2024, 34, 49–54. [Google Scholar] [CrossRef]
  28. Wu, D.; Ma, P.; Li, L.; Li, Z.; Liang, Y. Spatiotemporal Variation and Factor Detection of Land Use Transition Based on Geodetector: A Case Study of Zhuhai. J. South China Norm. Univ. (Nat. Sci. Ed.) 2023, 55, 50–61. [Google Scholar]
  29. Liu, R.; Dong, J.; Jiang, L.; Ge, Y.; Fan, C.; Yang, T.; Zhang, G. Agricultural flood resistance enhanced after returning farmlands to lakes. Proc. Natl. Acad. Sci. USA 2024, 121, e2410967121. [Google Scholar] [CrossRef] [Scilit]
  30. Ma, S.; Wang, L.; Wang, H.; Zhang, X.; Jiang, J. Spatial heterogeneity of ecosystem services in response to landscape patterns under the Grain for Green Program: A case-study in Kaihua County, China. Land Degrad. Dev. 2022, 33, 1901–1916. [Google Scholar] [CrossRef] [Scilit]
  31. Zhang, X.; Zhang, Q.; Zhang, G.; Nie, Z.; Gui, Z. A Hybrid Model for Annual Runoff Time Series Forecasting Using Elman Neural Network with Ensemble Empirical Mode Decomposition. Water 2018, 10, 416. [Google Scholar] [CrossRef] [Scilit]
  32. Zhang, J.; Zhu, L.; Yang, F. Evaluation of Typical Ecosystem Services and Trade-Offs/Synergies in Dongting Lake Basin. Resour. Environ. Yangtze Basin 2024, 33, 1702–1714. [Google Scholar]
  33. Yuan, B.; Fu, L.; Zou, Y.; Zhang, S.; Chen, X.; Li, F.; Deng, Z.; Xie, Y. Spatiotemporal change detection of ecological quality and the associated affecting factors in Dongting Lake Basin, based on RSEI. J. Clean. Prod. 2021, 302, 126995. [Google Scholar] [CrossRef] [Scilit]
  34. Zhou, W.; Han, Y.; Wang, J.; Yang, L.; Que, H. Spatiotemporal heterogeneity and driving forces of carbon storage in the Dongting Lake Basin. China Environ. Sci. 2024, 44, 1851–1862. [Google Scholar] [CrossRef]
  35. Xu, L.; He, N.; Yu, G. A dataset of carbon density in Chinese terrestrial ecosystems (2010s). China Sci. Data 2019, 4, 86–92. [Google Scholar] [CrossRef] [Scilit]
  36. An, X.X.; Jin, W.P.; Long, X.R.; Chen, S.D.; Qi, S.Y.; Zhang, M. Spatial and temporal evolution of carbon stocks in Dongting Lake wetlands based on remote sensing data. Geocarto Int. 2022, 37, 14983–15009. [Google Scholar] [CrossRef] [Scilit]
  37. Wang, H.; Wang, L.; Li, Z.; Hou, Y.; Nie, X. Response of Carbon Storage Evolution to Future Climate and Policy at the Basin Scale. Environ. Sci. 2024, 45, 6870–6880. [Google Scholar] [CrossRef] [Scilit]
  38. Zhang, M.; Wang, K.; Chen, H.; Zhang, C.; Liu, H.; YUE, Y.; Fan, F. Quantified evaluation and analysis of ecosystem services in Karst areas based on remote sensing. Acta Ecol. Sin. 2009, 29, 5891–5901. [Google Scholar]
  39. Yang, Y.; Zheng, H.; Kong, L.; Huang, B.; Xu, W.; Ouyang, Z. Mapping ecosystem services bundles to detect high- and low-value ecosystem services areas for land use management. J. Clean. Prod. 2019, 225, 11–17. [Google Scholar] [CrossRef] [Scilit]
  40. Tao, W.; Wang, K.; Chen, H.; Zhang, M. Evaluation of ecological carrying capacity of “re-submerging polders” of Dongting Lake. Chin. J. Eco-Agric. 2007, 15, 155–160. [Google Scholar]
  41. Tan, S.; Peng, B. Determinants of cultivated land utilization in China and new thoughts for adjustment. Resour. Sci. 2002, 24, 7. [Google Scholar]
  42. Shi, J.; Shi, P.; Wang, Z.; Cheng, F. Spatial-Temporal Evolution and Prediction of Carbon Storage in Jiuquan City Ecosystem Based on PLUS-InVEST Model. Environ. Sci. 2024, 45, 300–313. [Google Scholar] [CrossRef] [Scilit]
  43. Yang, L.; Deng, M.; Wang, J.; Que, H. Spatial-temporal evolution of land use and ecological risk in Dongting Lake Basin during 1980–2018. Acta Ecol. Sin. 2021, 41, 3929–3939. [Google Scholar]
  44. Peng, W.; Kuang, T.; Tao, S. Quantifying influences of natural factors on vegetation NDVI changes based on geographical detector in Sichuan, western China. J. Clean. Prod. 2019, 233, 353–367. [Google Scholar] [CrossRef] [Scilit]
  45. Wang, S.; Yang, L.; Duan, X.; Huang, Y.; Feng, Q. Trade-off Effects of Soil Moisture and Soil Nutrients under Vegetation Restoration in a Small Watershed on the Loess Plateau, China. Chin. J. Soil Sci. 2022, 53, 356–365. [Google Scholar] [CrossRef]
  46. Li, W.; Tan, M. Influences of vertical differences in population emigration on mountainous vegetation greenness: A case study in the Taihang Mountains. Sci. Rep. 2018, 8, 16954. [Google Scholar] [CrossRef] [Scilit]
  47. Zeng, Q.; Sun, C. Estimation and influencing factors of carbon storage in terrestrial ecosystems in the Yellow River Basin. Acta Ecol. Sin. 2024, 44, 5476–5493. [Google Scholar] [CrossRef]
  48. Li, K.; Cao, J.; Adamowski, J.F.; Biswas, A.; Zhou, J.; Liu, Y.; Zhang, Y.; Liu, C.; Dong, X.; Qin, Y. Assessing the effects of ecological engineering on spatiotemporal dynamics of carbon storage from 2000 to 2016 in the Loess Plateau area using the InVEST model: A case study in Huining County, China. Environ. Dev. 2021, 39, 100641. [Google Scholar] [CrossRef] [Scilit]
  49. Ye, X.; Chuai, X. Carbon sinks/sources’ spatiotemporal evolution in China and its response to built-up land expansion. J. Environ. Manag. 2022, 321, 115863. [Google Scholar] [CrossRef] [Scilit] [PubMed]
  50. Zhang, B.; Li, L.; Xia, Q.; Dong, J. Land use change and its impact on carbon storage under the constraints of “three lines”: A case study of Wuhan City circle. Acta Ecol. Sin. 2022, 42, 2265–2280. [Google Scholar] [CrossRef] [Scilit]
  51. Yao, C.; Wang, Q.; Jiang, X.; Guo, Y.; Wang, K.; Wu, Z.; Che, F.; Chen, J. Review of lake ecosystem’s characteristics of carbon sink and potential value on carbon neutrality. Acta Ecol. Sin. 2023, 43, 893–909. [Google Scholar] [CrossRef] [Scilit]
  52. Fan, Y.; Xia, Z.; Wei, X.; Liu, L.; Yuan, C. The Response of Wetland Ecosystem Services to Landscape Pattern of the Yangtze River Economic Belt during Four Periods. Wetl. Sci. 2024, 22, 139–147. [Google Scholar] [CrossRef]
  53. Wang, Z.; Li, X.; Mao, Y.; Li, L.; Wang, X.; Lin, Q. Dynamic simulation of land use change and assessment of carbon storage based on climate change scenarios at the city level: A case study of Bortala, China. Ecol. Indic. 2022, 134, 108499. [Google Scholar] [CrossRef] [Scilit]
  54. Chen, D.; Jiang, P.; Li, M. Assessing potential ecosystem service dynamics driven by urbanization in the Yangtze River Economic Belt, China. J. Environ. Manag. 2021, 292, 112734. [Google Scholar] [CrossRef] [Scilit] [PubMed]
  55. Tang, L.; Ke, X.; Zhou, T.; Zheng, W.; Wang, L. Impacts of cropland expansion on carbon storage: A case study in Hubei, China. J Environ. Manag. 2020, 265, 110515. [Google Scholar] [CrossRef] [Scilit] [PubMed]
  56. Hu, W.; Li, G.; Gao, Z.; Jia, G.; Wang, Z.; Li, Y. Assessment of the impact of the Poplar Ecological Retreat Project on water conservation in the Dongting Lake wetland region using the InVEST model. Sci. Total Environ. 2020, 733, 139423. [Google Scholar] [CrossRef] [Scilit]
  57. Qi, Q.; Zhang, D.; Tong, S.; Zhang, M.; Wang, X.; An, Y.; Lu, X. The driving mechanisms for community expansion in a restored Carex tussock wetland. Ecol. Indic. 2021, 121, 107040. [Google Scholar] [CrossRef] [Scilit]
  58. Tan, J.; Zhao, S.; Tan, X.; Dong, L.; Liu, J.; Ji, Q. Change characteristics of land use and landscape pattern in Dongting Lake during 1996–2016. Ecol. Sci. 2017, 36, 89–97. [Google Scholar]
Figure 1. Geographical location map of the Dongting Lake Basin.
Sustainability 18 02543 g001
Figure 2. Land-use transfer for Dongting Lake Basin from 2000 to 2020 in km2.
Sustainability 18 02543 g002
Figure 3. Spatiotemporal distribution of the carbon storage in Dongting Lake Basin from 2000 to 2020: (a) 2000; (b) 2005; (c) 2010; (d) 2015; (e) 2020.
Sustainability 18 02543 g003
Figure 4. Two-factor interactions of drivers influencing carbon storage in the Dongting Lake Basin.
Sustainability 18 02543 g004
Figure 5. Carbon stock distribution projections in Dongting Lake Basin under different scenarios for 2030: (a) NES; (b) EPS; (c) EDS; (d) PDS.
Sustainability 18 02543 g005
Table 1. Datasets and their specifications for the Dongting Lake Basin.
CategoryVariableData Source
Land Use Multi-temporal Land-Use (2000–2020)Resource and Environmental Science Data Platform
(https://www.resdc.cn/, accessed on 9 June 2025)
Restricted Areas Middle Yangtze River City ClusterMiddle Yangtze River Geoscience Data Center
(https://cjgeodata.cug.edu.cn/, accessed on 9 June 2025)
Chengdu-Chongqing Urban AgglomerationNational Catalogue Service For Geographic Information (https://www.webmap.cn/, accessed on 9 June 2025)
Socio-economic Nighttime LightHarvard Dataverse
(https://dataverse.harvard.edu, accessed on 9 June 2025)
Population DensityLandscan
(https://landscan.ornl.gov/, accessed on 9 June 2025)
GDPResource and Environmental Science Date Platform
(https://www.resdc.cn/, accessed on 9 June 2025)
Distance Factor Distance to RailroadOpen Street Map
(https://www.openstreetmap.org/, accessed on 9 June 2025)
Distance to Highway
Distance to Primary Road
Distance to Secondary Road
Distance to the City Center
Natural Factor Soil TypeInstitute of Tibetan Plateau Research
(http://data.tpdc.ac.cn, accessed on 9 June 2025)
Distance to RiverOpenStreetMap
(https://www.openstreetmap.org/, accessed on 9 June 2025)
NDVIInstitute of Tibetan Plateau Research
(http://data.tpdc.ac.cn, accessed on 9 June 2025)
Average Annual Temperature
Average Annual Precipitation
DEMGeospatial Date Cloud (http://www.gscloud.cn, accessed on 9 June 2025)
Slope
Aspect
Table 2. Initial carbon density across different land use types in the Dongting Lake Basin.
Land Use Type C a b o v e Cbelow C s o i l Cdead
Cropland1.800.3580.960
Forestland41.468.681301.16
Grassland0.550.1463.420.06
Water bodies0000
Construction land0044.150
Unused land0030.470
Wetland3.5713.89131.610.95
Table 3. Land use transfer matrix for Dongting Lake Basin, 2000–2020, in km2.
20002020
CroplandForestlandGrasslandWater BodiesConstruction LandUnused LandWetlandTotal AreaTransfer Out
Cropland68,372.06 km24744.36 km2283.39 km2752.91 km22062.86 km22.41 km2108.59 km276,326.58 km27954.524 km2
Forestland3595.75 km2152,570.62 km2538.88 km2351.18 km21440.46 km212.82 km220.78 km2158,530.50 km25959.88 km2
Grassland434.45 km22133.82 km212,515.28 km245.68 km2128.46 km20.82 km238.26 km215,296.76 km22781.48 km2
Water bodies333.33 km2181.73 km28.98 km25157.85 km262.43 km20.17 km2635.99 km26380.48 km21222.63 km2
Construction land256.54 km2126.00 km210.58 km235.27 km22843.42 km20.20 km25.14 km23277.15 km2433.73 km2
Unused land1.88 km25.48 km21.16 km20.45 km22.43 km213.19 km20.19 km224.79 km211.59 km2
Wetland206.87 km213.96 km22.59 km2238.46 km210.39 km21.30 km21370.63 km21844.21 km2473.58 km2
Total Area73,200.89 km2159,775.97 km213,360.87 km26581.80 km26550.45 km230.92 km22179.58 km2261,680.47 km2
Transfer in4828.83 km27205.35 km2845.59 km21423.96 km23707.02 km217.72 km2808.96 km2
Table 4. Land use carbon stocks (t) in Dongting Lake Basin from 2000 to 2020.
Land Use Type20002005201020152020
Crop Land6.344 × 108 t6.314 × 108 t6.169 × 108 t6.129 × 108 t6.084 × 108 t
Forestland28.742 × 108 t28.785 × 108 t29.107 × 108 t29.061 × 108 t28.967 × 108 t
Grassland0.981 × 108 t0.953 × 108 t0.870 × 108 t0.865 × 108 t0.857 × 108 t
Water bodies0 t0 t0 t0 t0 t
Construction Land0.145 × 108 t0.163 × 108 t0.210 × 108 t0.244 × 108 t0.289 × 108 t
Unused Land0.755 × 105 t0.681 × 105 t1.092 × 105 t1.085 × 105 t0.942 × 105 t
Wetland0.277 × 108 t0.268 × 108 t0.284 × 108 t0.325 × 108 t0.327 × 108 t
Total 36.49 × 10⁸ t36.48 × 108 t36.64 × 108 t36.63 × 108 t36.52 × 108 t
Table 5. The q-statistics of driving factors for the spatial variation of carbon storage in the Dongting Lake Basin from 2000 to 2020.
Driver Factorq
20002005201020152020Average Value
Railroad (×1)0.6496 0.6490 0.6486 0.6484 0.6465 0.6484
Aspect (×2)0.6502 0.6494 0.6488 0.6484 0.6468 0.6487
Rainfall (×3)0.6590 0.6581 0.6589 0.6584 0.6567 0.6583
City center (×4)0.6562 0.6559 0.6568 0.6568 0.6551 0.6562
River (×5)0.6621 0.6621 0.6631 0.6626 0.6615 0.6623
DEM (×6)0.6785 0.6791 0.6813 0.6810 0.6797 0.6799
Slope (×7)0.7012 0.7017 0.7053 0.7051 0.7038 0.7034
Evapotranspiration (×8)0.6526 0.6523 0.6530 0.6530 0.6515 0.6525
Soil (×9)0.6728 0.6727 0.6729 0.6718 0.6695 0.6720
Expressway (×10)0.6522 0.6519 0.6519 0.6519 0.6502 0.6516
Subsidiary road (×11)0.6528 0.6523 0.6524 0.6526 0.6512 0.6523
GDP (×12)0.2213 0.2212 0.2213 0.2212 0.2204 0.2211
Temperature (×13)0.6682 0.6685 0.6706 0.6702 0.6691 0.6693
Population (×14)0.6500 0.6495 0.6490 0.6486 0.6465 0.6487
NL (×15)0.6567 0.6571 0.6588 0.6595 0.6592 0.6583
NDVI (×16)0.7320 0.7331 0.7375 0.7368 0.7390 0.7357
Trunk road (×17)0.6519 0.6517 0.6516 0.6516 0.6500 0.6514
Table 6. Multi-scenario land-use demand prediction for 2030 in km2.
Land Use TypeNESEPSEDSPDS
20302020~203020302020~203020302020~203020302020~2030
Cropland72,323.99 km2−876.90 km271,229.73 km2−1971.16 km274,014.91 km2814.02 km271,658.84 km2−1542.05 km2
Forestland159,322.63 km2−453.33 km2161,148.03 km21372.06 km2157,133.97 km2−2642.00 km2160,040.49 km2264.52 km2
Grassland13,174.32 km2−186.55 km212,907.66 km2−453.21 km213,017.69 km2−343.18 km213,084.53 km2−276.34 km2
Water bodies6515.95 km2−65.85 km26691.67 km2109.87 km26581.80 km20 km26603.86 km222.06 km2
Construction land8171.32 km21620.87 km27214.73 km2664.29 km28649.14 km22098.69 km27812.73 km21262.29 km2
Unused Land27.18 km2−3.74 km225.39 km2−5.53 km226.24 km2−4.68 km226.20 km2−4.72 km2
Wetland2145.08 km2−34.50 km22463.27 km2283.69 km22256.73 km277.15 km22453.83 km2274.25 km2
Table 7. Land use structure and carbon stock projections in Dongting Lake Basin for 2030 in tons.
Land Use TypeNESEPSEDSPDS
Cropland6.011 × 108 t5.920 × 108 t6.151 × 108 t5.956 × 108 t
Forestland28.885 × 108 t29.216 × 108 t28.488 × 108 t29.015 × 108 t
Grassland0.845 × 108 t0.828 × 108 t0.835 × 108 t0.839 × 108 t
Water bodies0000
Construction land0.361 × 108 t0.319 × 108 t0.382 × 108 t0.345 × 108 t
Unused land0.828 × 105 t0.773 × 105 t0.799 × 105 t0.798 × 105 t
Wetland0.322 × 108 t0.370 × 108 t0.339 × 108 t0.368 × 108 t
Total36.428 × 108 t36.65 × 108 t36.20 × 108 t36.52 × 108 t
Disclaimer/Publisher’s Note: The statements, opinions and data contained in all publications are solely those of the individual author(s) and contributor(s) and not of MDPI and/or the editor(s). MDPI and/or the editor(s) disclaim responsibility for any injury to people or property resulting from any ideas, methods, instructions or products referred to in the content.