Article

Comparison of Perceived and Measured Indoor Environmental Quality Across Home and Office Work Environments

1
Well Living Lab, Rochester, MN 55902, USA
2
TSET Health Promotion Research Center, Stephenson Cancer Center, University of Oklahoma Health Campus, Oklahoma City, OK 73104, USA
3
Department of Health Promotion Sciences, Hudson College of Public Health, University of Oklahoma Health Sciences, Oklahoma City, OK 73104, USA
4
Professional Education, Georgia Institute of Technology, Atlanta, GA 30332, USA
*
Author to whom correspondence should be addressed.
Sustainability 2026, 18(3), 1144; https://doi.org/10.3390/su18031144
Submission received: 11 December 2025 / Revised: 9 January 2026 / Accepted: 15 January 2026 / Published: 23 January 2026
(This article belongs to the Section Health, Well-Being and Sustainability)

Abstract

As remote and hybrid work arrangements become increasingly embedded in modern professional life, understanding indoor environmental quality (IEQ) in work-from-home (WFH) settings has become critical for supporting sustainable and healthy work environments. This study assessed both subjective perceptions and objective measurements of IEQ from three different working environments of home, employer offices, and simulated standard-compliant offices. Within the home environment, household characteristics resulted in significantly different measured IEQ: larger households and pet ownership were associated with higher CO2, VOC, and air temperature levels, while noise levels varied by childcare responsibilities and flooring type. IEQ perceptions also significantly differed: air temperature satisfaction was lower among those providing childcare, and overall environmental satisfaction varied by WFH frequency, with occasional WFH workers reporting the least satisfaction. Across the three working environments, participants were significantly more satisfied with thermal and acoustic conditions in WFH than employer offices, with simulated standard-compliant offices showing intermediate results. Notably, these perception patterns did not always align with measured environmental conditions. These findings demonstrate that both household characteristics and work context shape occupants’ IEQ perceptions, underscoring the importance of occupant-centered evaluation in advancing sustainable building design and remote work strategies. The results suggest that integrating both objective IEQ metrics and subjective experience is essential for promoting long-term environmental sustainability and occupant well-being across evolving work environments.

1. Introduction

The COVID-19 pandemic significantly accelerated the adoption of working from home (WFH) and hybrid work arrangements, making them common alternatives to traditional office-based work [1,2,3]. A growing number of employees now resist returning to full-time, in-person office work, highlighting a strong preference for flexible and remote work structures [4,5,6]. As this trend continues, there is a pressing need to better understand the home working environment, particularly its role in supporting productivity and well-being in a sustainable manner [7,8,9,10]. Most residential spaces were not originally designed to accommodate the environmental demands of sustained professional work and therefore may fall short of the standards typically upheld in commercial office environments, especially in terms of indoor environmental quality (IEQ) [11,12,13].
Research on WFH has produced mixed results regarding its impacts on satisfaction, productivity, and well-being. The effects of remote work on productivity, for example, have been shown to depend heavily on the nature of the work and environmental factors, with some findings suggesting that productivity improves when the home environment is adequately designed [14]. Other studies have indicated that productivity levels remain unchanged but are strongly influenced by workers’ mental and physical health conditions [15]. Concerns about physical inactivity, reduced social interaction, and the presence of distractions in home settings have been associated with declines in overall well-being, which may in turn undermine sustainable work performance over time [16]. When it comes to satisfaction, outcomes also vary: some studies have linked WFH with dissatisfaction due to isolation or lack of support [17], while others have reported increased satisfaction associated with flexibility and autonomy [18,19,20,21]. Specifically, satisfaction with IEQ has been reported to increase in WFH settings, suggesting that individuals may feel a greater sense of control over their immediate environment [22].
While interest in IEQ in WFH settings has grown, many existing studies remain limited in scope. Much of the current research relies solely on self-reported data, with little integration of objective environmental measurements [23,24,25,26]. A recent literature review of 41 studies on IEQ in WFH settings revealed that most studies used questionnaire-based methods, offering insights into perceived productivity, mental health, and satisfaction but lacking objective measurements of environmental conditions [27]. Limited studies included any form of physical IEQ measurement, and the recorded conditions generally fell within standard thresholds. Furthermore, many investigations focus on individual components of IEQ—such as air and/or thermal —rather than comprehensively evaluating air quality, thermal comfort, lighting, and sound simultaneously [11,28,29]. More recent work provided more comprehensive assessment on IEQ in field environments [30], but the majority’s fragmented approach limits our ability to fully understand the relationship between the physical home environment and worker outcomes. Addressing this gap is essential for informing sustainable residential and workplace design strategies that support occupant health, well-being, and long-term productivity across evolving work environments.
Moreover, most existing studies have focused solely on the WFH environment, lacking direct environmental comparisons with office settings—comparisons that are essential for identifying which environment better supports work. In particular, few studies include a controlled, standard-compliant office condition that can serve as a reference for optimal indoor environmental quality (IEQ). Such a reference environment is necessary to distinguish the effects of environmental quality from contextual and psychological factors when evaluating work environments. To address these limitations, the present study integrates objective environmental measurements and subjective IEQ assessments across home offices and a simulated standard-compliant office, while capturing subjective IEQ perceptions in a conventional corporate office where objective measurements were not feasible. By linking comprehensive physical measurements with user perceptions, this study enables a multi-context comparison of how environmental conditions and perceived satisfaction differ across work settings.
Based on this framework, this study tests the following hypotheses: (H1) objectively measured IEQ parameters differ significantly between home working environments and the simulated standard-compliant office environment; (H2) subjective IEQ perceptions show weak or inconsistent alignment with objectively measured IEQ parameters; and (H3) work context influences perceived IEQ satisfaction, independent of measured environmental conditions.

2. Methods

This study adopted a structured analytical approach to examine how indoor environmental quality (IEQ), work context, and occupant perception interact across different working environments. The analysis proceeded in three stages: (1) comparison of environmental settings and perceived IEQ between home and employer office contexts, (2) integrated assessment of subjective perceptions and objectively measured IEQ within home working environments, and (3) comparative evaluation of perceived IEQ across work settings alongside objectively measured environmental conditions available from home and a simulated standard-compliant office environment.

2.1. Study Design

This study was designed to compare environmental perception and satisfaction under three working conditions of working from home (WFH), working from the simulated standard-compliant office at Well Living Lab (WFWLL), and flexible working (FW). The order of WFH and WFWLL conditions were randomized, while FW remained the last condition of this study. Each of the conditions lasted for a week (5 consecutive workdays), resulting in a study duration of three weeks per cohort, with an additional week of onboarding/orientation. There was a total of five cohorts in this study, and fifteen participants were recruited for each cohort. This study launched in January 2024 and ended in July 2024.
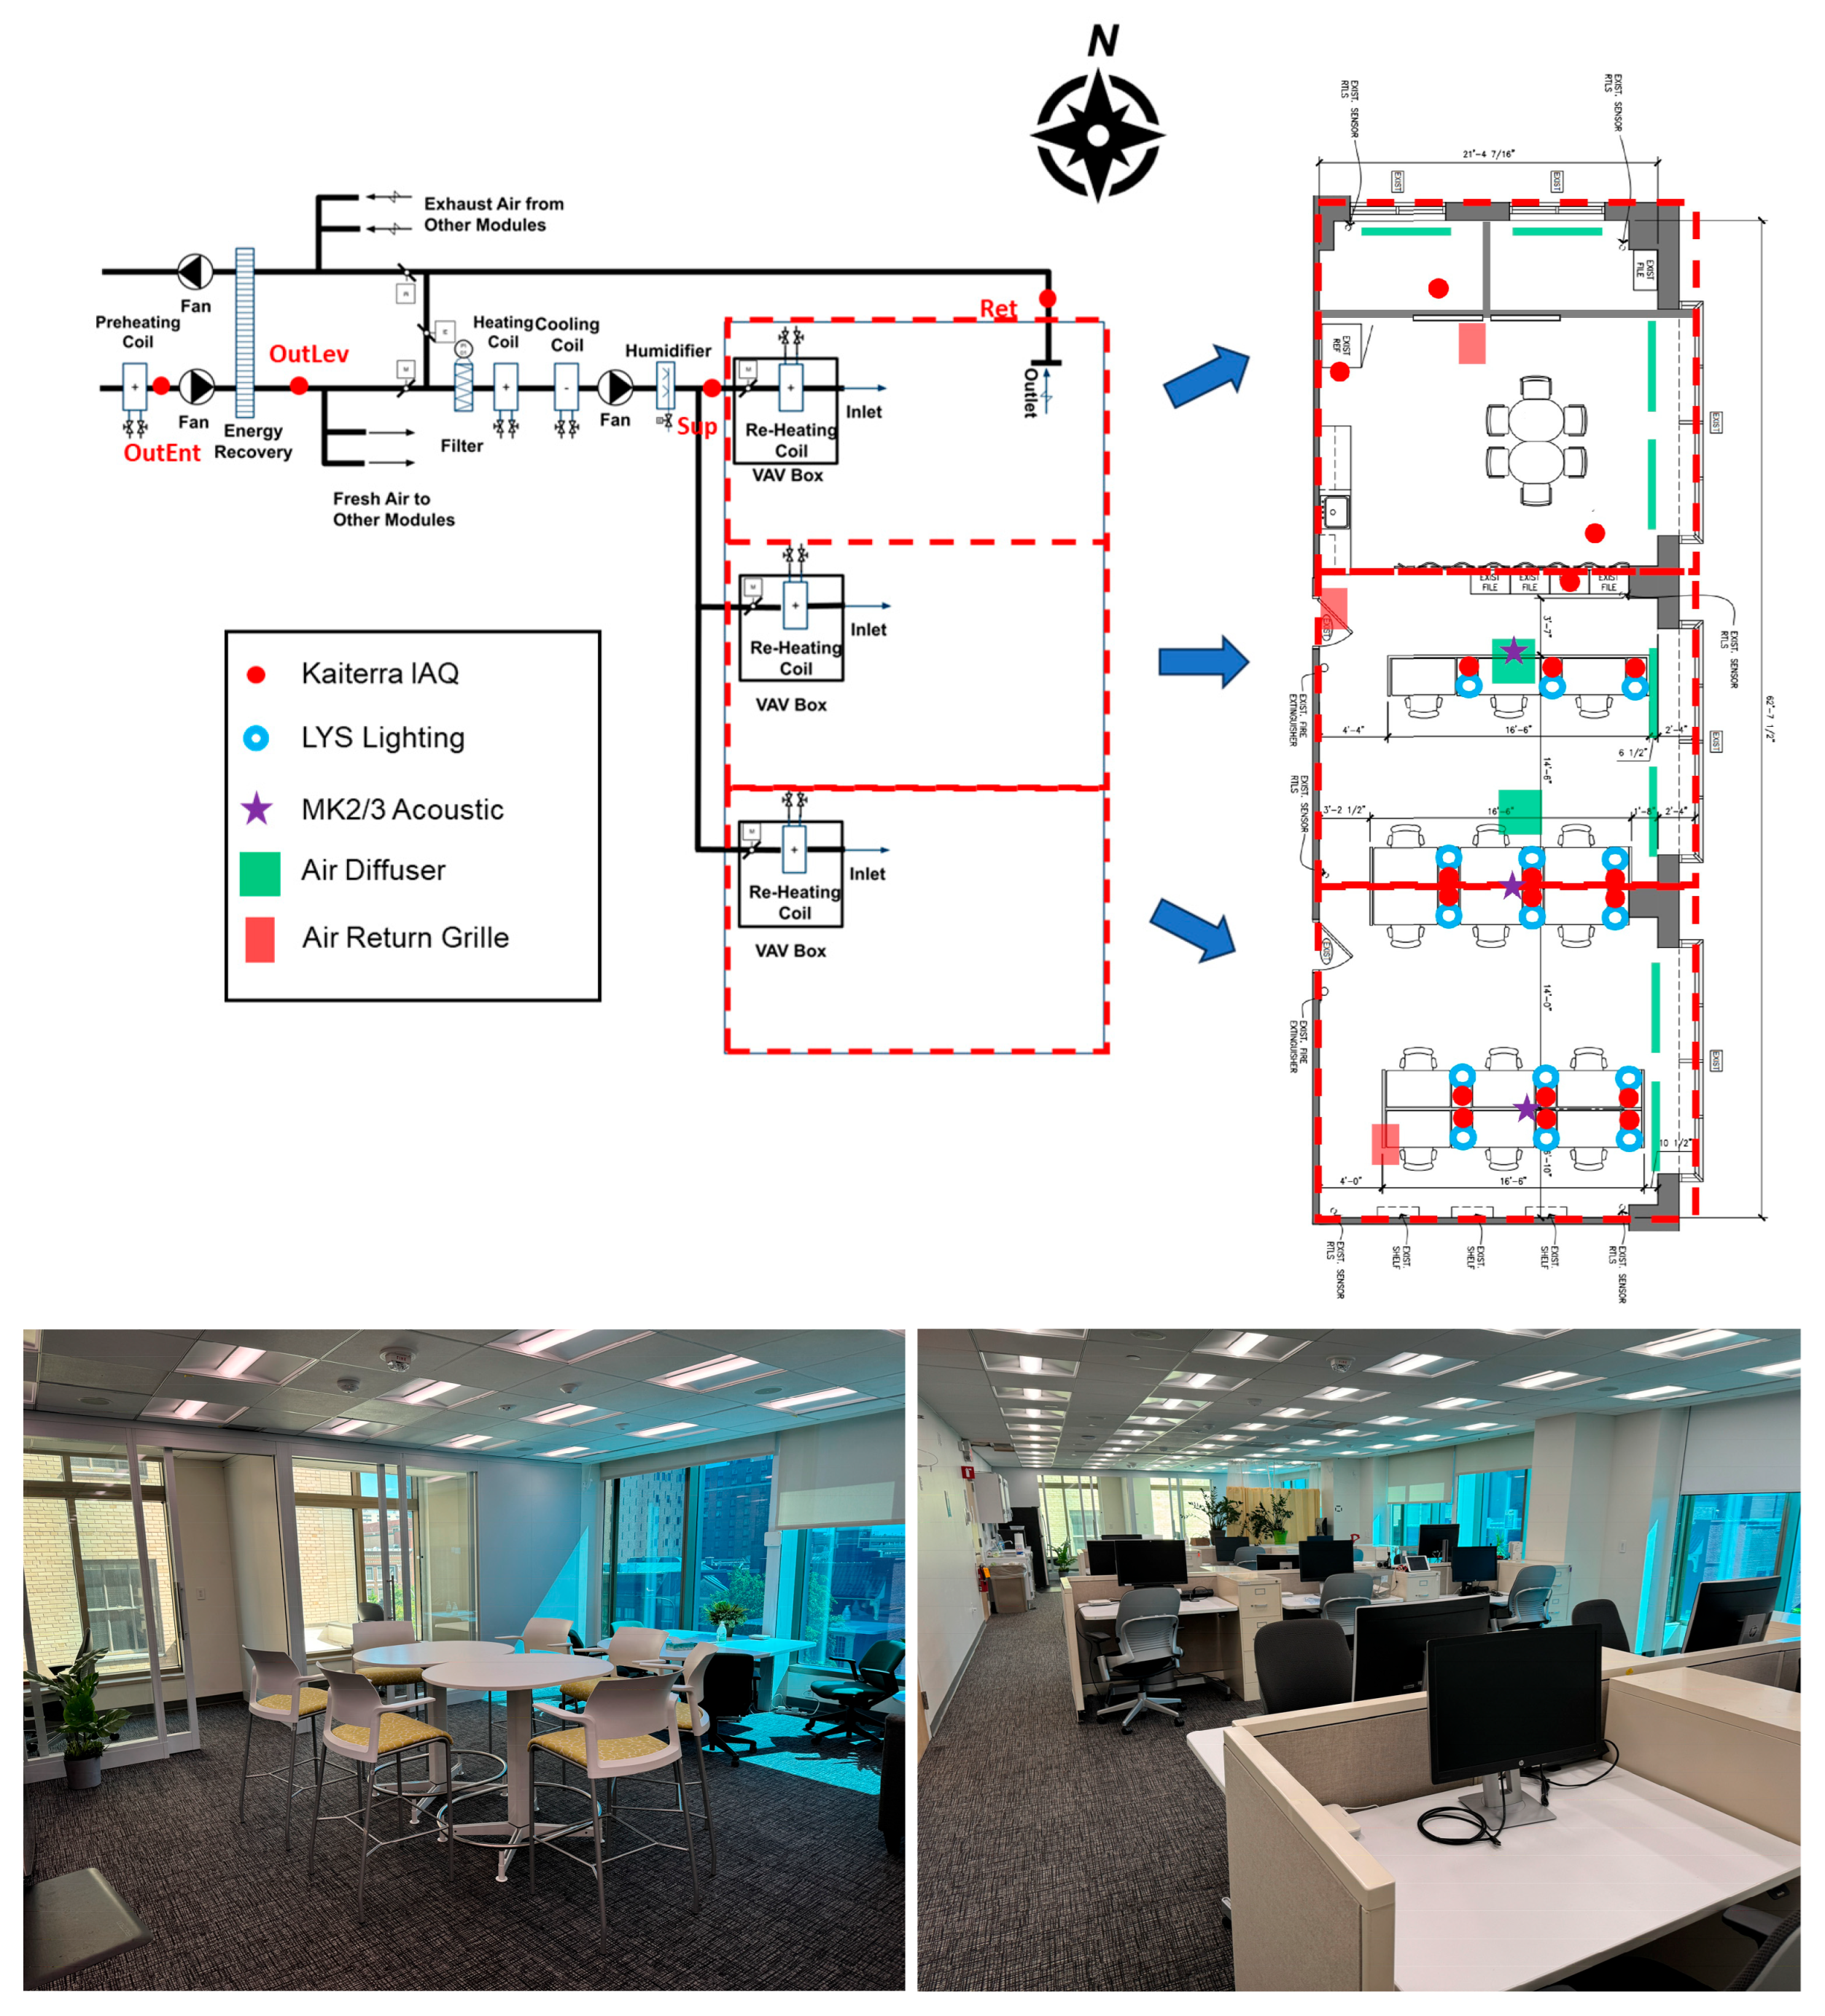
The participants worked at a Well Living Lab (WLL) office during the WFWLL condition. The WLL office was evaluated by a WELL AP for compliance with WELL certification requirements and achieved 41 points, equivalent to a WELL Bronze level. However, official certification was not pursued because the space is a reconfigurable laboratory rather than a permanent office. Given that the majority of points were earned in indoor environmental quality (IEQ) categories, the IEQ of the WLL office may be comparable to that of higher-rated WELL-certified offices. The office was an open-plan office (124 m2) with two private meeting rooms and a break area as well as fifteen workstations (Figure 1). In order to measure IEQ, commercial-grade IEQ sensors were placed at each of the workstations: Kaiterra Sensedge Mini (Kaiterra, Crans-Montana, Switzerland) for PM2.5 (accuracy: 0 to 30 μg/m3 range, ±3 μg/m3; 30 to 1000 μg/m3 range: ±10%), VOCs (accuracy: ±15%, ±8ppb), CO2 (accuracy: ±3%, ±50 ppm), air temperature (accuracy: ±1 °C), and relative humidity (accuracy: ±5% RH), LYS (LYS Technologies, Copenhagen, Denmark, accuracy: ±5%) for light levels, and NSRTW mk2/3 (Convergence Instruments, Quebec, Canada, accuracy: ±1 dB) for noise levels. In addition to IEQ measurements, the participants completed surveys using a provided iPad through the Qualtrics platform. During the WFH condition, participants worked from their home, and the IEQ measurement suite was installed at participants’ homes. During the FW week, participants were given the options to choose where to work (WLL office, home, or their employer’s office) while completing the same surveys. Environmental measurements were not taken if they worked at their employer’s office due to complexity of moving the IEQ measurement suite around. For the entire study period, the participants continued to complete their typical work functions.

2.2. Surveys

Multiple surveys were deployed once or repeated during the study. The baseline survey was deployed once before the launch of each cohort, which collected participants’ demographics and environmental perception from home and employer’s office environments (Supplementary A). First, demographics items included gender, age, education level, and income. Second, to assess environmental perception and satisfaction, the Cost-Effective Open-Plan Environments (COPE) survey was utilized. The COPE survey items were slightly modified from the original to reflect the current work environment. Specifically, the COPE survey included satisfaction/perception with indoor air quality (IAQ), thermal comfort, lighting, acoustic qualities, and job satisfaction. COPE was included in the baseline survey twice in home and employer’s office environment sections, respectively. Third, similar to COPE, a set of indoor environmental quality-related questions were asked in home and employer’s office environment sections, respectively. This included air quality related components—carpeting, smokers, mold, etc., lighting-related components—windows, seated view, and shading devices, acoustic concerns, office supplies, equipment, and ergonomics. Additional items in the home section included home size, type, occupancy, and home office to better capture home environment variations.
During the study, the COPE survey was repeated on the 5th day of each experimental condition of WFH and WFWLL. This design was to capture participants’ environmental perception and well-being in different environments. During the FW week, this survey was distributed only if participants worked at their employers’ office.

2.3. Participants

A total of seventy-five participants were recruited via email and flyers. Study participants were eligible if they were 18–59 years old, had a BMI ≥ 18.5, and were full-time indoor, desk-based office workers employed at the Mayo Clinic or other organizations in and around Rochester, MN, USA. Individuals were excluded if they were pregnant, lactating, or planning pregnancy; worked shift schedules; used medications that could affect mental status; had drug, nicotine, or alcohol dependence; or had pre-existing respiratory, neurological, or severe sleep disorders that could influence study outcomes. The participants consented prior to the study, and the study was approved by Mayo IRB #22-011790.

2.4. Data Analysis

Survey data collected via Qualtrics was exported as a CSV file and analyzed using RStudio (version 3.6.0). During the data cleaning process, incomplete and duplicated responses were identified and removed to ensure data integrity, leaving 65 valid responses out of 75 for the analysis, including one dropout. The cleaned dataset was then used for statistical analyses. Descriptive statistics were used to summarize participant demographics, environmental characteristics, and survey responses. Independent two-sample t-tests and one-way analysis of variance (ANOVA) were applied to examine differences in IEQ conditions and perceived outcomes across study groups. Linear regression models were used to assess associations between overall environmental satisfaction and individual environmental satisfaction domains.

3. Results and Discussion

3.1. Demographics

The study participants were mostly female (74%, 48/65), while only 26% (17/65) were male. The average age was 43.2 years. More than half of the participants held a master’s or Ph.D. degree (58.6%), and only 3.1% had never attended college. The majority of participants reported an annual income above $75,000. Since higher-income workers tended to report greater satisfaction with temperature and air quality [31], the overall results may be skewed toward higher satisfaction levels. Gender did not significantly affect environmental satisfaction, although responses from female participants showed more variability than those from male participants (Table 1). Age was divided into three groups: under 40, 40–49, and 50 or older. Satisfaction responses were compared across these age groups (Table 1). In general, participants aged 40–49 reported the highest satisfaction across most categories, except for overall satisfaction. Lighting satisfaction differed significantly between age groups (F = 4.11, p < 0.05, η2 = 0.12), with the 40–49 group reporting the highest satisfaction (mean = 6.09), followed by those under 40 (mean = 5.23), and those aged 50 or older (mean = 4.94). Air quality satisfaction showed a marginal difference between age groups (F = 2.49, p < 0.10, η2 = 0.07), again with the 40–49 group reporting the highest satisfaction (mean = 6.09), followed by the 50+ group (mean = 5.94) and the under-40 group (mean = 5.42).

3.2. Environment and Perception at Home and Employer’s Office

This section compares environmental settings and perceived IEQ satisfaction between the home working environment and the employer’s office. Environmental setting descriptors and self-reported conditions are used to characterize differences between the two contexts, while subjective evaluations assess how these contextual differences relate to perceived environmental quality.

3.2.1. Working Environment at Home and Employer’s Office

Home and office features with potential impacts on measured and perceived IEQ—including air quality, window access, flooring, personal devices, noise, lighting, and ergonomic and personal supports—were evaluated across both environments (Table 2). Air quality-related factors, such as carpeting, exposure to smokers, and mold, were generally not major concerns, although wall-to-wall carpeting was more common in offices and pets were present in most households, potentially affecting indoor air quality. Daylight and view access differed markedly: nearly all home offices had windows with seated views, whereas only about half of employer offices provided similar access. Acoustic conditions also varied, with mechanical noise more prevalent in offices, while home offices experienced greater disturbances from household members and pets. Finally, ergonomic furniture was more common in offices, whereas personal comfort devices were more frequently used in home offices. Overall, these results highlight distinct environmental characteristics and resource distributions between home and office settings, providing context for understanding differences in measured and perceived IEQ.

3.2.2. Environmental Satisfaction at Home vs. Employer’s Office

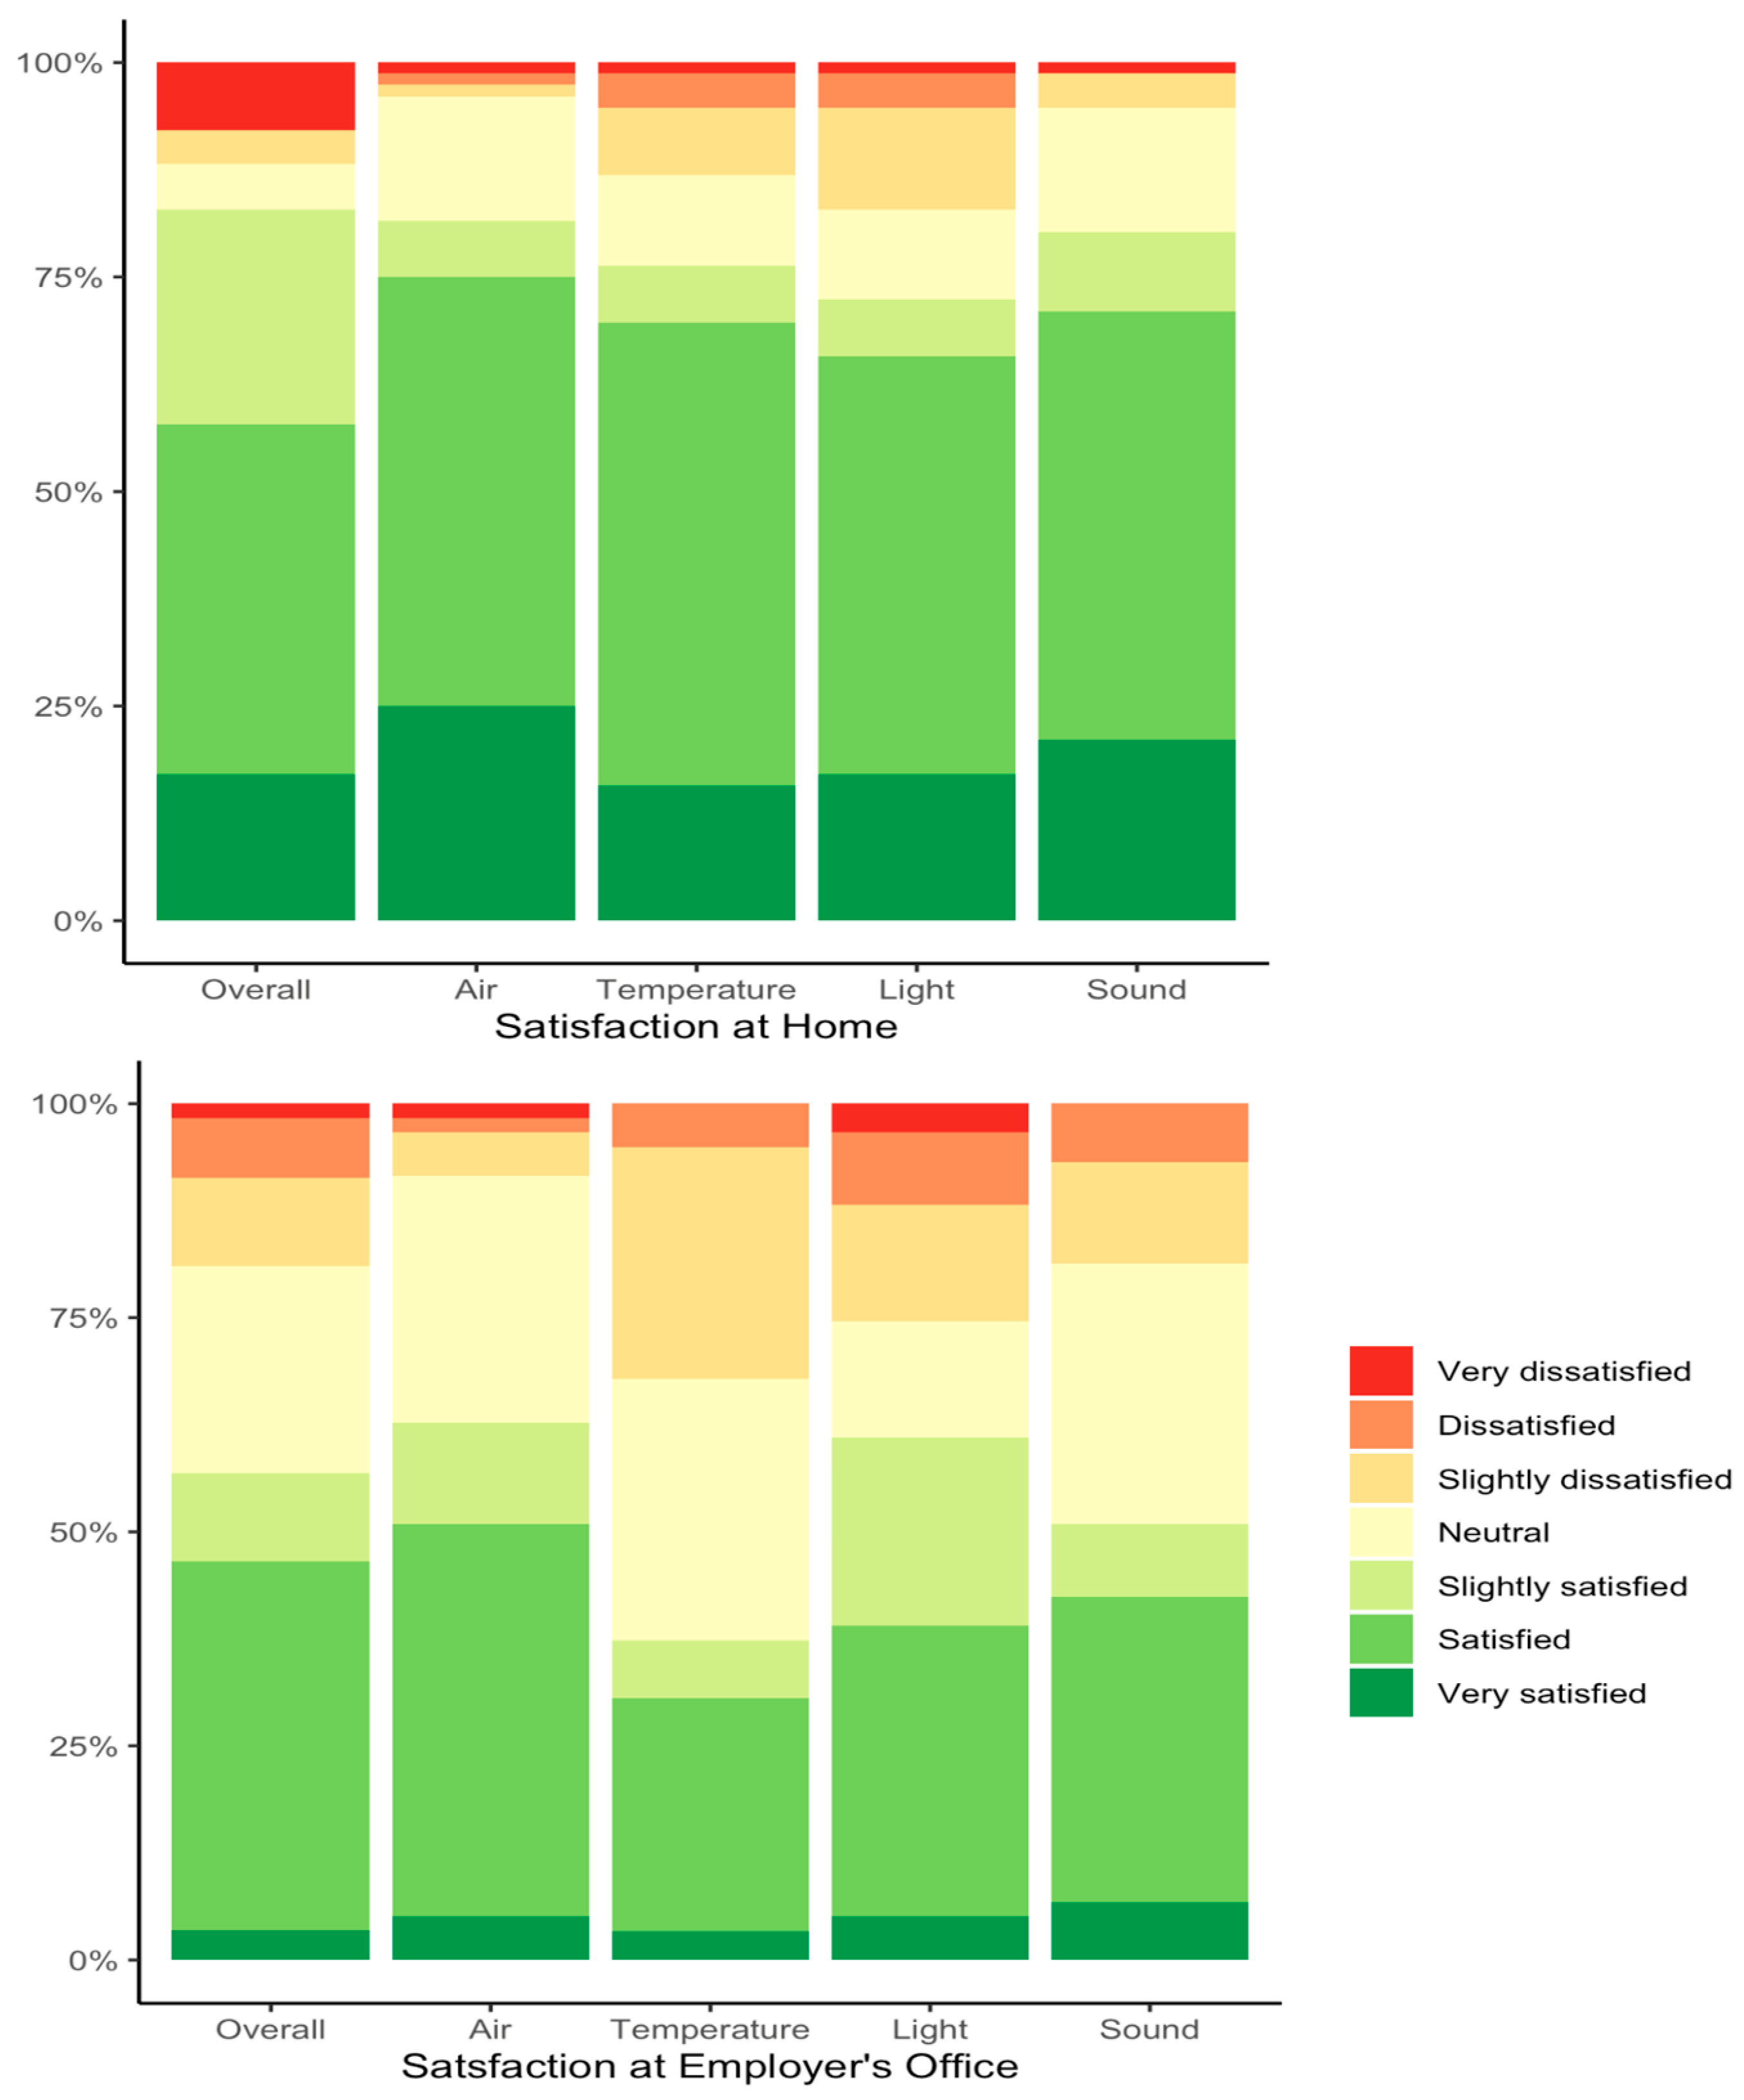
Perceived satisfaction with air quality differs between home and employer office environments (Figure 2). At home, 79% of the respondents reported satisfaction, with 49% reporting “Satisfied” and 24% reporting “Very Satisfied”. In the employer’s office, 62% reported satisfaction, with 45% being “Satisfied” and 5% being “Very satisfied”. However, a higher proportion of respondents report neutral (28%) or slight dissatisfaction (5%) compared to the home environment (15% and 1%). This suggests that air quality at home is generally perceived more favorably, potentially due to greater individual control over ventilation, temperature, and pollutant sources. The higher number of neutral and slightly dissatisfied responses in the office setting may reflect limited control, differences in air management practices, or higher occupancy rates, which could contribute to perceptions of poorer air quality. Additionally, familiarity with the home environment may lead to a more favorable perception, while workplace air quality might be subjected to stricter regulations but still perceived as less comfortable due to varying personal preferences and expectations.
Perceived satisfaction with air temperature, reflecting thermal comfort, varies between home and employer office environments. At home, 75% of respondents report being satisfied (higher than “Neutral”), with 15% being “Very satisfied.” However, some individuals express neutrality or slight dissatisfaction, with a small number reporting “Dissatisfied” (4%) or “Very dissatisfied” (1%). In the employer’s office, both satisfaction (37%) and dissatisfaction (34%) were observed, with 30% being “Neutral”. Although 37% of respondents in the office environment reported satisfaction, the presence of greater dissatisfaction suggests that thermal comfort in the workplace may be more challenging to achieve. This could be due to factors such as centralized temperature control, variations in individual preferences, or differences in clothing expectations between home and office settings. The higher satisfaction levels at home may reflect greater control over heating and cooling systems, allowing individuals to adjust the environment to their comfort preferences.
Participants reported similar levels of satisfaction with light levels in both home and employer office environments. In both settings, the majority of respondents indicated being satisfied (71% and 60%) with a considerable number also reporting they are “Very satisfied” (16% and 5%). Less than 20% expressed neutrality or slight dissatisfaction, with only a few respondents reporting being “Dissatisfied” (6% and 8%) or “Very dissatisfied” (1% and 5%). The comparable satisfaction levels suggest that light levels, whether at home or in the office, generally meet people’s expectations and do not significantly impact their comfort. This indicates that individuals may not be particularly sensitive to light levels as long as they meet basic functional needs.
Participants were generally satisfied with the sound (noise) levels in both home and employer office environments, though differences in satisfaction levels are evident. At home, 78% of respondents reported satisfaction, with 49% being “Satisfied” and 20% being “Very satisfied”. In the employer’s office, while 50% were satisfied, 21% were dissatisfied and 30% remained neutral. The higher proportion of respondents reporting “Neutral” (30%) and “Slightly dissatisfied” (12%) responses compared to the home setting (15% and 4%) suggests that noise levels in the office environment may be more challenging to control and less conducive to personal comfort. Greater satisfaction at home may be attributed to more control over noise sources, such as the ability to create quieter workspaces or adjust environmental conditions to personal preferences. Conversely, office environments often involve shared spaces, background noise from colleagues, and workplace equipment, which can contribute to increased dissatisfaction.
Overall, the perception of IEQ across air quality, thermal comfort, lighting, and sound levels indicates higher satisfaction at home compared to the employer’s office. In all aspects, participants reported greater satisfaction with their home environment, likely due to their increased ability to control environmental factors. At home, individuals can adjust conditions to their personal preferences, such as regulating heating and cooling systems, modifying lighting to suit their needs, and managing noise levels, resulting in a more comfortable and personalized experience. In contrast, office environments typically offer less flexibility, with standardized environmental settings and shared spaces that may not align with individual preferences, leading to a higher proportion of neutral and slightly dissatisfied responses. In addition, for both home and office work environments, the percentages of satisfaction with all four factors are lower than 80% (79% and 62% for IAQ, 75% and 37% for temperature, 71% and 60% for lighting, and 78% and 50% for sound).
Multiple linear regression shows that air quality satisfaction and sound satisfaction have significantly positive association with overall environmental satisfaction at the employer’s office (Table 3). One unit increase in air quality and sound satisfaction on a 7-point Likert scale increases overall environmental satisfaction by 0.66 and 0.24, respectively. Air temperature and lighting satisfaction seemed to have negligible effects on overall satisfaction. On the other hand, in the home environment, sound satisfaction shows the highest positive association with overall satisfaction followed by lighting satisfaction, but the association was not statistically significant (Table 4).

3.3. Home Working Environment

This section focuses exclusively on the home working environment, examining how specific environmental features and conditions are associated with both subjective IEQ perceptions and objectively measured IEQ parameters.

3.3.1. IEQ Perception and Home Environment

The home office environment has gained increasing attention as remote work becomes more prevalent, but our survey results showed that the quality of a home office setup did not affect indoor environmental satisfaction (Table 5). IEQ satisfaction responses were similar between the four categorizations of workspaces at home—dedicated office, semi-closed office, workstation in a dual-purpose room, and no dedicated workstation.
Several significant differences in IEQ satisfaction were observed based on home environment and working patterns. First, satisfaction with air temperature varied significantly by the frequency of taking care of children. Participants who reported sometimes (n = 5) or rarely (n = 21) taking care of children during work had lower satisfaction (mean = 4.40 and 4.62, respectively; 4 = Neutral, 5 = Slightly Satisfied) compared to those who never did (n = 39, mean = 5.97; F = 10.43, p < 0.001, η2 = 0.25). Second, WFH frequency was associated with differences in overall environmental satisfaction. Participants who worked from home either rarely or never (n = 8) or very often (three or more days per week) reported higher satisfaction (mean = 5.75 and 5.59, respectively) than those who worked from home occasionally (one to two days per week, n = 6, mean = 3.83; F = 4.463, p < 0.05, η2 = 0.13).
Other variables showed trends in environmental satisfaction, though statistical significance could not be confirmed. For example, house type did not reveal meaningful differences—likely due to the majority of participants living in detached houses. Collecting more data from apartment dwellers may reveal measurable differences in air quality [32]. Meanwhile, home size showed a trend toward increased overall IEQ satisfaction with increasing square footage. Participants living in homes smaller than 1000 square feet reported lower overall environmental satisfaction (mean = 4.67, n = 6), while those in homes 1000–2000 (n = 20), 2000–4000 (n = 37) and over 4000 square feet (n = 2) reported increasing satisfaction levels (means = 5.35, 5.59, and 6.00, respectively). Interestingly, satisfaction with air temperature was highest among those in the smallest size category (mean = 6.33), though this finding should be interpreted with caution due to small sample sizes in the smallest and largest home categories. Finally, the number of people present in the home during working hours did not appear to significantly influence IEQ satisfaction.

3.3.2. Measured IEQ and Home Environment

To better understand the impact of home settings on IEQ, we paired the measured IEQ parameters with relevant home information collected from the baseline survey and selectively discussed the findings in this section. Home information included the type of home, number of residents, presence of carpeting, presence of pets, etc.
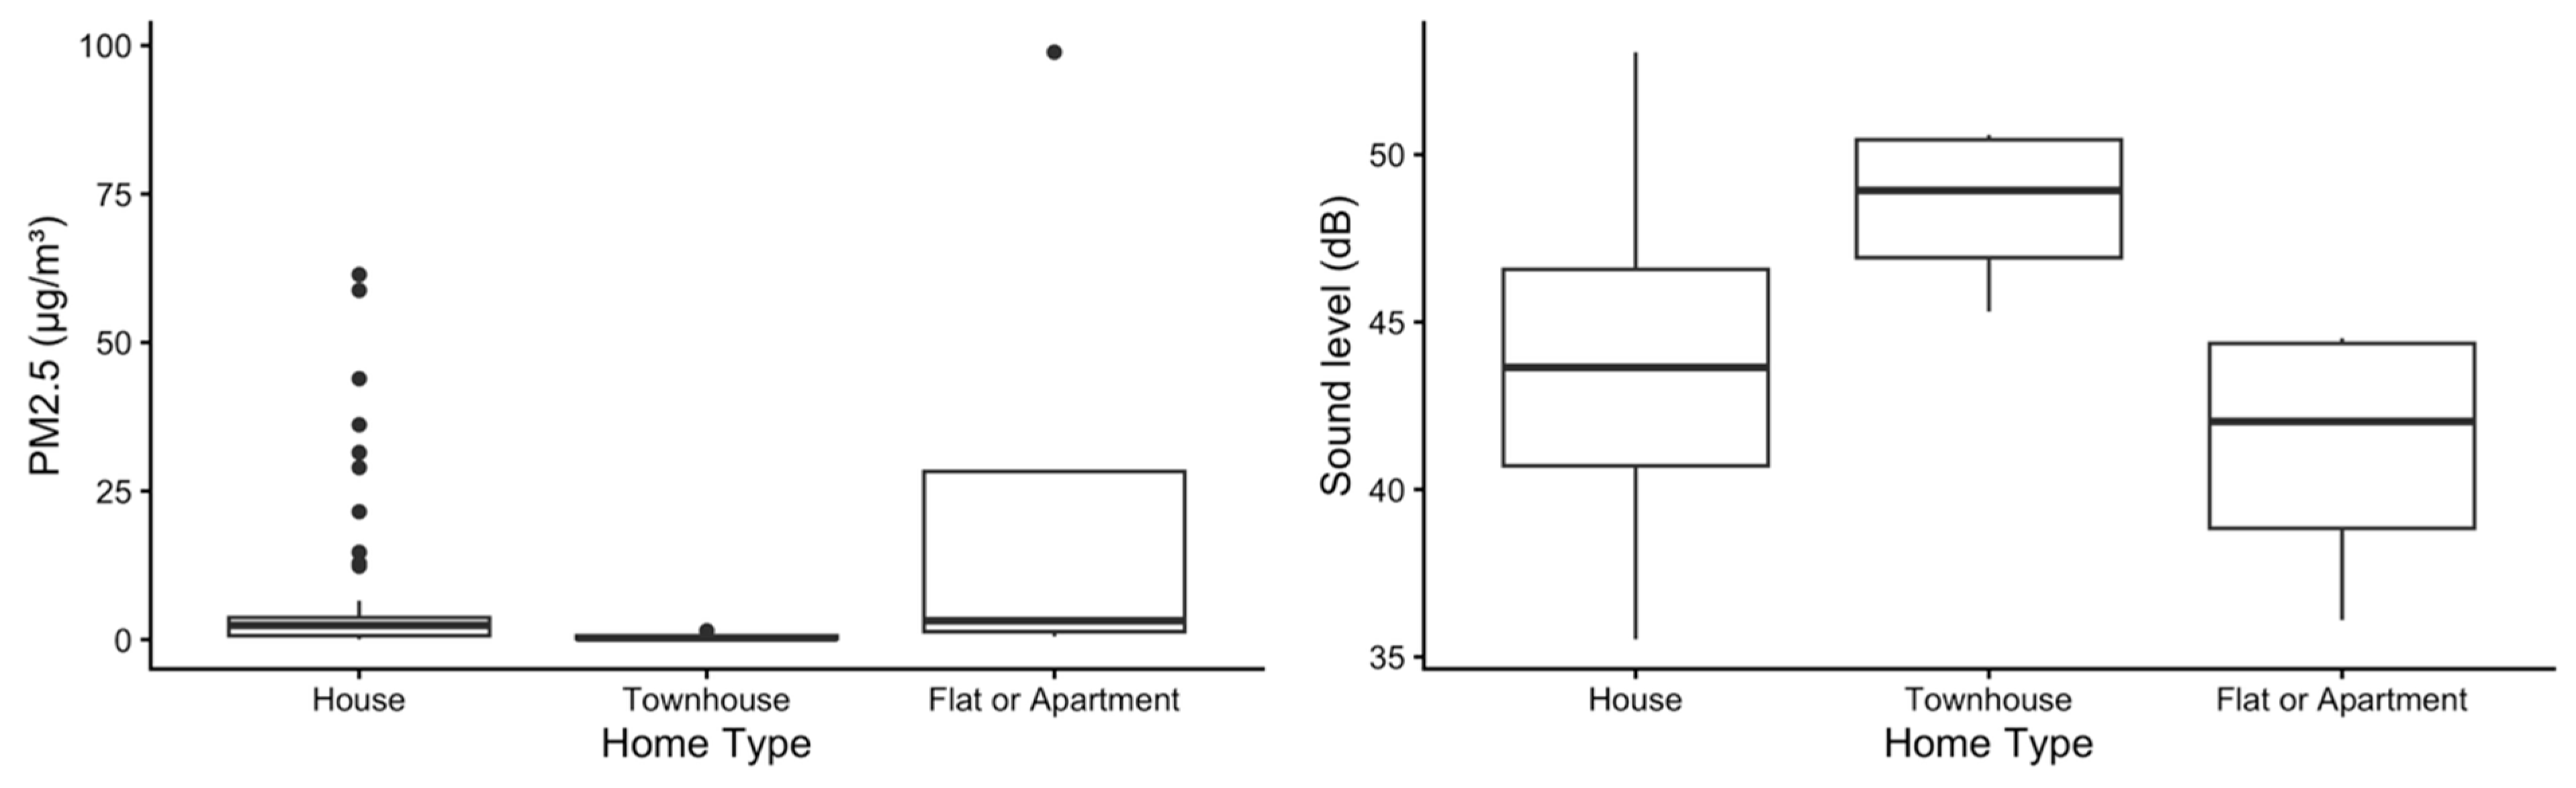
To start with, different types of homes—houses, townhouses, and flats or apartments—showed different PM levels and sound levels (Figure 3). PM2.5 levels were slightly higher on average at flats or apartments (26 µg/m3), with wider distribution of PM levels than a house or townhouse (7 and 0.5 µg/m3). The right-side Figure reveals that townhouses have the highest sound levels of 48 dB on average, while houses and flats or apartments remained at 44 and 41 dB on average with a little larger variation. The sound level difference between townhouses and flats or apartments was significant (F = 3.35, p < 0.05, η2 = 0.10). However, these patterns should be interpreted cautiously, as the small sample sizes for townhouses and apartments may not fully capture the variability in these housing types. Overall, while houses, which take 88% of data points, appear to have more fluctuating PM2.5 and sound levels, this may be due to the larger representation in the dataset rather than inherent differences between home types.
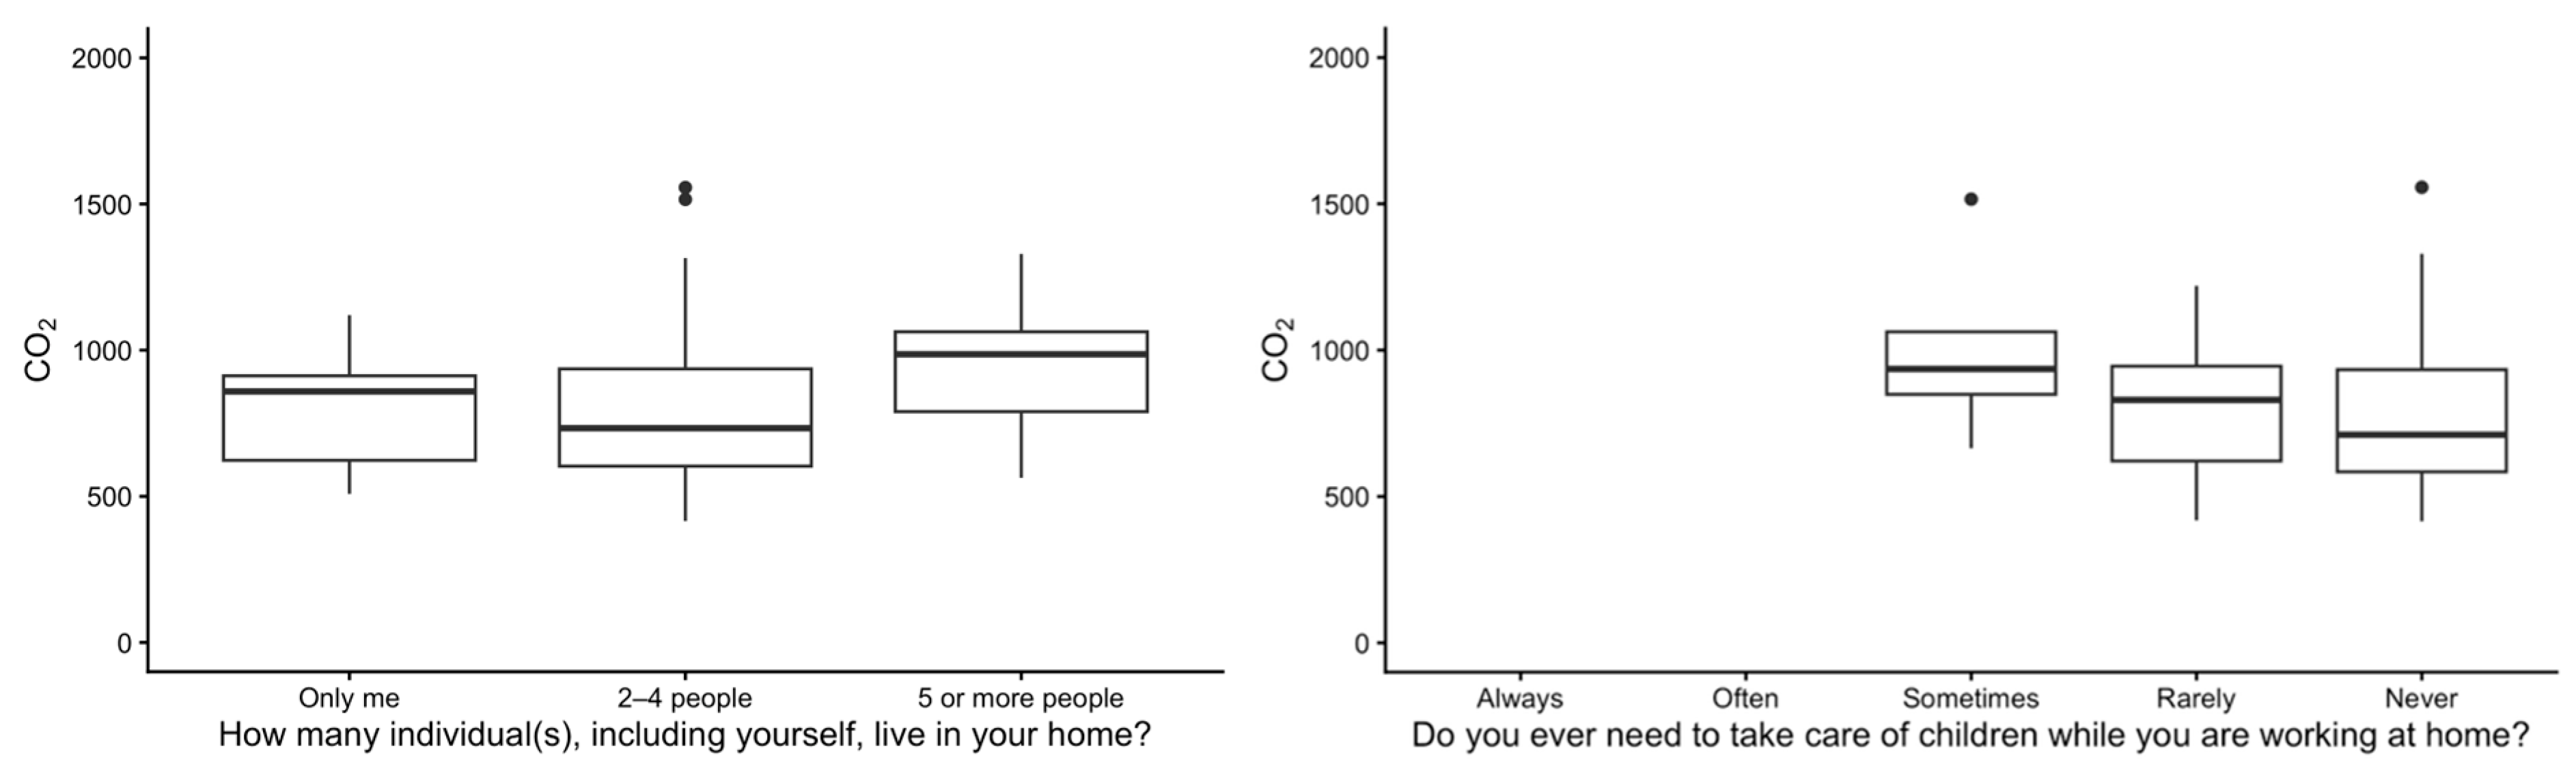
Figure 4 illustrates how indoor CO2 levels vary based on household size and the frequency of childcare responsibilities during work. Homes with only one occupant and 2–4 people show an average of 803 and 796 ppm CO2 levels, respectively. The significantly higher CO2 concentrations (1203 ppm, F = 4.34, p < 0.05, η2 = 0.12) are observed in homes with five or more occupants than smaller households, indicating that larger household sizes contribute significantly to indoor air buildup, potentially affecting air quality. Additionally, the frequency of caring for children while working also influences CO2 levels. Average CO2 levels tended to increase, where individuals needed to care for children more often (1006 ppm, sometimes; 893 ppm, rarely; 781 ppm, never), though the differences were not statistically significant. Together, these findings suggest that both larger household sizes and intermittent childcare responsibilities contribute to elevated indoor CO2 levels, highlighting the impact of occupancy and activity patterns on indoor air quality.
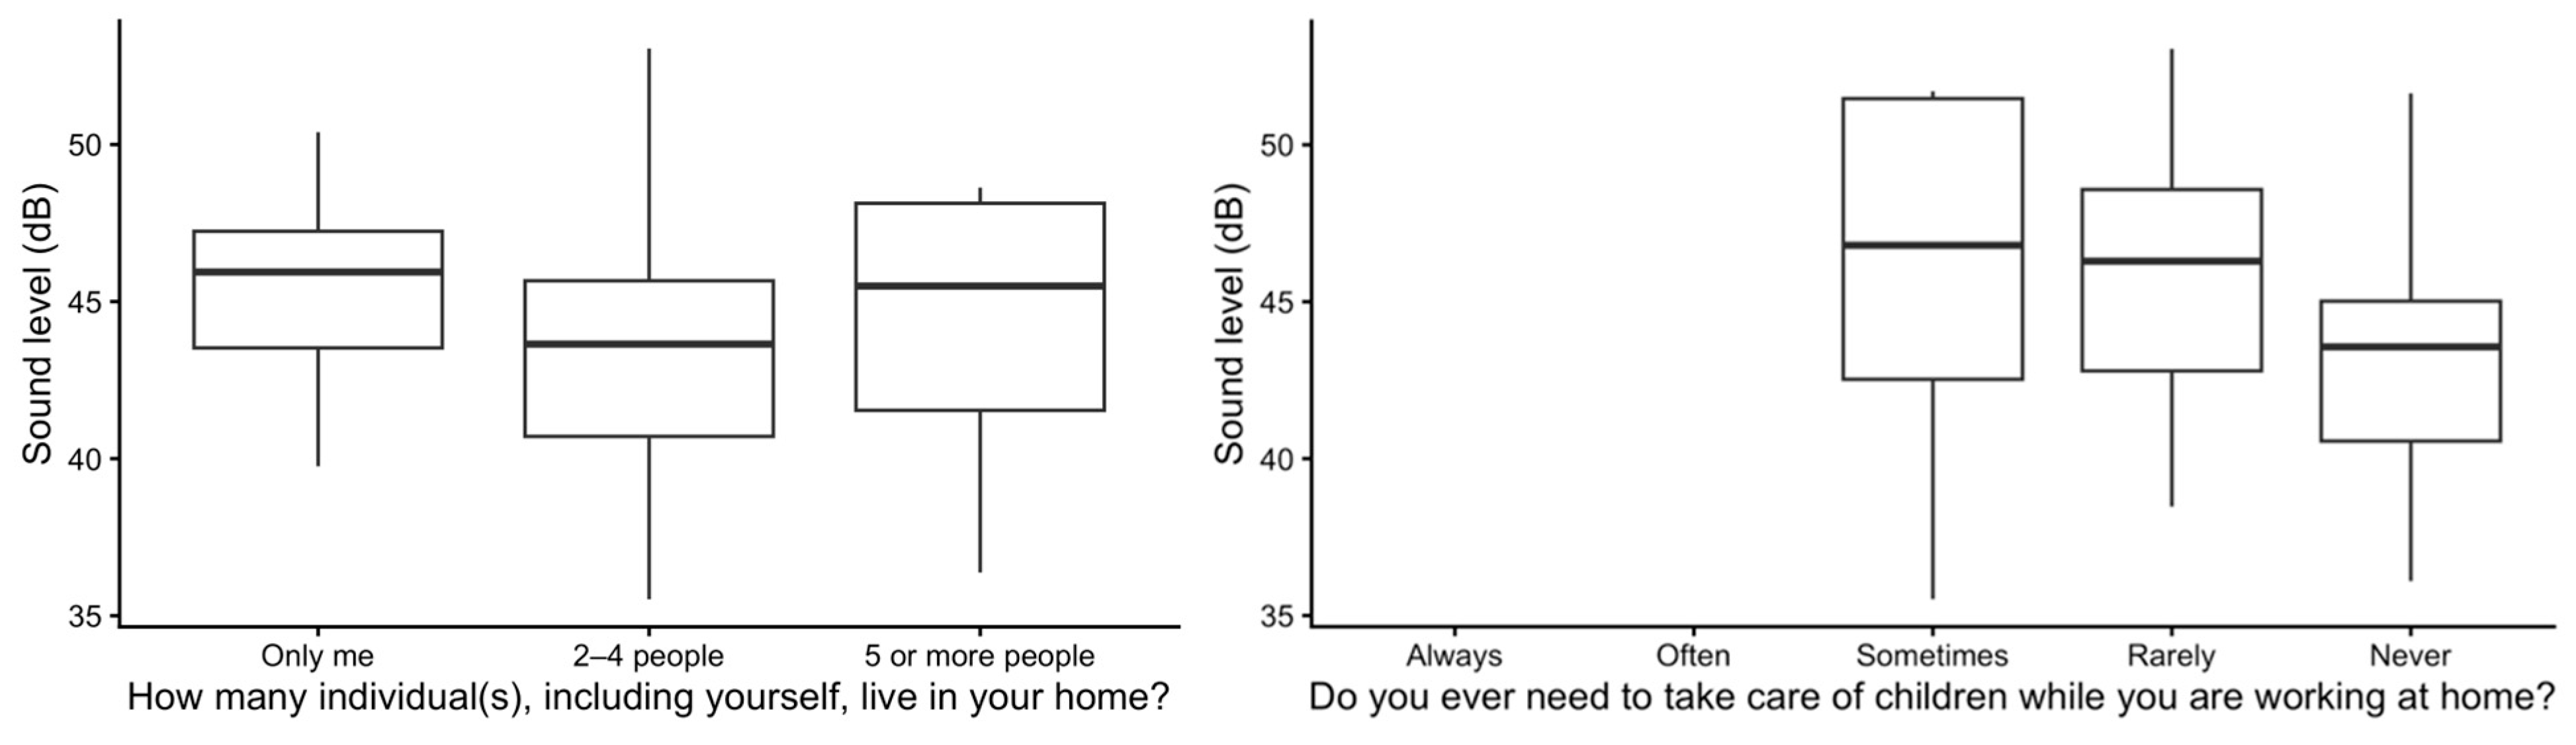
Figure 5 illustrates how indoor sound levels vary based on household size and the frequency of childcare responsibilities during work. The left Figure shows that the mean sound level is higher for those living alone (45 dB) than households with 5 or more people (44 dB) and 2–4 people (44 dB), with no statistically significant differences. However, as shown in the right Figure, sound levels were significantly higher for those who sometimes or rarely take care of children at home (both 46 dB on average) than those who have no kids at home (43 dB, F = 3.44, p < 0.05, η2 = 0.10).
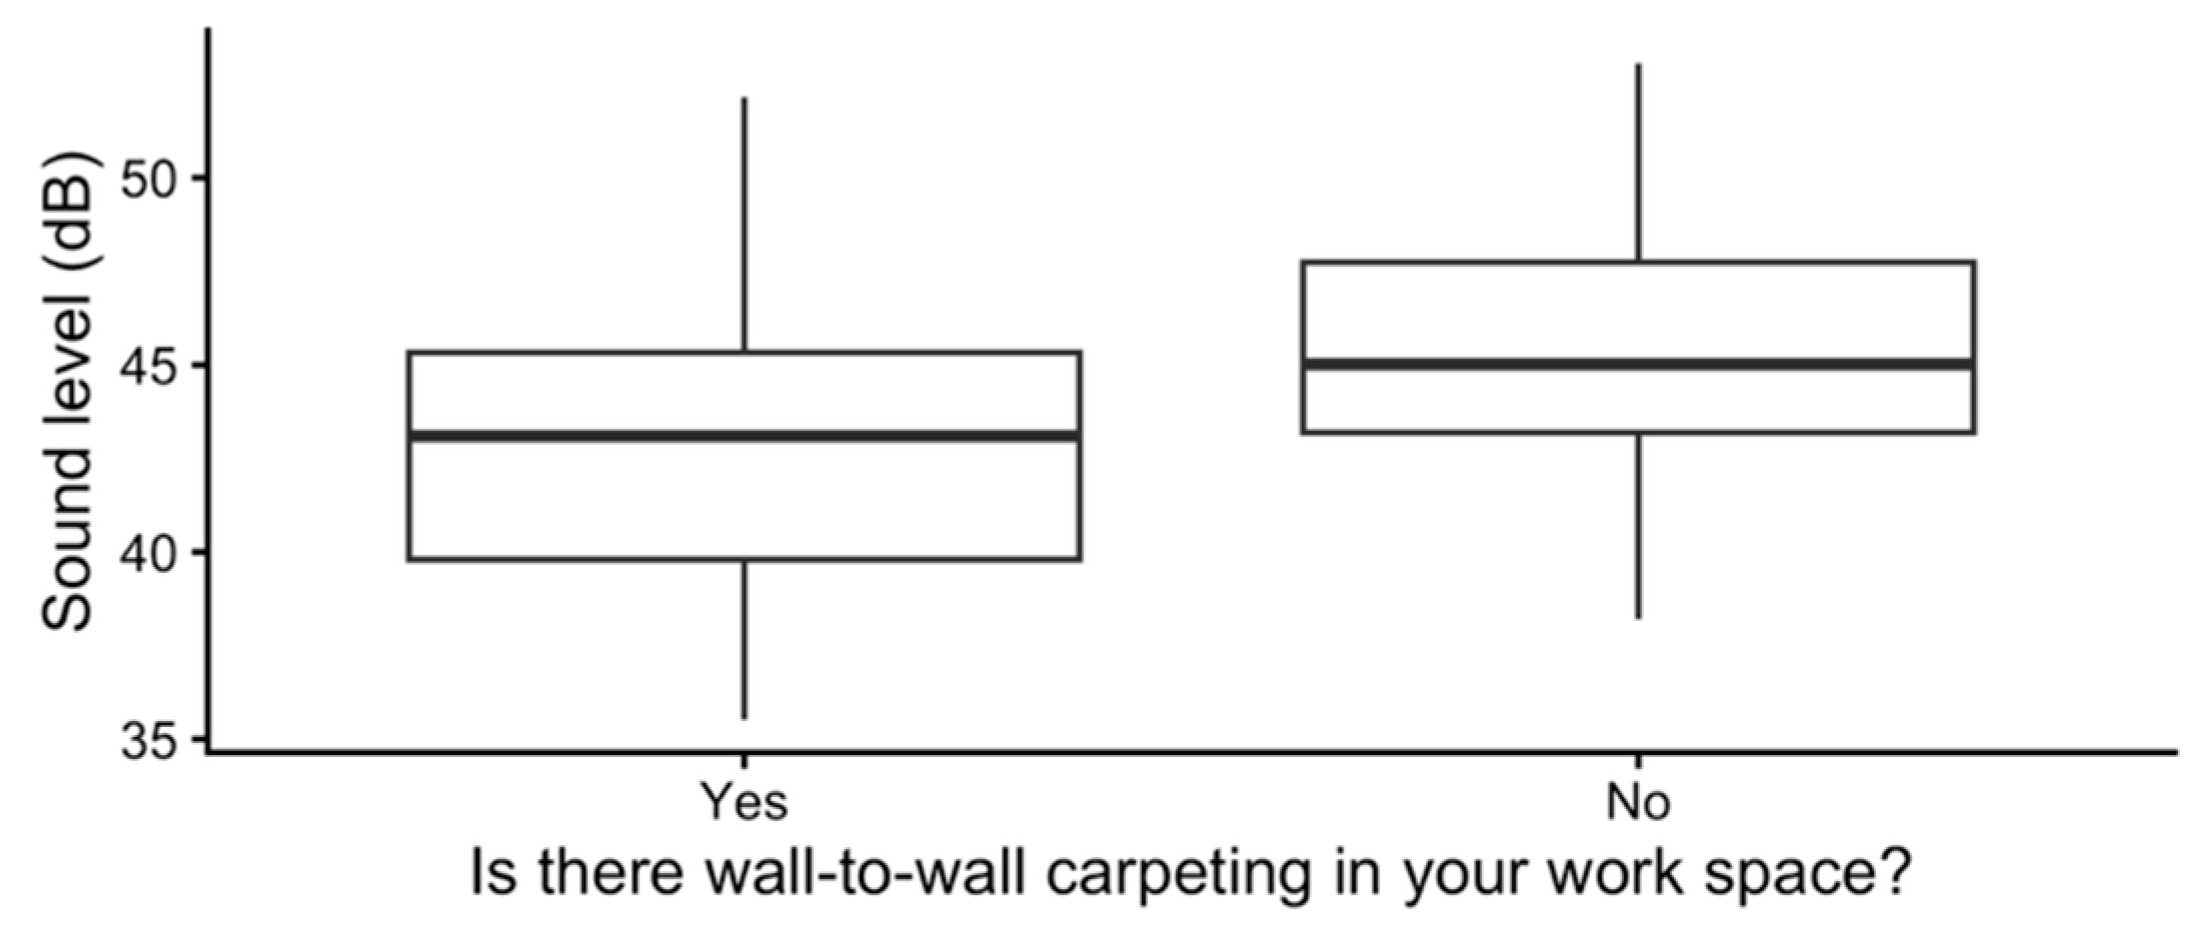
Home workspaces with wall-to-wall carpeting have significantly lower and more consistent noise levels (43 dB) compared to those without carpeting (45 dB, t = 2.24, p < 0.05, d = 0.62, Figure 6). This suggests that carpeting effectively absorbs sound and reduces echo, creating a quieter environment conducive to focus and productivity. While other factors like room size and external noise may also affect sound levels, the data clearly indicate that wall-to-wall carpeting helps minimize noise in home workspaces.
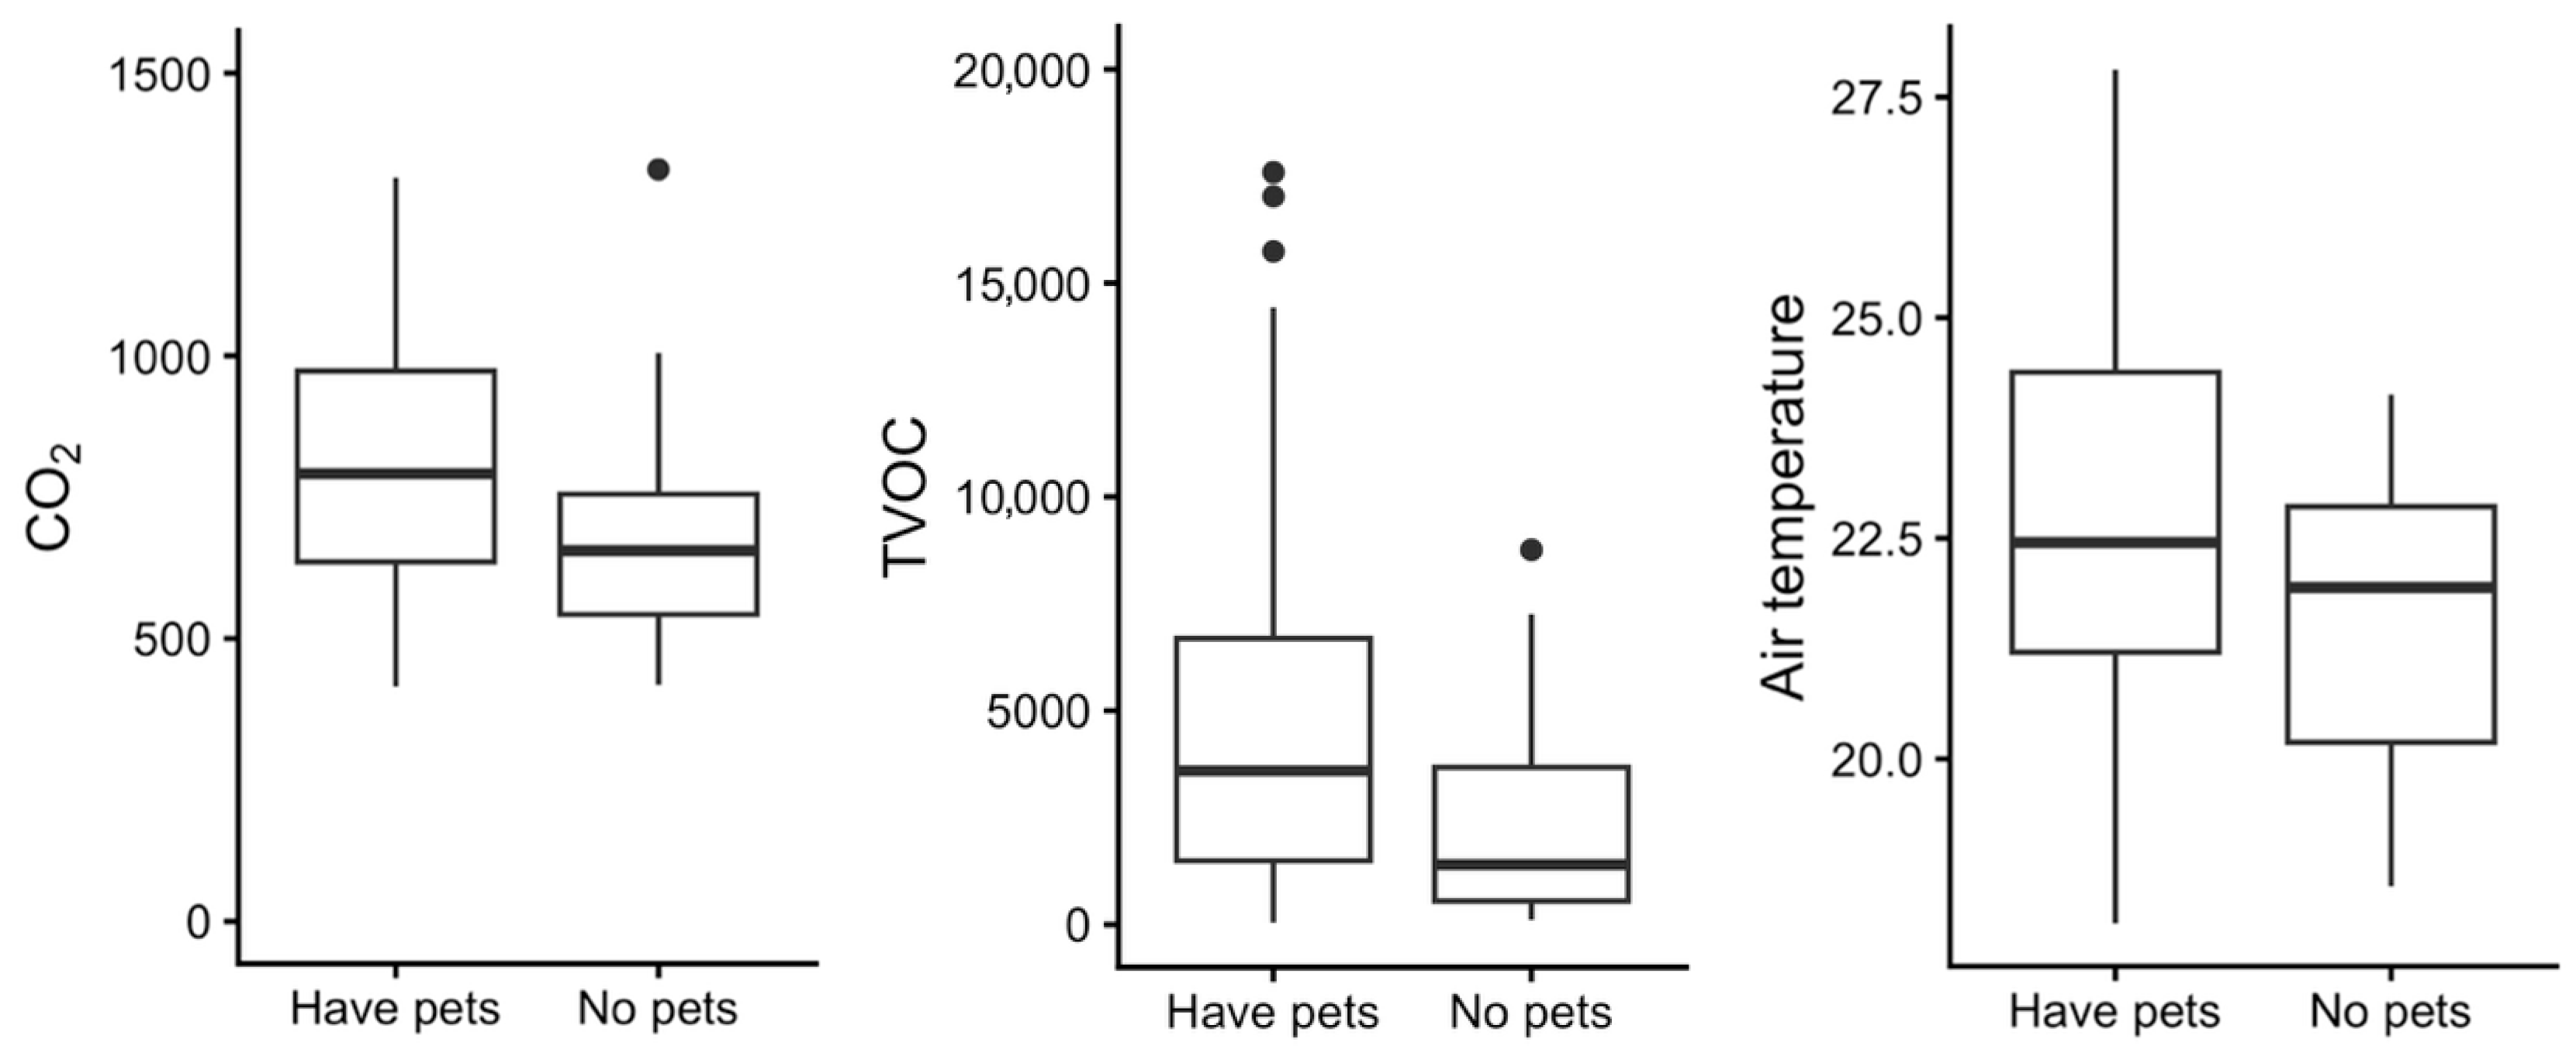
The presence of pets significantly impacts measured IEQ parameters, including CO2 levels (t = 2.46, p < 0.05, d = 0.80), TVOC levels (t = 2.87, p < 0.01, d = 0.81) and air temperature (t = 2.21, p < 0.05, d = 0.83, Figure 7). Homes with pets exhibited higher mean CO2 levels of 882 ppm compared to homes without pets (689 ppm), suggesting that pet presence may contribute to increased indoor carbon dioxide concentrations, potentially due to additional respiration and reduced ventilation efficiency. TVOC levels were also significantly higher in homes with pets (5903 ppb; 2637 ppb for no pets), with a wider range and several extreme values, indicating that pet-related activities or products, such as pet dander, cleaning supplies, and pet-related emissions, might contribute to elevated indoor air pollutants. In terms of air temperature, homes with pets showed a slightly higher temperature on average (22.8 °C) compared to homes without pets (21.7 °C). These findings highlight that having pets can have a measurable impact on indoor environmental conditions.

3.4. Perception and Measured IEQ Across Work Settings

This section compares IEQ satisfaction across three work settings and investigates how objectively measured IEQ parameters differ between groups reporting higher vs. lower satisfaction, using measured data from home and WFWLL conditions.

3.4.1. Perceived IEQ Across Work Settings

IEQ perception was collected once a week in each work location during the study, resulting in 64 responses for WFH, 65 responses for WFWLL, and 18 responses for the FW condition (employer’s office). Responses in the FW condition were collected only if participants worked in the employer’s office at least once during the FW condition. Additionally, we analyzed how measured IEQ parameters are distributed based on differences in subjective perceptions, offering a comprehensive view of the relationship between perceived and measured environmental quality.
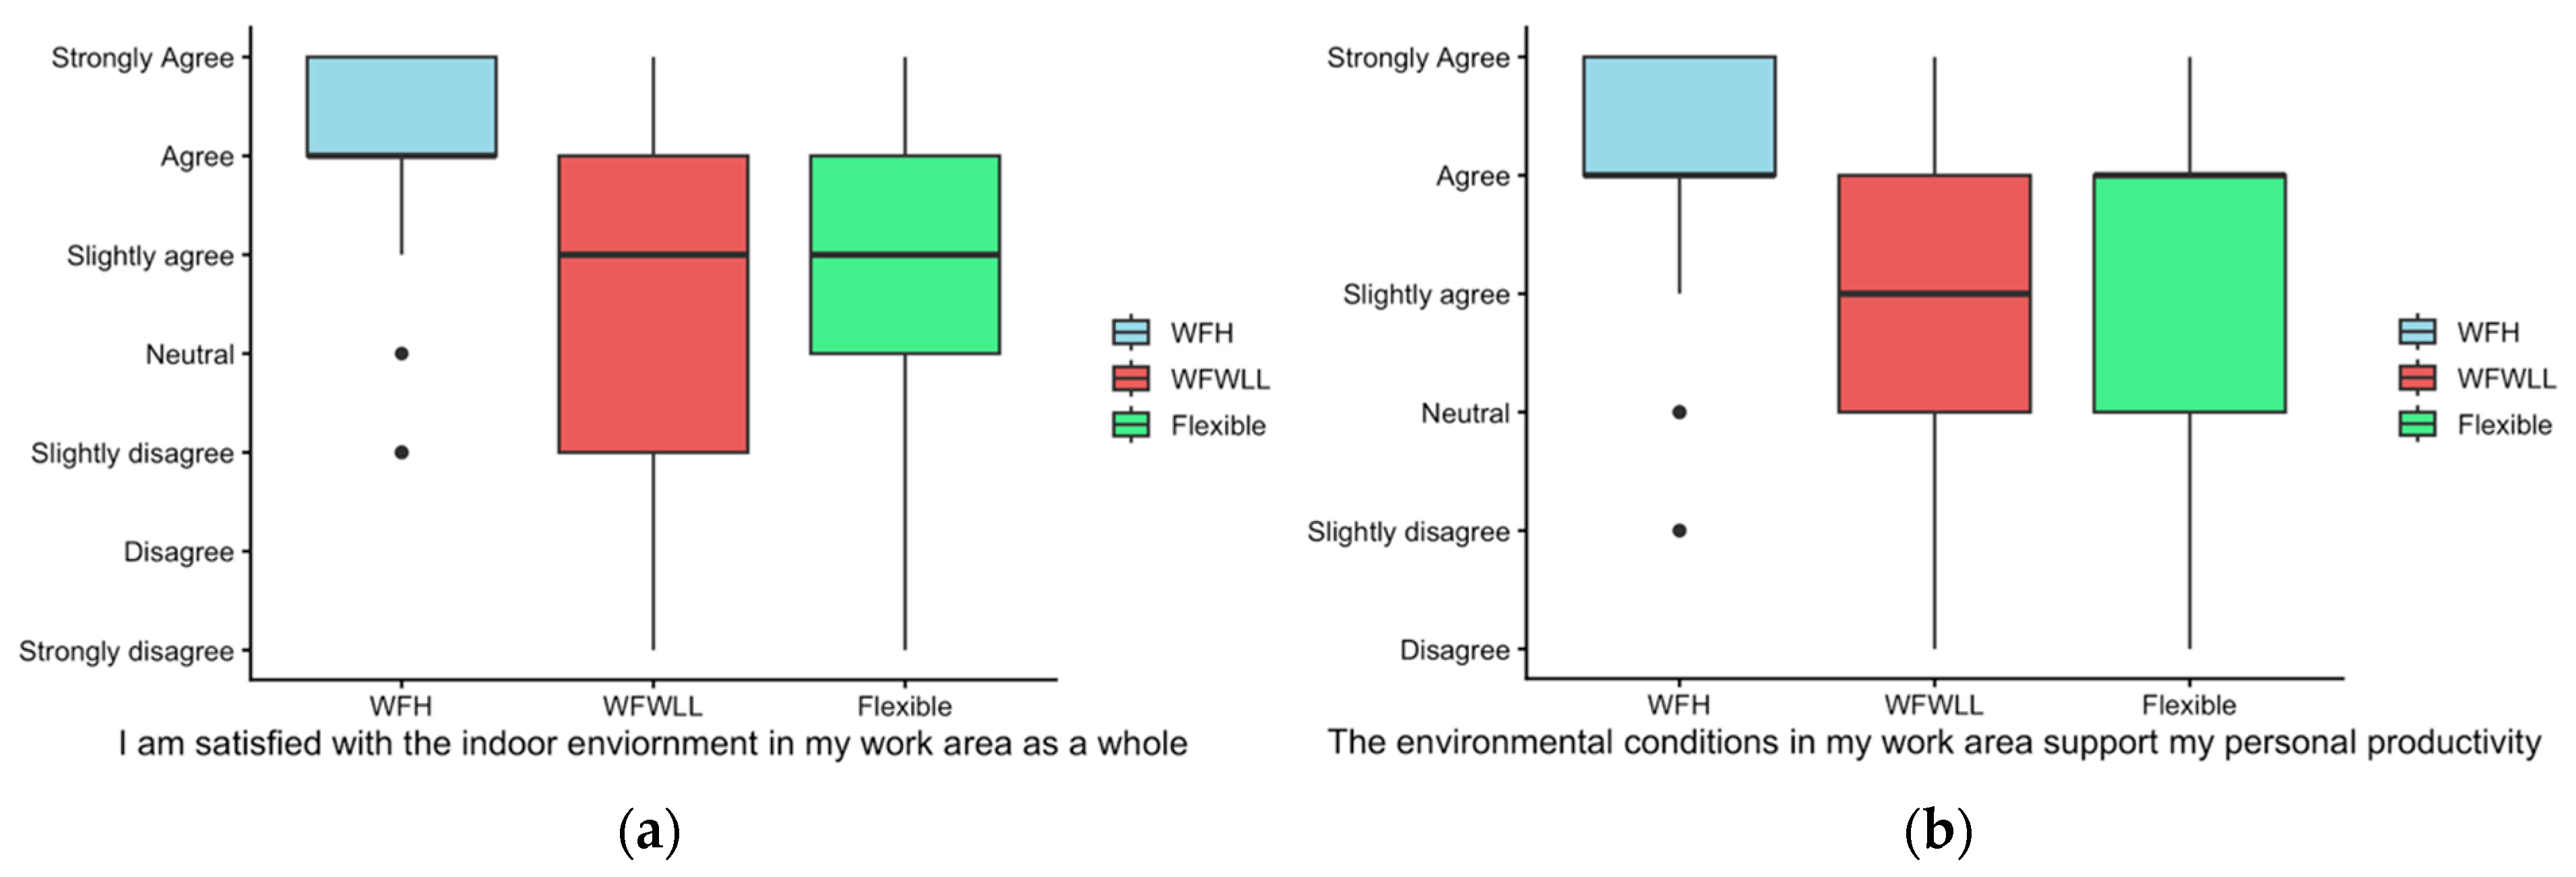
Overall environmental satisfaction responses consisted of two aspects of (a) satisfaction with the indoor environment as a whole and (b) environmental support for personal productivity (Figure 8). The WFH condition resulted in significantly higher satisfaction than the other two work settings (5.8 on average on a scale of 1 to 7, F = 8.96, p < 0.001, η2 = 0.22), with responses mostly in the “Agree” and “Strongly Agree” range. Satisfaction in the WFWLL shows an average of 4.8 with greater variability, with responses ranging from “Slightly Disagree” to “Strongly Agree,” indicating mixed perceptions despite the ideal office setup. In the employer’s office, moderate satisfaction with an average of 4.9 was demonstrated, with responses clustering around “Agree” and “Slightly Agree,” reflecting a balanced experience. Regarding environmental support for productivity, WFH resulted in significantly higher satisfaction (5.8, F = 8.25, p < 0.001, η2 = 0.10), while WFWLL responses varied, with lower mean satisfaction of 5.0. The employer’s office again falls in between with 5.2 on average, suggesting that it offers reasonable support but not to the level of a WFH condition.
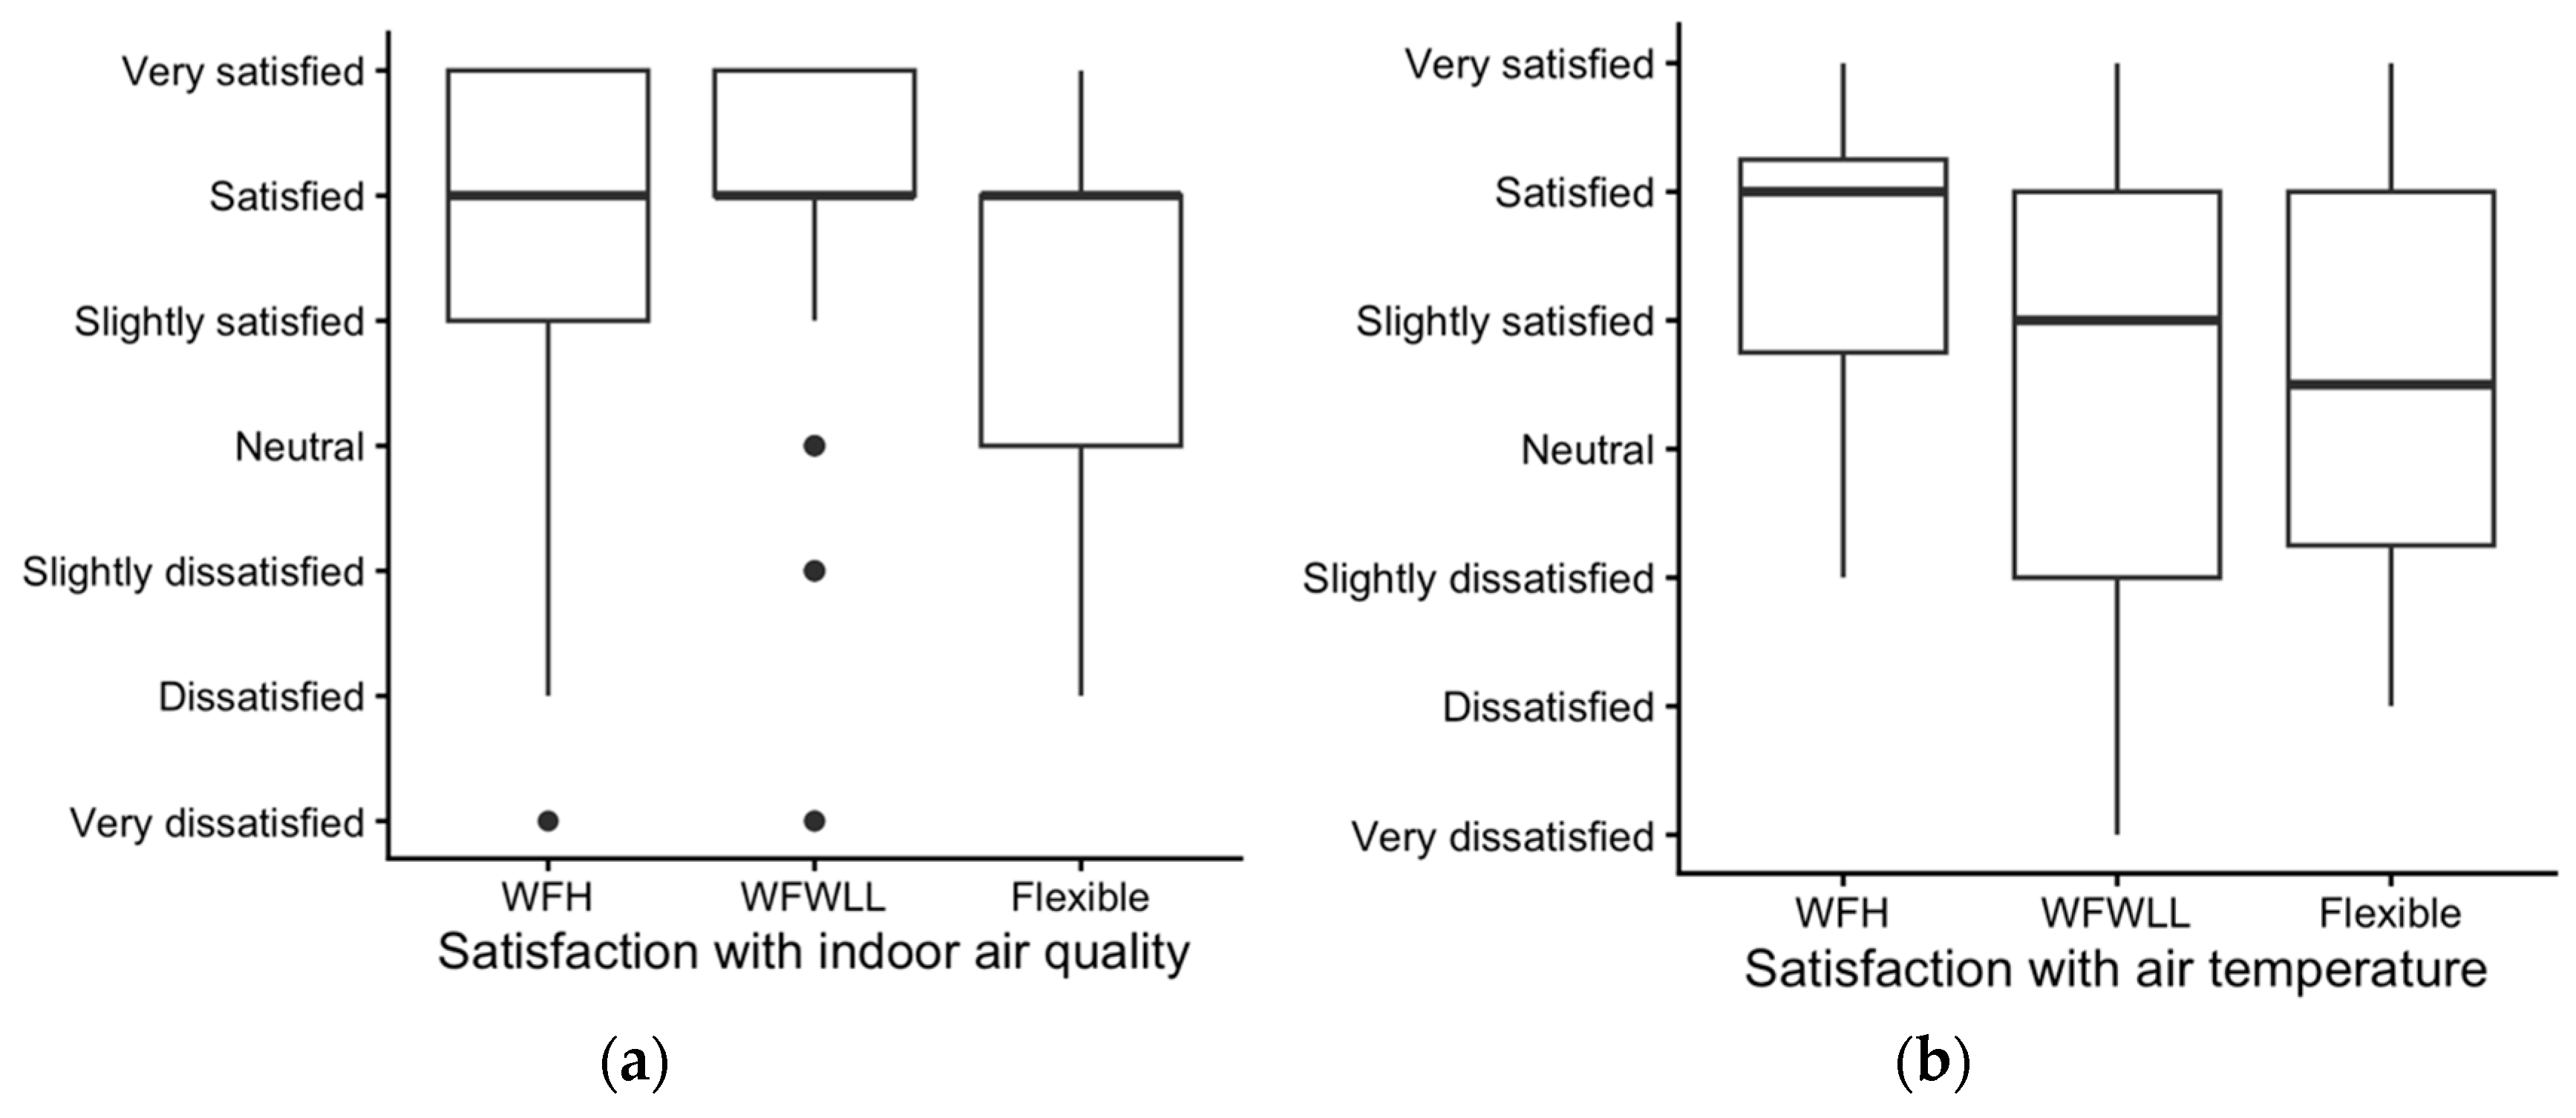
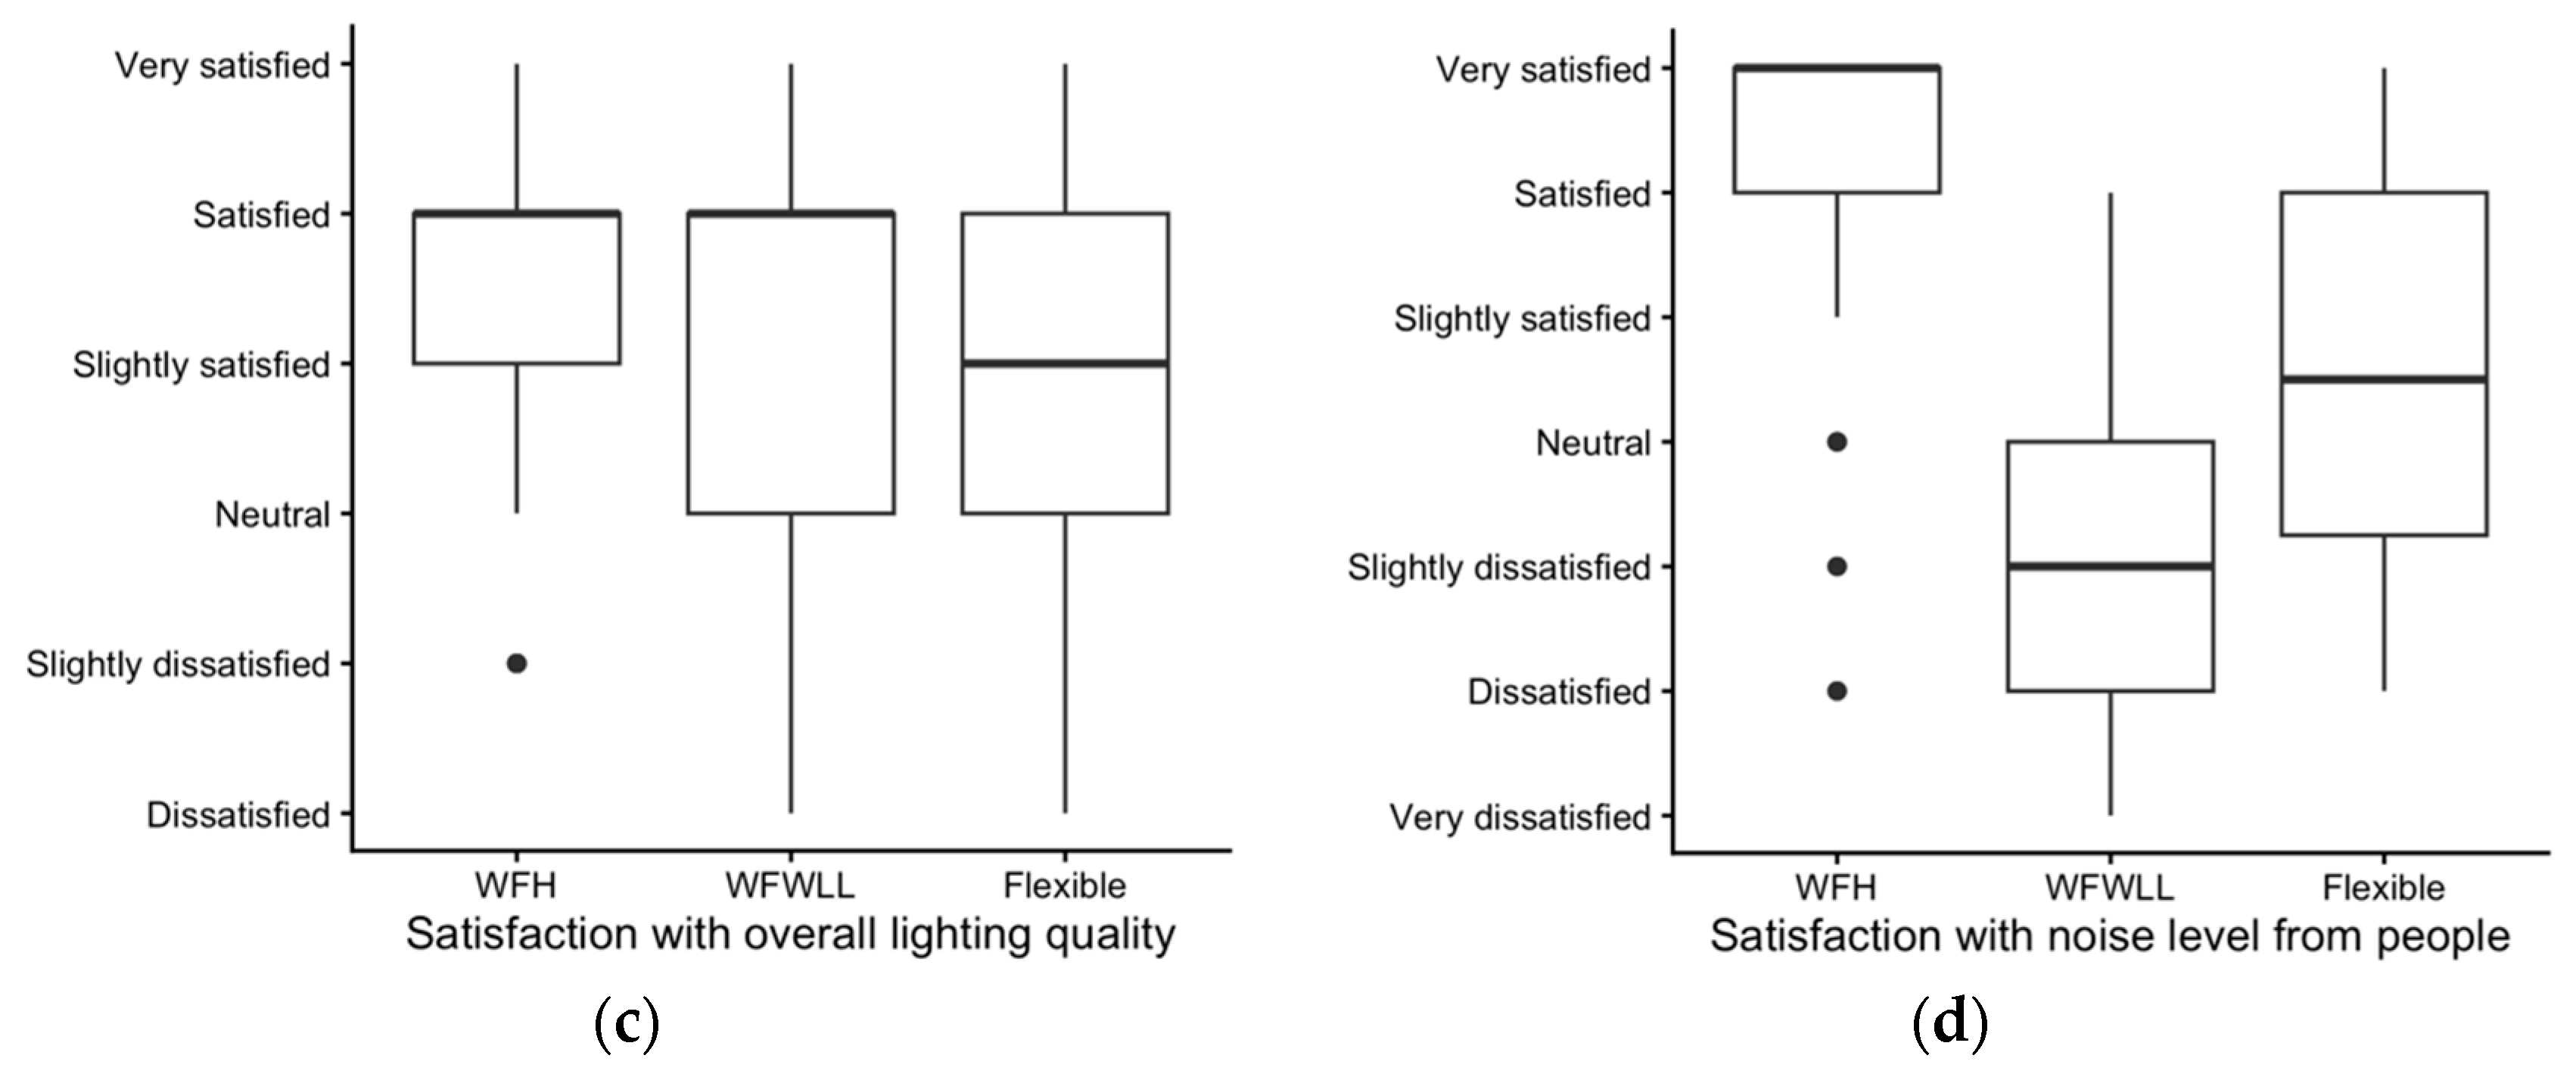
Satisfaction responses broken down by environmental qualities of air, thermal, lighting, and acoustics showed differences between the work settings (Figure 9). The WFH and WFWLL conditions resulted in higher satisfaction with indoor air quality (5.6 and 5.7 on average) than the employer’s office (5 on average), but the differences were not statistically significant (Figure 9a). For air temperature (Figure 9b), WFH resulted in significantly higher satisfaction (5.5, F = 8.50, p < 0.001, η2 = 0.11) than the WFWLL and employer’s office (4.5 and 4.7). Next, satisfaction with overall lighting quality (Figure 9c) showed marginal difference between the conditions (F = 2.59, p = 0.08, η2 = 0.04), where WFH and WFWLL conditions showed higher satisfaction (5.6 and 5.3) than the employer’s office (4.8). Lastly, satisfaction with noise levels from people (Figure 9d) was the highest at WFH (6.1), followed by the employer’s office (4.6) and then the WFWLL condition (3.0, F = 67.32, p < 0.001, η2 = 0.48). A possible reason for dissatisfaction with noise at the WFWLL condition is high occupancy within the open space for efficient study operation.
Overall, the findings suggest that the WFH condition resulted in high satisfaction levels overall, likely due to greater personal control over environmental factors. Although the WLL office is designed as an ideal IEQ environment, variability in responses indicates that occupants cannot perceive IEQ differences correctly (especially IAQ). Also, an office environment may not fully address individual needs or provide controls for comfort. Satisfaction in the employer’s office remained similar to the WFWLL condition, suggesting that flexibility in commuting or work pattern might not contribute to IEQ perception.

3.4.2. Perceived and Measured IEQ Across Work Settings

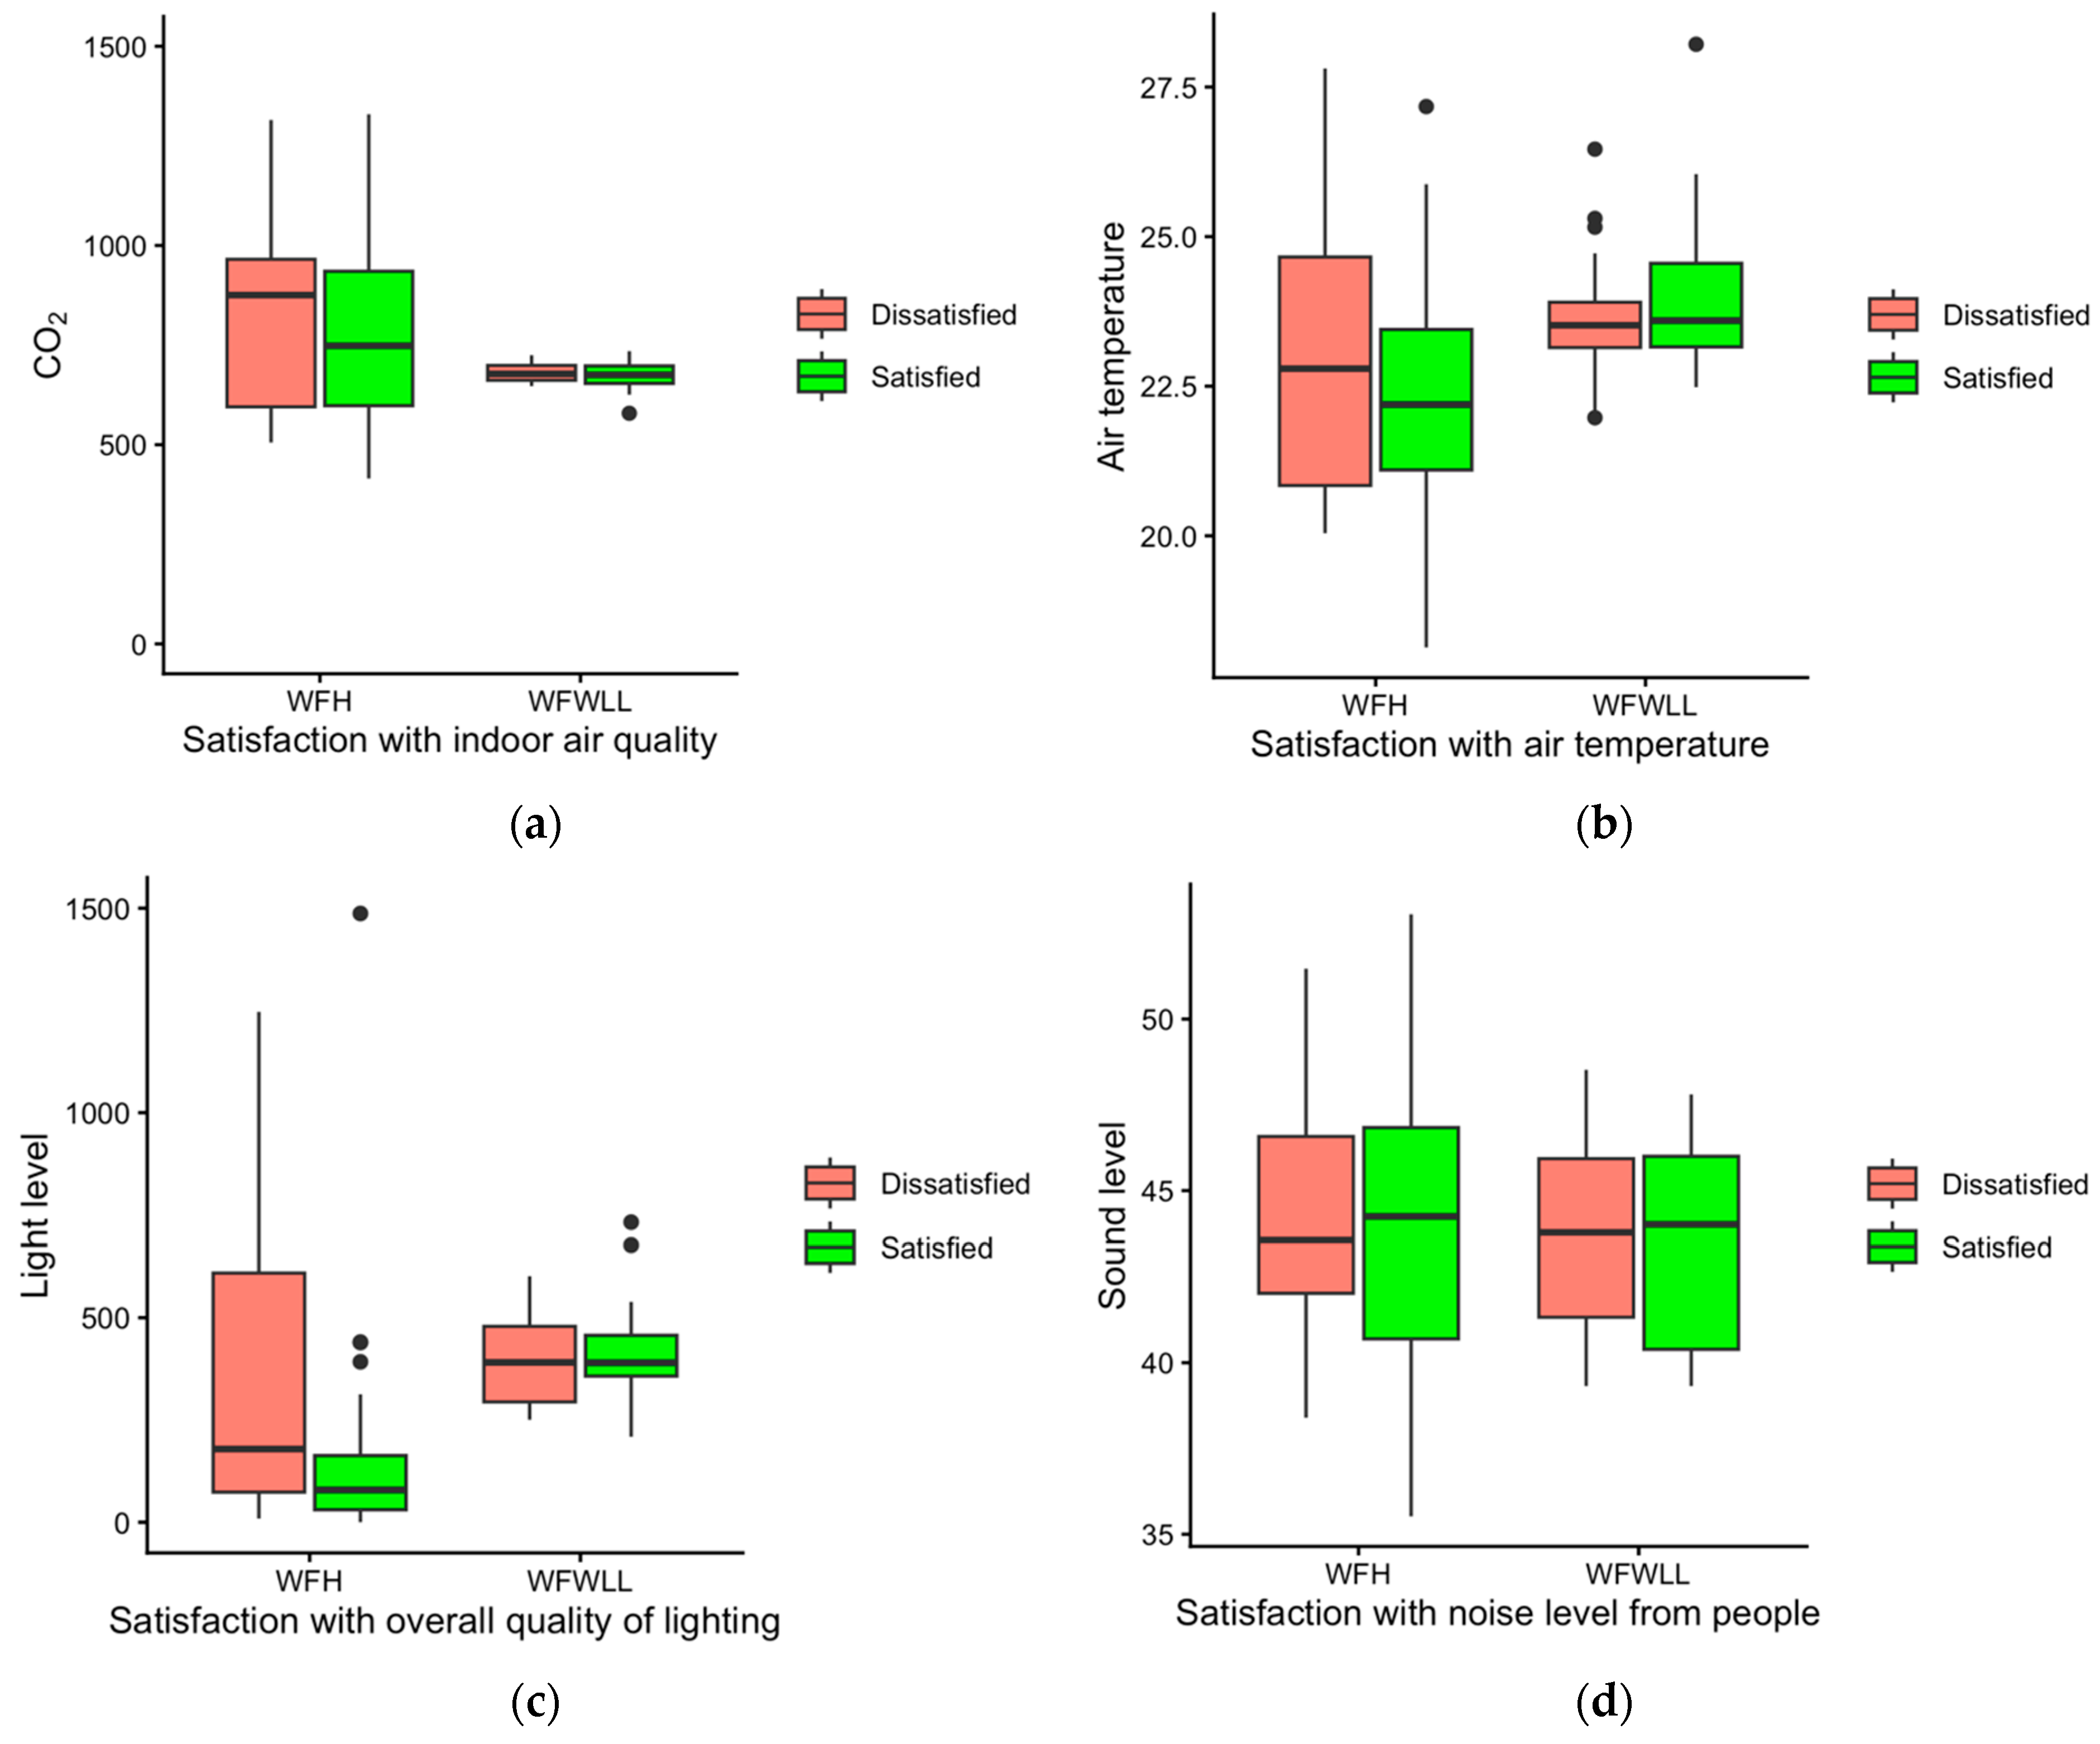
Further analysis was conducted to evaluate the relationship between measured IEQ and IEQ satisfaction in WFH and WFWLL conditions. This evaluation provides insights into how measured IEQ (CO2 levels, air temperature, light levels, and sound levels) varies between the satisfaction groups and the work settings (Figure 10).
In terms of CO2 levels, the mean values indicate that satisfied participants experienced lower CO2 concentrations compared to dissatisfied ones in both conditions (Figure 10a). Specifically, mean CO2 levels were 878 ppm and 828 ppm for dissatisfied and satisfied respondents in the WFH condition, respectively, and 682 ppm and 673 ppm in the WFWLL condition. This shows that occupants can be either satisfied or dissatisfied within the CO2 levels between 600 and 900 ppm, suggesting that air quality satisfaction is not dependent on the measured CO2 levels. In the WFH condition, air temperature was significantly lower for the satisfied (22.2 °C) than for the dissatisfied participants (23.0 °C, t = 2.16, p < 0.05, d = 1.02; Figure 10b). However, in the WFWLL condition, although it was a well-controlled environment at 23.9 °C, similar numbers of people voted for satisfaction and dissatisfaction. This indicates that people may prefer cooler conditions in the WFH condition, whereas thermal expectation changes in the WFWLL condition. Similarly to air temperature, measured light levels for the satisfied (121 lux) and dissatisfied (186 lux) participants showed differences in the WFH condition, suggesting that people prefer a darker working environment at home (Figure 10c). However, in the WFWLL condition, where light levels are much brighter on average (350 lux), more than 70% reported satisfaction. There seemed to be no consistency in satisfactory light levels to draw a firm conclusion. Sound levels were similar across satisfaction groups and experimental conditions, with no substantial differences in mean values between satisfied and dissatisfied participants (43–44 dB, Figure 10d).
The findings of this study support the hypothesis that work context mediates perceived IEQ satisfaction independently of objectively measured conditions. Consistent with environmental psychology literature, perceived IEQ was often more favorable in home working environments despite objectively poorer air quality in some cases, suggesting that satisfaction is shaped not only by physical parameters but also by psychological and contextual factors. Working from home may enhance feelings of autonomy and perceived control over one’s environment, which have been shown to positively influence comfort, satisfaction, and well-being even when environmental conditions are suboptimal [33,34]. In addition, emotional bonds, familiarity, and personal meaning associated with home environments may lead to more favorable evaluations and greater tolerance of environmental shortcomings compared to institutional or shared office settings, as described by place attachment theory [35,36]. These interpretations are consistent with prior IEQ research demonstrating that occupant satisfaction frequently diverges from measured environmental parameters and is strongly influenced by perceived control, expectations, and contextual factors [37,38]. Together, these findings align with and extend the existing literature by demonstrating, through direct comparison across work settings, that psychological and contextual factors play a critical role in shaping IEQ perception, underscoring the limitations of relying solely on physical metrics to evaluate indoor environmental quality and occupant experience.

4. Conclusions

This study offers a comprehensive comparison of perceived and measured IEQ across three working conditions—WFH, from a standard compliant office at WLL, and from employer offices. The most consistent finding was that IEQ satisfaction was notably higher in WFH environments across nearly all domains, particularly with regard to thermal comfort and noise levels. Participants reported a stronger sense of environmental support and personal comfort while working from home, despite objective measurements in some cases suggesting less-than-ideal conditions by traditional standards.
Crucially, the present study reveals a fundamental disconnect between objective IEQ metrics and subjective environmental satisfaction. Our analyses found no consistent relationship between measured values—such as CO2 levels, temperature, lighting, or sound—and reported satisfaction. Participants often expressed either satisfaction or dissatisfaction under similar physical environmental conditions depending on whether they were working from home or from an office. This indicates that the threshold for satisfaction is not fixed but instead context-sensitive. In other words, the same temperature, sound level, or CO2 concentration may be perceived positively in one environment (e.g., home) and negatively in another (e.g., office). These results suggest that expectations, perceived control, environmental familiarity, and possibly even psychological priming based on context significantly shape how occupants interpret and respond to environmental stimuli.
This finding challenges a core assumption in building science and workplace design—that optimizing objective environmental parameters alone is sufficient to ensure occupant comfort and satisfaction. Even in the WLL office—designed with best-practice IEQ standards and real-time monitoring—participants did not report the highest levels of comfort or perceived environmental support. This disconnect highlights limitations of prescriptive, one-size-fits-all standards when applied to diverse and evolving work contexts. The perceived lack of control and the shared, standardized nature of the office environment likely contributed to this disconnect, whereas the flexibility and customization possible in home environments fostered a greater sense of alignment between personal needs and environmental conditions.
Interestingly, the type of home office setup (dedicated vs. shared space) had little impact on satisfaction, reinforcing that environmental autonomy and personal adaptation behaviors may be more critical than spatial configuration. Similarly, while offices were generally better equipped with ergonomic tools and technical resources, this did not translate into higher IEQ satisfaction, suggesting that resource-intensive design interventions do not necessarily yield proportional gains in occupant experience.
These findings have important implications for employers, architects, facility managers, and policymakers navigating the future of work. As hybrid work models become more permanent, sustainable work design strategies should prioritize environmental adaptability, individual control, and context-aware customization over rigid optimization based on normative thresholds. Providing occupants with tools to adjust their environments—and with the autonomy to choose where and how they work—may be more effective than traditional “ideal” designs in fostering well-being and performance.
Future research should further explore the cognitive and contextual mechanisms behind these divergent satisfaction thresholds. Longitudinal and cross-cultural studies may also help clarify how values, habits, and psychological adaptation shape the perception of IEQ in evolving work arrangements. Such insights are critical for informing sustainable building policies and residential design practices as homes increasingly function as long-term work environments. Overall, this study affirms that creating effective and supportive work environments requires more than meeting technical standards—it demands aligning with the lived experiences and expectations of users.

Supplementary Materials

The following supporting information can be downloaded at: https://www.mdpi.com/article/10.3390/su18031144/s1, Supplementary A: Baseline survey.

Author Contributions

Y.J.S. contributed to methodology, data acquisition, analysis, visualization, writing, and interpretation. Z.C.P. contributed to conceptualization, methodology, and review. K.B. contributed to conceptualization, methodology, and review. M.K. contributed to conceptualization, methodology, data acquisition, and review. All authors have read and agreed to the published version of the manuscript.

Funding

This study is co-funded by Delos Living, LLC, and Johnson Controls International. However, neither Delos Living, LLC, nor Johnson Controls International influenced any aspect of the study design.

Institutional Review Board Statement

The study was conducted in accordance with the Declaration of Helsinki and approved by the Institutional Review Board of Mayo Clinic (protocol code 22-011790 and date of approval 8 February 2023).

Informed Consent Statement

Informed consent was obtained from all subjects involved in the study.

Data Availability Statement

The data presented in this study are available on request from the corresponding author due to the data including participant information, which is restricted for ethical and privacy reasons.

Acknowledgments

We wish to thank Eric Heins, Brant Staven, Jeremiah Carlin, and Chi Lam for helping to set up the lab and equipment and collect the data, and Jon Douglas and Brennan Fentzlaff for their informal feedback on early study concepts.

Conflicts of Interest

Authors Young Joo Son, Zachary C. Pope, Kunjoon Byun and Meng Kong were employed by the company Delos Living LLC. The authors declare that this study received funding from Johnson Controls International. The funder’s involvement with the study was limited to providing financial support.

References

  1. Patanjali, S.; Bhatta, N.M.K. Work from home during the pandemic: The impact of organizational factors on the productivity of employees in the IT industry. Vision 2025, 29, 326–338. [Google Scholar] [CrossRef] [Scilit]
  2. Barone Gibbs, B.; Kline, C.E.; Huber, K.A.; Paley, J.L.; Perera, S.J.O.M. Covid-19 shelter-at-home and work, lifestyle and well-being in desk workers. Occup. Med. 2021, 71, 86–94. [Google Scholar] [CrossRef] [Scilit] [PubMed]
  3. Bartik, A.W.; Cullen, Z.B.; Glaeser, E.L.; Luca, M.; Stanton, C.T. What Jobs Are Being Done at Home During the COVID-19 Crisis? Evidence from Firm-Level Surveys; National Bureau of Economic Research: Cambridge, MA, USA, 2020. [Google Scholar]
  4. Appel-Meulenbroek, R.; Kemperman, A.; van de Water, A.; Weijs-Perrée, M.; Verhaegh, J. How to attract employees back to the office? A stated choice study on hybrid working preferences. J. Environ. Psychol. 2022, 81, 101784. [Google Scholar] [CrossRef] [Scilit]
  5. Barath, M.; Schmidt, D.A. Offices after the COVID-19 pandemic and changes in perception of flexible office space. Sustainability 2022, 14, 11158. [Google Scholar] [CrossRef] [Scilit]
  6. Vyas, L. “New normal” at work in a post-COVID world: Work–life balance and labor markets. Policy Soc. 2022, 41, 155–167. [Google Scholar] [CrossRef] [Scilit]
  7. Kitagawa, R.; Kuroda, S.; Okudaira, H.; Owan, H. Working from home: Its effects on productivity and mental health. Covid Econ. 2021, 74, 142–171. [Google Scholar]
  8. Marikyan, D.; Papagiannidis, S.; FRana, O.; Ranjan, R. Working in a smart home environment: Examining the impact on productivity, well-being and future use intention. Internet Res. 2024, 34, 447–473. [Google Scholar] [CrossRef] [Scilit]
  9. George, T.J.; Atwater, L.E.; Maneethai, D.; Madera, J.M. Supporting the productivity and wellbeing of remote workers: Lessons from COVID-19. Organ. Dyn. 2022, 51, 100869. [Google Scholar] [CrossRef] [Scilit] [PubMed]
  10. Rana, O.; Ranjan, R.; Papagiannidis, S.; Marikyan, D. Working in a smart home-office: Exploring the impacts on productivity and wellbeing. In Proceedings of the 17th International Conference on Web Information Systems and Technologies—WEBIST, Valletta, Malta, 26–28 October 2021. [Google Scholar]
  11. Roh, T.; Moreno-Rangel, A.; Baek, J.; Obeng, A.; Hasan, N.T.; Carrillo, G. Indoor air quality and health outcomes in employees working from home during the COVID-19 pandemic: A pilot study. Atmosphere 2021, 12, 1665. [Google Scholar] [CrossRef] [Scilit]
  12. Pang, Z.; Becerik-Gerber, B.; Hoque, S.; O’Neill, Z.; Pedrielli, G.; Wen, J.; Wu, T. How work from home has affected the occupant’s well-being in the residential built environment: An international survey amid the COVID-19 pandemic. J. Eng. Sustain. Build. Cities 2021, 2, 041003. [Google Scholar] [CrossRef] [Scilit]
  13. Chu, M.T.; Gillooly, S.E.; Levy, J.I.; Vallarino, J.; Reyna, L.N.; Laurent, J.G.C.; Coull, B.A.; Adamkiewicz, G. Real-time indoor PM2.5 monitoring in an urban cohort: Implications for exposure disparities and source control. Environ. Res. 2021, 193, 110561. [Google Scholar] [CrossRef] [Scilit]
  14. Kawakubo, S.; Arata, S. Study on residential environment and workers’ personality traits on productivity while working from home. Build. Environ. 2022, 212, 108787. [Google Scholar] [CrossRef] [Scilit]
  15. Awada, M.; Lucas, G.; Becerik-Gerber, B.; Roll, S. Working from home during the COVID-19 pandemic: Impact on office worker productivity and work experience. Work 2021, 69, 1171–1189. [Google Scholar] [CrossRef] [Scilit]
  16. Xiao, Y.; Becerik-Gerber, B.; Lucas, G.; Roll, S.C. Impacts of working from home during COVID-19 pandemic on physical and mental well-being of office workstation users. J. Occup. Environ. Med. 2021, 63, 181–190. [Google Scholar] [CrossRef] [Scilit] [PubMed]
  17. Parker, K.; Horowitz, J.M.; Minkin, R. How the coronavirus outbreak has–and hasn’t–changed the way Americans work. Pew Res. Cent. 2020, 9, 1–32. [Google Scholar]
  18. Ipsen, C.; van Veldhoven, M.; Kirchner, K.; Hansen, J.P. Six key advantages and disadvantages of working from home in Europe during COVID-19. Int. J. Environ. Res. Public Health 2021, 18, 1826. [Google Scholar] [CrossRef] [Scilit]
  19. Wood, S.; Michaelides, G.; Inceoglu, I.; Niven, K.; Kelleher, A.; Hurren, E.; Daniels, K. Satisfaction with one’s job and working at home in the COVID-19 pandemic: A two-wave study. Appl. Psychol. 2023, 72, 1409–1429. [Google Scholar] [CrossRef] [Scilit]
  20. Mohammed, Z.; Nandwani, D.; Saboo, A.; Padakannaya, P. Job satisfaction while working from home during the COVID-19 pandemic: Do subjective work autonomy, work-family conflict, and anxiety related to the pandemic matter? Cogent Psychol. 2022, 9, 2087278. [Google Scholar] [CrossRef] [Scilit]
  21. Bellmann, L.; Hübler, O. Working from home, job satisfaction and work–life balance–robust or heterogeneous links? Int. J. Manpow. 2021, 42, 424–441. [Google Scholar] [CrossRef] [Scilit]
  22. Guo, X.; Chen, Y. Comparing Impacts of Indoor Environmental Quality Factors on Satisfaction of Occupants with Different Genders and Ages between Office-and Home-Based Work Environments. In Construction Research Congress 2022; American Society of Civil Engineers: Arlington, VA, USA, 2022; pp. 569–577. [Google Scholar]
  23. Lee, P.J.; Jeong, J.H. Attitudes towards outdoor and neighbour noise during the COVID-19 lockdown: A case study in London. Sustain. Cities Soc. 2021, 67, 102768. [Google Scholar] [CrossRef] [Scilit]
  24. Cuerdo-Vilches, T.; Navas-Martín, M.Á.; Oteiza, I. Working from home: Is our housing ready? Int. J. Environ. Res. Public Health 2021, 18, 7329. [Google Scholar] [CrossRef] [Scilit]
  25. Salamone, F.; Barozzi, B.; Bellazzi, A.; Belussi, L.; Danza, L.; Devitofrancesco, A.; Ghellere, M.; Meroni, I.; Scamoni, F.; Scrosati, C. Working from home in Italy during COVID-19 lockdown: A survey to assess the indoor environmental quality and productivity. Buildings 2021, 11, 660. [Google Scholar] [CrossRef] [Scilit]
  26. Torresin, S.; Ratcliffe, E.; Aletta, F.; Albatici, R.; Babich, F.; Oberman, T.; Kang, J. The actual and ideal indoor soundscape for work, relaxation, physical and sexual activity at home: A case study during the COVID-19 lockdown in London. Front. Psychol. 2022, 13, 1038303. [Google Scholar] [CrossRef] [Scilit]
  27. Manu, S.; Burgholz, T.M.; Nabilou, F.; Rewitz, K.; El-Mokadem, M.; Yadav, M.; Chinazzo, G.; Rupp, R.F.; Azar, E.; Syndicus, M.; et al. A state-of-the-art, systematic review of indoor environmental quality studies in work-from-home settings. Build. Environ. 2024, 259, 111652. [Google Scholar] [CrossRef] [Scilit]
  28. Ferreira, A.; Barros, N. COVID-19 and lockdown: The potential impact of residential indoor air quality on the health of teleworkers. Int. J. Environ. Res. Public Health 2022, 19, 6079. [Google Scholar] [CrossRef] [Scilit]
  29. Thapa, S.; Singh, R.; Bundele, M.; Thapa, S.; Thadathil, G.; Kr Jakhar, Y. Study of thermal comfort in the residents of different climatic regions of India—Effect of the COVID-19 lockdown. Indoor Air 2021, 31, 899–917. [Google Scholar] [CrossRef] [Scilit]
  30. Manu, S.; Rysanek, A. An overview of indoor environmental conditions in work-from-home settings. E3S Web Conf. 2023, 396, 01075. [Google Scholar] [CrossRef] [Scilit]
  31. Awada, M.; Becerik-Gerber, B.; Lucas, G.; Roll, S.C. Associations among home indoor environmental quality factors and worker health while working from home during COVID-19 pandemic. J. Eng. Sustain. Build. Cities 2021, 2, 041001. [Google Scholar] [CrossRef] [Scilit]
  32. Manu, S.; Rysanek, A. A novel dataset of indoor environmental conditions in work-from-home settings. Build. Environ. 2025, 267, 112222. [Google Scholar] [CrossRef] [Scilit]
  33. Deci, E.L.; Ryan, R.M. The” what” and” why” of goal pursuits: Human needs and the self-determination of behavior. Psychol. Inq. 2000, 11, 227–268. [Google Scholar] [CrossRef] [Scilit]
  34. Ryan, R.M.; Deci, E.L. Intrinsic and extrinsic motivations: Classic definitions and new directions. Contemp. Educ. Psychol. 2000, 25, 54–67. [Google Scholar] [CrossRef] [Scilit] [PubMed]
  35. Altman, I.; Low, S.M. (Eds.) Place Attachment; Springer Science & Business Media: New York, NY, USA, 2012; Volume 12. [Google Scholar]
  36. Scannell, L.; Gifford, R. Defining place attachment: A tripartite organizing framework. J. Environ. Psychol. 2010, 30, 1–10. [Google Scholar] [CrossRef] [Scilit]
  37. De Dear, R.; Brager, G.S. Developing an Adaptive Model of Thermal Comfort and Preference. 1998. Available online: https://escholarship.org/uc/item/4qq2p9c6 (accessed on 10 December 2025).
  38. Frontczak, M.; Wargocki, P. Literature survey on how different factors influence human comfort in indoor environments. Build. Environ. 2011, 46, 922–937. [Google Scholar] [CrossRef] [Scilit]
Figure 1. Office layout for WFWLL condition.
Sustainability 18 01144 g001
Figure 2. Satisfaction responses at home vs. employer’s office.
Sustainability 18 01144 g002
Figure 3. Home type and measured environment.
Sustainability 18 01144 g003
Figure 4. CO2 levels by the number of individuals at home/frequency of taking care of children.
Sustainability 18 01144 g004
Figure 5. Sound levels by the number of individuals at home/frequency of taking care of children.
Sustainability 18 01144 g005
Figure 6. Sound levels and wall-to-wall carpeting.
Sustainability 18 01144 g006
Figure 7. Measured IEQ differences in CO2 (ppm), TVOC (ppb), and air temperature (°C), and presence of pets at home.
Sustainability 18 01144 g007
Figure 8. Comparison of overall environmental satisfaction between three work settings: (a) indoor environmental satisfaction as a whole, (b) environmental support on productivity.
Sustainability 18 01144 g008
Figure 9. Satisfaction with (a) indoor air quality, (b) air temperature, (c) overall lighting quality, and (d) noise level from people in the three work settings.
Sustainability 18 01144 g009aSustainability 18 01144 g009b
Figure 10. Measured IEQ (a) CO2 (ppm), (b) air temperature (°C), (c) light level (lux), and (d) sound level (dB) between the satisfied and dissatisfied participants in the two experimental conditions of WFH and WFWLL.
Sustainability 18 01144 g010
Table 1. IEQ perception results by gender and age (mean ± sd).
MaleFemaleAge Under 40Age 40–49Age 50 or Older
Overall satisfaction5.94 ± 0.835.27 ± 1.615.54 ± 1.365.52 ± 1.565.19 ± 1.56
Air quality satisfaction5.71 ± 0.925.81 ± 1.185.42 ± 1.366.09 ± 0.855.94 ± 0.85
Air temperature satisfaction5.35 ± 1.695.44 ± 1.275.23 ± 1.375.61 ± 1.415.44 ± 1.41
Lighting satisfaction5.65 ± 1.275.40 ± 1.455.23 ± 1.316.09 ± 1.164.94 ± 1.61
Sound satisfaction5.94 ± 0.905.58 ± 1.155.58 ± 1.175.91 ± 0.905.50 ± 1.21
Perceived productivity5.71 ± 0.995.90 ± 1.105.65 ± 1.096.09 ± 0.795.81 ± 1.33
Table 2. Environmental setting comparison between home and employer’s office.
HomeEmployer’s Office
Air
Wall-to-wall carpeting63%85%
Smoker5%8%
Smoking indoors4%3%
Signs of moisture or mold damage8%8%
Pets76%Not applicable
Streets with heavy traffic15%Not applicable
Windows
Have windows96% (71/74)55% (32/58)
Have seated views, if windows present89% (63/71)56% (18/32)
Have shading devices, if windows present90% (64/71)69% (22/32)
Acoustic/noise concerns
Mechanical noise5 (8%)7 (14%)
Traffic noise7 (11%)5 (10%)
Noise from family members/roommates/coworkers20 (31%)15 (29%)
Type of floor
Carpet36 (55%)44 (86%)
Hard surface27 (42%)6 (12%)
Others2 (Mixed) (3%)1 (2%)
Portable devices
Fans20 (31%)7 (14%)
Heater17 (26%)8 (16%)
Humidifier6 (9%)2 (4%)
Air purifier6 (9%)3 (6%)
Task light/desk lamp26 (40%)3(6%)
None of the above22 (34%)28 (55%)
Plants28 (43%)14 (27%)
Ergonomic Furniture
Adjustable chair54 (83%)48 (94%)
Adjustable (Sit–stand) desk25 (38%)28 (55%)
Ergonomic keyboard and/or mouse21 (32%)16 (31%)
Adjustable monitor40 (62%)41 (80%)
Office Supplies
Printer37 (57%)31 (61%)
Monitors51 (78%,
mostly dual monitors)
42 (82%)
Office phone6 (9%)15 (29%)
Web camera56 (86%)43 (84%)
Headset or earphones56 (86%)39 (76%)
Good network connection62 (95%)47 (92%)
Table 3. Effect of individual environmental satisfaction on overall environmental satisfaction at employer’s office.
βStandard ErrorT ValuePr (>|t|)
Intercept0.130130.649340.2000.842
Air quality satisfaction0.657630.132604.960<0.001 ***
Air temperature satisfaction−0.041250.12618−0.3270.745
Lighting satisfaction0.084950.100990.8410.404
Sound satisfaction0.241550.115952.0830.042 *
Note: * p < 0.05, *** p < 0.001.
Table 4. Effect of individual environmental satisfaction on overall environmental satisfaction at home.
βStandard ErrorT ValuePr (>|t|)
Intercept2.50240.98592.5380.0133 *
Air quality satisfaction−0.07950.2130−0.3730.7101
Air temperature satisfaction0.12740.15300.8320.4079
Lighting satisfaction0.18080.13051.3850.1703
Sound satisfaction0.28430.19601.4510.1513
Note: * p < 0.05.
Table 5. Satisfaction by office settings at home.
Where Do You Work the Most at Home?Stand-Alone/
Dedicated Office Room with Four Walls and a Door
Semi-Closed Office Space Without a DoorWorkstation in Dual-Purpose Space That Also Serves as an
Office (e.g.,
Bedroom, Living Room, etc.)
I Do Not Have Any Dedicated Office or Workstation at Home
Overall satisfaction5.69 ± 1.475.80 ± 0.455.14 ± 1.624.50 ± 1.00
Air quality satisfaction5.94 ± 0.975.80 ± 0.455.52 ± 1.475.75 ± 0.50
Air temperature satisfaction5.40 ± 1.335.60 ± 1.525.38 ± 1.565.50 ± 1.00
Lighting satisfaction5.49 ± 1.445.20 ± 1.305.48 ± 1.505.50 ± 1.00
Sound satisfaction5.66 ± 1.165.80 ± 1.105.67 ± 1.025.75 ± 1.26
Disclaimer/Publisher’s Note: The statements, opinions and data contained in all publications are solely those of the individual author(s) and contributor(s) and not of MDPI and/or the editor(s). MDPI and/or the editor(s) disclaim responsibility for any injury to people or property resulting from any ideas, methods, instructions or products referred to in the content.