Abstract
In the context of the urgent green transformation of China’s transportation sector, environmental regulation (ER) provides an essential opportunity to promote the green development of the transportation sector. This paper proposes a research framework to elucidate the spatial impacts of ER on transportation’s green transformation. First, the green total factor productivity (GTFP) level of China in 2018–2022 is assessed using the super efficiency SBM-GML model that considers non-desired outputs, and the spatial heterogeneity characteristics of transportation’s green transformation are analyzed. Then, the level of ER is quantified, and the spatial Durbin model is applied to reveal the spatial–regional heterogeneous linkage effect of ER on the green transformation of transportation. The results of the study are as follows: (1) The green level of China’s transportation has been increasing, but regional disparities are still obvious. Specifically, the spatial pattern of greening level is the Eastern region > Northeastern region > Central region > Western region. (2) The transportation’s green level of Chinese provinces, in general, shows strong spatial correlation, exhibiting increasingly obvious ‘high-high’ and ‘low-low’ clustering patterns. (3) Environmental regulation has a positive spatial spillover effect and a non-linear impact on the green development of transportation, showing an inverted ‘U’-shaped relationship. Further analysis reveals that there is obvious heterogeneity in the impact of ER on the green transformation of transportation in the eastern, central, and western regions. The results of the study provide reference values and suggestions for the formulation of more targeted regional transport development policies and dynamic environmental impact policies.
1. Introduction
According to the International Energy Agency (IEA), China’s transportation carbon emissions have maintained an average growth rate of more than 5% over the past decade, significantly higher than that of industry and construction, making it the fastest-growing area of carbon emissions [1]. In response to the pressure to reduce carbon emissions, the Chinese government has decisively incorporated the green transformation of transportation into the core agenda of its ‘dual-carbon’ strategy, making the green transformation of China’s transportation industry particularly urgent and arduous [2,3].
As a key core indicator for measuring the effectiveness of the green transformation of the transportation industry, the connotation of green total factor productivity (GTFP) in transportation has gone beyond the scope of traditional productivity, and it can systematically assess the production efficiency of the transformation of factors of production, such as labor, energy, and capital, into value-added. At the same time, transportation GTFP is also able to consider the comprehensive impact of environmental factors and incorporate non-desired outputs, such as traffic accidents, into the scope of consideration [4,5], so that the overall green productivity of the transportation industry can be accurately measured, and the level of green transformation of transportation can be more accurately measured.
Environmental regulation (ER) is an important initiative to promote the green transformation of the transportation industry. It refers to mandatory constraints with environmental protection as the goal, individuals or organizations as the target, and institutions or awareness as the expression, which aim to guide and regulate behavior to reduce negative impacts on the natural environment [6]. In the area of transportation, the government, through optimizing the system, restructuring the rules of resource allocation, implementing economic instruments and policy guidance, and other initiatives, has formed institutional pressure on transportation enterprises, prompting enterprises to adjust their production functions, actively invest in intelligent transportation technology innovation, improve energy efficiency, and effectively reduce air pollutant emissions, achieving the transformation from traditional extensive development to green and low-carbon production modes [7,8,9]. In order to satisfy the increasingly stringent environmental protection requirements and enhance their competitiveness, enterprises have to increase the investment in environmentally friendly innovations, carry the green development concept through all segments of production and operation, and promote the green upgrading of the structure of the transportation industry [10,11]. The public forms a positive feedback mechanism for the green transformation of the transportation industry through green consumption choices and environmental awareness [12]. The synergistic effect of these multi-party bodies from the government, enterprises, and the public promotes the continuous evolution of the production function of the transportation industry in the direction of environmental friendliness, steadily improves the GTFP of the transportation industry, and ultimately realizes the green transformation of the transportation industry, laying a solid foundation for the realization of the ‘dual-carbon’ goal [13].
Most of the existing studies focus on the impact of ER on the carbon efficiency of the transportation industry. On the basis of the theoretical derivation of Porter’s hypothesis, scholars have demonstrated that moderate ER can enhance carbon emission efficiency through the ‘innovation compensation effect’, which encourages enterprises to adopt clean energy and advanced technology and optimize the transportation structure. Jian’s research found that ER can reduce carbon emissions not only directly, but also indirectly through technical efficiency [14]. Mahmoud utilized a location strategy of remote sensing monitors of traffic emissions in order to capture emission violations and reduce traffic air pollution [15]. This also validates the theory of directed technological change proposed by Acemoglu: when regulatory policies form a policy mix with green technology R&D subsidies, enterprises can be induced to replace traditional factor inputs with green capital goods and, thus, promoting sustainable development [16]. These studies provide an important theoretical foundation and empirical support for an in-depth understanding of the role of mechanisms of ER in the green transformation of the transportation industry.
While existing research has made significant progress in confirming the positive association of ER on GTFP, several gaps remain: First, past studies are inadequate in quantitative analyses of transportation’s green transformation and have not formulated a comprehensive analytical framework. In particular, there is a lack of in-depth and systematic discussion on the static and dynamic analyses of transportation’s green transformation. Second, most of the existing studies focus on the whole region or specific regions and rarely analyze the spatial differences in the greening level of China’s transportation and the effects of ER on the green transformation of transportation from the perspective of spatial heterogeneity, making it difficult to accurately grasp the actual situation of the green transformation of the transportation industry in different regions. Thirdly, past studies have mostly explored the impact of ER on the transportation industry from a time-series or cross-sectional perspective, ignoring the interactive effects and spatial spillover effects in geospatial areas.
The purpose of this study is to provide the level of transportation’s green transformation and the characteristics of space-time divergence across provinces in China, especially considering the environmental factors. Then, this study innovatively explores the spatially linked impacts of composite ER on transportation’s green transformation, quantifying the impacts of ER on transportation’s green transformation in terms of spatial–regional heterogeneity. In addition, this paper provides the impact of the degree of economic development, the growth rate of investment in fixed assets in transportation, the degree of emphasis on transportation by local governments, the volume of express delivery operations, the urban road area per capita, the greening coverage rate, and the expenditures on environmental costs on the green transformation of transportation. The results of this research fill the aforementioned research gaps, provide a rigorous quantitative tool for assessing the long-term path of green transformation in China’s transportation industry, provide a theoretical basis for dynamic optimization of environmental policies and regulatory measures and interregional cooperation and exchange of ER, as well as provide scientific support for the path to achieving the ‘dual-carbon’ goal of the transportation industry.
2. Literature Review
2.1. Impact of ER on GTFP
Scholars in favor of Porter’s hypothesis emphasize the contribution of ER to GTFP [17]. This perspective suggests that environmental regulatory policies can create a ‘push effect’ that promotes technological innovation, thereby achieving a win–win situation for both environmental and economic performance. Nicola et al. utilized a machine learning algorithm to derive that productivity in the six Eurozone countries could benefit from highly stringent ER [18]. Empirical studies by Ou [19] and Cheng [20] show that moderate ER significantly increases industrial and agricultural GTFP through ‘the innovation compensation effect’. The core mechanism is that environmental regulatory pressures force enterprises to break out of their technological lock-in by adopting cleaner production processes or developing low-carbon technologies, thereby offsetting short-term compliance costs and achieving structural upgrading of GTFP. In contrast, scholars opposing Porter’s hypothesis emphasize the ability of ER to inhibit GTFP [21]. This view argues that ER may inhibit R&D investment by enterprises due to the ‘cost crowding-out effect’, which is detrimental to technological progress. In addition, the ‘one-size-fits-all’ phenomenon in policy implementation can exacerbate the mismatch of resources between regions, which is not conducive to the enhancement of GTFP. Yuan et al. showed that ER generates pollution control costs, and these increased pollution control costs have more of a crowding-out effect on R&D investment, which is not consistent with Porter’s hypothesis [22]. Kamal et al. showed that environmental policies cause some industries to be skewed towards polluting industries, which is detrimental to technological progress, which in turn inhibits the growth of GTFP [23].
Existing studies further reveal the non-linear dynamic relationship between ER and GTFP. Huang et al. showed an inverted the ‘U’-shaped relationship between ER and agricultural GTFP growth [24]. Based on interprovincial panel data, Chen et al. found that there is an inverted ‘U-shaped’ relationship between the intensity of ER and the development of the iron and steel industry [25]. It is worth noting that the existing literature mostly focuses on the industrial industry, but there is still a lack of empirical testing of the relationship between ER in the transportation industry and its level of greenness in terms of a non-linear relationship. On the one hand, the transportation industry is characterized by the externalities of high energy consumption and strong networks, and ER can enhance GTFP through the optimization of the transportation structure and the promotion of new energy sources; on the other hand, high-intensity ER can lead to the curtailment of green technology investment by enterprises due to the surge in compliance costs and even trigger the shortfall of the supply of transportation capacity. Accordingly, we propose the following hypothesis:
H1.
There is an inverted ‘U’-shaped relationship between ER and the green level of the transportation industry. That is, as ER increases, the green level of the transportation industry will gradually increase, and when the intensity of ER exceeds a certain point, the further strengthening of ER will lead to a decline in the green level of the transportation industry.
2.2. Spillover Effects of ER on GTFP
For spatial spillovers, Tobler proposed the first law of geography, which states that subjects of economic activity do not exist independently but have certain spatial correlations [26]. Audretsch and Ganotakis et al. have pointed out that the spatial spillover effect refers to the externality effect of economic activities in one region on the neighboring regions [27,28]. From the point of view of the process of generating spillover effects, there are both spatial spillover effects generated by economic agents on their own initiative as well as passive influences by neighboring regions.
The existing literature has verified the spatial spillover characteristics of total factor productivity from multiple domains. Yin found that the total factor productivity of the construction industry in the Yangtze River Delta region has a significant spatial correlation, and the spatial spillover effect is significantly positive [29]. Liang empirically analyzed the ability of transportation infrastructure to enhance GTFP in neighboring regions by optimizing resource flow networks [30]. Zhong et al. showed that ER can have a negative spillover effect on GTFP by quantitatively examining the spillover effects of the European Green Deal (EGD) [31]. Bartram et al. showed that ER may generate negative spatial spillovers through industry shifts by examining carbon emission shifts following carbon trading policies in the U.S. [32]. Unfortunately, the existing literature has not empirically examined whether ER has a positive or negative spillover effect on green transformation in the transportation industry. Based on this, this study addresses this gap through in-depth analyses.
In theory, spillovers from ER can be achieved through two paths: on the one hand, there is the effect of ‘green technology polarization’, in which strict ER forces local transportation enterprises to adopt cleaner technologies, which then diffuse to neighboring regions through business cooperation or market competition. At the same time, green technology-intensive industries tend to cluster in regions with high ER and drive green upgrading in neighboring regions through industrial linkages. Accordingly, we propose the hypothesis:
H2a.
Environmental regulation has a positive spatial spillover effect on the green transformation of the transportation sector.
On the other hand, there is the ‘pollution refuge’ effect, in which high ER areas can also induce pollution-intensive transportation enterprises to relocate to low ER areas, which negatively affects the economic–social–environmental sustainability of the neighboring areas and reduces the GTFP of the neighboring areas [33]. Accordingly, we propose the hypothesis:
H2b.
Environmental regulation has a negative spatial spillover effect on the green transformation of the transportation sector.
2.3. Mechanisms of Regional Heterogeneity of ER on GTFP
The eastern region has an excellent natural location, a high-density transportation network, and a complete communication infrastructure, forming a highly open factor flow pattern. This not only attracts and brings together a large number of green technology R&D talents but also accelerates the diffusion and iteration of advanced green transportation technologies through close collaboration between the upstream and downstream of the industry chain. In this context, ER is more conducive to the “innovation compensation” effect: companies can significantly increase green transportation total factor productivity (GTFP) by continuing to make additional green investments, adopting cleaner transportation equipment, and optimizing operational management. On the other hand, in the central and western regions, due to the lack of density of transport arteries, lagging digital infrastructure, and low degree of openness to the outside world, there is a low degree of concentration of high-end green factors, and the compliance costs caused by the ER can hardly be offset by the benefits of technological innovation, which may, on the contrary, induce the ‘pollution shelter’ effect, leading to the transfer of high-emission transport enterprises and vehicles to regions with less stringent regulations. On the contrary, it may induce the ‘pollution refuge’ effect, causing high-emission transport enterprises and vehicles to move to areas with less stringent regulations, thus inhibiting the increase in local GTFP. Therefore, the direct impact of ER on transportation GTFP is significantly different in different regions.
H3.
There is significant regional heterogeneity in the impact of ER on GTFP in transportation.
3. Materials and Methods
3.1. Study Area Description
In the process of vigorous green development of transportation in China, there are significant differences in transportation patterns between regions. With the advantages of the high level of economic development, complete infrastructure, and strong policy support, multimodal transportation modes such as ‘public to railway’ and ‘sea-railway intermodal transportation’ are widely used in the eastern region [34]. In the central and western regions, due to geographical constraints and high reliance on traditional road transportation modes, there is still potential for growth in the share of road freight volume [35].
China’s transportation land use patterns also show clear regional characteristics. The multiple uses of transportation land in urban agglomerations such as the Yangtze River Delta, the Pearl River Delta, and Beijing–Tianjin–Hebei focus on coordination with urban functions and improving the efficiency of land use by optimizing the layout of the road network, developing rail transit, and constructing three-dimensional transportation hubs [36]. In some inland provinces, transportation infrastructure development is still in the area of basic coverage, and the transportation land use rate is significantly lower than that of the eastern urban agglomerations. In addition, the implementation of environmental policies varies from province to province. For example, economically developed regions are at the forefront of the promotion of new energy vehicles and the construction of charging facilities, while in some less economically developed regions, the pace of green transformation in transportation is relatively slow due to limited financial resources and the difficulty of policy implementation [37].
This study is based on 30 provincial-level administrative regions in China (excluding Tibet, Hong Kong, Macau, and Taiwan). There are significant differences in the level of economic development, transportation patterns, land use patterns, and policy intensity among the study regions, which are highly representative and can fully reflect the study theme. A map of the study area is shown in Figure 1.
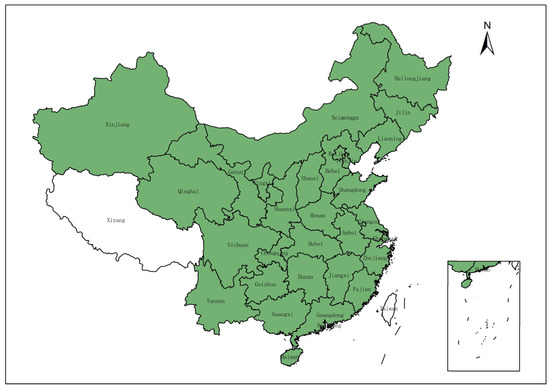
Figure 1.
Location map of the study area (maps from the Ministry of Natural Resources).
3.2. Modeling
Based on the above research content, regarding the spatial impact of ER on green transformation of transportation, this paper presents a model variable structure diagram, as shown in Figure 2. The model is specifically described below.
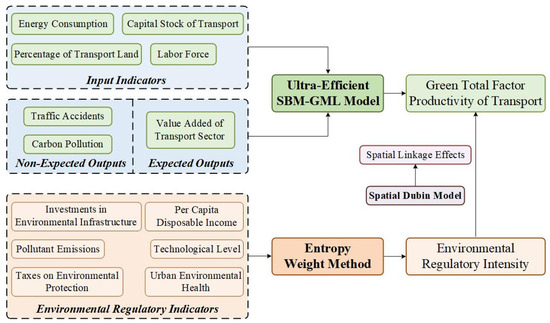
Figure 2.
Overall research framework.
3.2.1. Super Efficiency Slack-Based Measure-Global Malmquist–Luenberger (Super SBM-GML) Index Model
In this study, the Super SBM model and the GML index model are used to measure GTFP in the transportation sector. The super efficiency SBM model is a non-radial model that has significant advantages in dealing with non-expected outputs. Traditional radial models assume that all inputs and outputs change in the same proportion; however, this assumption is often difficult to establish in the actual production process. For example, non-desired outputs such as environmental pollution cannot simply be eliminated by reducing inputs in equal proportions. The non-radial model allows inputs and outputs to be adjusted in different proportions, a feature that makes the model more advantageous in measuring efficiency when undesired outputs are included and is sufficient to more accurately portray the level of efficiency when undesired outputs are included. Compared with general SBM models, the super efficiency SBM model also effectively addresses the limitation of ordering efficiency when multiple decision units reach efficient states simultaneously, enabling further differentiation and comparison between efficient units [38]. Compared with some other indexes, the GML index possesses inter-period comparability, which effectively overcomes the interference in efficiency assessment due to the evolution of production technology in different periods, thus ensuring the accuracy and reliability of inter-period efficiency analyses. In addition, the GML index is able to comprehensively capture technical efficiency change (TEC) and technical change (ETC), providing a comprehensive and effective measurement tool for analyzing the dynamic evolution of GTFP. Therefore, in this paper, the super efficiency SBM-GML model is selected to calculate the transportation GTFP.
(1) Super SBM model.
We employ the Super SBM model from DEA and use Matlab R2021b to evaluate the GTFP of transportation in each provincial administrative region. This model accommodates the hypothesis of variable scale payoffs and integrates undesirable outputs. This is indicated below:
Let denote the weight vector; denote input and output variables, separately; Here, and correspond to the number of indicators for inputs as well as outputs, in turn. , denote the slack variables associated with inputs expected outputs and not-expected outputs, separately; Finally, represents the GTFP of the transportation industry.
(2) GML Index Modeling.
Regarding the study of GML, Oh [39] further developed the GML index based on Chung [40] et al. and proposed a new directional distance function (DDF)-based method for calculating the Malmquist index. The paper constructs a single production technology set , which consists of multiple period sets of production technologies are concatenated to form a single production frontier. This frontier allows assessing the technical efficiency of different DMUs at different points in time and highlights the deviations of these units from the frontier. Where if > 1, it indicates a rise in transport GTFP. Otherwise, it indicates a decrease in transportation GTFP. This indicates the following:
Let represent technical efficiency. The gap from the best practice frontier (BPG) is quantified as the distance of the contemporaneous frontier plane from the frontier plane of the intertemporal configuration. TEC is assessed by comparing the efficiency levels at two distinct points in time, denoted as . In contrast, is measured by comparing the efficiency levels at two different points in time, denoted as .
3.2.2. Entropy Weight Method (EWM)
At present, there are no fixed standards for measuring ER intensity, and existing quantitative assessment methods are generally categorized into single-indicator, categorical analysis, and composite-indicator approaches. This paper chooses the composite-indicator method to measure the intensity of ER, which is one of the most commonly used methods, and it refers to the selection of several indicators to construct a comprehensive indicator system to assess the intensity level of ER.
This paper adopts the EWM to measure the ER intensity index. This method is a multi-indicator comprehensive evaluation technique based on the principle of information entropy. Its fundamental idea is to determine the weight of the indexes through the degree of change in the indicators and subsequently perform a weighted aggregation of the multiple evaluation indicators. As an objective weighting method, the entropy approach effectively mitigates subjective bias in the determination of indicator weights. In this study, the intensity of ER is a complex and comprehensive index that involves multiple dimensions, including urban environmental sanitation, level of scientific and technological development, SO2 and particulate emissions, per capita disposable income, investment in environmental infrastructure, and taxes for environmental protection. The EWM is able to integrate these indicators to generate an index reflecting the overall intensity of ER in each province, which provides a reliable database for subsequent spatial econometric analyses. In this paper, the EWM is adopted on the Stata MP18.0 software to measure the intensity of ER across various provinces. The specific steps involved in the model implementation are outlined as follows:
(1) Data Standardization: To mitigate the impact of varying measurement units, it is necessary to standardize the raw data.
(2) Normalization for Positive and Negative Indicators: For positive indicators, the max–min normalization method is applied. The formula for this normalization is as follows:
For negative indicators, the min–max normalization method is utilized. The corresponding formula is as follows:
(3) Calculation of Indicator Weights: Let denote the standardized data. Let represent the raw data for the indicator in the district, and let n denote the total number of districts. The formula for this calculation is as follows:
(4) Calculation of Information Entropy: The information entropy for each indicator is computed using the formula provided below. In cases where the entropy value is negative, the absolute value is taken as follows:
(5) Determination of Indicator Weights: Calculate the weight of every indicator according to the information entropy. Let represent the weight of the indicator, and represent the total number of indicators.
3.2.3. Spatial Durbin Model (SDM)
This paper utilizes spatial econometric models to investigate the spatial effects of ER intensity on the development of transport green transformation. The commonly used models for spatial econometric analysis are the spatial lag model (SLM), the spatial error model (SEM), and the SDM. The SLM focuses only on the spatial lagged effect of the dependent variable, and the SEM focuses on the spatial autocorrelation of the error term. If only the SLM or SEM is used, it will ignore some of the spatial effects, resulting in inaccurate estimation results [41]. Therefore, this paper chooses the SDM that combines the advantages of both. In this paper, the SDM is constructed first, and the reasonableness of the selection is further verified by a series of tests. The SDM constructed in this paper is expressed below:
where refers to the explained variables; refers to explanatory and control variables; accounts for the area fixed effects; is defined as the time fixed effect; is represented by the spatial autocorrelation error; denotes the spatial weight matrix.
3.3. Description of Variables
3.3.1. Explained Variable: GTFP of Transportation
This paper adopts the Super SBM-GML model to evaluate the level of green transformation in transportation and selects indicators based on the target of ‘simplifying the input dimensions to highlight the core contradiction’, and the specific input and output indicators selected for the model are shown in Table 1. Among them, energy consumption is selected as eight primary energy consumptions such as crude oil, gasoline, paraffin, diesel, fuel oil, liquefied petroleum gas, natural gas, and electricity consumed by the transportation industry and characterized by a uniform conversion factor to standard coal. The capital stock of the transportation industry is accounted for using the perpetual inventory method to account for the capital stock of the transportation industry in each region, taking a depreciation rate of 0.054 [42]. Carbon emissions were calculated using a ‘top-down’ approach, based on the use of conversion factors for energy consumption from the IPCC National Greenhouse Gas Emissions Inventory and the energy-carbon emission factors for vehicles to calculate carbon emissions from the transportation industry. Specific indicators are described in Table 1.

Table 1.
Description of input–output variables.
3.3.2. Explanatory Variable: Intensity of ER
In this paper, the EWM is deployed for assessing the intensity of ER. This method draws upon the practices of Jiangfeng Hu [43], Vasilyeva Tetiana [44], Maohui Ren [45], Shi Wang [46], and Min Fan [47] and involves the selection of six key indicators: urban environmental sanitation, level of science and technology, SO2 and particulate matter emissions, per capita disposable income, investment in environmental infrastructure, and taxes for environmental protection. The nature of the ER indicator is assessed on the basis of its direct contribution to environmental governance (positive or negative impact). In this case, the technology market turnover is used to represent the technological level. Table 2 describes the specified indicators.
Table 2.
Variable description of ER.
3.3.3. Control Variables
(1) The degree of economic development (GDP): It is characterized by the per capita gross domestic product (GDP), which reflects the overall level of local economic development. The degree of economic development not only affects financial investment and technological upgrading in the transportation sector but also plays an important role in the adoption and promotion of green transportation technologies. A higher degree of economic development usually means that more resources can be used for the construction of transportation infrastructure and technological innovation, which provides a material basis for the implementation of ER.
(2) The growth rate of investment in fixed assets in transportation (TGI): It is characterized by the growth rate of investment in fixed assets in transportation compared with that of last year, reflecting the strength of investment in the construction of transportation infrastructure in each region. The level of investment growth rate directly affects the renewal and expansion of hardware facilities in the transportation industry, which then affects its productivity and ability to make a green transformation. Increased investment growth rates are also accompanied by greater investment in green transportation technologies, thereby facilitating the implementation of ER.
(3) The degree of emphasis on transportation by local governments (LTG): As characterized by the share of local fiscal expenditure on transportation in the total local fiscal expenditure budget, policy support and financial investment by local governments are crucial to the development of the transportation industry, especially in the promotion and application of green transportation technologies. Local governments can guide the transportation industry to adopt green technologies and reduce pollutant emissions by formulating and implementing ER policies.
(4) The volume of express delivery operations (EDV): Characterized by the total volume of express delivery operations, this reflects the level of activity in logistics and transportation. An increase in the volume of express delivery operations brings about a sharp rise in transportation demand, which in turn may lead to problems such as increased traffic congestion, increased energy consumption and rising pollutant emissions. In response to these problems, ER policies will become more stringent.
(5) Urban roads area per capita (URA): It reflects the degree of improvement of urban transport infrastructure. An increase in urban road area per capita can improve traffic congestion, increase transport efficiency, and provide better conditions for the application of green transport technologies.
(6) The greening coverage (GC): This reflects the degree of improvement of the urban ecological environment. An increase in greening coverage not only helps to reduce pollutant emissions in the transportation process but also improves the quality of life of urban residents and, thus, positively affecting the green transformation of the transportation industry.
(7) The expenditure on environmental protection costs (EC): characterized by expenditure on environmental protection costs in each region, it reflects the strength of local governments’ and enterprises’ investment in environmental protection. Increased expenditure on environmental protection costs usually means that more resources are used for pollution control and the research, development, and application of green technologies, and it also favors the implementation of ER policies.
The variable description statistics are shown in Table 3.
Table 3.
Description of control variables.
3.4. Data Sources
In order to deeply investigate the impact of spatial heterogeneity of ER on transportation’s green transformation, this paper selects panel data from 30 provincial-level administrative regions in China (excluding Tibet, Hong Kong, Macao, and Taiwan) for the period from 2018 to 2022 as the sample for analysis. In particular, the data for the explanatory variables, the explained variables, and the control variables are obtained from the China Statistical Yearbook, the China Energy Statistics, the China Environmental Statistical Yearbook, the China Environmental Yearbook, and the National Bureau of Statistics of China. For the small number of missing values present in the dataset, the interpolation and mean value methods are adopted. Table 4 shows the descriptive statistics of the main variables.
Table 4.
Table of descriptive statistics.
4. Results and Discussion
4.1. Analysis of the Green Level of Transportation
4.1.1. Static Analysis
This study evaluates the static GTFP of transportation across 30 provinces in China from 2018 to 2022. The analysis employs the Super SBM model, which incorporates non-desired outputs into the evaluation. To gain deeper insights into regional disparities in the green level of transportation, the study applies the natural breakpoint method to classify the results of the assessment, which allows us to determine the natural grouping of the data by minimizing the variance within each category and maximizing the variance between categories [48]. A visual representation of the regional division is shown in Table 5, where the provinces are divided into intervals.
Table 5.
Intervals of provinces divided by the natural breakpoint method.
Figure 3a–e presents a spatial and temporal comparison of national transportation GTFP from 2018 to 2022. To highlight the spatial variation in the green level of transportation across China, different colors are used to represent distinct levels of transportation green productivity. Overall, the analysis reveals that the average national GTFP of transportation remained relatively high throughout the period from 2018 to 2022, with only minor fluctuations and a general trend of gradual growth. This indicates that the transportation system performed well in planning resource use and environmental synergies during this period. Environmental impacts and productivity are relatively stable, and the GTFP of transportation is steadily increasing [49].
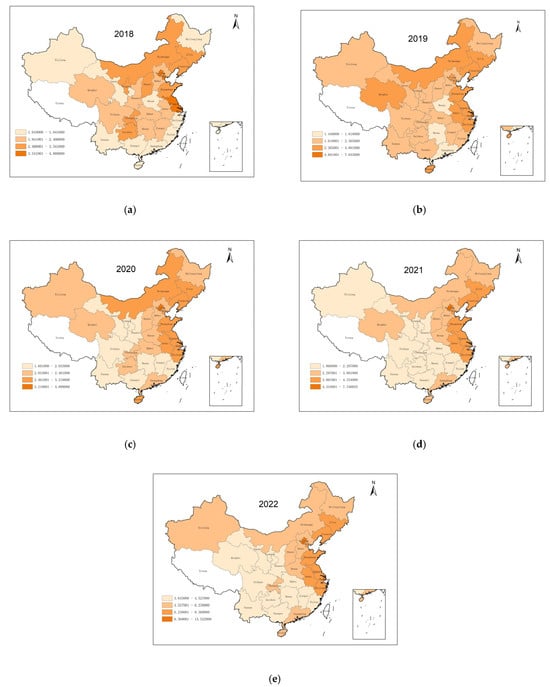
Figure 3.
Comparison of the National Transportation GTFP 2018–2021 (maps from Ministry of Natural Resources).
The steady improvement of GTFP transportation stems from multi-dimensional efforts, including ongoing technological innovation, policy guidance, and management optimization. From the policy perspective, between 2018 and 2021, the Chinese government has enacted several important policies, such as the 14th Five-Year.
Plan for the Development of Green Transportation, the Action Plan for Green Transportation (2019–2022), and the Implementing Opinions on Comprehensively Strengthening Eco-Environmental Protection and Resolutely Combating Pollution. These policies help to promote cleaner energy vehicles, accelerate the building of green transportation infrastructure, and improve the provision of green travel services, thereby promoting the green development of the entire transportation industry. For technological innovation, the integration of advanced technologies, such as intelligent transportation systems, autonomous driving technology, new and clean energy applications, smart civil aviation technologies, and air-and-space information systems, has not only enhanced the efficiency and safety of transportation but also provided strong technical support for the green transition and sustainable development of the industry [50].
In addition, China’s eastern coastal provinces are performing better overall in terms of GTFP for static transportation and experiencing more stable growth. Beijing (7.463), Shanghai (5.992), Jiangsu (4.633), Tianjin (4.297), Jilin (3.924), Shandong (3.841), and Zhejiang (3.708), which have upward trends in transportation GTFP, are the more successful provinces in transportation’s green transformation, with long-term competitiveness, and are worthy of reference for other provinces. However, most of the central and western provinces, where the transportation GTFP growth rate is relatively slow, still have a large potential for growth. Among them, Yunnan (2.41), Gansu (2.262), Hunan (2.268), and Guangxi (2.0296) have slow growth or even a small downward trend in transportation GTFP. In view of the differences in the level of green development of transportation in different regions, future development needs to be accurately positioned, focusing on reducing the ineffective consumption of resources and comprehensively improving the effectiveness of green transportation development from both qualitative and quantitative dimensions in order to promote the sustainable development of China’s transportation industry.
4.1.2. Dynamic Analysis
In order to further explore in depth the trend of dynamic changes in the level of green development of transportation and the characteristics of decomposition indicators, this paper measures and analyzes the GML index of GTFP of transportation. Through the GML index, we can more accurately grasp the dynamic changes in transportation GTFP and deeply understand the characteristics of related evaluation indicators. Table 6 reports the results for the GML index and its decomposition indicators.
Table 6.
GML index and its decomposition index for different provinces for the period 2018–2022.
The analysis reveals that the GML index of GTFP in 30 provincial administrative regions across the country exhibited fluctuations during the period from 2018 to 2022. As illustrated in Figure 4, the national average GML index is 0.98, reflecting a slight downward trend in the dynamic GTFP of transportation over the study period. This is due to the significant impact of the outbreak of the epidemic on the transportation industry at the end of 2019 [51]. In particular, the implementation of traffic control measures, coupled with a slowdown in economic activity, led to a substantial reduction in both freight and passenger demand. This, in turn, directly affected transportation demand and efficiency, thereby influencing the technological advancement and technical efficiency within the transportation system. In comparison, there is generally significant growth in 2022 due to the relaxation of traffic control measures, a gradual recovery in economic activity, and a rejuvenation of the transportation industry.
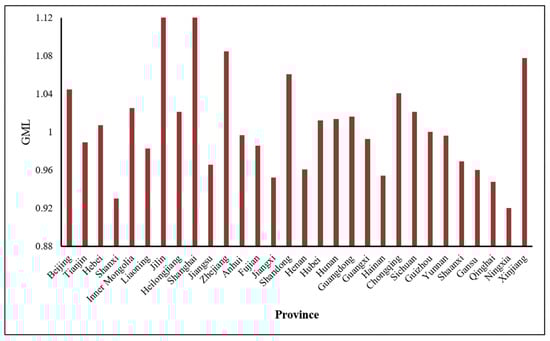
Figure 4.
GML index and trends in 30 provincial administrations in China.
The GML index can be decomposed into two key dimensions: TC and TEC. Over the study period from 2018 to 2022, the average value of the TC indicator in the transportation industry was 0.986, suggesting that the positive impact of technological progress on transportation productivity has been limited. This can be ascribed to the fact that, while technologies such as Intelligent Transportation Systems (ITS) have somewhat alleviated traffic congestion and enhanced travel efficiency, their diffusion and application have not yet reached a level of widespread adoption or depth sufficient enough to significantly impact national transportation productivity. Furthermore, despite improvements in transportation infrastructure and the expansion of rail and road networks, which have increased traffic capacity, the efficiency and quality of transportation services have been constrained by various factors, including financial limitations, policy constraints, and management inefficiencies. Consequently, the average value of the TC indicator remains below one, suggesting that the influence of technological advancements on enhancing GTFP in the transportation industry has been constrained by these multiple factors throughout the study period. Moving forward, it is hoped that the strengthening of technological innovation, the optimization of infrastructure services, the response to the challenges of climate change, and the development of effective economic and industrial policies will further enhance the delivery of technological change (TC), which will in turn contribute to sustained productivity growth.
In contrast, the mean value of the TEC indicator in the transportation industry reaches 1.035, which indicates an upward trend in the TEC of transportation. The growth of TEC has a positive effect on the GTFP of transportation. The increase in awareness of innovation, coupled with higher investment in research and development, has facilitated the adoption of cutting-edge technologies such as autonomous vehicles, intelligent shipping systems, and smart construction sites, all of which have contributed to greater transportation efficiency and safety. Furthermore, advancements in data sharing and integrated management systems have enabled traffic management authorities to optimize resource utilization, streamline traffic flow distribution, enhance response times, and reduce accidents and delays. These developments collectively improve the operational efficiency of the transportation system, demonstrating that, even in the absence of significant technological breakthroughs, incremental improvements in the efficiency of existing technologies can yield substantial productivity gains. Moving forward, with the deep integration and wide application of emerging technologies such as artificial intelligence, big data, and the Internet of Things, the transportation industry will accelerate its progress towards being green, efficient, and intelligent.
4.2. Spatial Pre-Measurement Tests
After completing the determination of the green level of transportation in the previous subsection, this study further focuses on the spatial influence mechanism of ER on the green level of transportation. For this purpose, this subsection first conducts a spatial correlation analysis to assess the clustering characteristics and dependencies of transportation greenness in the spatial dimension. On this basis, this subsection further provides a rigorous validation of the applicability of the SDM by testing the spatial econometric model to ensure that the model is able to accurately capture the spatially heterogeneous impacts of ER on the level of greenness of transportation.
4.2.1. Spatial Correlation Analysis
The paper carried out a global spatial correlation analysis using Stata MP18.0 based on the global Moran’s I measurements. The findings reveal that the global Moran’s I is always positive and all significant at the upper level of 5% in the period 2018–2022, demonstrating that the observed provinces are strongly spatially connected and a positive spatial clustering effect in the green level of transportation. This phenomenon is closely related to the promotion of national and regional economic integration, the facilitation of technology diffusion, and the realization of policy linkage effect [52].
To further examine the presence of local spatial autocorrelation between regions, this study employed Moran’s I for statistical testing of local spatial autocorrelation and visualized the results through a scatter plot, as presented in Figure 5a–e. The GTFP of most provinces is distributed in the first and third quadrants, reflecting the positive spatial clustering effect on GTFP for most areas. This clustering effect fosters the positive spillover impact of provinces with higher transportation GTFP levels on neighboring regions, thereby creating a “point-to-point” model that drives the development of adjacent areas. Over time, provinces that were initially situated in low–high and high–low agglomeration zones have gradually transitioned to high–high and low–low agglomeration regions, reflecting the dynamic evolution of the spatial agglomeration effect.
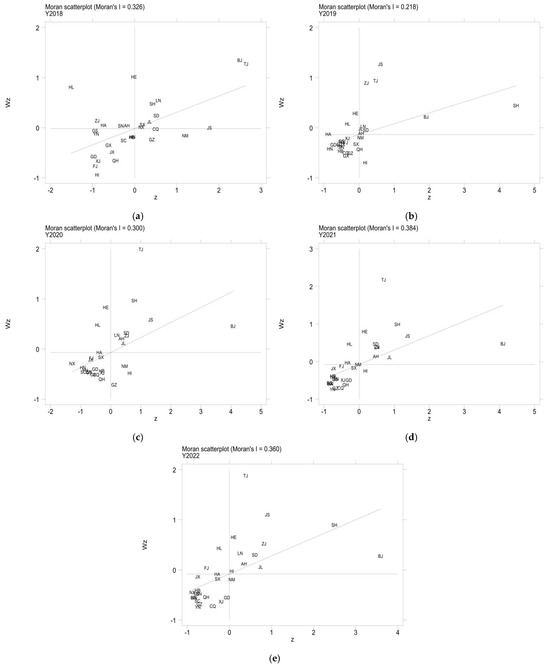
Figure 5.
Scatterplot of the Moran’s index of GTFP for transportation.
4.2.2. Tests of Spatial Econometric Model
As shown in the results of the LM test in Table 7, the Lagrange multipliers for both the SLM and the SEM with robust Lagrange multipliers are significant at the 5% confidence level, indicating that the model has the possibility of selecting both the SLM and the SEM. Based on the LM test results, the SDM should be chosen among the spatial econometric models, which combines the features of the SLM and the SEM. It contains the spatial lag term of the dependent variable and the spatial correlation of the error term and takes into account the spatial characteristics among variables more comprehensively in the modeling process. Therefore, this paper chooses the SDM that combines the two to study the spatial effects of ER on the green transformation of transportation.
Table 7.
Results of the main parameters from the LM test.
Further, the Hausman test determined the choice of a random effects or fixed effects model. It is generally accepted that when the study is limited to a specific individual (i.e., a Hausman test rejects the original hypothesis), the fixed effects model should be preferred for the analysis. According to the analysis results obtained in Table 8, the Hausman test p-value is significantly less than 5%, and the selection of the random effects model is not valid. Therefore, this paper uses fixed effects to build the model for the study.
Table 8.
Results of Hausman’s test and Wald’s LR test.
With the selected fixed-effects model, an in-depth study is conducted starting from the SDM, which is further used to verify the robustness of the model using the Wald test and the LR test to verify its possible reduction to the SLM or the SEM. According to the test results in Table 8, it can be seen that both pass, LR is significant at the 1% level, and the Wald test is significant at the 5% level, which indicates that the SDM rejects the pending hypothesis of simplification to SLM and SEM, so the SDM is more suitable for this study. It was finally determined that the SDM was chosen to be used for the study of this paper.
4.3. Analysis of the Results of the Spatial Impact of ER on the Green Transformation of Transportation
After completing the pre-testing of the spatial econometric model in the previous subsection, this subsection provides an in-depth result analysis of the spatial effects of ER on the green transformation of transportation with the support of the SDM.
The spatial linkage effect and conducting system of ER in facilitating the green transformation of the transportation industry are realized through both direct and indirect effects. Table 9 illustrates the decomposition of the spatial effects.
Table 9.
Direct and spillover effects of ER on the green transformation of transportation.
4.3.1. Direct Effects of ER on the Green Transformation of Transportation
As illustrated in Table 8, the direct effect of ER on GTFP in the transportation industry turns out to be significantly positive, with a factor of 0.315. This demonstrates that transportation GTFP increases by 0.315 units for a one-unit rise in the intensity of ER. On the one hand, ER fosters transportation process optimization and technological innovation through infrastructure investments and the imposition of environmental taxes. These measures curb pollutant emissions, thereby contributing to GTFP in the transportation industry. On the other hand, ER increases consumer environmental awareness and purchasing power, particularly by raising per capita disposable income. This, in turn, stimulates demand for green transportation products and services. The resulting shifts in market demand encourage enterprises to adjust their production structures to deliver more environmentally friendly transportation solutions, with this market-driven innovation serving as a crucial mechanism for improving GTFP. Additionally, strong urban sanitation practices reflect the effectiveness of regional ER, suggesting high levels of public environmental awareness and active participation in environmental protection activities.
ER has a non-linear effect on GTFP in transportation, showing an inverted ‘U’-shaped relationship, which confirms the validity of hypothesis 1, as shown in Figure 6. Specifically, the first-term factor for ER equals 0.530, and the second-term factor equals 0.094, with both terms passing the 10% significance level test. This indicates that at the lower stage of ER, it has a significant promotion effect on transportation GTFP, and with the strengthening of ER, the GTFP of the transportation industry will be enhanced; that is, ER at the initial stage has a positive promotion effect on transportation GTFP. However, when the intensity of ER exceeds a certain threshold, its positive effect on transportation GTFP will change to a negative inhibition [53]. This phenomenon is consistent with the Kuznets curve effect between ER and green economic efficiency [54] because excessively stringent ER will increase the production costs of enterprises, including inputs for equipment renewal, technological research and development, and operation and management, which will have a certain negative impact on the productivity and economic efficiency of enterprises.
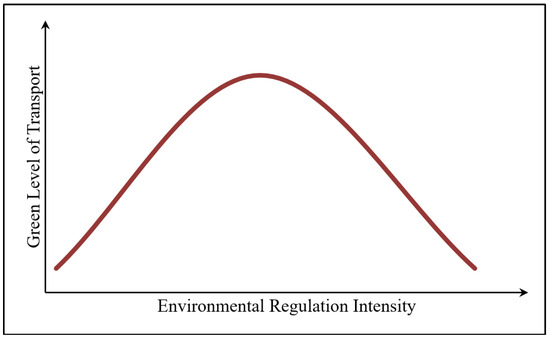
Figure 6.
The upside-down “U” relation of ER on the green level of transportation trends.
4.3.2. Spillover Effects of ER on the Green Transformation of Transportation
There are obvious spatial spillover effects of GTFP in the transportation industry across provinces. The indirect effect of ER is still positive on transportation GTFP, showing a factor of 0.215, indicating that a unit rise in ER raises transportation GTFP in neighboring provinces by 0.215 units, which confirms the validity of Hypothesis H2a.
In terms of the mechanism of action, this positive spatial spillover effect is realized in several ways. First, due to interregional policy coordination, when a province implements more stringent ER policies, these policies tend to form a linkage effect with neighboring regions. This linkage effect not only promotes interregional policy synergy but also jointly promotes the growth of regional ER on GTFP in transportation through interregional cooperation and exchange. Second, due to the interregional learning effect, when some provinces implement stricter ER, local transportation enterprises tend to actively adopt more environmentally friendly production technologies and management methods in order to meet the new environmental standards. These advanced technologies and management experiences spread to neighboring regions through interregional economic cooperation and technology exchanges, etc., thus increasing the GTFP of transportation in neighboring provinces. In addition, due to competition and correlation effects, the implementation of ER will motivate transport enterprises to improve their efficiency in order to cope with the pressure of rising costs. This competition effect not only motivates local firms to improve their own productivity but also motivates firms in neighboring regions to improve their own productivity as well through interregional market competition, thus increasing the GTFP of transportation in the whole region.
4.3.3. Analysis of Control Variables for the Green Transformation of Transportation
(1) Degree of economic development (GDP): It plays an active role in the green transformation of transportation. As GDP per capita increases, regional economic strength is bolstered, providing governments and enterprises with greater resources to invest in the construction and enhancement of green transportation infrastructure. Additionally, higher economic development fosters greater public awareness of environmental protection and sustainable travel practices. This heightened awareness encourages the adoption of low-carbon transportation modes and boosts demand for green transportation services, thereby boosting the enhancement of GTFP in the transportation industry.
(2) Growth rate of investment in fixed assets in transportation (TGI): The direct and indirect impacts of a2 are both positive. An increase in fixed asset investment leads to greater financial allocation towards the construction, maintenance, and upgrading of transportation infrastructure, including substantial support for green transportation projects. Consequently, a higher growth rate of fixed asset investment significantly enhances the GTFP within the transportation industry.
(3) Degree of emphasis on transportation by local governments (LTG): All of the impacts of governmental attention are positive. When local governments prioritize green transportation development, they typically implement a range of policies and initiatives focused on improving transportation infrastructure, enhancing the quality of transportation services, and modernizing green transportation management. These governmental actions are crucial in advancing the GTFP of the transportation industry.
(4) Express Delivery Business Volume (EDV): Both the direct and indirect impacts of express delivery business volume are negative. This is primarily attributed to the fact that an increase in express delivery business volume leads to a higher number of vehicles and a greater frequency of transportation activities, which, in turn, results in elevated energy consumption and carbon emissions. These factors exert a detrimental effect on GTFP, hindering the advancement of sustainable transportation practices.
(5) Urban road area per capita (URA) and greening coverage (GC): Both the direct and indirect effects of per capita road area and greening coverage in the transportation industry are positive. Larger per capita road space and increased green coverage contribute to the effective implementation of green transportation measures, offering a healthier and more comfortable travel environment for urban transportation. In addition, these factors can also promote the green transformation of the transportation system, increase the GTFP of transportation, and achieve a harmonious symbiosis between economic development and environmental protection.
(6) Expenditures on environmental costs (EC): Environmental protection expenditures provide positive direct and indirect roles. With increased investment in environmental protection, cleaner energy technologies, transportation infrastructure, and pollution control measures receive more support. These efforts collectively enhance the sustainability of the transportation industry and contribute to a reduction in its environmental impact.
4.3.4. Analysis of Regional Heterogeneity
As can be seen from Table 10, in the direct effect estimation results, ER has a significant positive impact on the transportation GTFP in the eastern and western regions, and both passed the 1% significance test; the central region regression results are not significant, but the coefficient is positive. In the indirect effect, the indirect effect of ER in the eastern and central regions is significantly positive. In terms of indirect effect, the indirect effect of ER is significantly positive in the eastern and central regions, indicating that the ER in the eastern and central regions has a strong spatial spillover effect and significantly promotes the enhancement of GTFP in the neighboring regions. In contrast, the indirect effect of ER in the western region is not significant, but from the regression coefficient, the estimation result is negative, indicating that ER in the west is unfavorable to the enhancement of transport GTFP in the surrounding areas. The reason for this phenomenon, this paper analyzes is that the level of ER in the eastern region, central region, and western region is not balanced, so the direct effect of ER and indirect effect also present a certain gradient difference: the level of economic development in the eastern region, the degree of industrial agglomeration, and the degree of regional integration are higher, so the ER on the region’s transportation green factor productivity has a role in promoting and can have positive spatial spillover effects. In the western region, the level of economic development is lower, technology and human resources are scarce, and infrastructure construction is imperfect, which makes the local ER inhibit the GTFP of transportation in the neighboring regions, and thus the indirect effect shows a negative relationship. Heterogeneity analysis verifies that the third research hypothesis H3 is valid.
Table 10.
Decomposition of the effect of the level of ER in different regions.
4.4. Robustness Tests
The spatial econometric model estimation presented above is based on a binary proximity weight matrix. To evaluate the robustness and reliability of the empirical results, this study substitutes the binary proximity weight matrix with an economic geographic distance-based nested weight matrix for spatial estimation in Stata MP18.0 software. The findings, as shown in Table 11, indicate that the direct and indirect effects of the primary ER term exhibit significantly positive spatial spillovers, while the direct and indirect effects of the secondary ER term reveal significantly negative spatial spillovers. These findings align closely with those reported in Table 9. Consequently, the estimation outcomes in this study can be considered robust.
Table 11.
Robustness test results (replacement of weight matrix).
Specifically, in the results after replacing the spatial weights matrix, the coefficient of the direct effect of ER decreases to 0.489, the coefficient of the indirect effect decreases to 0.314, and the total effect is 0.344. This change suggests that, although the effect of ER on transportation GTFP is still significant after replacing the spatial weights matrix, the strength of its effect has weakened. This change stems from the different abilities of the economic geographic distance nested weights matrix and the binary proximity weights matrix to capture spatial correlations. The binary proximity weight matrix has some limitations in capturing spatial correlations compared to the economic-geographical distance nested weight matrix.
These quantitative differences are important for developing targeted policy recommendations. First, ER plays a critical role in promoting the green transformation of the transportation sector, but the effects of different spatial weighting matrices need to be considered to optimize the design and implementation of ER policies. Second, the effects of variables such as the degree of economic development and the growth rate of investment in fixed assets in transportation on transportation GTFP differ under different spatial weight matrices, suggesting that policymakers need to comprehensively consider the economic linkages and spatial correlation between regions when formulating relevant policies to maximize the effects of the policies. Finally, the positive effects of variables such as the degree of emphasis by the government, road area per capita, and environmental protection expenditure are more significant in both tables, suggesting that strengthening government guidance, optimizing transportation infrastructure construction, and increasing environmental protection inputs are important ways to promote the green transformation of the transportation industry.
5. Conclusions and Policy Recommendations
5.1. Conclusions
This paper examines the spatial spillover effects of ER on the green transformation of the transportation industry in 30 provincial-level regions in China and draws the following conclusions.
(1) There is notable interregional heterogeneity in the strength of ER as well as the green level of transportation across China. In terms of efficiency, the static green level of transportation has exhibited an upward trajectory, with the eastern and northeastern regions leading this development, although notable internal disparities persist. The provinces in the central region have comparable overall levels, while GTFP in the western region has been slow to improve. This presents a pattern of development in which ‘the east and northeast are leading and the west and center are catching up’. The dynamic green level of transportation, however, has exhibited fluctuations, both upward and downward. According to the GML index factorization of GTFP, TEC serves as the primary driving factor, whereas insufficient TC is attributed to slow technological advancement and limited innovation capacity.
(2) The green level of transportation exhibits a significant positive spatial autocorrelation, indicating a clear trend of spatial agglomeration in the green transformation of transportation across different regions. This trend has become increasingly pronounced over time. The agglomeration effect fosters positive spillovers, where provinces with higher levels of transportation greenness contribute to the green development of neighboring regions, creating a radiation-driven effect that stimulates the advancement of surrounding areas. Concurrently, the correlation between the intensity of ER and the green level of transportation across provinces has progressively strengthened, underscoring the critical role of ER in generating spatial externalities that facilitate the green development of transportation.
(3) The findings from the SDM reveal that ER in each province exerts a non-linear influence and shows an upside-down ‘U’-shaped relationship on the green level of the transportation industry. This phenomenon is consistent with the Kuznets curve effect between ER and the efficiency of the green economy. More specifically, moderate levels of ER significantly contribute to advancing the green transformation of transportation. Furthermore, ignoring spatial effects may lead to an underestimation of the effect of ER.
(4) There are significant regional differences in the spatial impact of ER. Among them, ER has a positive direct effect on transportation GTFP in the eastern and western regions, while the effect is not significant in the central region. Environmental regulation in the eastern and central regions shows positive spatial spillover effects and promotes the transportation GTFP in the neighboring regions. Comparatively, ER in the western region has a less significant effect on transportation GTFP enhancement in the neighboring regions, and the indirect effect is even negative. The findings support the need for ER policies to take into account regional characteristics to achieve a more effective green transformation.
5.2. Policy Recommendations
(1) Pursue a path of high-quality development in green transportation. The study advocates deepening the concept of green transportation development, further refining the use of carbon energy in the transportation industry, optimizing the transportation network, and reducing unnecessary energy losses, thereby enhancing the energy efficiency of the transportation industry. Simultaneously, efforts should be made to stimulate the growth potential of GTFP in transportation via strengthening environmental protection tax policies, fostering innovation, and providing targeted policy guidance. This will facilitate the advancement of the transportation industry toward greater environmental sustainability, efficiency, and safety. Furthermore, by increasing the per capita area of urban roads and the green rate of urban areas, the urban transportation environment and residents’ travel experiences can be significantly improved, thereby encouraging and promoting green travel.
(2) Leverage the spatial spillover effect and strengthen cooperation and exchanges between transportation regions. The eastern and northeastern regions should invest more in green transportation platforms based on their respective resources of regional strengths, intensify the enforcement of ER in the context of green transportation development, and utilize diffusion effects to promote the spread of key elements—such as technology, capital, and green principles—to neighboring regions. Midwest China should enhance the penetration of ER and expand the application of green transportation development via better communication with the eastern and northeastern regions, which could further accelerate the achievement of the value of ER in the greening of the transportation industry. Simultaneously, all regions should continue to advance the establishment of information-sharing platforms to ensure the timely dissemination of green transportation-related information, facilitate the exchange of technical expertise, and promote the sharing of development experiences across regions. These efforts will collectively bolster the overall competitiveness of green transportation in each region and foster the realization of a more sustainable and efficient transportation system.
(3) Follow the principle of ‘moderation’ and dynamically optimize ER measures. In the top-level design of policy formulation, it is crucial to consider regional characteristics comprehensively, ensuring that ER is tailored to local conditions. The principle of proportionality should guide the progressive and orderly escalation of regulatory intensity. Policies should encourage industrial clustering and integrated regional development, especially in the central and western regions, and enhance synergies within and outside the region through the establishment of industrial clusters and regional cooperation platforms to improve the overall effectiveness of ER. At the same time, by establishing rigorous environmental standards and strengthening the enforcement and supervision of the ER, establishing a monitoring and evaluation mechanism for ER policies, regularly assessing the effectiveness of policy implementation, ensuring the safety of the ecological environment, stepping up efforts to combat pollution in transportation, and promoting the development of a green transportation system, in order to achieve the efficient and sustainable development of the transportation sector.
5.3. Research Limitations and Future Research Directions
This study makes a positive contribution to exploring the interregional heterogeneity of greening levels in China’s transportation and the spatial impacts of ER on the greening levels of the transportation industry. However, there are still some limitations that deserve deeper reflection by future researchers. First, green transformation in transportation is a complex systemic process that is affected by a combination of external factors. These key factors, such as global economic trends, technological breakthroughs, and changes in consumer behavior, have not been quantitatively measured in this study. Future research can consider constructing a comprehensive analytical framework that includes these external factors and quantitatively analyzing the degree of contribution of each factor to the total factor productivity of green transformation in the transportation sector and its mechanism of action. At the same time, multi-dimensional cross-sectional studies should be conducted, such as combining regional differences, traffic mode segmentation, and enterprise heterogeneity to deeply analyze the complexity of green transformation in the transportation sector. Second, the sudden drop in transportation demand, supply chain disruptions, and policy adjustments caused by the COVID-19 pandemic may have short-term impacts on the production and operation modes and factor input-output relationships in the transportation sector, which may affect the performance of GTFP. Some of the observed trends may not be entirely due to ER but rather to the disruption of epidemic factors. Future research could expand the time coverage to more accurately distinguish between the short-term shock effects of epidemics and the long-term systemic impacts of undefined regulation policies. In addition, although this study analyzed the impact of ER on the green transformation of transportation in general, it did not explore in depth the threshold of the inverted ‘U’-shaped relationship and the specific differences between regions. Future research could further refine the regional division, calculate the thresholds, and dynamically optimize ER, which would not only help to reveal the heterogeneity among regions but also provide a scientific basis for more targeted policy recommendations.
Author Contributions
Conceptualization: Y.S., J.C. and Q.L.; methodology: Y.S., J.C. and Q.L.; software: J.C.; validation: Y.S., J.C. and Q.L.; formal analysis: Y.S., J.C. and Q.L.; investigation: Y.S.; resources: Y.S. and Q.L.; data curation: J.C.; writing—original draft preparation: Y.S. and J.C.; writing—review and editing: Y.S. and Q.L.; visualization: J.C.; supervision: Y.S.; project administration: Y.S. and Q.L.; funding acquisition: Y.S. and Q.L. All authors have read and agreed to the published version of the manuscript.
Funding
This study was funded by the Natural Science Foundation of Shandong Province (Grant No. ZR2021MG021) and the Youth Innovation Technology Project of Higher School in Shandong Province (Grant No. 2021RW030).
Institutional Review Board Statement
Not applicable.
Informed Consent Statement
Not applicable.
Data Availability Statement
The data presented in this study are available on request from the corresponding author.
Conflicts of Interest
The authors declare no conflicts of interest.
References
- Gao, X.; Shao, S.; Gao, Q.; Zhang, Y.; Wang, X.; Wang, Y. Factors influencing carbon emissions and low-carbon paths in China’s transportation industry. Energy 2025, 323, 135778. [Google Scholar] [CrossRef]
- Zhang, L.; Weng, D.; Xu, Y.; Hong, B.; Wang, S.; Hu, X.; Zhang, Y.; Wang, Z. Spatio-temporal evolution characteristics of carbon emissions from road transportation in the mainland of China from 2006 to 2021. Sci. Total Environ. 2024, 917, 170430. [Google Scholar] [CrossRef] [PubMed]
- Liu, J.; Meng, H.; Xu, H.; Chen, J. Economic–environmental coordination and influencing factors under dual-carbon goal: A spatial empirical evidence from China’s transport sector. Environ. Dev. Sustain. 2025, 27, 531–569. [Google Scholar] [CrossRef]
- Owais, M.; El Sayed, M.A. Red light crossing violations modelling using deep learning and variance-based sensitivity analysis. Expert Syst. Appl. 2025, 267, 126258. [Google Scholar] [CrossRef]
- Owais, M.; Alshehri, A.; Gyani, J.; Aljarbou, M.H.; Alsulamy, S. Prioritizing rear-end crash explanatory factors for injury severity level using deep learning and global sensitivity analysis. Expert Syst. Appl. 2024, 245, 123114. [Google Scholar] [CrossRef]
- Zou, H. The social welfare effect of environmental regulation: An analysis based on Atkinson social welfare function. J. Clean. Prod. 2024, 434, 140022. [Google Scholar] [CrossRef]
- Ahmad, M.; Satrovic, E. How do transportation-based environmental taxation and globalization contribute to ecological sustainability? Ecol. Inform. 2023, 74, 102009. [Google Scholar] [CrossRef]
- Jia, Z.; Yin, J.; Cao, Z.; Wei, N.; Jiang, Z.; Zhang, Y.; Wu, L.; Zhang, Q.; Mao, H. Sustainable transportation emission reduction through intelligent transportation systems: Mitigation drivers, and temporal trends. Environ. Impact Assess. Rev. 2025, 112, 107767. [Google Scholar] [CrossRef]
- Zhao, Z.; Xu, J.; Feng, Y.; Liu, Z.; Lv, Q.; Mei, X. A novel reconfigurable supercapacitor system with equalization and surge current suppression to improve energy-utilization in supercapacitor urban transit systems. eTransportation 2025, 24, 100405. [Google Scholar] [CrossRef]
- Testoni, M. Transportation networks and competition in the market for corporate control. Strat. Manag. J. 2024, 45, 1180–1208. [Google Scholar] [CrossRef]
- Wang, Y. The impacts of improvements in the unified economic and environmental efficiency of transportation infrastructure on industrial structure transformation and upgrade from the perspective of resource factors. PLoS ONE 2022, 17, e0278722. [Google Scholar] [CrossRef] [PubMed]
- Le, X.C. Switching to green vehicles for last-mile delivery: Why perceived green product knowledge, consumption values and environmental concern matter. Int. J. Logist. Manag. 2024, 35, 2012–2031. [Google Scholar] [CrossRef]
- Rehman, F.U.; Islam, M.M.; Miao, Q. Environmental sustainability via green transportation: A case of the top 10 energy transition nations. Transp. Policy 2023, 137, 32–44. [Google Scholar] [CrossRef]
- Liu, J.; Yuan, Z.; Yan, L.; Zhou, W. Do Market-Based Environmental Regulations Promote Green Development? A Quasi-Natural Experiment Based on Carbon Emissions Trading Pilot of China. Emerg. Mark. Financ. Trade 2025, 61, 595–611. [Google Scholar] [CrossRef]
- Mahmoud, O. Location Strategy for Traffic Emission Remote Sensing Monitors to Capture the Violated Emissions. J. Adv. Transp. 2019, 2019, 6520818. [Google Scholar] [CrossRef]
- Wiskich, A. A comment on innovation with multiple equilibria and “The environment and directed technical change”. Energy Econ. 2021, 94, 105077. [Google Scholar] [CrossRef]
- Zefeng, M.; Gang, Z.; Xiaorui, X.; Yongmin, S.; Junjiao, H. The extension of the Porter hypothesis: Can the role of environmental regulation on economic development be affected by other dimensional regulations? J. Clean. Prod. 2018, 203, 933–942. [Google Scholar] [CrossRef]
- Benatti, N.; Groiss, M.; Kelly, P.; Lopez-Garcia, P. Environmental regulation and productivity growth in the euro area: Testing the porter hypothesis. J. Environ. Econ. Manag. 2024, 126, 102995. [Google Scholar] [CrossRef]
- Ouyang, X.; Liao, J.; Sun, C.; Cao, Y. Measure is treasure: Revisiting the role of environmental regulation in Chinese industrial green productivity. Environ. Impact Assess. Rev. 2023, 98, 106968. [Google Scholar] [CrossRef]
- Cheng, Z.; Kong, S. The effect of environmental regulation on green total-factor productivity in China’s industry. Environ. Impact Assess. Rev. 2022, 94, 106757. [Google Scholar] [CrossRef]
- Li, J.; Tang, D.; Tenkorang, A.P.; Shi, Z. Research on environmental regulation and green total factor productivity in Yangtze River Delta: From the perspective of financial development. Int. J. Environ. Res. Public Health 2021, 18, 12453. [Google Scholar] [CrossRef] [PubMed]
- Yuan, B.; Xiang, Q. Environmental regulation, industrial innovation and green development of Chinese manufacturing: Based on an extended CDM model. J. Clean. Prod. 2018, 176, 895–908. [Google Scholar] [CrossRef]
- Kamal, M.; Usman, M.; Jahanger, A.; Balsalobre-Lorente, D. Revisiting the role of fiscal policy, financial development, and foreign direct investment in reducing environmental pollution during globalization mode: Evidence from linear and nonlinear panel data approaches. Energies 2021, 14, 6968. [Google Scholar] [CrossRef]
- Huang, L.; Zhou, X.; Chi, L.; Meng, H.; Chen, G.; Shen, C.; Wu, J. Stimulating innovation or enhancing productivity? The impact of environmental regulations on agricultural green growth. J. Environ. Manag. 2024, 370, 122706. [Google Scholar] [CrossRef] [PubMed]
- Chen, Y.; Fan, X.; Zhou, Q. An inverted-U impact of environmental regulations on carbon emissions in China’s iron and steel industry: Mechanisms of synergy and innovation effects. Sustainability 2020, 12, 1038. [Google Scholar] [CrossRef]
- Tobler, W.R. A computer movie simulating urban growth in the Detroit region. Econ. Geogr. 1970, 46, 234–240. [Google Scholar] [CrossRef]
- Audretsch, D.B.; Feldman, M.P. R&D spillovers and the geography of innovation and production. Am. Econ. Rev. 1996, 86, 630–640. [Google Scholar]
- Ganotakis, P.; D’ANgelo, A.; Konara, P. From latent to emergent entrepreneurship: The role of human capital in entrepreneurial founding teams and the effect of external knowledge spillovers for technology adoption. Technol. Forecast. Soc. Change 2021, 170, 120912. [Google Scholar] [CrossRef]
- Yin, T. Research on Spatial Spillover Effect of Total Factor Productivity in Construction Industry: Evidence from Yangtze River Delta Region in China. Am. J. Ind. Bus. Manag. 2021, 11, 1140–1152. [Google Scholar] [CrossRef]
- Liang, X.; Li, P. Empirical study of the spatial spillover effect of transportation infrastructure on green total factor productivity. Sustainability 2020, 13, 326. [Google Scholar] [CrossRef]
- Zhong, H.; Li, Y.; Ding, J.; Bruckner, B.; Feng, K.; Sun, L.; Prell, C.; Shan, Y.; Hubacek, K. Global spillover effects of the European Green Deal and plausible mitigation options. Nat. Sustain. 2024, 7, 1501–1511. [Google Scholar] [CrossRef]
- Bartram, S.M.; Hou, K.; Kim, S. Real effects of climate policy: Financial constraints and spillovers. J. Financ. Econ. 2022, 143, 668–696. [Google Scholar] [CrossRef]
- Copeland, B.R.; Taylor, M.S. North-South trade and the environment. In International Trade and the Environment; Routledge: Abingdon, UK, 2017; pp. 205–238. [Google Scholar]
- Qian, T.; Fu, Z.; Chen, J.; Qin, S.; Xi, C.; Wang, J. Evaluating multiscale and multimodal transport inequalities in Chinese cities with massive open-source path data. J. Geogr. Syst. 2023, 25, 237–264. [Google Scholar] [CrossRef]
- Lu, M.; Chen, P. Traffic Safety, Fuel Tax Intensity and Sustainable Development Efficiency of Transportation: Evidence from China. Sustainability 2024, 16, 5930. [Google Scholar] [CrossRef]
- Peng, W.; Sun, Y.; Li, Y.; Yuchi, X. An Evaluation and Promotion Strategy of Green Land Use Benefits in China: A Case Study of the Beijing–Tianjin–Hebei Region. Land 2022, 11, 1158. [Google Scholar] [CrossRef]
- Yeung, G.; Liu, Y. Local government policies and public transport decarbonization through the production and adoption of fuel cell electric vehicles (FCEVs) in China. J. Clean. Prod. 2023, 422, 138552. [Google Scholar] [CrossRef]
- Tone, K. A slacks-based measure of efficiency in data envelopment analysis. Eur. J. Oper. Res. 2001, 130, 498–509. [Google Scholar] [CrossRef]
- Oh, D.-H. A global Malmquist-Luenberger productivity index. J. Prod. Anal. 2010, 34, 183–197. [Google Scholar] [CrossRef]
- Chung, Y.H.; Färe, R.; Grosskopf, S. Productivity and undesirable outputs: A directional distance function approach. J. Environ. Manag. 1997, 51, 229–240. [Google Scholar] [CrossRef]
- Myers Donald, E. “Book-review” Spatial Econometrics: From Cross-Sectional Data to Spatial Panels. Technometrics 2014, 56, 413. [Google Scholar]
- Pokki, H.; Virtanen, J.; Karvinen, S. Comparison of economic analysis with financial analysis of fisheries: Application of the perpetual inventory method to the Finnish fishing fleet. Mar. Policy 2018, 95, 239–247. [Google Scholar] [CrossRef]
- Hu, J.; Wang, Z.; Huang, Q.; Zhang, X. Environmental Regulation Intensity, Foreign Direct Investment, and Green Technology Spillover—An Empirical Study. Sustainability 2019, 11, 2718. [Google Scholar] [CrossRef]
- Vasilyeva, T.; Samusevych, Y.; Babenko, V.; Bestuzheva, S.; Bondarenko, S.; Nesterenko, I. Environmental Taxation: Role in Promotion of the Pro-Environmental Behaviour. WSEAS Trans. Bus. Econ. 2023, 20, 410–427. [Google Scholar] [CrossRef]
- Ren, M.; Zhou, T.; Wang, D.; Wang, C. Does environmental regulation promote the infrastructure investment efficiency? Analysis based on the spatial effects. Int. J. Environ. Res. Public Health 2023, 20, 2960. [Google Scholar] [CrossRef] [PubMed]
- Wang, S.; Zhang, W.; Wang, H.; Wang, J.; Jiang, M.-J. How does income inequality influence environmental regulation in the context of corruption? A panel threshold analysis based on Chinese provincial data. Int. J. Environ. Res. Public Health 2021, 18, 8050. [Google Scholar] [CrossRef]
- Fan, M.; Yang, P.; Li, Q. Impact of environmental regulation on green total factor productivity: A new perspective of green technological innovation. Environ. Sci. Pollut. Res. 2022, 29, 53785–53800. [Google Scholar] [CrossRef]
- Ke, C.; He, S.; Qin, Y. Comparison of natural breaks method and frequency ratio dividing attribute intervals for landslide susceptibility mapping. Bull. Eng. Geol. Environ. 2023, 82, 384. [Google Scholar] [CrossRef]
- Chen, Y.; Cheng, S.; Zhu, Z. Measuring environmental-adjusted dynamic energy efficiency of China’s transportation sector: A four-stage NDDF-DEA approach. Energy Effic. 2021, 14, 35. [Google Scholar] [CrossRef]
- Hren, R.; Vujanović, A.; Van Fan, Y.; Klemeš, J.J.; Krajnc, D.; Čuček, L. Hydrogen production, storage and transport for renewable energy and chemicals: An environmental footprint assessment. Renew. Sustain. Energy Rev. 2023, 173, 113113. [Google Scholar] [CrossRef]
- Cui, Q.; He, L.; Liu, Y.; Zheng, Y.; Wei, W.; Yang, B.; Zhou, M. The impacts of COVID-19 pandemic on China’s transport sectors based on the CGE model coupled with a decomposition analysis approach. Transp. Policy 2021, 103, 103–115. [Google Scholar] [CrossRef]
- Behera, B.; Sahoo, M.; Sethi, L.; Das, A.; Sethi, N.; Ahmad, M. Fuelling the low-carbon transportation sector in emerging economies: Role of institutional quality, environmental tax, green technology innovation and biofuel. Transp. Policy 2025, 166, 124–134. [Google Scholar] [CrossRef]
- Li, W.; Qiao, Y.; Li, X.; Wang, Y. Energy consumption, pollution haven hypothesis, and Environmental Kuznets Curve: Examining the environment–economy link in belt and road initiative countries. Energy 2022, 239, 122559. [Google Scholar] [CrossRef]
- Wang, Q.; Zhang, F.; Li, R. Revisiting the environmental kuznets curve hypothesis in 208 counties: The roles of trade openness, human capital, renewable energy and natural resource rent. Environ. Res. 2023, 216, 114637. [Google Scholar] [CrossRef]


Disclaimer/Publisher’s Note: The statements, opinions and data contained in all publications are solely those of the individual author(s) and contributor(s) and not of MDPI and/or the editor(s). MDPI and/or the editor(s) disclaim responsibility for any injury to people or property resulting from any ideas, methods, instructions or products referred to in the content. |
© 2025 by the authors. Licensee MDPI, Basel, Switzerland. This article is an open access article distributed under the terms and conditions of the Creative Commons Attribution (CC BY) license (https://creativecommons.org/licenses/by/4.0/).