


Abstract
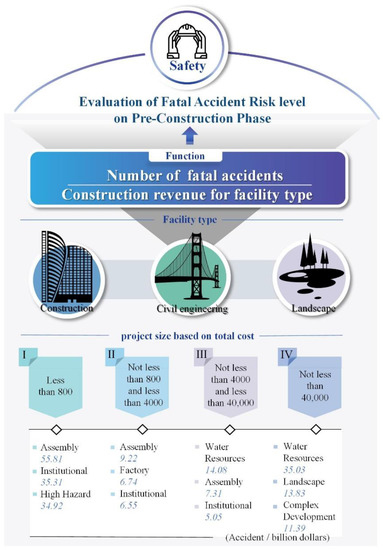
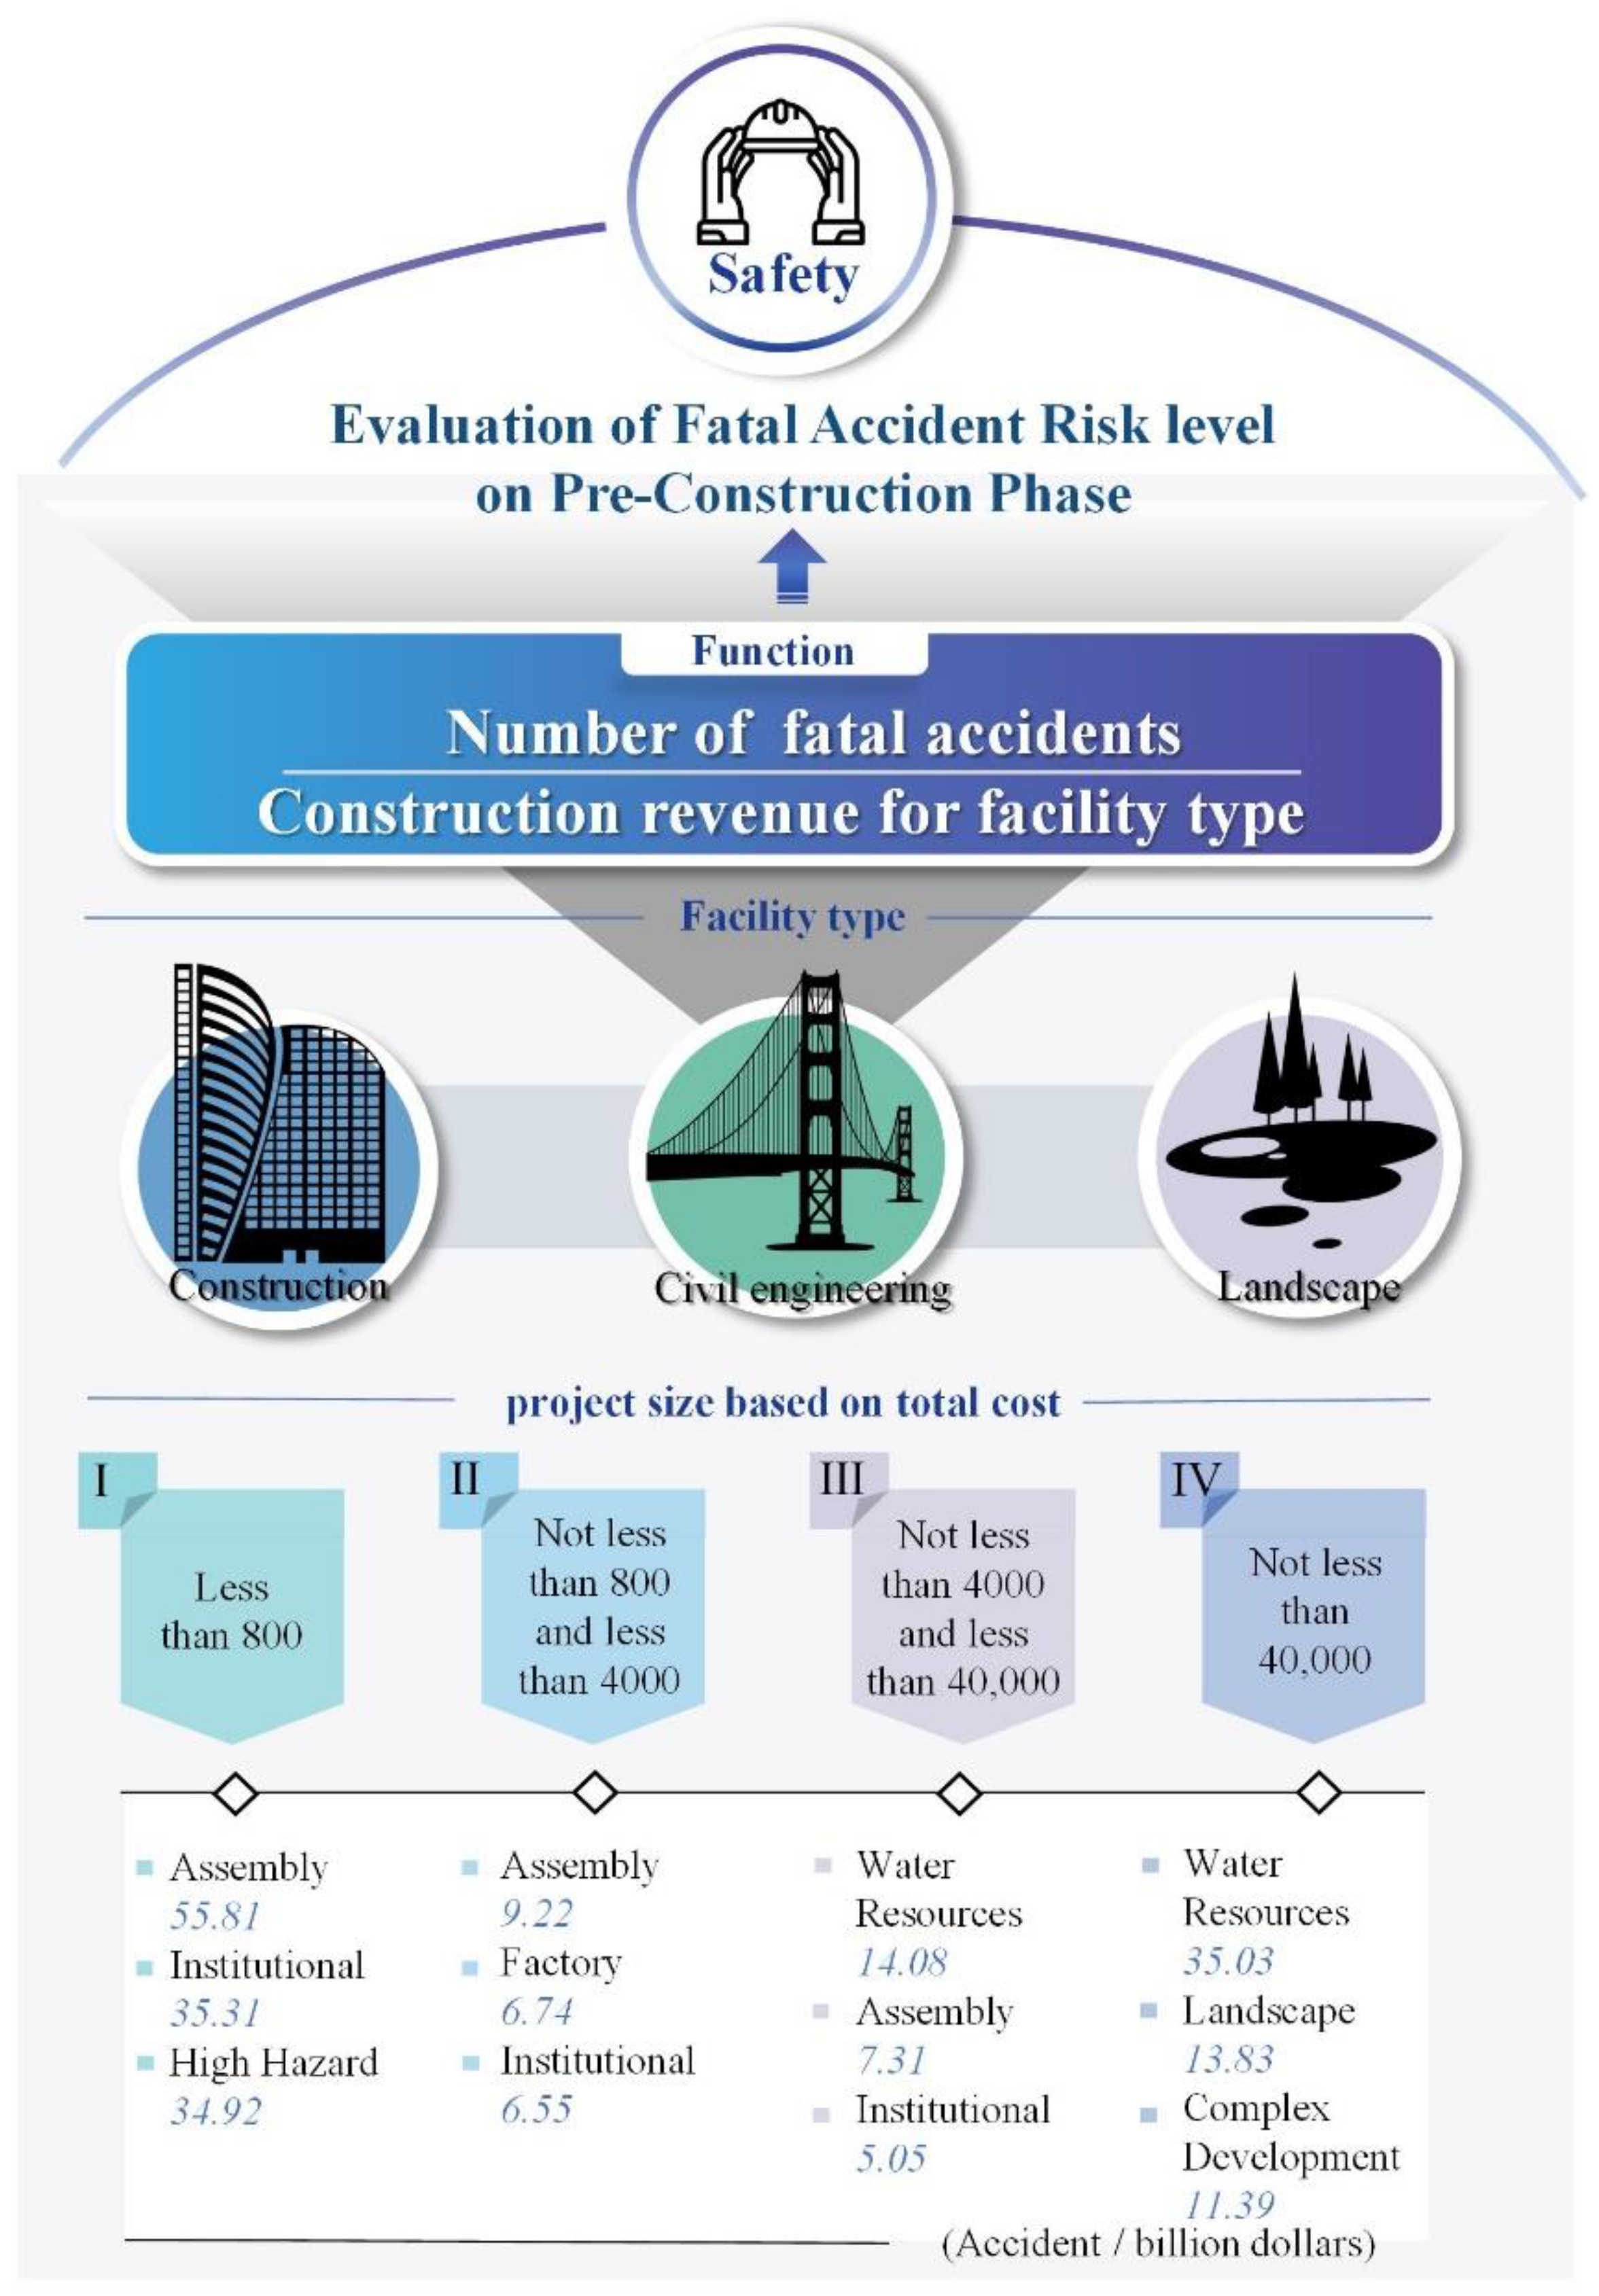
Compared with other industries such as manufacturing, the construction industry has a higher danger of fatalities. In Korea, the risk level in the construction industry is managed using the fatality rate per 10,000 construction workers. However, this statistic is lacking in determining the exact risk level because it does not consider the exact number of workers and fails to reflect the specific characteristics of the construction industry. In this study, the fatality rate is deduced by considering the facility type and the project size based on total cost. From the results obtained, considering the facility type, “Assembly” is seen to be the most dangerous facility type. Considering the project size based on total cost, “Less than 0.008 billion dollars” is the most dangerous construction scale. Considering both the facility type and the project size based on total cost, it was confirmed that the overall fatality rate could exceed the fatality rate respective to each facility type and project size. Using the proposed method, it is possible to determine the quantitative risk level considering specific characteristics of the construction industry.
1. Introduction
The construction industry has a higher risk of accidents compared with other industries owing to work at heights, heavy equipment, and interference in various tasks, resulting in many accidents [1]. Such accidents include falls without safety contraptions, being trapped under cargo vehicles, and being struck by falling objects. According to the statistics for occupational fatal accidents in the “2020 Occupational Accident Statistics” published by the Ministry of Employment and Labor, Korea, there were 458 fatal accidents in the construction industry in 2020, accounting for about 51.93% of all industrial fatal accidents [2]. Therefore, to manage the high risk level in the construction industry, it is necessary to accurately calculate the fatality rate in the construction industry and to establish a safety management plan based on it [3]. However, there are difficulties associated with the existing risk level calculation method with respect to safety management, as follows. First, the fatality rate per 10,000 construction workers that is used to indicate risk level in the construction industry is calculated using the number of fatal accidents and the number of regular workers. In this case, the number of regular workers is estimated through the construction cost and labor ratio [3]. As the number of regular workers estimated through the labor ratio is different from the actual number of workers, it is impossible to accurately calculate the probability of the occurrence of fatal accidents [4]. Secondly, the fatality rate per 10,000 construction workers, which is presented in national data as industrial accident statistics, is presented only for the entire construction industry. However, in the construction industry, there are different types of major accidents and risk levels for each type of facility, construction, and work unit [5,6]. In addition, considering the project size based on total cost, the fatality rate would differ from those of small-size to large-size construction [7]. For effective safety management, it is necessary to evaluate the risk level whilst considering both the facility type and the scale of such construction work. In the construction industry, safety management should be performed based on the specifics of the facility type [8]. For example, in apartment construction, the main type of construction is reinforced concrete construction, and most accidents are caused by “falling”. As such, to prevent fatal accidents and injuries in the construction industry, safety management that considers the major accident types for each facility is required [6]. In addition, there is a difference in the frequency of accidents in the construction industry according to construction scale, and most of the fatal accidents and injuries occur on small-scale construction project sites [9]. Pham et al. [10] proposed the need for safety management according to construction scale when establishing a safety plan for construction work. As the construction industry has different characteristics, such as facility type and construction scale, it is necessary to calculate and manage the risk level by considering these parameters. This study aims to provide a database that can be used by safety managers when establishing safety management plans by evaluating the risk level according to the facility type as well as according to the project size based on the total cost of the construction. For this purpose, fatal accidents data and construction cost data were collected by facility type and project size based on total cost provided by the Occupational Safety and Health Agency and the National Statistical Office. By using the collected data, the quantitative fatality rate according to the facility types and project size was calculated.
2. Literature Review
In several previous studies, the risk level of the construction industry was presented using statistical methods such as the fatality rate. However, according to the study reported by Aven and Zio [4], risk analysts will have better results using standard probability theory rather than trying out alternatives that are harder to understand, and which will not be logically consistent if they are not equivalent to standard distribution. Therefore, the number of regular workers estimated through the labor ratio differs from the actual number of workers. This fatality rate cannot accurately be used to manage the risk level in the construction industry. On the other hand, it is very important to calculate fatality losses by considering various aspects of the construction industry, according to the study reported by Lee et al. [1]. They calculate the risk level in the construction industry using construction cost rather than the number of regular workers. The project size based on total cost is subject to being reported for each construction project, and accurate figures can be calculated every year. In addition, previous studies have the following limitations. First, there are many risk level assessments for single facilities, but only few studies exist on risk levels spanning across facilities. Secondly, although the risk level differs depending on the project size based on total cost, previous studies have insufficient analysis on this parameter, and there are different methods for defining construction scale. Thirdly, the construction industry needs to compare risk levels using a probabilistic method rather than a qualitative method because the established accuracy differs depending on facility and size. Therefore, the purpose of this study is to evaluate the risk level by considering the facility type and the size by total cost. Table 1 summarizes previous studies that have calculated the fatality rate of constructions or which have proposed a risk level management method in terms of facility type and project size. In previous studies on the “Fatality Rate”, if the risk level was evaluated in a qualitative way, the subjectivity of the evaluator could be involved and the evaluation could be somewhat different from reality, so a quantitative evaluation method was used. In previous studies on the “Facility type”, the causes of the accident were different, showing that the type of facility should be considered in risk assessment. Previous studies on the “Construction scale”, show that the risk should be managed by considering the difference in safety costs invested according to the scale.
Table 1.
Results of literature review.
3. Materials and Methods
To calculate the quantitative fatality rate for each facility type and project size based on total cost of construction work, this study was carried out in three stages, as shown in Figure 1: (i) data collection and classification; (ii) evaluation of risk level for different facility types; and (iii) evaluation of risk level for facility type according to project size.
Figure 1.
Research process.
3.1. Data Collection and Classification
To calculate the fatality rate considering the facility type and the project size based on total cost, data such as the number of fatal accidents and total project costs were collected. To evaluate the risk level according to the facility type in the construction work, appropriate data collection is required. Pre-existing construction data was provided by the National Statistical Office considering the facility type from 2013 to 2019. Thus, in this study, total project cost data were collected for 7 years from 2013 to 2019 presented by the National Statistical Office (Korean Statistical Information Service, 2021). In addition, 3828 cases of fatal accidents in the construction industry were collected from the Occupational Safety and Health Agency for the seven-year period from 2013 to 2019 [20].
It is necessary to classify the appropriate facility type and project size when calculating the fatality rate considering the project size based on total cost of the facility, using the number of fatal accidents and the total project cost data collected earlier. First, the pre-existing data collected by the National Statistical Office is divided into four major categories: architecture, civil engineering, industrial equipment, and landscaping, and there were 51 types of subdivision works. In this study, 17 types of subdivision works belonging to the categories “building construction” and “industrial equipment” were reclassified into 10 categories from “Assembly” to “Utility and Miscellaneous” based on the International Building Code (IBC) building use classification criteria [21]. The IBC standard aims to identify different levels of life safety risks depending on the use of the building [21]. In the case of “civil engineering”, it was classified into six categories from “Road” to “Water Resources” according to the type of structure. In the case of “Landscape Construction”, all landscaping works were presented in one total project cost dataset, so it could not be classified in more detail. Hence, it was integrated into one classification and presented as “Landscape”. As a result, a total of 17 categories were classified, as shown in Table 2.
Table 2.
Classification of facility type.
In Article 55, Paragraph 2 of the Labor Standards Act, the size of the construction is classified according to the number of workers, as shown in Table 3 [22]. These construction scale criteria are a widely used standard in Korea.
Table 3.
Classification of scale on the construction.
This study uses the monthly wage of construction workers and the ratio of labor cost to the number of construction workers and the ratio of labor cost to construction cost to calculate the size of the construction. The construction size is calculated as an inverse of the independently classified construction cost scaled to the total cumulative cost of construction.
In this study, using the monthly wage of construction workers and the ratio of labor cost to construction cost, the size of the construction according to the number of workers was inversely calculated as the scale of the construction cost by construction cost. The project size based on total cost was calculated using Equation (1).
Scale of the construction cost ($) =
(Monthly wage of construction worker × 12 × The number of workers)/(Ratio of the labor cost to revenue)
(Monthly wage of construction worker × 12 × The number of workers)/(Ratio of the labor cost to revenue)
Here, for the monthly wage of construction cost and the ratio of the labor cost to construction cost, the values provided by the Ministry of Employment and Labor of were used and were, respectively, $3419 and 0.27 [23].
In this study, Equation (1) was used to classify the project size based on total cost into four categories, ranging from “Less than 0.008 billion dollars” to “Not less than 0.395 billion dollars”, as shown in Table 4. In Table 3, Size 1 is the site with the smallest scale on construction cost, Size 2 is the site with a medium scale construction cost, Size 3 is the site with a large scale construction cost, and Size 4 is the site with the largest scale construction cost.
Table 4.
Classification of size on construction cost.
The number of fatal accidents and total project cost values collected earlier were reclassified according to project size based on total cost of the facility type. Table 5 presents an example of the results of classifying “Residential” with the largest number of fatal accidents.
Table 5.
Classification example for residential construction.
3.2. Evaluation of Risk Level According to Facility Type
The fatality rate per 10,000 workers, which is one of the methods employed to indicate the risk level of the construction industry in Korea, is calculated using Equation (2) as follows:
Fatality rate per 10,000 workers (‱) =
(The number of fatal accidents)/(The number of construction workers) × 10,000
(The number of fatal accidents)/(The number of construction workers) × 10,000
In Equation (2), the number of construction workers can be calculated using annual construction cost revenue, ratio of labor cost to construction cost revenue, and monthly wage of construction workers, as in Equation (3).
The number of construction workers =
(Annual construction revenue × Ratio of the labor cost to revenue)/(Monthly wage of construction worker × 12)
(Annual construction revenue × Ratio of the labor cost to revenue)/(Monthly wage of construction worker × 12)
The number of construction workers used for the fatality rate per 10,000 workers is estimated based on a uniform labor rate, as in Equation (3).
Therefore, it is difficult to calculate the exact number of workers and is unsuitable for quantitative risk assessment [1]. To solve this problem, a risk assessment method based on the construction cost can be performed. To evaluate the risk associated with construction work, Son [24] compared the results of risk assessment based on the number of actual workers and risk assessment based on the construction cost. The results showed that the risk evaluation based on construction cost was approximate to the risk evaluation based on the number of actual workers. Based on these results, a quantitative risk level can be easily calculated based on the construction cost instead of estimating the risk using the number of workers in the construction. Lee [19] evaluates the cost effectiveness of accident prevention by construction size through comparing fatality rates, which are calculated based on the total project cost, and the number of accidents.
Therefore, the fatality rate is calculated based on the total project cost instead of the number of construction workers. The project cost-based fatality rate calculation method presented in this study is the same as in Equation (4).
where FRf is the fatality rate per thousand dollars for each facility type, Nf is the total number of fatal accidents for each facility type, and Rf is the total construction cost for each facility type.
FRf (Accident/billion dollars) = Nf/Rf
If there are no accidents, the probability is calculated with one case.
3.3. Evaluation of Risk Level for Each Facility Type according to Project Size Based on Total Cost
The number of fatal accidents and the total project cost were used to present the fatality rate for each facility type in construction work. However, the risk level in construction varies depending on facility type as well as project size based on total cost [19]. Therefore, this study intends to present the fatality rate considering not only the facility type but also the project size based on total cost of the facility type.
where FRfs is the fatality rate per thousand dollars for each facility type according to project size, Nfs is the number of fatal accidents for each facility type according to the project size and scale of the construction cost, and Rfs is the total construction cost for each facility type according to project size.
FRfs (Accident/billion dollars) = Nfs/Rfs
4. Results and Discussion
4.1. Analysis of Number of Fatal Accidents and Fatality Rate for Each Facility Type
Before analysis of FRf, the number of fatal accidents and total project cost according to facility type are presented in Table 6.
Table 6.
Analysis of the number of fatal accidents for each facility type.
Based on these results, “Residential”, “Factory”, and “Business” had 829 cases, 720 cases, and 384 cases, respectively, indicating the facility types with the higher number of fatal accidents. “Airports and Seaports”, “Tunnel”, and “Bridge” had six cases, 22 cases, and 35 cases, respectively, indicating the facility types with a lower number of fatal accidents. However, the number of workers recorded varies depending on the facility type. Thus, it is difficult to determine that the risk level of a facility type is high simply because the number of fatal accidents is large. Considering these characteristics of the construction industry, Equation (4) was used to evaluate the fatality rate.
Therefore, FRf was calculated using Equation (4), and the results are shown in Table 7. From the results of the FRf calculation based on the total project cost of the facility, “Assembly”, “Institutional”, and “Water Resources” were at high-risk levels of 15.05 accidents/billion dollars, 8.26 accidents/billion dollars, and 8.21 accidents/billion dollars, respectively. However, “Airport and Seaport”, “Tunnel”, and “Residential” had low-risk levels of 0.64 accidents/billion dollars, 2.17 accidents/billion dollars, and 2.39 accidents/billion dollars, respectively. In the case of “Residential”, which showed the highest risk level in terms of the number of fatal accidents, the third lowest risk level in terms of probability was observed. Thus, the results of the risk level of a construction project should be evaluated according to the facility type using a probabilistic method.
Table 7.
Analysis of FRf.
In this study, we analyzed fatality rate according to project size based on the total cost of facility type as opposed to fatality rate according to facility type. For the scale standard for construction cost, four project sizes based on total cost standards presented in Table 4 were used.
In addition, using the FRfs presented in this study, it is possible to compare the risk level according to facility type and project size based on total cost in the pre-construction stage such as bidding, planning, and design. Therefore, it is possible to establish a safety management plan that considers the relative risk level under a limited safety budget.
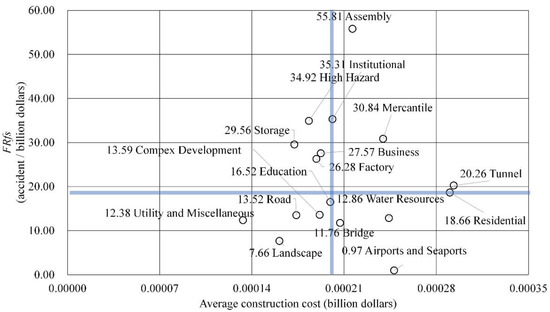
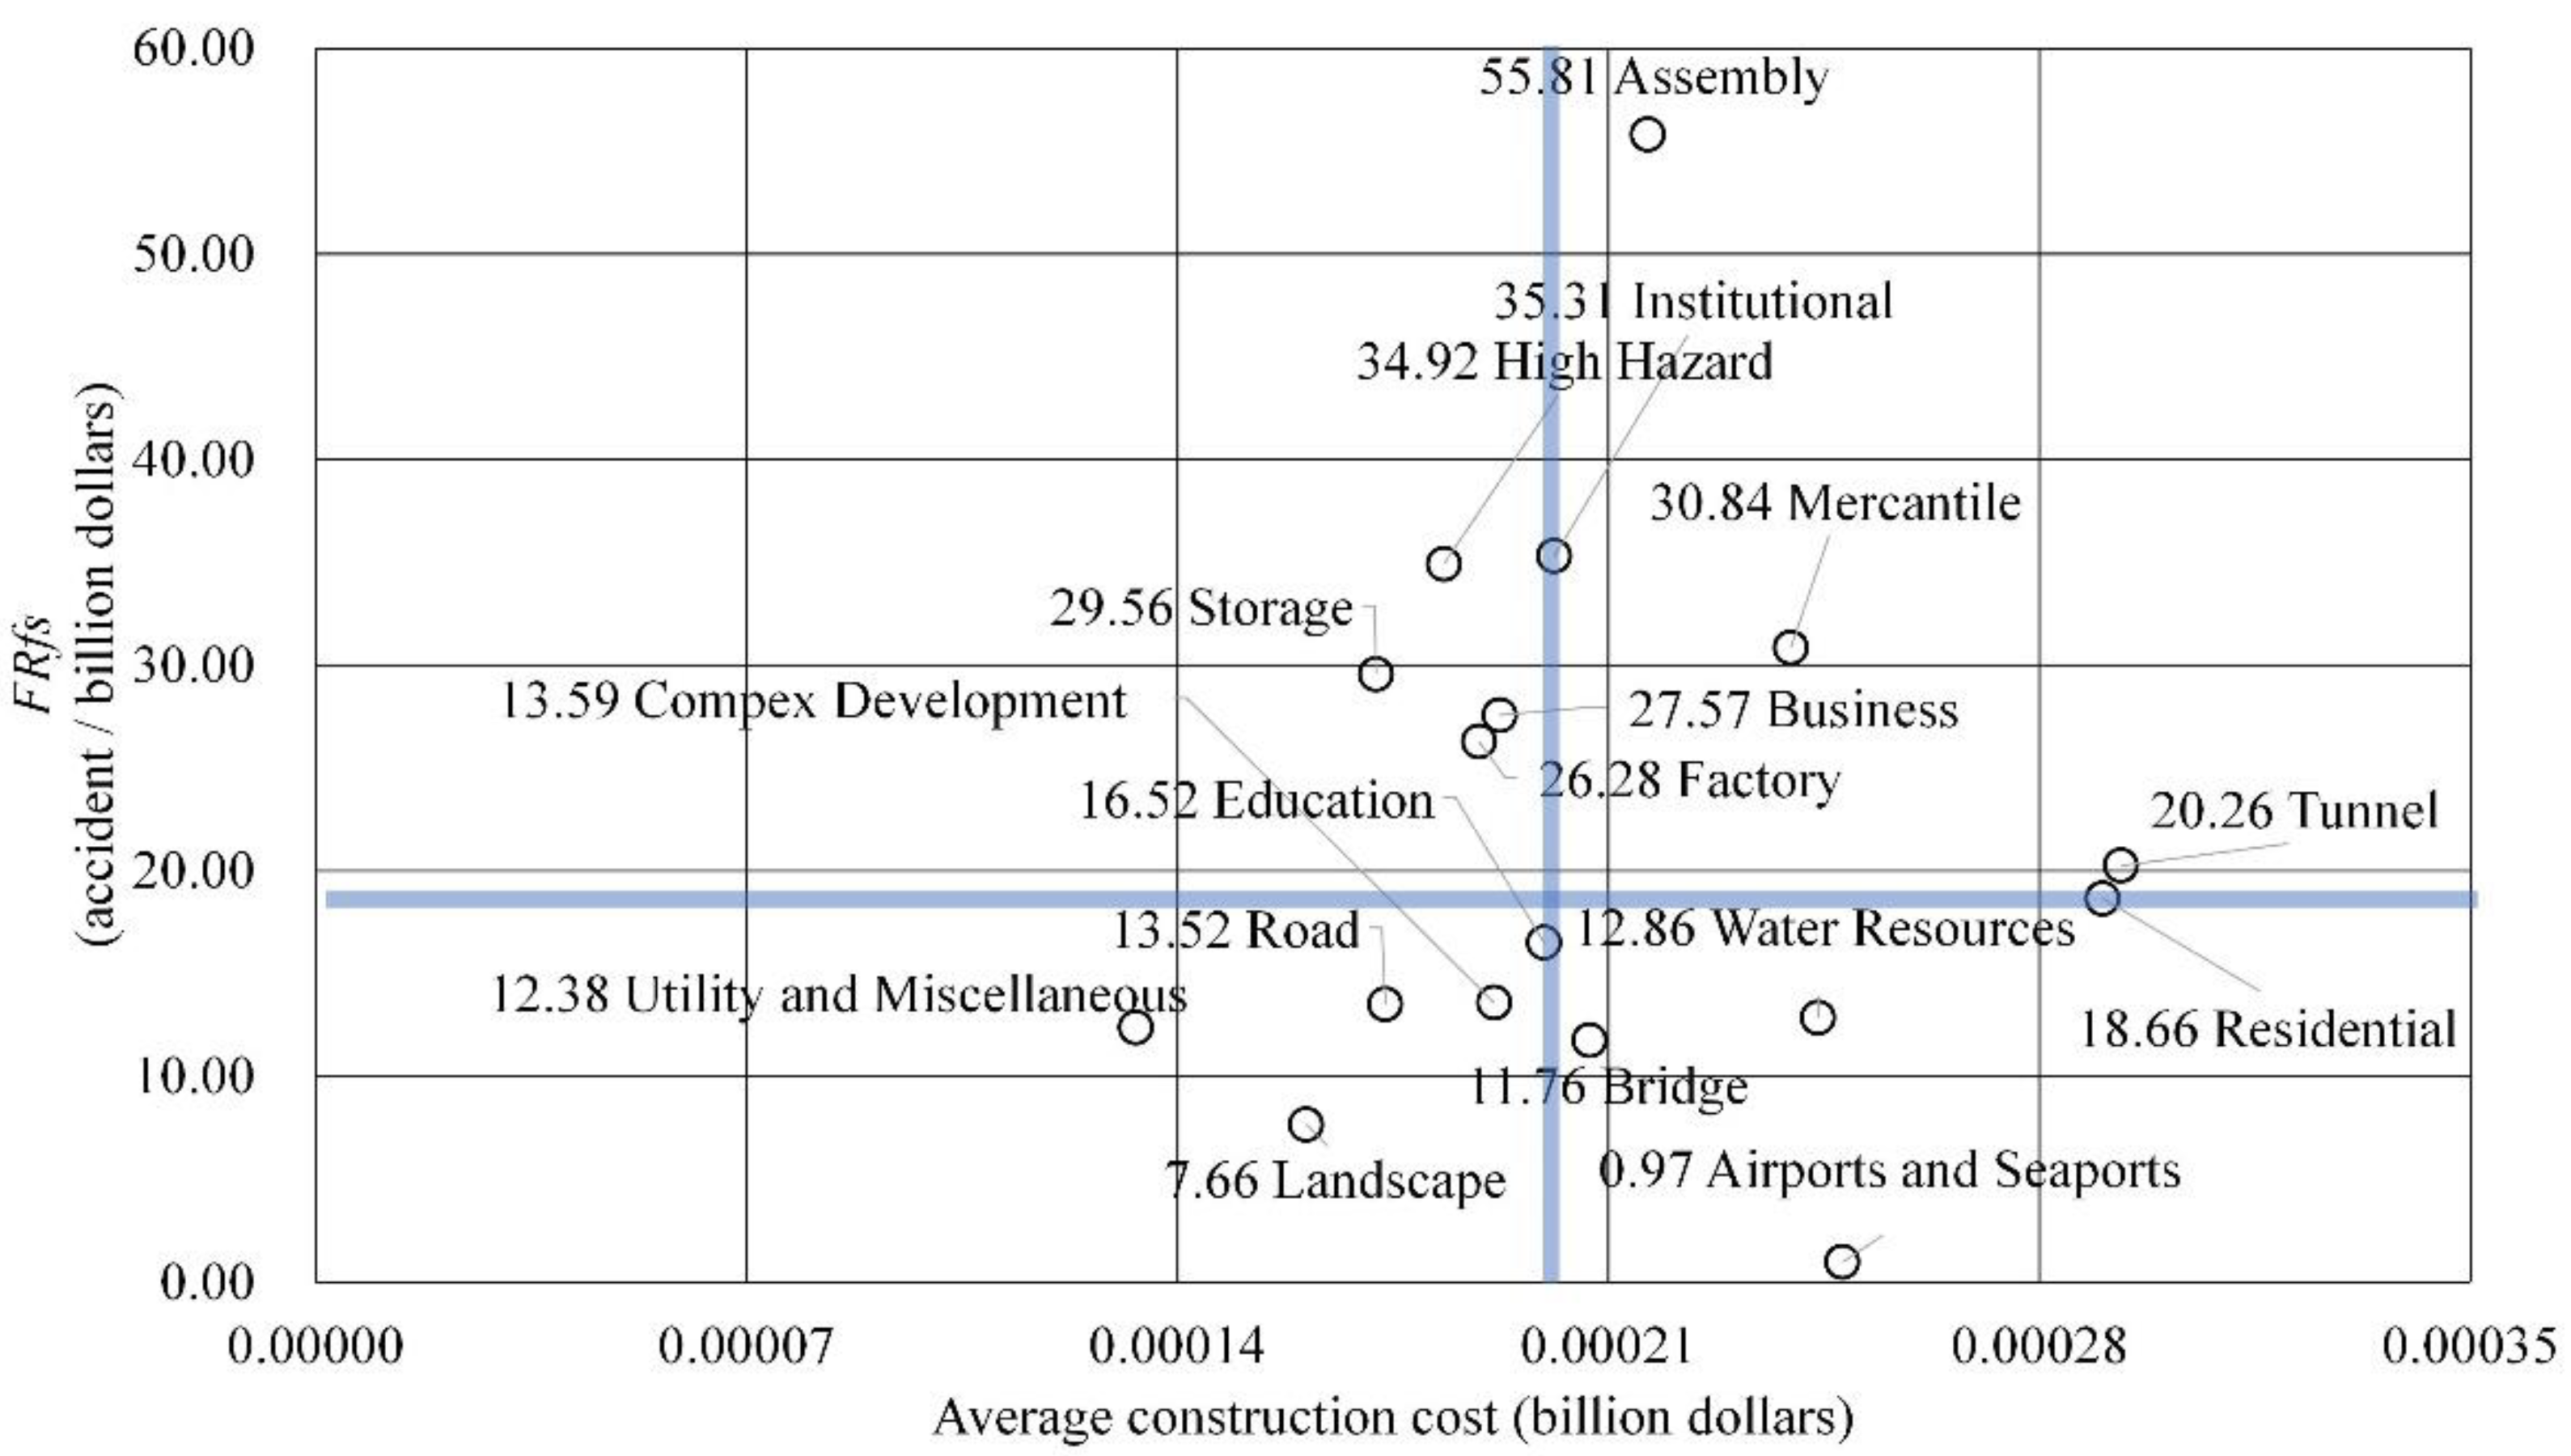
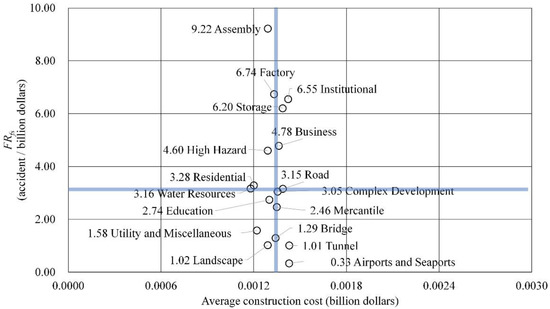
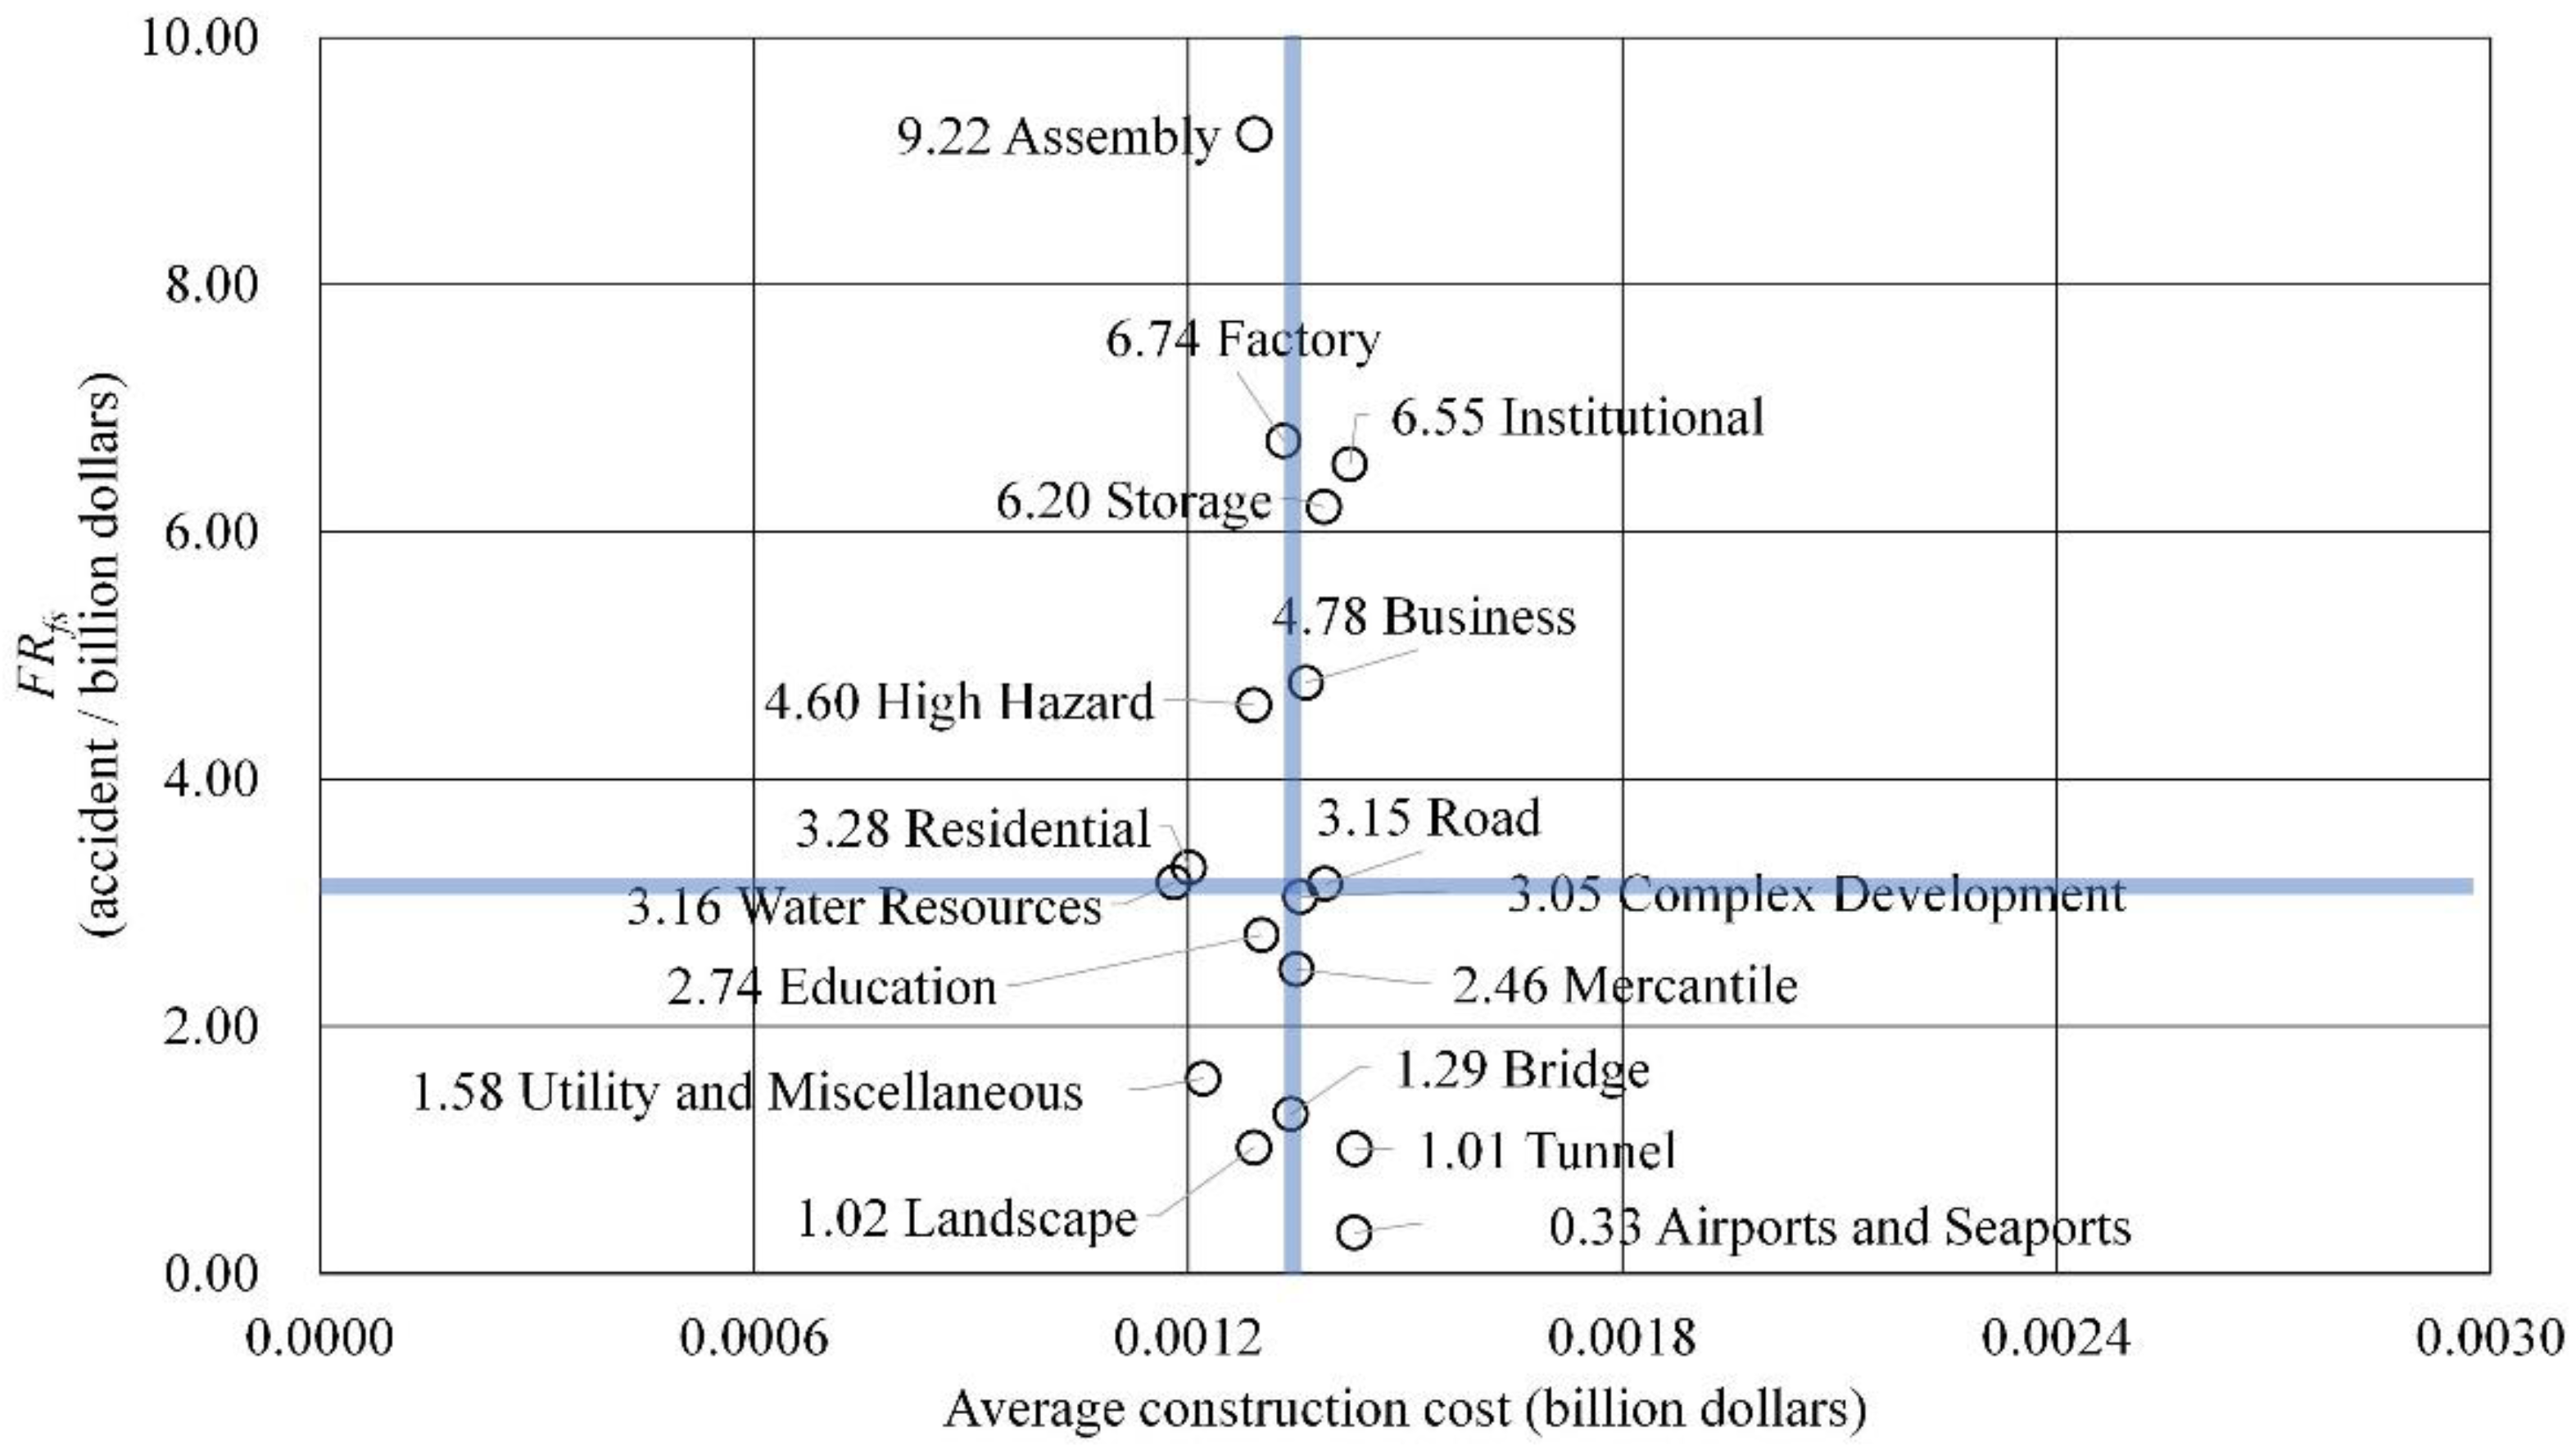
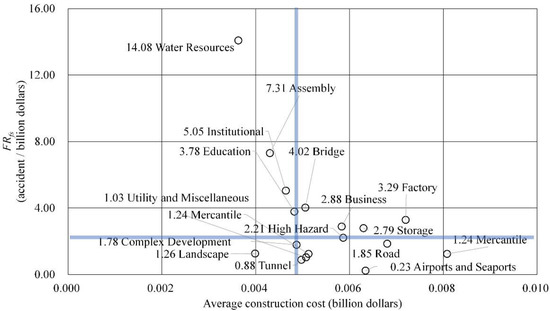
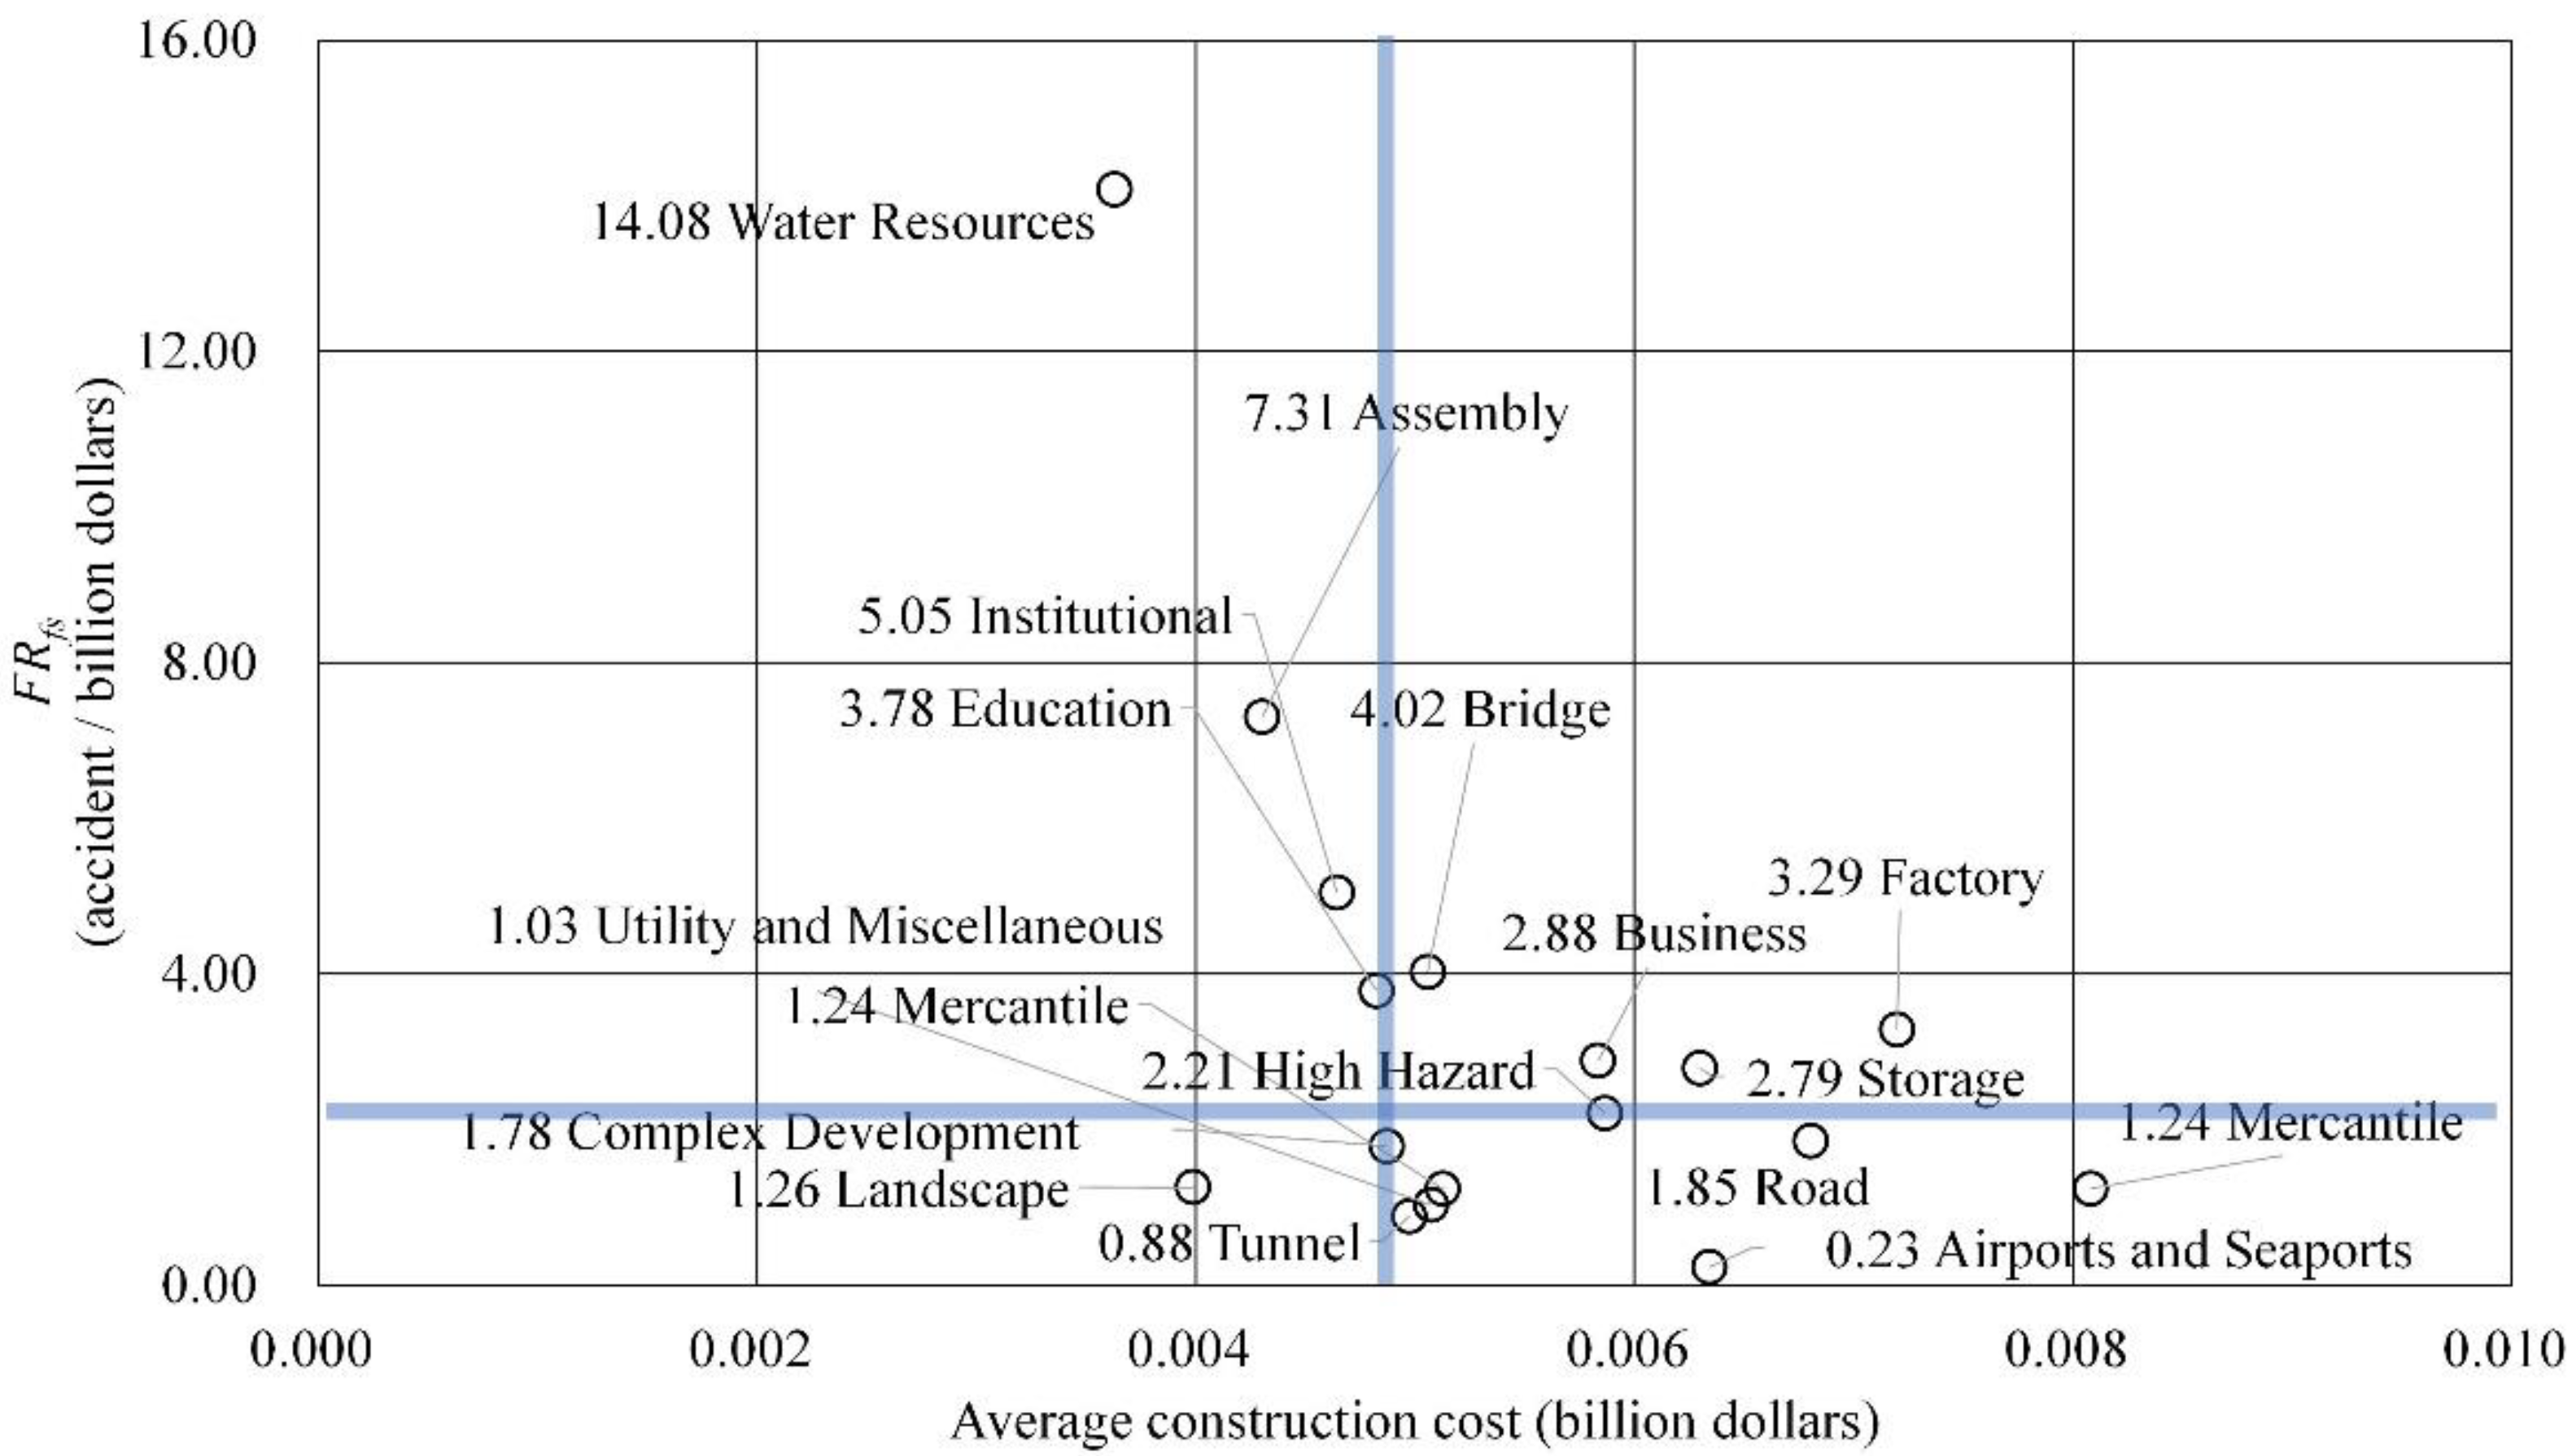
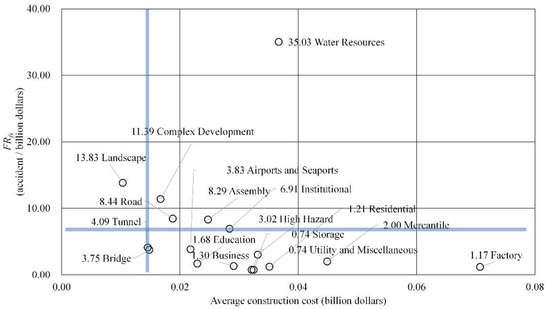
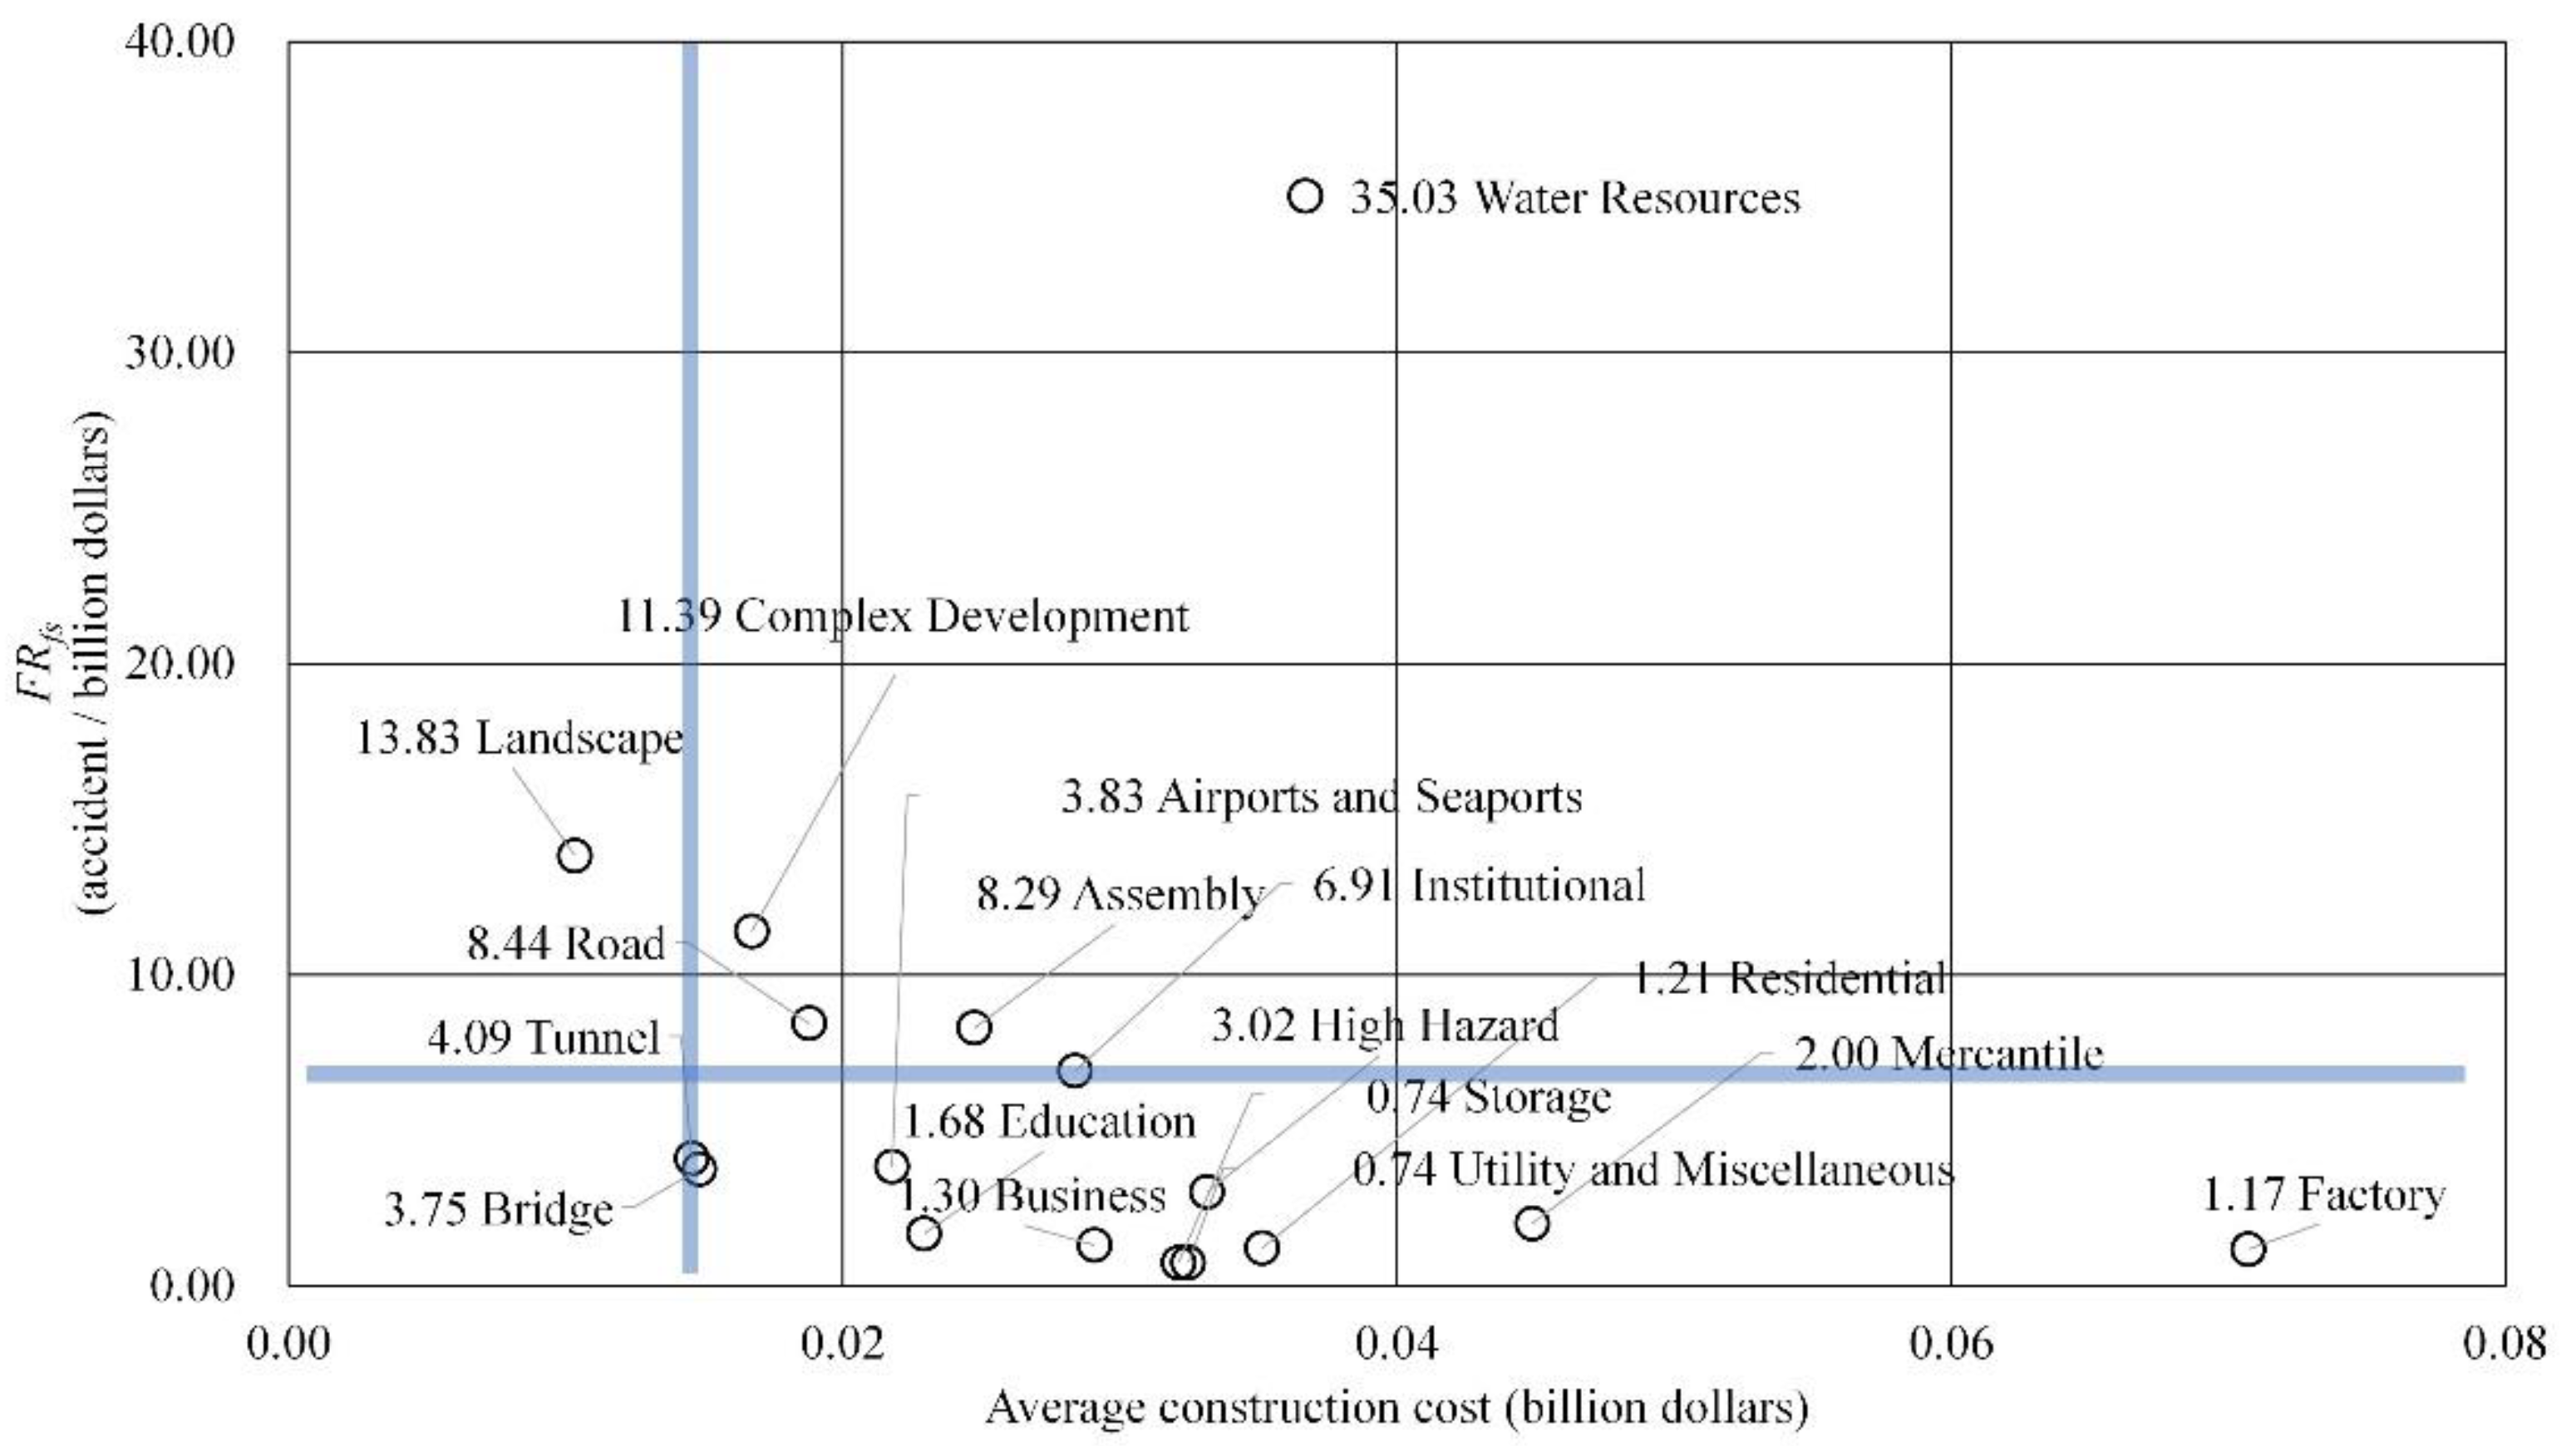
However, although it is possible to compare the risk levels for each of the 17 facilities based on the results of this study, it is difficult to accurately compare facility types that have similar risk levels. In addition, in the case of a facility that performs better than other facilities, the denominator becomes larger and the FRfs may appear relatively low. Therefore, in order to establish a safety management plan that considers both average project cost and FRfs, these two variables were used and presented in Figure 2, Figure 3, Figure 4 and Figure 5. The presented quadrant placed FRfs on the Y-axis and the average project cost on the X-axis, and divided the quadrant using the median to avoid the influence of extreme values of the facility.
Figure 2.
Comparison analysis between the total project cost and the FRfs for Size 1 construction site.
Figure 3.
Comparison analysis between the total project cost and the FRfs for size 2 construction site.
Figure 4.
Comparison analysis between the total project cost and the FRfs for Size 3 construction site.
Figure 5.
Comparison analysis between the total project cost and the FRfs for Size 4 construction site.
4.1.1. Analysis of FRfs for Size 1 Construction Site
Table 8 shows the fatality rate at size one sites, and for a more accurate analysis, Figure 2 shows the quadrants based on the median average project cost of 0.00020 billion dollars and the median FRfs of 18.66 accidents/billion dollars.
Table 8.
FRfs for Size 1 construction site.
The results are as follows. In the case of “Education” and “Residential”, they had a risk level of 16.52 accidents/billion dollars, 12.38 accidents/billion dollars, and an average project cost of 0.00020 billion dollars and 0.00029 billion dollars, located on the x-axis and y-axis median dividing lines, respectively. In the first quadrant, “Assembly” has the highest risk level of 55.81 accidents/billion dollars, and, in the second quadrant, “High Hazard” has the highest risk level of 34.92 accidents/billion dollars. If a construction company carries out “Assembly” and “Water Resources” projects at the same time with the limited safety management costs, it would be better to invest more safety costs on “Assembly” construction.
4.1.2. Analysis of FRfs for Size 2 Construction Site
Table 9 shows the FRfs for a Size 2 construction site.
Table 9.
FRfs for size 2 construction site.
Table 9 shows the fatality rate at Size 2 construction sites, and for a more accurate analysis, Figure 3 shows the quadrants based on the median average project cost of 0.00134 billion dollars and the median FRfs of 3.15 accidents/billion dollars. In the case of “Bridge” and “Road”, they had a risk level of 1.29 accidents/billion dollars, 3.15 accidents/billion dollars, and an average project cost of 0.00134 dollars and 0.00139 dollars, and were located on the x-axis and y-axis median dividing line, respectively. In the first quadrant, “Institutional” had the highest risk level with 6.55 accidents/billion dollars. Facilities located in the third and fourth quadrants belonged to civil engineering and landscaping facilities except for “Education”. If a construction company carries out “Assembly” and “Water Resources” projects at the same time with limited safety management costs, it would be better to invest more safety costs on “Assembly”.
4.1.3. Analysis of FRfs for Size 3 Construction Site
Table 10 shows the FRfs for a Size 3 construction site.
Table 10.
FRfs for size 3 construction site.
The fatality rate at the Size 3 construction site is presented in Table 10, and for a more accurate analysis, the quadrants are shown in Figure 4 based on the median average project cost of 0.00507 billion dollars and the median FRfs of 2.21 accidents/billion dollars. In the case of “Utility and Miscellaneous” and “High Hazard”, they had a risk level of 1.03 accidents/billion dollars and 2.21 accidents/billion dollars, and an average construction cost of 0.00507 billion dollars and 0.00587 billion dollars and were located on the x-axis and y-axis median dividing line, respectively. In the first quadrant, “Factory” had the highest risk level with 3.29 accidents/billion dollars. The construction of civil engineering and landscaping facilities except “Water Resources” are located at the third and fourth quadrants. If a construction company carries out “Assembly” and “Water Resources” projects at the same time with limited safety management costs, it would be better to invest more safety costs on “Water Resources”. However, FRfs for both projects are still above average.
4.1.4. Analysis of FRfs for Size 4 Construction Site
Table 11 shows the FRfs for a Size 4 construction site.
Table 11.
FRfs for Size 4 construction site.
The fatality rate at the Size 4 construction site is presented in Table 11, and for a more accurate analysis, the quadrants are shown in Figure 5 based on the median average project cost of 0.02839 billion dollars and the median FRfs of 3.75 accidents/billion dollars. In the case of “Institutional” and “Bridge”, they had a risk level of 6.91 accidents/billion dollars, 3.75 accidents/billion dollars, and an average project cost of 0.02839 billion dollars and 0.01483 billion dollars, respectively, and were located on the x-axis and y-axis median dividing line, respectively. In the first quadrant, “Water Resources” had the highest risk level with 35.03 accidents/billion dollars. The construction of civil engineering and landscaping facilities except “Assembly” are located in the third and fourth quadrants. If a construction company carries out “Assembly” and “Water Resources” projects at the same time with limited safety management costs, it would be better to invest more safety costs on “Water Resources”. It is a recommendation that can be more clearly understood because it carries a much greater risk than average.
4.2. Discussion
In this study, it was found that the risk level in construction work differs according to the facility type and project size based on total cost. The practical implications of this study on FRfs and the project size based on total cost are as follows.
First, for the objectivity of risk level occurrence, the risk level was calculated using the actual occurrence of accidents and the construction cost. In addition, the risk level was calculated with consideration of the type of facility and the construction size project to solve the cost-effectiveness problem of the safety management cost that may occur because the safety management cost and safety manager appointment costs are determined according to the size of the construction.
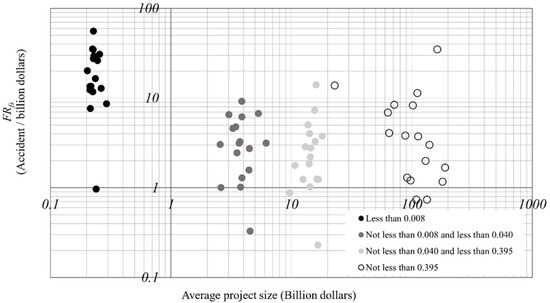
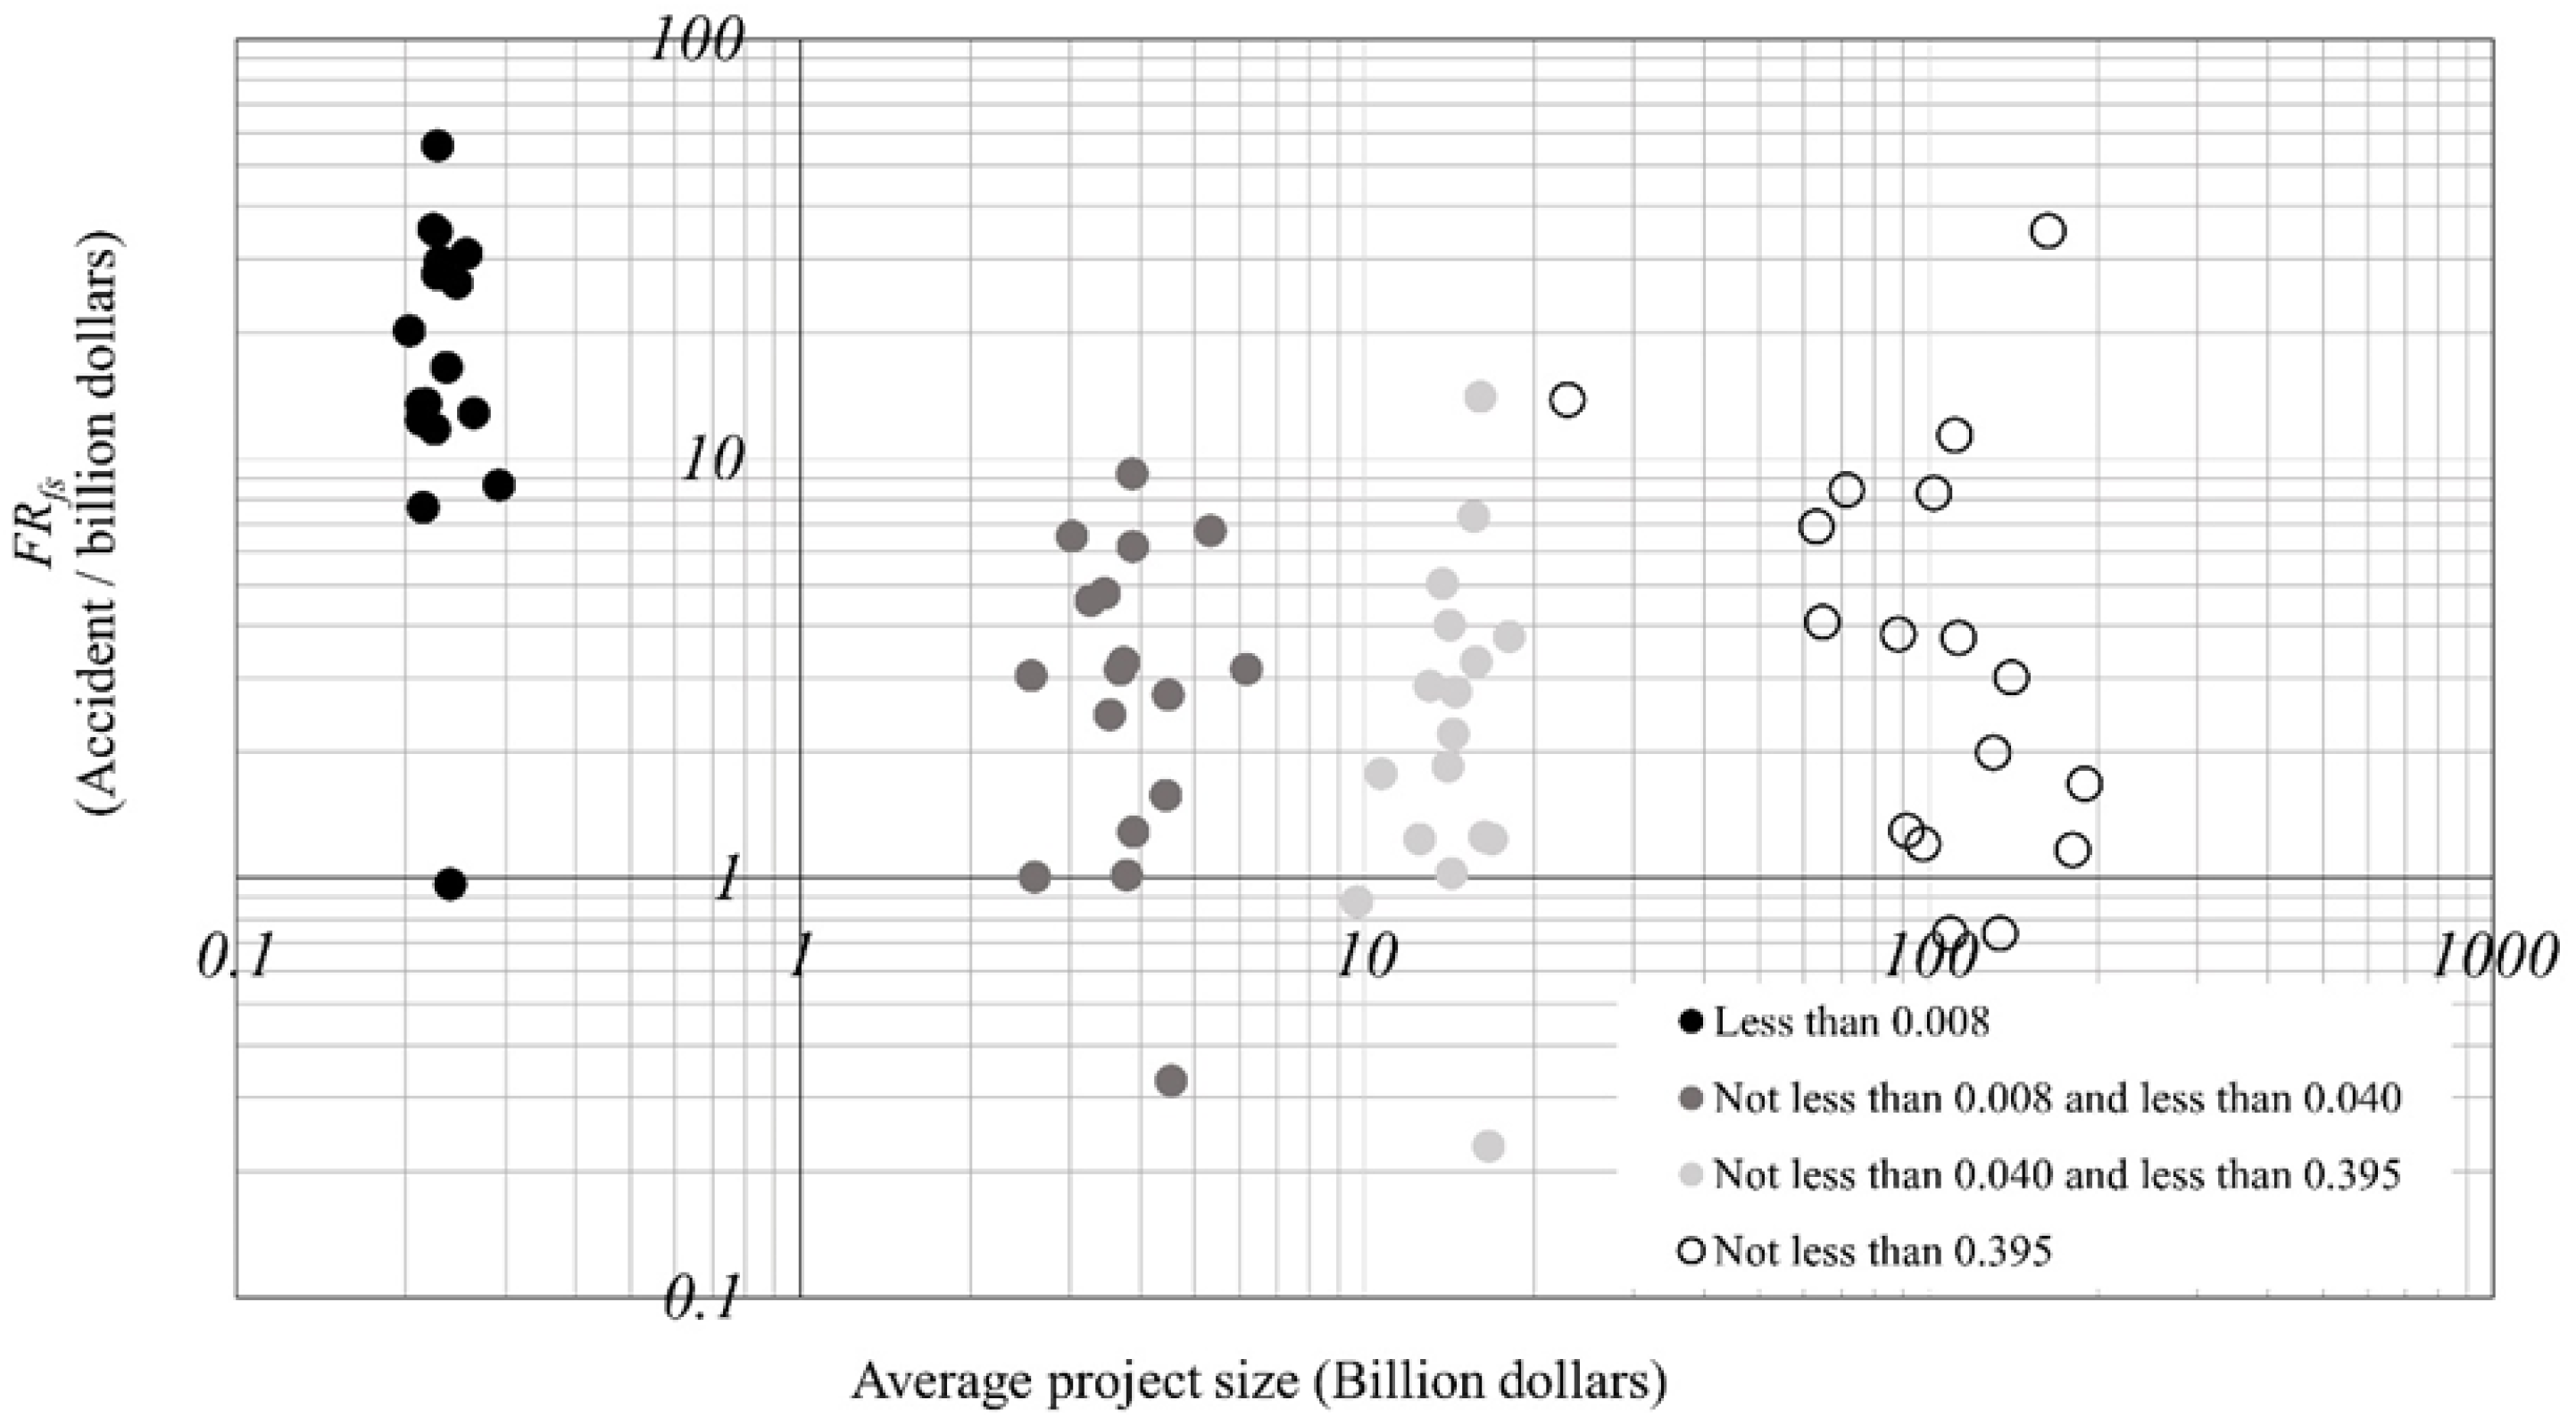
Secondly, even if the same number of accidents occurred at different sites, the level of accident occurrence cannot be said to be the same if the scale of the construction is significantly different. Therefore, the risk level was evaluated by dividing into four sizes. The average construction cost per construction differs for each facility, and to take this into account, a method of creating quadrants based on the median was used. The FRfs and average project cost distribution of the project size based on the total cost of four sections are shown using a log scale, as shown in Figure 6. According to the results, for an average construction cost of less than 0.008, the dispersion is small and they are similar, but the dispersion increases as the construction amount increases. This fatality rate uses the construction cost as the denominator. Therefore, even for facilities in the same size section, for high average construction costs, the denominator value used for the fatality rate increases, resulting in an optimistic result. Correcting this error, the deviation of the average construction cost should be considered. In the case of small-scale construction, this problem does not occur because the deviation is small, but it may occur when the deviation is large, such as with Size 4. In Figure 4, “Airports and Seaports” has a higher fatality rate than “Factory”. However, it is similar when calculating the expected number of fatal accidents considering the average construction cost. Therefore, in the case of Size 4, even if the fatality rate is lower than average, if the average construction cost is high, the need to strengthen safety management should be considered as with “Factory”.
Figure 6.
Comparison analysis using the construction cost and the FRfs.
The analysis of three facilities with high FRfs in each construction scale section is as follows.
- (1)
- The “Assembly” facility type typically includes facilities such as art museums, churches, and performance halls. For the construction of facilities such as museums, there are many long-span structures, so consideration should also be given to heavy objects and the safety evaluation of floor vibrations [25]. In the case of “Assembly” facilities, fall accidents were the main cause of fatal accidents. Therefore, safety management measures should be taken through the smooth coordination of opinions between field workers and safety managers to determine risk factors of falling accidents.
- (2)
- “Institutional” facilities typically include hospitals and prisons. In the case of hospital construction, the design is complicated and diverse owing to not only the functional elements of the building, but also the space planning of the patient-first, natural environmental building arrangement, as well as the creation of a healing environment. Therefore, it is necessary to continuously improve and manage hospital construction, where various types of work and operations are complicated, by blocking risks in advance through thorough risk factor analysis and systematic safety management activities, and by implementing appropriate countermeasures [25,26].
- (3)
- “High Hazard” refers to facilities that store hazardous substances, such as petrochemical plants. These projects have potential risks such as fire, explosion, and leakage, and require a high-level safety management system. However, there is no appropriate qualification standard, and it is conducted arbitrarily by the company. Therefore, it is necessary to institutionalize the registration standards for the design and supervision in relation to the installation of hazardous material facilities. In addition, as the chemical process becomes more complex owing to developments in the industry, there is an increased amount of risk in handling hazardous substances along with an increased uncertainty of accidents [27].
- (4)
- In the case of “Factory”, internal facilities and equipment occupy a larger proportion compared with general buildings, and the composition is complicated. In the case of the high-tech industry, the standardization and systematization of the construction information classification system for high-tech factory construction is very low. This is owing to problems such as the difficulty in classifying the scale, the variety of types of work, the complexity of construction, and security. Therefore, it is necessary to collect and analyze data on factory design [28].
- (5)
- In the case of “Water Resources”, projects are largely carried out in the form of river environment maintenance projects, flood restoration projects, and projects for flood prevention. Consequently, the rate of traffic accidents caused by large equipment such as crushed soil or concrete vehicles was higher than that of other facilities [29]. Therefore, it is necessary to secure a route to prevent soil collapse and prevent traffic accidents during construction.
- (6)
- In the case of “Landscape”, the design of the finished construction is decided prior to the construction, but the design is frequently changed owing to pressure during the construction period and the different drawing conditions of the site. For this reason, “Landscape” facilities were found to be facilities with a high-risk level owing to poor construction quality [30]. As landscaping construction involves large-scale movement of materials, it is considered that a safe working environment can be created only when there is clear communication during design changes.
- (7)
- In the case of “Complex Development”, the rate of traffic accidents is higher than that of other facilities due to the large scale of the construction, the large amount of manpower, and the use of large-scale equipment [30]. In addition, in the case of development for the establishment of an industrial complex, it is necessary to consider the presence of buried pipes and gas pipes, so it is necessary to ensure safety by addressing these specific issues in advance.
5. Conclusions
In this study, to solve the problems of current risk level management methods in the domestic construction industry, a method for calculating fatality rate by considering the facility type and the construction cost was presented. In addition, the probabilistic risk level was calculated considering facility type and construction cost in the Korean construction industry, in order to analyze the relatively dangerous facility types and project sizes based on total cost.
The results of this study are as follows. First, from calculating the fatality rate by facility type, “Assembly” was found to have the highest fatality rate at 15.05 accidents/billion dollars. Secondly, from calculating the accident and fatality rate of facilities according to construction project size, for Size one and Size two construction sites, the “Assembly” facility was found to be the facility with the highest risk level, with 55.81 accidents/billion dollars and 9.22 accidents/billion dollars. In the case of Size 3 and Size 4 construction sites, the “Water Resources” facility was 14.08 accidents/billion dollars and 35.03 accidents/billion dollars, respectively, indicating that it is a high-risk facility type. Thirdly, a graph comparing FRfs and the total project cost was presented as a way of using fatality rate results by facility type in practice, and 17 facility types were classified based on the median value to analyze risk level, including the number of established cases.
The safety cost used for safety management or the number of safety managers appointed are determined according to the size of the construction cost. However, since this does not reflect the characteristics of the construction industry, there is a high possibility that costs that do not match the required safety management level of the construction site will be allocated. Therefore, if risk is evaluated using the results of this study and safety management expenses are allocated accordingly, more effective safety management will be possible.
- (i)
- Unlike the manufacturing industry, where the number of laborers is fixed, the number of laborers in a construction site is unclear, and the appointment of a safety manager and the cost of safety management are all determined by the construction price. Therefore, for accurate numerical analysis, the cost-based probability evaluation presented in this paper is necessary.
- (ii)
- The risk level was calculated by considering the type of facility in consideration of the proportion of labor costs that vary depending on the type of construction work and the corresponding level of labor risk. As a result, in general, in small-scale construction, more safety costs should be invested in construction work, and in the case of landscape, more safety costs should be invested in large-scale construction.
- (iii)
- Since the subject of applicable laws differs depending on the scale of construction work, the risk level is evaluated by dividing into four widely used sizes to provide indicators to evaluate whether appropriate laws are being applied for each section.
The limitations of this study are as follows. In this study, fatality rate was calculated considering the facility type and the project size based on total cost, but other factors that could affect the occurrence of fatal accidents, such as unit processes, were not considered. However, it should be noted that risk levels can be derived and compared in advance using factors determined in the planning stage prior to construction.
Author Contributions
S.B.: investigation, methodology, resources, validation, visualization, writing—original draft; J.J. (Jaewook Jeong): conceptualization, supervision, project administration, writing—review and editing; J.L.: investigation, methodology, resources, validation, visualization; J.J. (Jaemin Jeong): investigation, methodology, resources, validation, visualization, methodology, formal analysis; J.S.: investigation, methodology, resources, validation, visualization, methodology, formal analysis. All authors have read and agreed to the published version of the manuscript.
Funding
This study was financially supported by Seoul National University of Science and Technology.
Institutional Review Board Statement
Not applicable.
Informed Consent Statement
Not applicable.
Data Availability Statement
Not applicable.
Conflicts of Interest
The authors declare that they have no known competing financial interests or personal relationships that could have appeared to influence the work reported in this paper.
References
- Lee, J.; Jeong, J.; Soh, J.; Jeong, J. Development of framework for estimating fatality-related losses in the Korean construction industry. Int. J. Environ. Res. Public Health 2021, 18, 8787. [Google Scholar] [CrossRef] [Scilit] [PubMed]
- A Report on Industrial Accidents in 2020; Ministry of Employment and Labor: Seoul, Republic of Korea, 2021.
- Dong, X.S.; Choi, S.D.; Borchardt, J.G.; Wang, X.; Largay, J.A. Fatal falls from roofs among US construction workers. J. Saf. Res. 2013, 44, 17–24. [Google Scholar] [CrossRef] [Scilit] [PubMed]
- Aven, T.; Zio, E. Some considerations on the treatment of uncertainties in risk assessment for practical decision making. Reliab. Eng. Syst. Saf. 2011, 96, 64–74. [Google Scholar] [CrossRef] [Scilit]
- Kim, J.H. A study on the rationalization of safety management through the analysis of accident cause and occurrence principles for safety accidents in the construction industry-focused on burial, conflagration, explosion, burn. J. Korea Inst. Build. Constr. 2010, 10, 99–111. [Google Scholar] [CrossRef] [Scilit]
- Jeong, J.; Jeong, J. Quantitative risk evaluation of fatal incidents in construction based on frequency and probability analysis. J. Manag. Eng. 2022, 38, 04021089. [Google Scholar] [CrossRef] [Scilit]
- Jang, Y.R.; Go, S.S. A risk assessment counterplan for reducing the accident rates in medium and small sized construction sites. Korean J. Constr. Eng. Manag. 2018, 19, 90–100. [Google Scholar]
- Jeong, J.; Jeong, J. Novel approach of the integrated work & risk breakdown structure for identifying the hierarchy of fatal incident in construction industry. J. Build. Eng. 2021, 41, 102406. [Google Scholar]
- Choi, S.D.; Guo, L.; Kim, J.; Xiong, S. Comparison of fatal occupational injuries in construction industry in the United States, South Korea, and China. Int. J. Ind. Ergon. 2019, 71, 64–74. [Google Scholar] [CrossRef] [Scilit]
- Pham, K.T.; Vu, D.N.; Hong, P.L.H.; Park, C. 4D-BIM-based workspace planning for temporary safety facilities in construction SMEs. Int. J. Environ. Res. Public Health 2020, 17, 3403. [Google Scholar] [CrossRef] [Scilit]
- Baloi, D.; Price, A.D. Modelling global risk factors affecting construction cost performance. Int. J. Proj. Manag. 2003, 21, 261–269. [Google Scholar] [CrossRef] [Scilit]
- Chua, D.K.; Goh, Y.M. Poisson model of construction incident occurrence. J. Constr. Eng. Manag. 2005, 131, 715–722. [Google Scholar] [CrossRef] [Scilit]
- Kim, H.M.; Woo, I.S. A study of methods on risk assessment for plant construction using FMEA (failure mode and effect analysis). J. Korean Soc. Saf. 2013, 28, 81–90. [Google Scholar] [CrossRef] [Scilit]
- Park, J.; Paek, S. Development of safety management information system for construction works, focusing on tunnel construction. J. Korean Soc. Disaster Secur. 2008, 23, 72–78. [Google Scholar]
- Park, J.K. A development on the safety management information system in building work. J. Korean Soc. Saf. 2005, 20, 71–77. [Google Scholar]
- Gurcanli; Emre, G.; Bilir, S.; Sevim, M. Activity based risk assessment and safety cost estimation for residential building construction projects. Saf. Sci. 2015, 80, 1–12. [Google Scholar] [CrossRef] [Scilit]
- Cho, Y.R.; Shin, Y.S.; Shin, J.K. Checklist development for prevention of safety accidents in form work in small and medium sized construction sites. J. Korea Inst. Build. Constr. 2017, 17, 587–594. [Google Scholar]
- Tymvios, N.; Gambatese, J.A. Perceptions about design for construction worker safety: Viewpoints from contractors, designers, and university facility owners. J. Constr. Eng. Manag. 2016, 142, 04015078. [Google Scholar] [CrossRef] [Scilit]
- Lee, K. Analysis of the adequacy of the safety manager appointment system by comparing the cost-effectiveness of disaster prevention by construction site size. J. Korea Inst. Build. Construction 2008, 24, 161–168. [Google Scholar]
- A Report on Construction Industrial Fatal Accidents on Total Project Cost from 2013 to 2019; Korean Statistical Information Service: Seoul, Republic of Korea, 2021.
- Edward, A.; Iano, J. Fundamentals of Building Construction: Materials and Methods; Wiley: Hoboken, NJ, USA, 2019. [Google Scholar]
- LABOR STANDARDS ACT; Ministry of Employment and Labor: Seoul, Republic of Korea, 2018.
- A Report on Monthly Wage of Construction Cost & Ratio of the Labor Cost to Revenue; Ministry of Employment and Labor: Seoul, Republic of Korea, 2021.
- Son, S. Evaluation of Probability of Accident Based on the Number of Workers and Construction Cost by Work Types and Effect of Safety Patrol Team Operation in Residential Construction Projects. Master’s Thesis, Seoul National University of Science and Technology, Seoul, Republic of Korea, 2022. [Google Scholar]
- Pauget, B.; Wald, A. Relational competence in complex temporary organizations: The case of a French hospital construction project network. Int. J. Proj. Manag. 2013, 31, 200–211. [Google Scholar] [CrossRef] [Scilit]
- Pyo, B.; Pang, M. A study of risk factors and safety measures in hospital construction. In Proceedings of the Korean Safety Management & Science Conference, Seoul, Republic of Korea, 21 April 2012; pp. 197–204. [Google Scholar]
- Choi, S.-H.; Kim, J.-C.; Kwon, S.-W. Establishment of WBS·CBS-based construction information classification system for efficient construction cost analysis and prediction of high-tech factories. J. Korea Contents Assoc. 2021, 21, 356–366. [Google Scholar]
- Bouafia, A.; Bougofa, M.; Rouainia, M.; Medjram, M.S. Safety risk analysis and accidents modeling of a major gasoline release in petrochemical plant. J. Fail. Anal. Prev. 2020, 20, 358–369. [Google Scholar] [CrossRef] [Scilit]
- Jang, C.-R.; Jang, M.-Y.; Song, J.-J.; Kim, H.-T. A Study on the Re-establishment of the River Construction Work Breakdown Structure and the Computerization Measures of the Completion Results for the Development of the River Construction Management System. J. Korea Acad.-Ind. Coop. Soc. 2021, 22, 663–672. [Google Scholar]
- Park, J.Y.; Jo, S.-H. Expert perception analysis on the feasibility of planting design change in private enterprise landscaping construction. J. Korean Inst. Landsc. Archit. 2014, 42, 101–110. [Google Scholar] [CrossRef] [Scilit]

Disclaimer/Publisher’s Note: The statements, opinions and data contained in all publications are solely those of the individual author(s) and contributor(s) and not of MDPI and/or the editor(s). MDPI and/or the editor(s) disclaim responsibility for any injury to people or property resulting from any ideas, methods, instructions or products referred to in the content. |
© 2023 by the authors. Licensee MDPI, Basel, Switzerland. This article is an open access article distributed under the terms and conditions of the Creative Commons Attribution (CC BY) license (https://creativecommons.org/licenses/by/4.0/).