Article

Predicting Online Complaining Behavior in the Hospitality Industry: Application of Big Data Analytics to Online Reviews

1
Department of Tourism Innovation Management, Faculty of Business Administration and Accountancy, Khon Kaen University, Khon Kaen 40000, Thailand
2
Department of Hotel and Restaurant Management, National Pingtung University of Science and Technology, Pingtung 912, Taiwan
3
Department of Business Administration, National Pingtung University of Science and Technology, Pingtung 912, Taiwan
4
Department of Hospitality Management, School of Tourism, Ming Chuan University, Taoyuan City 333, Taiwan
*
Authors to whom correspondence should be addressed.
Sustainability 2022, 14(3), 1800; https://doi.org/10.3390/su14031800
Submission received: 11 January 2022 / Revised: 30 January 2022 / Accepted: 31 January 2022 / Published: 4 February 2022
(This article belongs to the Special Issue Big Data and Sustainability in the Tourism Industry)

Abstract

:
Purpose: This study aims to enrich the published literature on hospitality and tourism by applying big data analytics and data mining algorithms to predict travelers’ online complaint attributions to significantly different hotel classes (i.e., higher star-rating and lower star-rating). Design/methodology/approach: First, 1992 valid online complaints were manually obtained from over 350 hotels located in the UK. The textual data were converted into structured data by utilizing content analysis. Ten complaint attributes and 52 items were identified. Second, a two-step analysis approach was applied via data-mining algorithms. For this study, sensitivity analysis was conducted to identify the most important online complaint attributes, then decision tree models (i.e., the CHAID algorithm) were implemented to discover potential relationships that might exist between complaint attributes in the online complaining behavior of guests from different hotel classes. Findings: Sensitivity analysis revealed that Hotel Size is the most important online complaint attribute, while Service Encounter and Room Space emerged as the second and third most important factors in each of the four decision tree models. The CHAID analysis findings also revealed that guests at higher-star-rating hotels are most likely to leave online complaints about (i) Service Encounter, when staying at large hotels; (ii) Value for Money and Service Encounter, when staying at medium-sized hotels; (iii) Room Space and Service Encounter, when staying at small hotels. Additionally, the guests of lower-star-rating hotels are most likely to write online complaints about Cleanliness, but not Value for Money, Room Space, or Service Encounter, and to stay at small hotels. Practical implications: By utilizing new data-mining algorithms, more profound findings can be discovered and utilized to reinforce the strengths of hotel operations to meet the expectations and needs of their target guests. Originality/value: The study’s main contribution lies in the utilization of data-mining algorithms to predict online complaining behavior between different classes of hotel guests.

1. Introduction

Travelers today increasingly book their holiday accommodation online. An increase in the preference for online booking has coincided with an increase in the power and persuasiveness of online peer reviews [1,2,3,4]. Customers consider peer reviews more independent and trustworthy and tend to rely on them more than information provided by business entities [5]. With the rapid growth of online communication platforms and the explosion of the bidirectional exchange of information on consumer products and services, online reviews, notifications, opinions, and recommendations have become a source of real opportunities and challenges in the tourism and hospitality industry [6]. In other words, consumers consider the content of online reviews more useful than recommendations from other online information sources [7]. Online reviews are particularly influential in the tourism sector and the hotel industry [8].
Shifting through the vast number of easily accessible online recommendations, and deciding which ones to trust, represents one of the most challenging tasks for customers when choosing a hotel or restaurant. Customers tend to select a subset of reviews to reduce the set of possible alternatives. When reading online reviews, customers evaluate the overall rating at 66%, review valence (whether it is positive or negative) at 63%, review detail at 62%, and reviewer’s status at 40% as being the top four factors for consideration [9]. In terms of review valence (positive and negative), consumers more easily credit negative than positive information, according to the theory of negative effects; thus, negative information can have a stronger influence on purchase decisions [10]. Additionally, online reviews have the power to procure 30 times more consumer commitments [11].
An interconnected world facilitates the spread of guests’ dissatisfaction through online rather than face-to-face means. Understanding guests’ (dis)satisfaction should reveal the main causes of guests’ complaints. To do so, it is vital to discriminate among customers’ preferences according to guest categories at the level of individual hotel attributes [12]. Discussing the differences between guests’ preferences at higher-star-rating and lower-star-rating hotels, [12] Liu et al. (2017) remarked that some hotels with fewer stars can outperform hotels that have more stars, with regard to guests’ ratings. In terms of customer complaints, [13] Hu, Zhang, Gao, & Bose (2019) found that facility problems or cleanliness are the major sources of guests’ dissatisfaction for lower-star-rating hotels, while service-related problems and overpricing are the major sources of guests’ complaints about higher-star-rating hotels. Therefore, it is very important for hoteliers to obtain an in-depth understanding of how different hotel-class guests focus on different hotel attributes. Analyzing real-world data (i.e., complaint reviews) through decision tree (DT) algorithms allows researchers to discover significant empirical and practical information. This study follows the emerging style of research that takes advantage of user-generated data by looking at complaint reviews and attempting to understand online complaining behavior (OCB), as it differs between guests at higher star-rated and lower star-rated hotels. Furthermore, this research aims to predict travelers’ online complaining behavior in different hotel sectors.
Machine learning algorithms have been successfully applied to many topics including engineering [14], firm performance [15], complaints management [16], shopping preferences [17], customer complaints in the mobile telecom industry [18], health insurance [19], drought monitoring [20], review helpfulness [21], traffic sign comprehension [22], ionogram identification [23], handling stakeholder conflict [24], medical diagnosis [25], a design for a circular economy [26] and web mining, document analysis, and scientific data analysis [27]. However, regarding the prediction of guest OCB in the hotel industry, there is far less discussion; therefore, this research attempts to extend and amplify the tourism and hospitality literature by using machine learning algorithm analysis.
These specific data-mining algorithms (DMAs) have not been broadly implemented to explore hotel-rating guest complaint behavior in the online environment. Big data analytics permits us to explore guest OCB from different kinds of hotels in depth, particularly in the hotel performance context. Specifically, the main purposes of this study are:
  • To explore the literature related to big data analytics and data mining with regard to the fields of hospitality and tourism;
  • To investigate the best performance model in predicting OCB in the fields of hospitality and tourism;
  • To predict the complaint attributions that significantly differ, from various hotel classes (i.e., higher star-rating and lower star-rating) of travelers in terms of their OCB.
A total of 1992 valid individual online complaints from over 350 hotels, located in the United Kingdom (UK) and considered representative in their category, were fed into data-mining algorithms. First, to convert unstructured textual content into structured data, qualitative content analysis was conducted. This process generated the analytical variables of the new qualification algorithms. Ten complaint attributes and 52 specific items were identified. Then, to further the aims of this study, two kinds of algorithms, a sensitivity algorithm and DT (i.e., the CHAID Algorithm), were linked together. The study objectives were three-fold. First, this research attempted to evaluate the performance of prediction models by employing different classification models (e.g., C&R tree, QUEST, CHAID, and C5.0). CHAID showed the best performance in predicting guest OCB; therefore, CHAID was employed in this study experiment. Then, sensitivity analysis was performed to identify the most important online complaining attributes. Finally, the CHAID procedure, illustrated as a decision tree, was utilized to actualize this analysis in the case of the complaint attributions significantly differing across various hotel classes. The analyses of this mix of qualitative content analysis and quantitative algorithms reinforced the process of data triangulation.
The study’s main contribution lies in the utilization of DMAs to predict the OCB between different classes of hotel guests. Additionally, this study seems to constitute one of the first attempts in the literature to relate big data analytics and data mining to the field of hospitality and the tourism industry; other work has been limited to only a handful of prior studies [16,17,18,21]. The results of this study should benefit both researchers and practitioners since determining the guests’ complaint behavior using real-world data (i.e., negative reviews) can help prevent further complaints and improve a business’s reputation. Thus, the identification of factors (i.e., online complaint attributes) that can accurately predict the guests’ OCB is of great interest.

2. Theoretical Background and Research Scope

2.1. Online Review and Complaining Behavior in the Hospitality Industry

According to a 2011 survey by the Tourism Industry Wire Organization, 60% of U.S. travelers take online suggestions into account when booking a vacation in part. One main reason behind this is that travel websites provide a means for customers to readily discover what other consumers think about hotels and restaurants, as well as other tourism products or services (as cited in [7,28]). Previous studies have argued that compared to positive reviews, customers give more weight to negative reviews in both reputation-building and decision-making tasks [6,10,29,30,31]. Customer complaints behavior is most often considered to be a set of multiple responses emerging as a result of purchase dissatisfaction [32,33]. However, the “locus of causality” or complaint attribution is one of the least-studied topics within customer complaint behavior-related research in the hospitality and tourism industries [34]. Practitioners will benefit from understanding these causes of guests’ complaints in terms of problem-solving, guest satisfaction enhancement, and service quality improvement [35,36].
Furthermore, negative reviews or comments may lead to a negative impact on all aspects of the business [37]. For instance, guests complain about their hotels on issues ranging from poor service delivery to dated or inadequate décor [31]. Fernandes and Fernandes (2018) reported that hotel guests tend to complain more than once. This indicates that chains of complaints do occur in the hospitality industry. An unsatisfied customer often makes a series of complaints. This study aims to investigate how an online review negatively impacts consumer behavior so that hoteliers can improve service quality, referencing a complaint route through electronic word-of-mouth (eWOM).

2.2. Big Data

Big data analytics, as a research paradigm, uses a variety of data sources to make inferences and predictions about reality [38]. Textual data or content from the web offers a huge shared cognitive and cultural context, and advanced language processing and machine learning capabilities have been applied to this web data to analyze various domains [39]. Big data analytics is defined as “the extraction of hidden insight about consumer behavior from big data and the exploitation of that insight through advantageous interpretations” [40], p. 897. The immensity of data generated, its relentless rapidity, and diverse richness are all transforming marketing decision-making [40]. The aforementioned dimensions help define big data via three distinctive features: volume, velocity, variety [40,41], and two additional essential characteristics when collecting, analyzing, and extracting insights from big data: veracity and value [40]. Volume refers to the quantity of data, velocity describes the speed of data processing, and variety means the type of data [41]. Meanwhile, veracity refers to data quality (e.g., accuracy), and value describes clean, useful data that excludes or eliminates unimportant and irrelevant data [40]. By utilizing big data analytics as research methodology, researchers are able to work backward, starting with data collection, then analyzing it in order to gain insights. Despite the advantages and potential of big data analytics, very few recently published studies apply this approach to the tourism and hospitality industry [41]. This study will try to fill that gap.

2.3. Data Mining

Recently, some researchers have been utilizing data mining (DM) procedures in conducting their studies on the tourism and hospitality industry. For instance, [42] Golmohammadi, Jahandideh, and O’Gorman (2012) studied the application of DM, specifically using DT to model tourists’ behavior in the online environment. DM has also been studied in terms of its importance and influence in the hotel marketing field, and how this approach can help companies to reach their potential customers by understanding their behavior [43]. Thus, DM techniques that focus on an analysis of the textual contents from travelers’ reviews/feedback have been used in a number of published papers [43]. With the help of a DM approach, hoteliers can receive invaluable information that enables them to gain better insight regarding customer behavior and to develop effective customer retention strategies [42].
While data retrieved from customer feedback is usually unstructured textual data, most DM approaches deal only with structured data. Retrieved data is often voluminous but of low value and has little direct usefulness in its raw form. It is the hidden information in the data that has value [44,45]. Retrieved data must be reorganized and stored according to clear field structures before DM can be carried out efficiently and accurately [46]. Using different techniques, DM can identify nuggets of information in bodies of data. It extracts information that can be used in areas such as decision support, prediction, forecasts, and estimation. Few researchers have studied new artificial intelligence (AI) algorithms and mining techniques for unstructured data and information, however, resulting in the frequent loss of valuable customer-related information [46]. DM’s advantage lies in combining researcher knowledge (or expertise) of the data with advanced, active analysis techniques in which algorithms identify the underlying relationships and features in the data.
The process of DM generates models from historical data that are later used for predictions, pattern detection, and more. DM techniques offer feasible methods by which to detect causal relationships, specify which variables have significant dependence on the problem of interest, and expand models that forecast the future [20]. DM can be classified into three types of modeling methods: (i) classification, (ii) association, and (iii) segmentation [47]. In some contexts, DM can be termed as knowledge discovery in databases (KDD) since “it generates hidden and interesting patterns, and it also comprises the amalgamation of methodologies from various disciplines, such as statistics, neural networks, database technology, machine learning and information retrieval, etc.” [48], p. 645. This study furthers its aims by applying DT algorithms. The following sub-sections briefly review the main components of the proposed method.

2.4. Decision Tree

DT is one of the most popular DM techniques. With the objective of building classification models, DT can predict the value of a target attribute, based on the input attributes [22]. DT constructs a tree structure using three components: internal nodes, branches, and leaves [21]. Each internal node denotes one input variable [22], each branch is set to equal a number of possible values of the input variable [49], and each leaf node is the terminal node that holds a class label [23] or a value of a target attribute [22]. In DT, the influential factors in determining the value of the target attribute are the primary splitters that are connected with the leaf nodes [22]. Due to DT’s many advantages—for instance, it is easy to understand and interpret, needs little data preparation, can handle both numerical and categorical data, performs very well with a large dataset in a short time, and, most importantly, can create excellent visualizations of results and their relationships—DT has become increasingly prevalent in DM [15]. There are many specific DT algorithms; however, the C5.0, C&R tree, QUEST, and CHAID algorithms are the most widely used.

2.4.1. C5.0 Algorithm

Developed by Quinlan in 1993, C5.0 is one of the most popular DT inducers, based on the ID3 (iterative dichotomiser 3) classification algorithm [19]. The C5.0 model splits the sample based on the field that provides the maximum information gain at each level [47]. The input can be either categorical or continuous, but the output or target field must be categorical. C5.0 is significantly faster, has superior memory performance than other DT algorithms, and can also produce more accurate rules [14]. It also uses a pruning strategy (e.g., pre-pruning and post-pruning methods) in which a branch is pruned to establish a DT, starting from the top level of the tree [15,19].

2.4.2. CHAID Algorithm

The chi-squared automatic interaction detector (CHAID) is “a powerful technique for partitioning data into more homogeneous groups” [50], p. 125. CHAID is a highly efficient statistical technique for segmentation, or tree growing, developed by Kass in 1980 [51]. CHAID makes predictions in the same way for regression analysis and classification, as well as detecting interactions between variables [15]. CHAID uses multi-level splits [52], which can generate nonbinary trees, meaning that some trees have more than two branches [47]. It works for every type of variable due to its acceptance of both case weights and frequency variables [51]. More importantly, CHAID handles missing values by treating them all as a single valid category.

2.4.3. QUEST Algorithm

The quick, unbiased, efficient statistical tree algorithm (QUEST) is a relatively new binary tree-growing algorithm for classification and DM [51]. QUEST is similar to the classification and regression trees (C&RT) algorithm [15]; however, it is designed to reduce the processing time required for large C&RT analyses, while also reducing the tendency found in classification tree methods to favor inputs that allow more splits [47]. QUEST deals with field selection and split-point selection separately. The univariate split in QUEST performs unbiased field selections; that is, all predictor fields are equally informative with respect to the target field. QUEST selects any of the predictor fields with equal probability [51]. It produces unmanageable trees, but by applying automatic cost-complexity pruning, it minimizes their size [15]. Input fields in QUEST can be numeric ranges (when continuous), but the target field must be categorical, and all splits are binary [47].

2.4.4. C&RT Algorithm

The C&RT algorithm splits the tree on a binary level into only two subgroups [52] and generates a DT that allows researchers to predict or classify future observations [47]. The C&RT algorithm was created by Breiman, Friedman, Olshen, and Stone in 1984 [53]. The method uses recursive partitioning: the data is partitioned into two subsets so that the records within each subset are more homogeneous than in the previous subset. Then, each of those two subsets is split again, and the process repeats until the homogeneity criterion is reached or until some other stopping criterion is satisfied (or considered “pure”) [54]. The same predictor field may be used many times at different levels in the tree. The most essential aim of splitting is to determine the right variable associated with the right threshold to maximize the homogeneity of the sample subgroups [15]. C&RT uses surrogate splitting to make the best use of data with missing values [51]. In the C&RT model, target and input fields can be numeric ranges or categorical (nominal, ordinal, or flags) [47]. C&RT allows unequal misclassification costs to be considered in the tree-growing process and allows researchers to specify the prior probability distribution in a classification problem. Applying automatic cost-complexity pruning to a C&RT tree yields a more generalizable tree [15,51]. Figure 1 illustrates the research framework.

3. Materials and Methods

3.1. Data Preparation and Processing

3.1.1. Step 1: Data Collection and Sample Characteristics

A total of more than 350 hotels, ranked from 2 to 5 stars, based on the British hotel rating system, were randomly selected from a population of 1086 listed on TripAdvisor’s site for the London tourist market in the UK [55]. This study restricted the subject hotels to those with more than 200 reviews, to avoid source credibility bias while maintaining sample size. To ensure efficiency and proper representation of complaint data, a maximum of 20 of the most recently posted reviews, with details of the complaints about each hotel, were manually extracted for analysis. All the reviews had an Overall rating of 1 or 2 stars since they were designated as complaints in TripAdvisor [56]. A total of 2020 online complaints were obtained for this study; of these, 28 samples were omitted from the dataset because hotel-size-related information did not meet the necessary criteria. Thus, 1992 valid complaint reviews were analyzed. These complaints were classified into higher-star-rating and lower-star-rating hotels (Table 1).

3.1.2. Step 2: Coding of Online Complaining Attributes

First, each online complaint was obtained manually from each hotel website and stored in a .doc file for textual data, and a .xls file for numerical data. The unstructured textual data needed to be transformed into meaningful knowledge via a decoding mechanism [57]. Therefore, qualitative content analysis was applied to convert unstructured textual content into structured data [46]. Second, coding categories were developed to conduct the manual coding content analysis of texts. Two independent coders added, removed, or merged the coding items and variables to avoid overlapping themes and reduce content ambiguity. Then, the coding subjects were independently categorized into various complaint attributes and items. This study’s researchers assigned codes manually in order to capture the idiosyncrasies of the reviews and account for nuances [58]. Reviews often contributed to more than one attribute and/or item. Attributes and items that were not mentioned in the reviews were coded as NO. Finally, another categorical data file was created for testing algorithm models by utilizing the above coding attributes. In total, this study identified 10 complaint attributes. All the attributes were then exported as reports in an .xls data format for later use in DT analyses. Table 2 depicts the description of complaint variables and examples of coding details.

3.1.3. Step 3: Coding Reliability Testing

Lombard, Snyder-Duch, and Bracken (2002) [59] and Gerdt et al. (2019) [58] suggest that acceptable coding results require two independent coders. This study followed Cenni and Goethals’s (2017) two-step inter-code reliability test [60]. The inter-coder reliability was determined utilizing the percentage of agreement (from 0.00—no agreement, to 1.00—perfect agreement). Two inter-code reliability tests were conducted: the first after coding 5% of the full set of coded reviews, and the second, after coding another 10%. Both coding grids were >90% in agreement, which was judged acceptable (Table 3).

3.2. Modeling of Decision Tree Algorithms

In this step, DT algorithms were used to examine the best-performing classification models among those that were employed: CHAID, CR&T, C5.0, and QUEST. These algorithms were tested according to the output variable (with Hotel Class as a dependent variable) and with a total of 11 inputs (Hotel Size, Room Issues, Hotel Facility, Cleanliness, Service Encounter, Location Accessibility, Value for Money, Safety, Miscellaneous Issues, Room Space, and F & B Issue as independent variables) by using holdout samples. The target output dependent variable, which represents the OCAs of different hotel-class guests, was incorporated into the models as a binary variable. The central tendency measure (median) values were adopted from [15] and Delen et al. (2013), with Hotel Class as a split criterion: the class with a performance score above the median value was rated as higher star-rating while the class with a performance score below the median value was rated as lower star-rating. As such, the binary variables as a performance measure of each hotel were identified as either higher star-rating or lower star-rating.
The performances of models used in binary (two-groups) are provided in a confusion matrix (Table 4) that shows the correctly and incorrectly classified instances for each case [15,22]. To evaluate model performance, this study employed the well-known performance measures of overall accuracy (AC), precision, the area under the ROC curve (AUC), recall, specificity, and F-measure, as adopted from [15,21,22].
Overall Accuracy (AC): the percentage of the correctly classified instances; also defined as being the ratio of correctly predicted cases to the total number of cases [15,22] is calculated as follows:
A c c u r a c y = T P + T N T P + F P + F N + T N
Precision: the ratio of the number of true positives (correctly predicted cases) to the sum of the true positives and false positives [15,21] is calculated as follows:
P r e c i s o n = T P T P + F P
Recall/Sensitivity/True Positive Rate: the ratio of the number of true positives to the sum of the true positives and the false negatives [15,21] is calculated as follows:
R e c a l l = T P T P + F N
Specificity/True Negative Rate: shows the ratio of the number of true negatives to the sum of the true negatives and false positives [15,22] is calculated as follows:
S p e c i f i c i t y = T N T N + F P
F-measure: the measure of the precision-recall curve that takes the harmonic mean of the precision and recall performance measures [21,22]. A high F-measure value demonstrates a high classification quality [21]:
F m e a s u r e = 2 × P r e c i s o n × R e c a l l P r e c i s i o n + R e c a l l
Area Under Curve (AUC): a plot of the true positive rate (e.g., recall) against the false positive rate at various threshold settings [22]; for example, “Excellent” if AUC ≥ 0.9; “Good” if 0.9 > AUC ≥ 0.8; “Fair” if 0.8 > AUC ≥ 0.7; “Poor” if 0.7 > AUC ≥ 0.6; and “Very Poor” if AUC < 0.6 [21].
Finally, to determine how well the models predict the real-world findings, this study held back a subset of records for testing and validation purposes. The original data were partitioned at a ratio of 7:3; 70% of the data (training set) was used for training to generate the model, and 30% of the data (testing set) was used to test or verify the tree’s classification accuracy. To test classification models, IBM SPSS Modeler Version 18 was utilized. Figure 2 presents a comparison of the different models in the DT algorithm analyses.
Figure 3 summarizes the study’s qualitative content and quantitative algorithm analysis research process.

4. Empirical Results

4.1. Model Evaluations

Table 5 shows the evaluation results for both training and testing datasets using different classification techniques. With regard to the overall accuracy, the CHAID and C&RT models demonstrated the highest performance level (71.41%), while C5.0 had the second-highest performance measurement (71.04%). CHAID and C&RT significantly outperformed in terms of specificity (70.58%) and F-measure (76.10%) performance measurements. However, C5.0 delivered high performance in terms of sensitivity measurement (71.98%). CHAID also significantly outperformed in terms of AUC (75.40%), closely followed by C5.0 (72.40%). Overall, CHAID yielded the best prediction performance for most features, followed by C&RT, C5.0, and GUEST. Therefore, CHAID performs the best in predicting OCB. To achieve better prediction performance, this study only utilizes CHAID in the following experiment.
Table 6 contains confusion (coincidence) matrices for each DT model. Prediction per-class accuracy for the higher-star-rating hotels was significantly higher than the prediction accuracy for the lower-star-rating hotels in the four DT models. The coincidence matrix showed that all the DT models predicted the higher-star-rating hotel results with better than approximately 80% accuracy, while the CHAID, C&RT, C5.0, and QUEST models predicted the lower-star-rating results with almost 60%, 61% and 58% accuracy, respectively (Table 6).
To graphically represent the performance measures, a gain chart—which displays the proportion of total hits that occur in each quantile, computed as (number of hits in quantile/ total number of hits) × 100%—has been constructed [15]. Cumulative gain charts always start at 0% and end at 100%. In a good model, a gain chart will rise steeply toward 100% and then level off from left to right [61]. In this experiment (with Hotel Class as the output variable), CHAID represents very good performance in many quantiles, while GUEST resulted in the second-best performance (see Figure 4).

4.2. Attribute Assessment (Sensitivity Analysis)

To further analyze the influences of OCAs using DT models, complaint variables were ranked in order of importance (Table 7). The variable, or predictor, importance, as measured by sensitivity analysis, attempts to establish the relative importance of the independent variables, as related to the output variables [51]. Predictor importance focuses on the predictor fields that matter most and considers eliminating or ignoring those that matter least [54]. This method assesses the value of input attributes by measuring the information gained with respect to the target or output attribute [22]. While predictor importance indicates the relative value of each predictor (output) in estimating the model, it does not relate to model accuracy. That is, it merely suggests the importance of each predictor in making a prediction, not whether that prediction is accurate [54]. The higher the information gain, the more impact an attribute has on predicting different Hotel Class guests’ OCB. Although the ranking illustrates that nine OCAs are involved in the DT construction process, the Hotel Size, Service Encounter, Room Space, Value for Money, and Cleanliness attributes are the five most important variables. Due to pre-pruning, not all nine variables are involved in the construction of DT models [14]. For all OCAs, Hotel Size has the highest impact or importance, while the next most influential attributes are Service Encounter, Room Space, Value for Money, and Cleanliness, respectively, the leading variables for Hotel Class. Table 7 presents the relative importance of the output variables from the highest (most important) to the lowest (least important) regarding Hotel Class.

4.3. Online Complaining Behavior for Different Hotel Classes

This study utilized CHAID since it outperformed the other four classification models. The target variable was Hotel Class (divided into higher star-rating and lower star-rating) while the input variables were the online complaining-related attributes. Both target and input variables were categorical measurements, with two or more categorical levels. The stopping rules for CHAID were: a maximum tree depth of 5, 2% minimum records in a parent branch and 1% in a child branch, and a significance level for splitting and merging of 0.05 (adjusting significant value using the Bonferroni method). The chi-square value for the categorical target was set to the Pearson correlation coefficient. Figure 5 details the CHIAD algorithm procedures.
Figure 6a,b represents the results of the CHIAD procedure. The five descriptors splitting nodes were: Hotel Size, Service Encounter, Cleanliness, Value for Money, and Room Space. Among the hotel guests (n = 1992), 57.63% made online complaints regarding higher-star-rating hotels, whereas 42.37% of them left online complaints about lower-star-rating hotels.
The first splitting node complaining attribute was Hotel Size (x2 = 279.20, d.f. = 2, p = 0.000). In Node 1, 81.73% of higher-star-rating hotel guests who made online complaints stayed at large hotels, whereas only 18.27% of lower-star-rating hotel guests did so. Similarly, in Node 2, 73.70% of the higher-star-rating hotel customers who left online complaints stayed at medium-sized hotels, but only around 26% from lower-star-rating hotel guests did so. Conversely, 61.42% of lower-star-rating hotel guests who made online complaints stayed at small hotels, while around 38.58% of higher-star-rating hotel customers did so. Thus, on average, approximately 78% of higher star-rating hotel guests staying at medium and large-sized hotels are more likely to leave online complaints, while around 61% of lower star-rating hotel guests staying at small-sized hotels leave complaints.
The second pruning of Node 1 was based on the complaining attribute Service Encounter (x2 = 10.97, d.f. = 1, p = 0.001). Node 1 diverged into Node 4 and Node 5. In Node 5, 88.89% of guests complaining online about a Service Encounter were from higher-star-rating hotels, while only 11.11% were from lower-star-rating hotel guests. Thus, guests from higher-star-rating hotels are most likely to leave online complaints about Service Encounter and stay at large hotels.
Node 2’s (n = 608) second split, based on Service Encounter (x2 = 19.32, d.f. = 1, p = 0.000), diverged into Node 6 (n = 385) and Node 7 (n = 440). In Node 7, about 80% of higher-star-rating hotel guests left online complaints about Service Encounter, but around 20% of complaints were left by lower-star-rating hotel guests. Node 7 diverged into Node 12 and 13, Value for Money (x2 = 3.97, d.f. = 1, p = 0.046). In Node 13, approximately 90% of higher-star-rating hotel guests complained about Value for Money, but around 10% came from lower-star-rating hotel. Thus, guests of higher-star-rating hotels who are most likely to complain online about Value for Money also complain about Service Encounters and stay at medium-sized hotels.
The last pruning tree of Node 3 was Service Encounter (x2 = 31.95, d.f. = 1, p = 0.000). Node 3 was split into Node 8 and 9. In Node 9, 50.43% of higher-star-rating hotel guests complained about Service Encounters during their stay, while about 49.57% of lower-star-rating hotel guests did. Node 9 was further split into Node 16 and 17, Room Space (x2 = 10.85, d.f. = 1, p = 0.001). In Node 17, approximately 73.33% of higher-star-rating hotel guests left online complaints, but about 26.67% of the complaints came from lower-star-rating hotels. To summarize, the guests of higher-star-rating hotels are more likely to complain about Room Space also complain about Service Encounters and stay at small hotels. Additionally, the guests of lower star-rating hotels are most likely to leave online complaints about Cleanliness, but not about Value for Money, Room Space, or Service Encounter, and stay at small-sized hotels (see Node 19 and Node 25). Details of each node refer to Figures S1–S4.
The confusion matrixes and risk charts for this tree are depicted in Table 8. The risk estimate provided a quick evaluation of how well the model works [61]. The lower the estimate, the more precisely classified the model [17]. The error rate or risk estimate is 0.2931. This means that the risk of misclassifying a guest complaint is approximately 29.31%. That is, the preciseness of the model’s classifying guest complaints accurately on split nodes was 70.69%.

5. Discussion and Practical Implications

Through manual qualitative content analysis, this study identified 10 complaint variables and 52 complaint items as the initial basis for guests’ complaints. This kind of detailed parsing-out of characteristic variables provides hoteliers with a more precise understanding of customer dissatisfaction. Understanding the causes of customer complaints is critical for hotels to improve their service quality, customer satisfaction, and revenue [13]. Uncovering these insights empowers hotel managers to establish appropriate responses or strategies to handle customers’ complaints. Consequently, guest complaint management should become more effective, as the values and priorities of different customers are proposed [46] and various strategies for managing customer complaints are drawn up.
Regarding DT algorithms, this study employed four popular prediction models (i.e., CHAID, C&RT, C5.0 and GUEST) and compared them, utilizing several well-known performance measurements. CHAID performed the best in predicting OCB (in terms of several performance measurements, including accuracy, specificity, F-measure, and AUC), followed by C&RT, C5.0, and GUEST. This is consistent with earlier research indicating that CHAID performed better than other models in predicting overall hypertension [19] and firm performance [15]. Additionally, after developing the prediction models, this study determined the ranked importance of OCAs, utilizing sensitivity analysis on the four types of DT models. The predictor importance measures were then fused and illustrated in a tabular format (Table 7). The results retrieved, using Hotel Class as a dependent variable, indicated that the most important OCAs are Hotel Size, Service Encounter, Room Space, Value for Money, and Cleanliness, respectively. These variables had the highest impact in predicting guests’ OCB from different hotel classes. It is noteworthy that Hotel Size was the most important attribute; Service Encounter and Room Space attributes emerged as the second and third most important factors in each of the four DT models. Surprisingly, Safety and F&B Issue complaint attributes did not contribute to any important variables, indicating that these complaint attributes are not particularly helpful in predicting guests’ OCB from different hotel classes.
From the CHAID results, five descriptor-splitting nodes were discovered. The first splitting OCA was Hotel Size, followed by Service Encounter, Cleanliness, Value for Money, and Room Space, respectively. The study also found that:
(i)
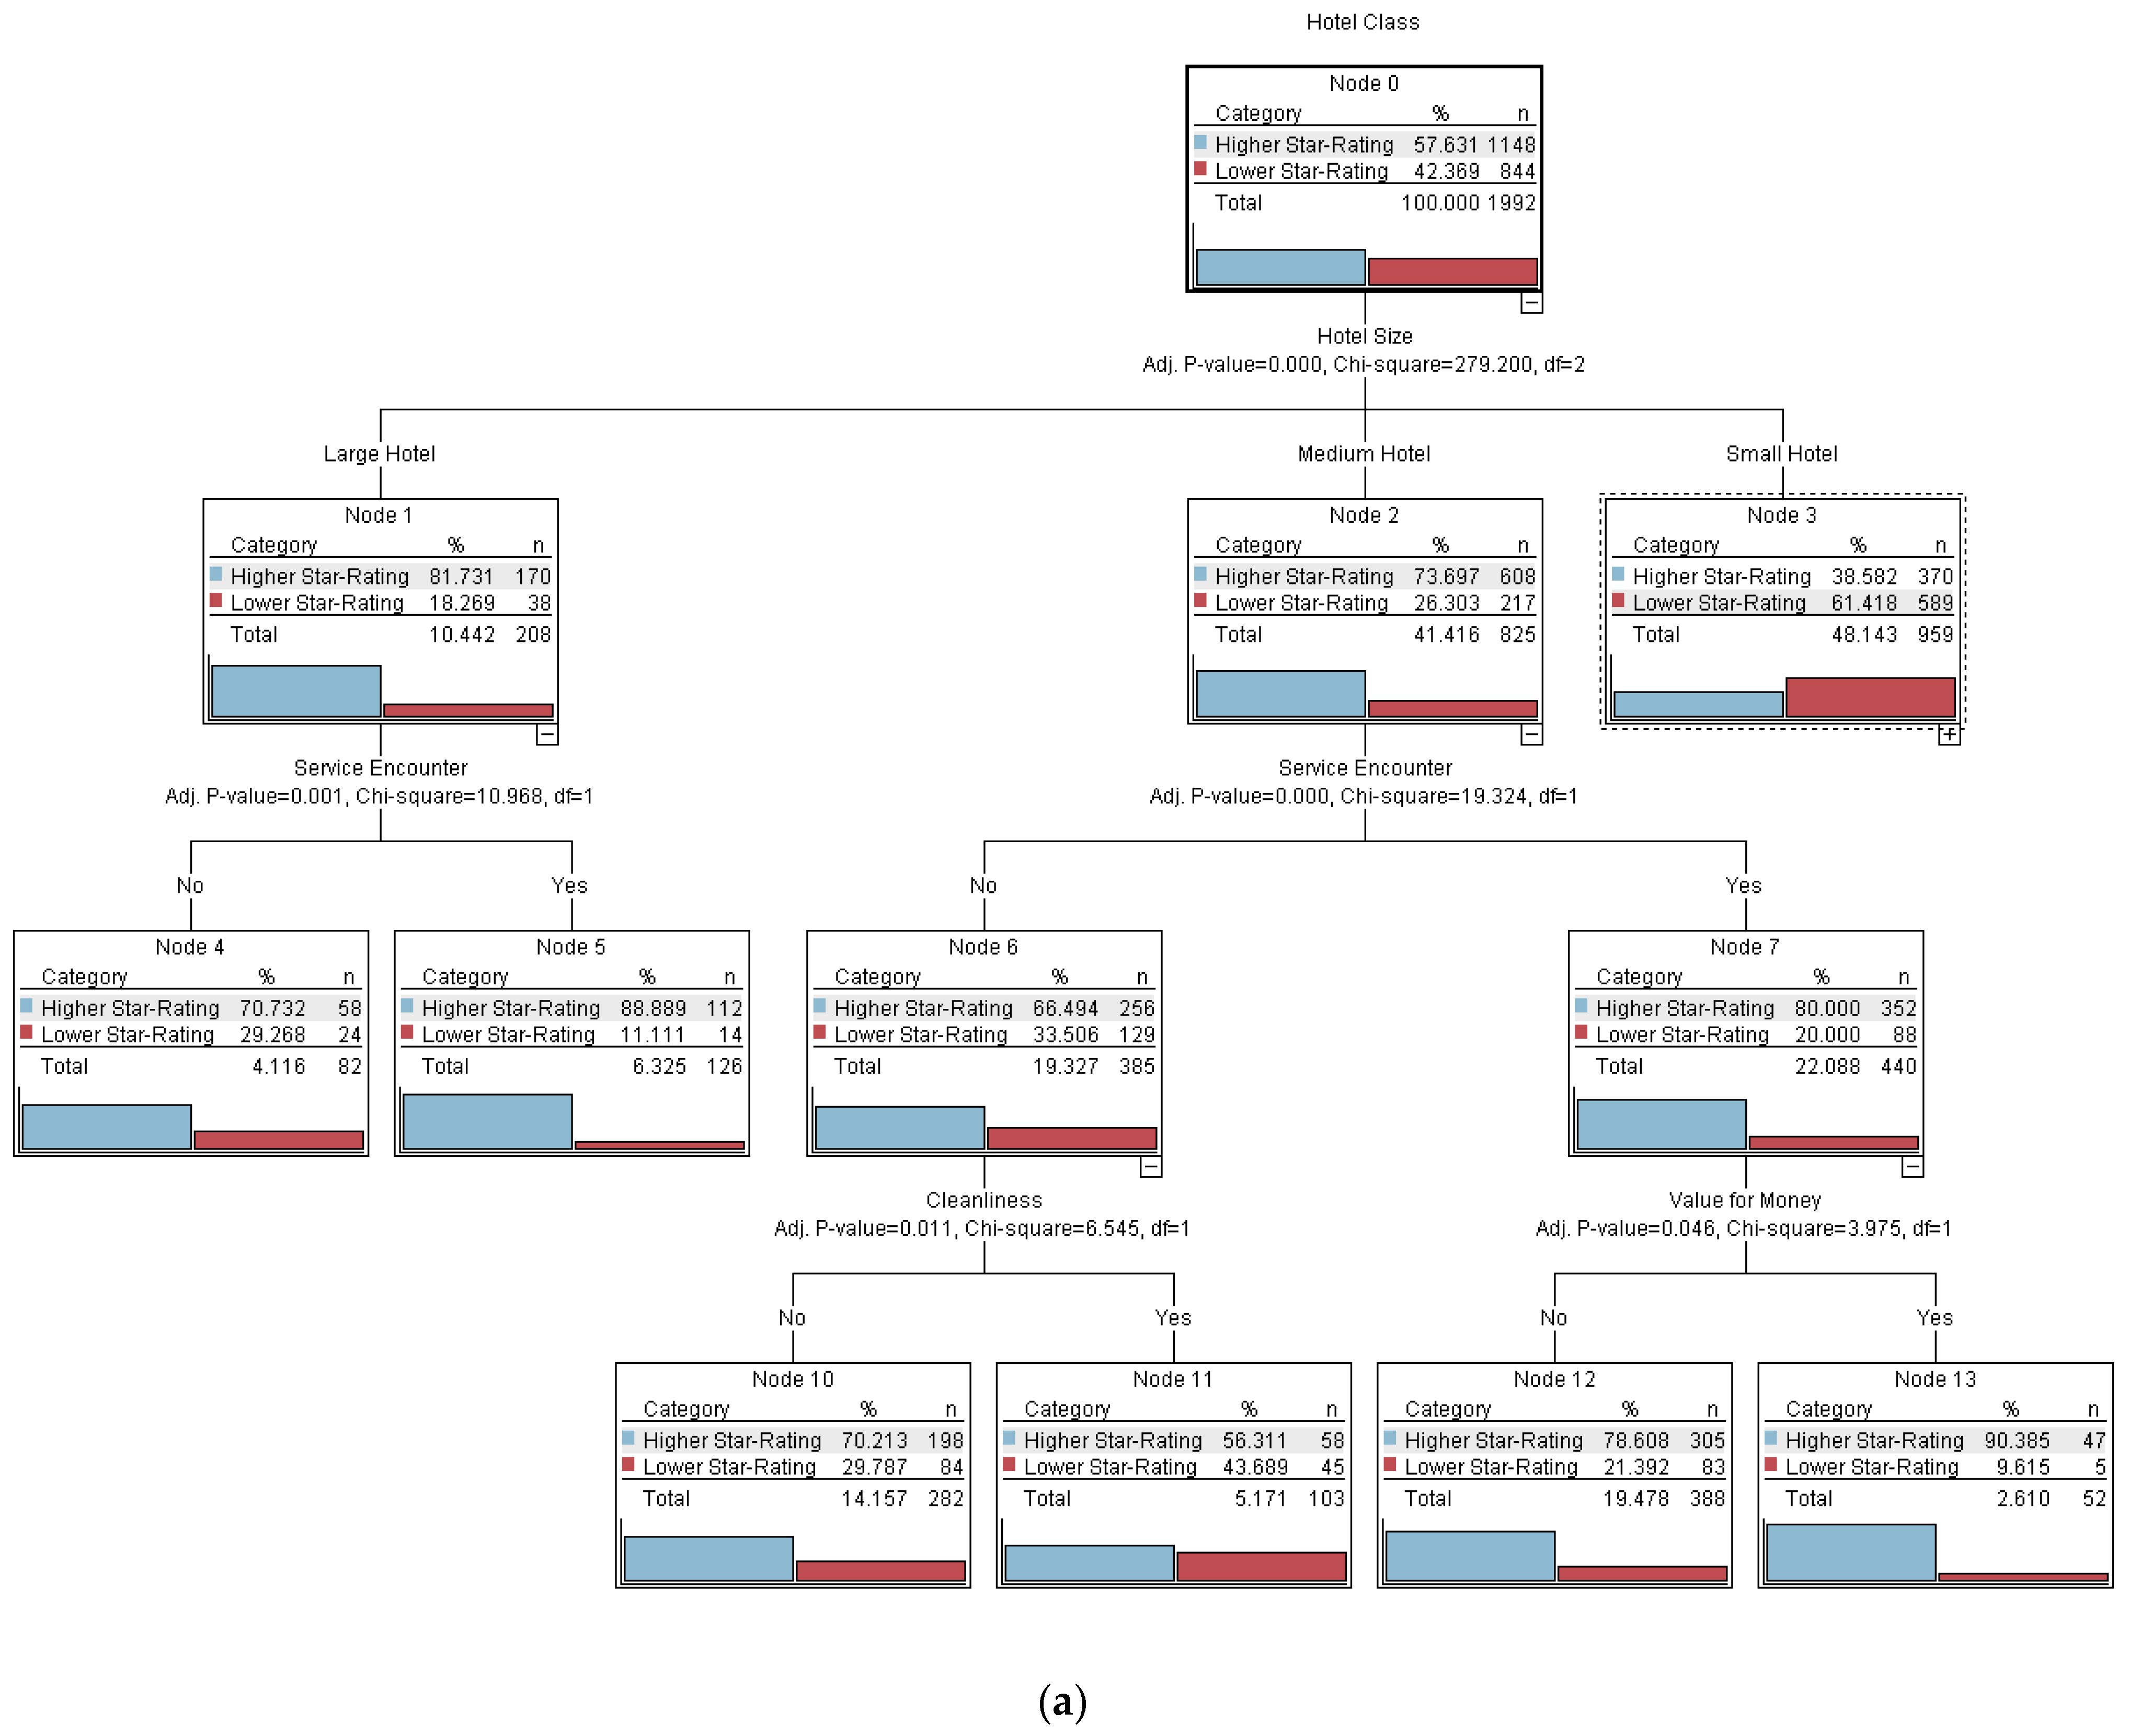
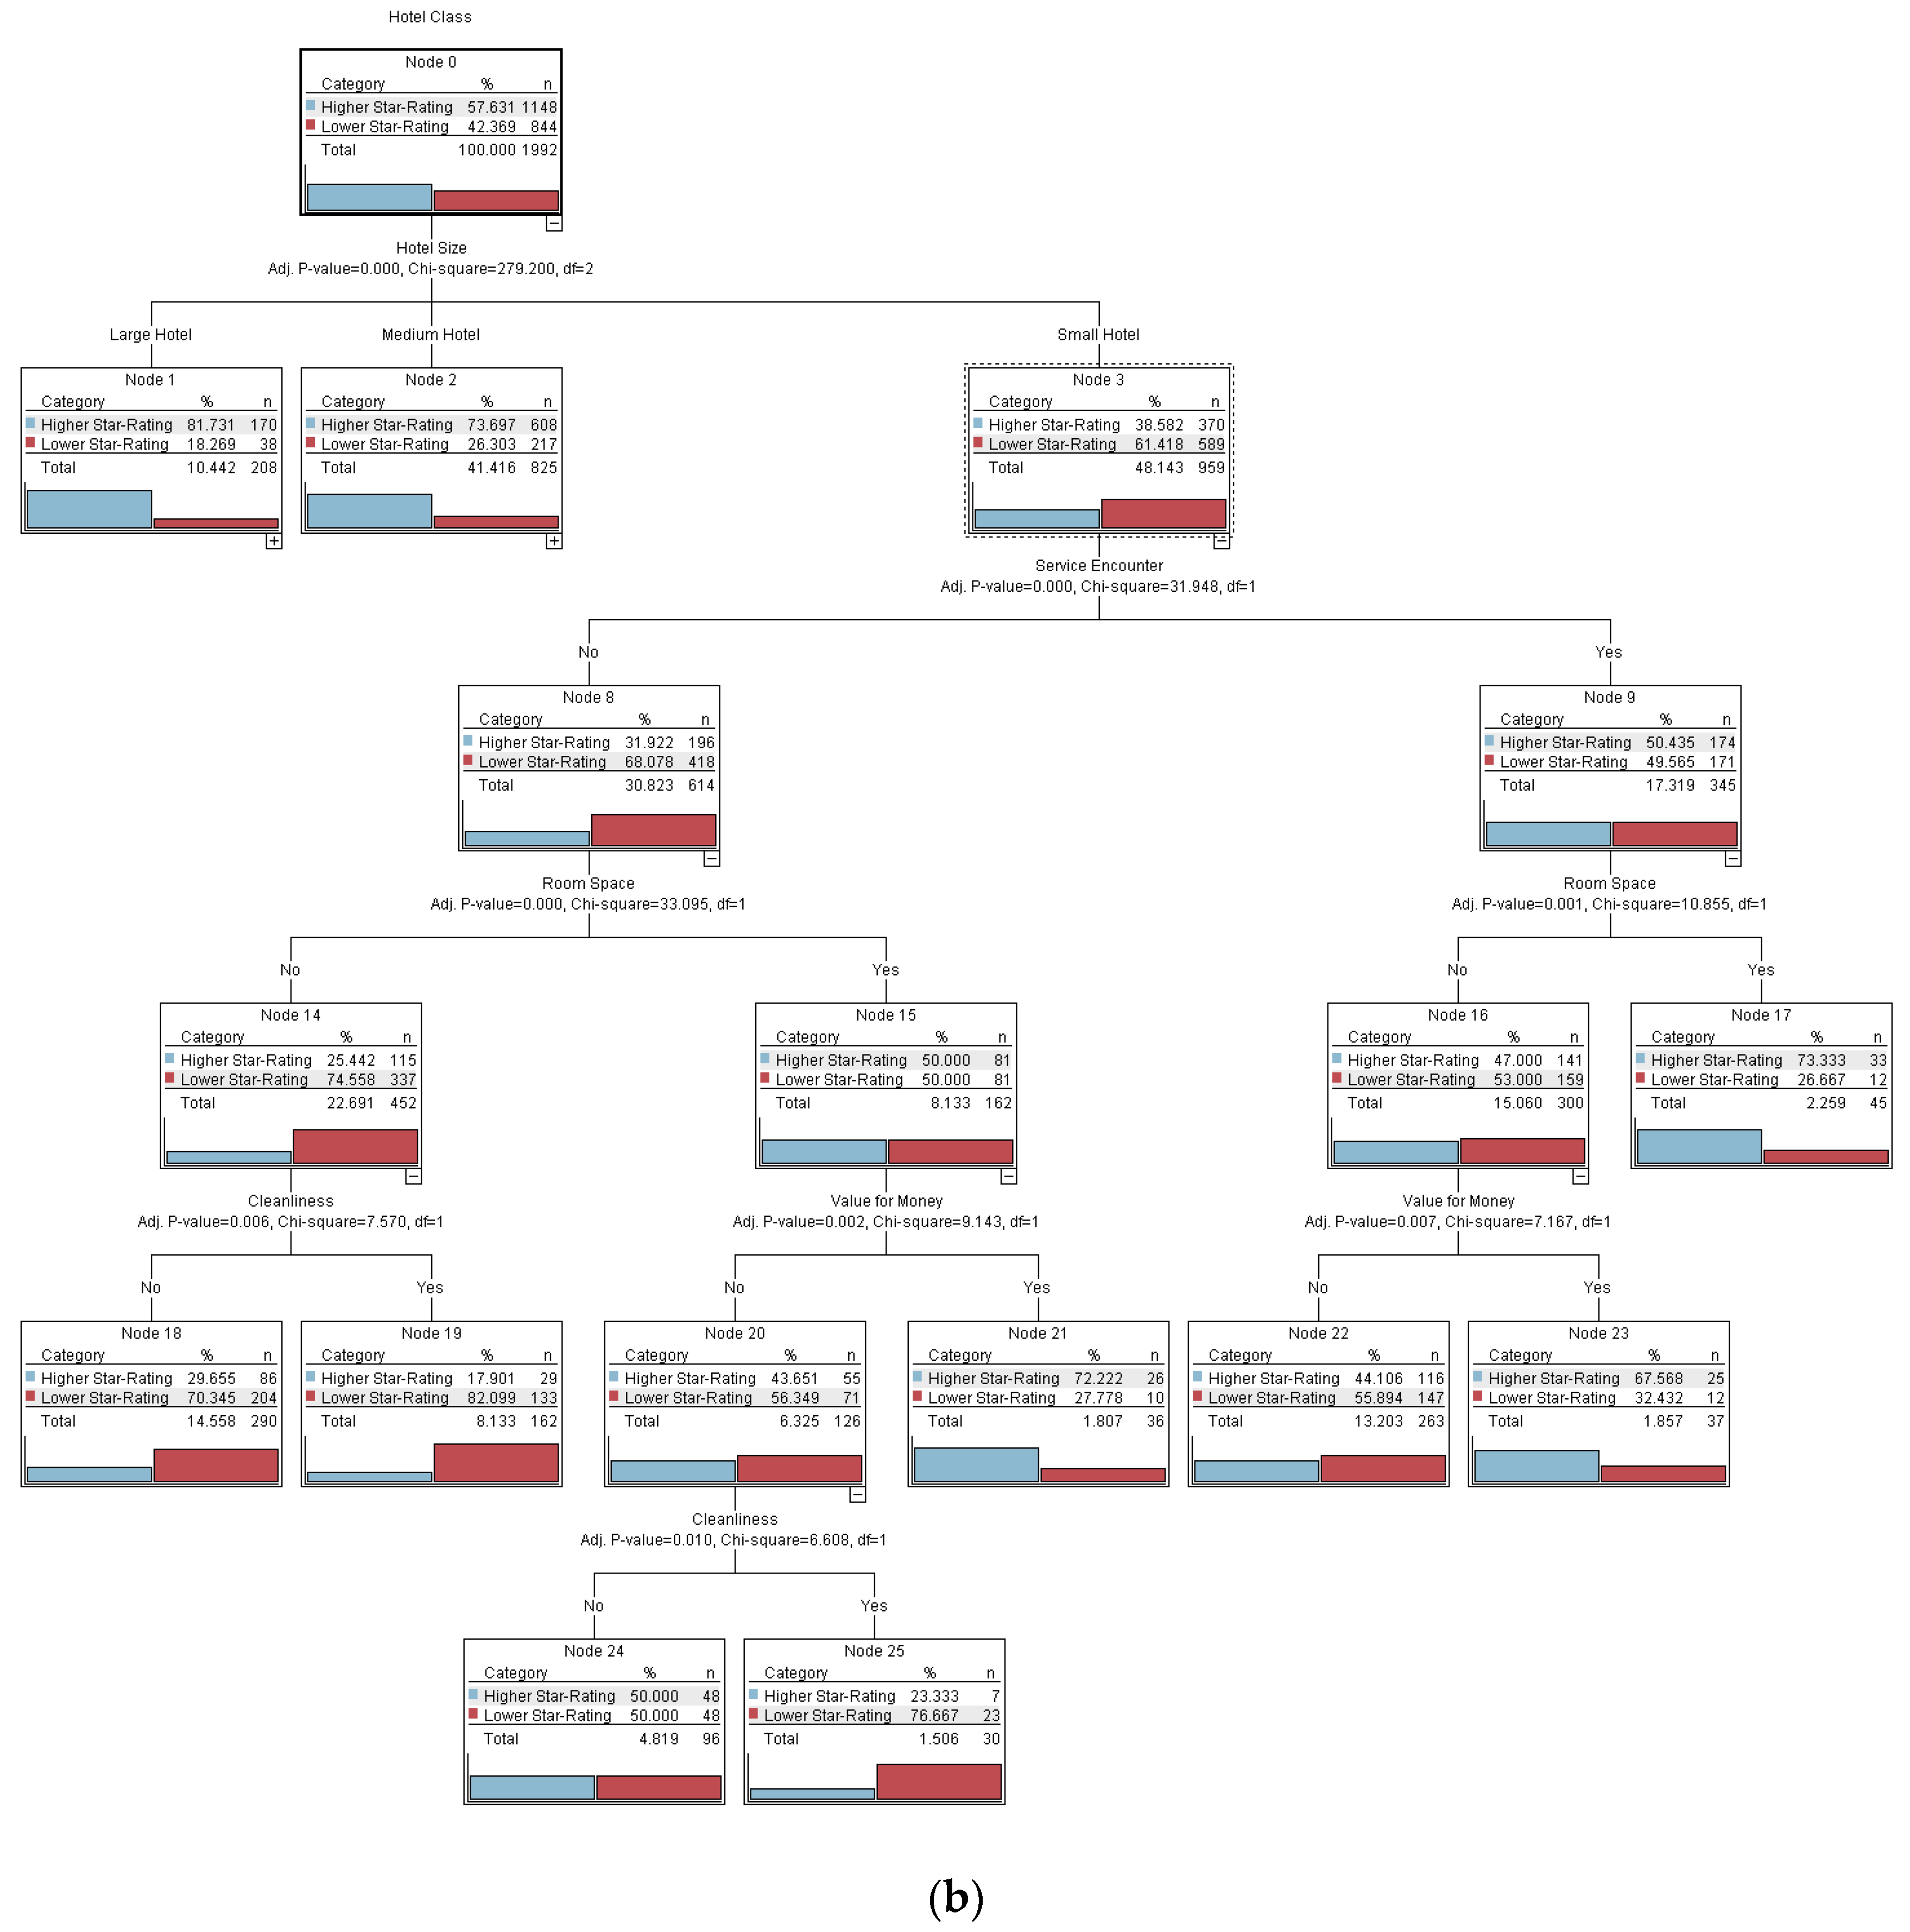
On average, approximately 78% of higher-star-rating hotel guests staying at medium and large hotels are likely to leave online complaints, while only around 61% of lower-star-rating hotel guests staying at small hotels leave online complaints.
(ii)
Guests of higher-star-rating hotels who stay at large hotels are most likely to leave online complaints about Service Encounter.
(iii)
Guests of higher-star-rating hotels who stay at medium-sized hotels are most likely to leave online complaints about Value for Money and also complain about Service Encounter.
(iv)
Guests of higher star-rating hotels who stay at small-sized hotels are more likely to leave online complaints about Room Space and also to complain about Service Encounter. Additionally, guests of lower-star-rating hotels, staying at small-sized hotels, are most likely to leave online complaints about Cleanliness, but not about Value for Money, Room Space, or Service Encounter.
Since smaller hotels received more guest complaints regarding service encounters, room space, value for money, and cleanliness, this shows that the standard operating procedure (SOP) is very important for smaller hotels. This can also support the argument that most larger hotels are chain hotels with a carefully designed SOP. As a consequence, guests tend to complain only about the service encounter. These results are also similar to those of Hu et al. (2019), who found that facility-related issues or cleanliness for low-end hotels are the major sources of guests’ dissatisfaction [13]. On the other hand, for high-end hotels, the major triggers of guests’ complaints are service-related issues, such as service failure. This can be seen in the following complaint reviews:
“[…] however, it does not deserve its 5-star rating. The housekeeping left much to be desired. There was a 3-hour delay on receiving non-allergenic bedding despite being requested in good time … They were slow to supply … the customer care attitude was poor … Terribly cramped and no space to place luggage, etc. … and lack of security on the front door.”
“Cheap but no sleep … It’s cheap and cheerful, although the level of cleanliness could definitely be improved—some staining to pillowcases and towels etc., and a fairly unpleasant smell about the room… I still won’t recommend you to have a sleep in the 2-star…”
The findings of this study are practical and readily applicable to the industry. Regarding Service Encounter, customers had higher expectations in service delivery from higher-star-rating hotels, which tend to be more expensive. To reduce the gaps between service delivery and guests’ expectations, front-desk staff should be trained to exercise politeness and courtesy, deal responsively with guests’ problems, promote positive social interactions with the guests, and, finally, effectively and efficiently handle both the reservation and the check-in and check-out processes. Specifically, this suggests that hotels should offer good Value for Money because once guests perceive a property as being good value for money, the demands that they place on service decrease, and vice versa [12]. Regarding Room Space, it is understandable that most of the hotels located in London offer limited room space. Since space generally cannot be changed without incurring major expense, alternative strategies should be implemented. For instance, hotels with smaller rooms might offer a free welcome fruit/snack basket or a free shuttle bus to areas of interest, in order to cultivate customer satisfaction. Regarding Cleanliness, on average, approximately 83% of lower-star-rating hotel guests made complaints, specifically about bedroom, bathroom, and public area cleanliness. lower-star-rating hotels should consistently ensure the functionality of their core facilities and maintain cleanliness, although lower-star-rating hotels tend to only provide basic facilities and services to cut costs [13,62,63]. Feickert et al. (2006) demonstrated that cleanliness has a very important relationship with security [64]. The security of hotels might be related to less-secure surrounding locations. This is evident from complaint phrases such as: “drunken shouting opposite hotel, loud angry arguments nearby, at night full of drunken locals, unsafe surroundings.” In order to improve guests’ safety, security cameras should be equipped in key areas of the hotel, as well as in the surrounding areas. Security guards should be employed for 24 hours, and importantly, remain on stand-by at the front doors. Outside guests should not be allowed unrestricted access to the hotel after office hours. Additionally, during the check-in process, front-desk staff should recommend that guests lock their valuables in a safe to avoid loss.
This study also offers evidence that DT techniques can be used to effectively predict the OCB of different hotel-class guests. The CHAID approach is superior to other statistical methods, in that one dependent variable with two or more levels is directly connected to independent variables with two or more levels, forming one tree that explicitly accounts for relationships among variables [17]. Moreover, CHAID offers cumulative statistics [19] and is adept at finding OCAs by taking the best segments of the sample. Importantly, since the CHAID results are presented graphically, they are easier to understand and interpret [17]. The rules generated by such trees reveal the most influential factors affecting OCB by guests from various classes of hotels, thus helping hoteliers to identify the most likely complaint areas and subsequently take the required measures to manage them effectively.

6. Conclusions and Future Research Recommendations

This study aims to enrich the literature on the hospitality and tourism industry by utilizing the tools of big data analytics and data mining to predict the complaint attributions of travelers’ OCB from different hotel classes (i.e., higher star rating and lower star rating). The study achieved this goal by applying classification models to analyze TripAdvisor complaint reviews in the UK. Due to the methodological advantages of manual content analysis and data-mining algorithms, this research not only corroborates the conclusions reached by previous studies but goes beyond them by revealing significant differences in OCB from guests staying in various hotel classes.
The main contribution of this innovative study includes the utilization of machine learning algorithms to predict the OCB in the tourism and hospitality industry, whereas previous studies most often relied on traditional methods (e.g., surveys or questionnaires). By analyzing real-world data (i.e., complaint reviews), researchers discovered additional empirical and quantitative categories through DT algorithms. Therefore, the authors contend that there is a need for further in-depth investigations utilizing DM techniques to explore the details of OCB within the tourism and hospitality context. Specifically, more research should apply the increasingly popular tools of data/text mining to the discipline of hospitality and tourism. Additional investigations will help both researchers and practitioners to understand not only how algorithms might be useful in predicting customers’ complaint behavior, but also provide insight into, and hence overcome, some of the barriers of traditional approaches.
The current research is not without its limitations, although its constraints suggest methods that might assist in refining further efforts. The accuracy of this study’s model is considered to be in the range of “acceptable”, due to data limitations. The time-consuming and labor-intensive method used to develop the dataset in the study, manual content analysis, restricted its size. Further research is recommended to increase the data volumes and automate comparisons. More studies are encouraged to compare the findings of this study to those of tourist complaints in destinations outside the UK.

Supplementary Materials

The supporting information can be downloaded at: https://www.mdpi.com/article/10.3390/su14031800/s1. Figure S1: Online complaining behavior for different hotel classes (hotel size node), using the whole dataset (100%). Figure S2: Online complaining behavior for different hotel classes (large hotel category node), using the whole dataset (100%). Figure S3: Online complaining behavior for different hotel classes (medium hotel category node), using the whole dataset (100%). Figure S4: Online complaining behavior for different hotel classes (small hotel category node), using the whole dataset (100%).

Author Contributions

Conceptualization, R.S. and P.-C.L.; methodology, R.S.; software, S.-Y.L.; validation, R.S. and S.-Y.L.; formal analysis, R.S.; investigation, R.S. and S.-Y.L.; resources, R.S.; data curation, R.S.; writing—original draft preparation, R.S.; writing—review and editing, R.S., P.-C.L. and C.-T.C.; visualization, R.S.; supervision, P.-C.L.; project administration, R.S.; funding acquisition, R.S. and P.-C.L. All authors have read and agreed to the published version of the manuscript.

Funding

This research received no external funding.

Institutional Review Board Statement

Not applicable “studies not involving humans or animals.”

Informed Consent Statement

Not applicable “studies not involving humans.”

Data Availability Statement

Data available on request due to privacy restrictions.

Acknowledgments

Raksmey Sann would like to express very great appreciation to the anonymous reviewers for their valuable and constructive suggestions during the review process. Their willingness to give their time so generously is sincerely appreciated.

Conflicts of Interest

The authors declare no conflict of interest.

References

  1. Lee, M.; Youn, S. Electronic word of mouth (eWOM) How eWOM platforms influence consumer product judgement. Int. J. Advert. 2009, 28, 473–499. [Google Scholar] [CrossRef]
  2. Babić Rosario, A.; Sotgiu, F.; de Valck, K.; Bijmolt, T.H. The effect of electronic word of mouth on sales: A meta-analytic review of platform, product, and metric factors. J. Mark. Res. 2016, 53, 297–318. [Google Scholar] [CrossRef]
  3. Fernandes, T.; Fernandes, F. Sharing Dissatisfaction Online: Analyzing the Nature and Predictors of Hotel Guests Negative Reviews. J. Hosp. Mark. Manag. 2018, 27, 127–150. [Google Scholar] [CrossRef]
  4. Donthu, N.; Kumar, S.; Pandey, N.; Pandey, N.; Mishra, A. Mapping the electronic word-of-mouth (eWOM) research: A systematic review and bibliometric analysis. J. Bus. Res. 2021, 135, 758–773. [Google Scholar] [CrossRef]
  5. Zhao, X.; Wang, L.; Guo, X.; Law, R. The influence of online reviews to online hotel booking intentions. Int. J. Contemp. Hosp. Manag. 2015, 27, 1343–1364. [Google Scholar] [CrossRef]
  6. Ladhari, R.; Michaud, M. eWOM effects on hotel booking intentions, attitudes, trust, and website perceptions. Int J. Hosp. Manag. 2015, 46, 36–45. [Google Scholar] [CrossRef]
  7. Casaló, L.V.; Flavián, C.; Guinalíu, M.; Ekinci, Y. Avoiding the dark side of positive online consumer reviews: Enhancing reviews’ usefulness for high risk-averse travelers. J. Bus. Res. 2015, 68, 1829–1835. [Google Scholar] [CrossRef]
  8. Mellinas, J.P.; Maria-Dolores, S.M.M.; Garcia, J.J.B. Effects of the Booking.com scoring system. Tour. Manag. 2016, 57, 80–83. [Google Scholar] [CrossRef]
  9. Guerreiro, J.; Moro, S. Are Yelp′s tips helpful in building influential consumers? Tour. Manag. Perspect. 2017, 24, 151–154. [Google Scholar] [CrossRef]
  10. Tsao, W.C.; Hsieh, M.T.; Shih, L.W.; Lin, T.M.Y. Compliance with eWOM: The influence of hotel reviews on booking intention from the perspective of consumer conformity. Int J. Hosp. Manag. 2015, 46, 99–111. [Google Scholar] [CrossRef]
  11. Abubakar, A.M.; Ilkan, M. Impact of online WOM on destination trust and intention to travel: A medical tourism perspective. J. Destin. Mark. Manag. 2016, 5, 192–201. [Google Scholar] [CrossRef]
  12. Liu, Y.; Teichert, T.; Rossi, M.; Li, H.X.; Hu, F. Big data for big insights: Investigating language-specific drivers of hotel satisfaction with 412,784 user-generated reviews. Tour. Manag. 2017, 59, 554–563. [Google Scholar] [CrossRef]
  13. Hu, N.; Zhang, T.; Gao, B.; Bose, I. What do hotel customers complain about? Text analysis using structural topic model. Tour. Manag. 2019, 72, 417–426. [Google Scholar] [CrossRef]
  14. Yu, F.; Li, G.; Chen, H.; Guo, Y.; Yuan, Y.; Coulton, B. A VRF charge fault diagnosis method based on expert modification C5.0 decision tree. Int. J. Refrig. 2018, 92, 106–112. [Google Scholar] [CrossRef]
  15. Delen, D.; Kuzey, C.; Uyar, A. Measuring firm performance using financial ratios: A decision tree approach. Expert Syst. Appl. 2013, 40, 3970–3983. [Google Scholar] [CrossRef]
  16. Hsiao, Y.H.; Chen, L.F.; Choy, Y.L.; Su, C.T. A novel framework for customer complaint management. Serv. Ind. J. 2016, 36, 675–698. [Google Scholar] [CrossRef]
  17. Kim, S.S.; Timothy, D.J.; Hwang, J.S. Understanding Japanese tourists’ shopping preferences using the Decision Tree Analysis method. Tour. Manag. 2011, 32, 544–554. [Google Scholar] [CrossRef]
  18. Choi, C. Predicting Customer Complaints in Mobile Telecom Industry Using Machine Learning Algorithms. Ph.D. Thesis, Purdue University, West Lafayette, IN, USA, 2018. [Google Scholar]
  19. Chae, Y.M.; Ho, S.H.; Cho, K.W.; Lee, D.H.; Ji, S.H. Data mining approach to policy analysis in a health insurance domain. Int J. Med. Inform. 2001, 62, 103–111. [Google Scholar] [CrossRef]
  20. Nourani, V.; Molajou, A. Application of a hybrid association rules/decision tree model for drought monitoring. Glob. Planet. Change 2017, 159, 37–45. [Google Scholar] [CrossRef]
  21. Lee, P.J.; Hu, Y.H.; Lu, K.T. Assessing the helpfulness of online hotel reviews: A classification-based approach. Telemat. Inform. 2018, 35, 436–445. [Google Scholar] [CrossRef]
  22. Taamneh, M. Investigating the role of socio-economic factors in comprehension of traffic signs using decision tree algorithm. J. Saf. Res. 2018, 66, 121–129. [Google Scholar] [CrossRef] [PubMed]
  23. Lan, T.; Zhang, Y.N.; Jiang, C.H.; Yang, G.B.; Zhao, Z.Y. Automatic identification of Spread F using decision trees. J. Atmos. Sol. Terr. Phys. 2018, 179, 389–395. [Google Scholar] [CrossRef]
  24. Anand, R.V.; Dinakaran, M. Handling stakeholder conflict by agile requirement prioritization using Apriori technique. Comput. Electr. Eng. 2017, 61, 126–136. [Google Scholar] [CrossRef]
  25. Kalgotra, P.; Sharda, R. BIARAM: A process for analyzing correlated brain regions using association rule mining. Comput. Methods Programs Biomed. 2018, 162, 99–108. [Google Scholar] [CrossRef] [PubMed]
  26. Spreafico, C.; Russo, D.; Spreafico, M. Investigating the evolution of pyrolysis technologies through bibliometric analysis of patents and papers. J. Anal. Appl. Pyrolysis 2021, 159, 105021. [Google Scholar] [CrossRef]
  27. Jabbour, S.; Mazouri, F.E.E.; Sais, L. Mining negatives association rules using constraints. Procedia Comput. Sci. 2018, 127, 481–488. [Google Scholar] [CrossRef]
  28. Casaló, L.V.; Flavián, C.; Guinalíu, M.; Ekinci, Y. Do online hotel rating schemes influence booking behaviors? Int J. Hosp. Manag. 2015, 49, 28–36. [Google Scholar] [CrossRef]
  29. Sparks, B.A.; Browning, V. The impact of online reviews on hotel booking intentions and perception of trust. Tour. Manag. 2011, 32, 1310–1323. [Google Scholar] [CrossRef]
  30. Zhang, Z.; Zhang, Z.; Yang, Y. The power of expert identity: How website-recognized expert reviews influence travelers′ online rating behavior. Tour. Manag. 2016, 55, 15–24. [Google Scholar] [CrossRef]
  31. Dinçer, M.Z.; Alrawadieh, Z. Negative word of mouse in the hotel industry: A content analysis of online reviews on luxury hotels in Jordan. J. Hosp. Mark. Manag. 2017, 26, 785–804. [Google Scholar] [CrossRef]
  32. Yuksel, A.; Kilinc, U.; Yuksel, F. Cross-national analysis of hotel customers’ attitudes toward complaining and their complaining behaviours. Tour. Manag. 2006, 27, 11–24. [Google Scholar] [CrossRef]
  33. Ngai, E.W.T.; Heung, V.C.S.; Wong, Y.H.; Chan, F.K.Y. Consumer complaint behaviour of Asians and non-Asians about hotel services—An empirical analysis. Eur. J. Mark. 2007, 41, 1375–1391. [Google Scholar] [CrossRef]
  34. Koc, E. Service failures and recovery in hospitality and tourism: A review of literature and recommendations for future research. J. Hosp. Mark. Manag. 2019, 28, 513–537. [Google Scholar] [CrossRef]
  35. Arora, S.D.; Chakraborty, A. Intellectual structure of consumer complaining behavior (CCB) research: A bibliometric analysis. J. Bus. Res. 2021, 122, 60–74. [Google Scholar] [CrossRef]
  36. Tosun, P.; Sezgin, S.; Uray, N. Consumer complaining behavior in hospitality management. J. Hosp. Mark. Manag. 2021, 31, 247–264. [Google Scholar] [CrossRef]
  37. Cantallops, A.S.; Salvi, F. New consumer behavior: A review of research on eWOM and hotels. Int J. Hosp. Manag. 2014, 36, 41–51. [Google Scholar] [CrossRef]
  38. Xiang, Z.; Du, Q.; Ma, Y.; Fan, W. A comparative analysis of major online review platforms: Implications for social media analytics in hospitality and tourism. Tour. Manag. 2017, 58, 51–65. [Google Scholar] [CrossRef]
  39. Xiang, Z.; Fesenmaier, D.R.; Werthner, H. Knowledge Creation in Information Technology and Tourism: A Critical Reflection and an Outlook for the Future. J. Travel Res. 2021, 60, 1371–1376. [Google Scholar] [CrossRef]
  40. Erevelles, S.; Fukawa, N.; Swayne, L. Big Data consumer analytics and the transformation of marketing. J. Bus. Res. 2016, 69, 897–904. [Google Scholar] [CrossRef]
  41. Cheng, M.; Jin, X. What do Airbnb users care about? An analysis of online review comments. Int J. Hosp. Manag. 2019, 76, 58–70. [Google Scholar] [CrossRef]
  42. Golmohammadi, A.R.; Jahandideh, B.; O′Gorman, K.D. Booking on-line or not: A decision rule approach. Tour. Manag. Perspect. 2012, 2, 85–88. [Google Scholar] [CrossRef]
  43. Moro, S.; Rita, P.; Coelho, J. Stripping customers′ feedback on hotels through data mining: The case of Las Vegas Strip. Tour. Manag. Perspect. 2017, 23, 41–52. [Google Scholar] [CrossRef]
  44. Khade, A.A. Performing customer behavior analysis using big data analytics. Procedia Comput. Sci. 2016, 79, 986–992. [Google Scholar] [CrossRef]
  45. Christodoulou, E.; Gregoriades, A.; Pampaka, M.; Herodotou, H. Combination of Topic Modelling and Decision Tree Classification for Tourist Destination Marketing; Springer International Publishing: Cham, Switzerland, 2020; pp. 95–108. [Google Scholar]
  46. Liu, J.W. Using big data database to construct new GFuzzy text mining and decision algorithm for targeting and classifying customers. Comput. Ind. Eng. 2019, 128, 1088–1095. [Google Scholar] [CrossRef]
  47. SPSS. IBM SPSS Modeler 16 User′s Guide; SPSS: Chicago, IL, USA, 2013. [Google Scholar]
  48. Bhandari, A.; Gupta, A.; Das, D. Improvised Apriori Algorithm Using Frequent Pattern Tree for Real Time Applications in Data Mining. Procedia Comput. Sci. 2015, 46, 644–651. [Google Scholar] [CrossRef]
  49. Lee, W.H.; Cheng, C.C. Less is more: A new insight for measuring service quality of green hotels. Int J. Hosp. Manag. 2018, 68, 32–40. [Google Scholar] [CrossRef]
  50. Kass, G.V. An Exploratory Technique for Investigating Large Quantities of Categorical Data. Appl. Stat. 1980, 29, 119–127. [Google Scholar] [CrossRef]
  51. SPSS. IBM SPSS Modeler 18.0 Algorithms Guide; SPSS: Chicago, IL, USA, 2016. [Google Scholar]
  52. Hung, C. Tree Model: CHAID, C&RT, Boosted Trees & Random; The Data-Shack Limited: London, UK, 2018d; pp. DM0002–DM0003 & DM0005–DM0006. [Google Scholar]
  53. Breiman, L.; Friedman, J.; Olshen, R.; Stone, C. Cart. Classification and Regression Trees; Wadsworth and Brooks/Cole: Monterey, CA, USA, 1984. [Google Scholar]
  54. SPSS. IBM SPSS Modeler 18.0 Modeling: Nodes; SPSS: Chicago, IL, USA, 2016. [Google Scholar]
  55. TripAdvisor London 2018: Best of London, England Tourism—TripAdvisor Hotel Statistics. Available online: https://www.tripadvisor.com/Tourism-g186338-London_England-Vacations.html (accessed on 9 November 2018).
  56. Stringam, B.B.; Gerdes, J. An Analysis of Word-of-Mouse Ratings and Guest Comments of Online Hotel Distribution Sites. J. Hosp. Mark. Manag. 2010, 19, 773–796. [Google Scholar] [CrossRef]
  57. Huang, J. The dining experience of Beijing Roast Duck: A comparative study of the Chinese and English online consumer reviews. Int J. Hosp. Manag. 2017, 66, 117–129. [Google Scholar] [CrossRef]
  58. Gerdt, S.O.; Wagner, E.; Schewe, G. The relationship between sustainability and customer satisfaction in hospitality: An explorative investigation using eWOM as a data source. Tour. Manag. 2019, 74, 155–172. [Google Scholar] [CrossRef]
  59. Lombard, M.; Snyder-Duch, J.; Bracken, C.C. Content analysis in mass communication: Assessment and reporting of intercoder reliability. Hum. Commun. Res. 2002, 28, 587–604. [Google Scholar] [CrossRef]
  60. Cenni, I.; Goethals, P. Negative hotel reviews on TripAdvisor: A cross-linguistic analysis. Discourse Context Media 2017, 16, 22–30. [Google Scholar] [CrossRef]
  61. SPSS. IBM SPSS Decision Tree 2; SPSS: Chicago, IL, USA, 2012. [Google Scholar]
  62. Sann, R.; Lai, P.-C.; Chang, H.-C. Does Culture of Origin Have an Impact on Online Complaining Behaviors? The Perceptions of Asians and Non-Asians. Sustainability 2020, 12, 1838. [Google Scholar] [CrossRef]
  63. Sann, R.; Lai, P.C. Understanding homophily of service failure within the hotel guest cycle: Applying NLP-aspect-based sentiment analysis to the hospitality industry. Int J. Hosp. Manag. 2020, 91, 102678. [Google Scholar] [CrossRef]
  64. Feickert, J.; Verma, R.; Plaschka, G.; Dev, C.S. Safeguarding your customers: The guest’s view of hotel security. Cornell Hotel. Restaur. Adm. Q. 2006, 47, 224–244. [Google Scholar] [CrossRef]
Figure 1. The research framework.
Sustainability 14 01800 g001
Figure 2. Comparison of different DT models.
Sustainability 14 01800 g002
Figure 3. The study research process.
Sustainability 14 01800 g003
Figure 4. Evaluation of the testing dataset (gain chart) for Hotel Class.
Sustainability 14 01800 g004
Figure 5. The process of CHIAD algorithm analysis.
Sustainability 14 01800 g005
Figure 6. (a). Online complaining behavior for different hotel classes (large and medium hotel categories), using the whole dataset (100%). (b). Online complaining behavior for different hotel classes (small hotel category), using the whole dataset (100%).
Sustainability 14 01800 g006aSustainability 14 01800 g006b
Table 1. Breakdown of samples for each hotel category.
Hotel CategoryFrequency%
Hotel Size
Large Hotel20810.4
Medium Hotel82541.4
Small Hotel95948.1
Hotel Star-Rating
2-Star29714.9
3-Star54727.5
4-Star60330.3
5-Star54527.4
Hotel Class
Higher Star-Rating114857.6
Lower Star-Rating84442.4
Total1992100.0
Table 2. The description of the complaint variables.
SourceData TypeVariablesCoding Descriptions
HotelNumericalRoomsThe amount of hotel rooms.
HotelCategoricalHotel SizeSmall (less than 99 rooms), Medium (100–299 rooms), Large (300 room-ups)
HotelNumericalHotel Star RatingThe average of hotel ratings (2 to 5 stars)
HotelCategoricalHotel ClassHigher star-rating (4 to 5 stars) and lower star-rating (2 to 3 stars)
CodingCategoricalService EncounterUnfriendly Staff, Impoliteness, Poor Customer Service, Lack of Responsiveness, Check-in and Check-out
Matters, Reservation Difficulties, Insufficient Information, Less Social Interaction, Poor Courtesy,
Poor Competency, Personal Bias
CodingCategoricalRoom IssueInadequate Amenities, Poor Layout, Few Welcoming Extra, Poor Décor/Design, Less Lighting
CodingCategoricalHotel FacilityWi-Fi Problem, Insufficient Public Facilities, Dated Hotel/Building
CodingCategoricalCleanlinessPoor Cleanliness in General, Bedroom Uncleanliness, Poor Public Areas Cleanliness, Filthy Toilet
CodingCategoricalLocation AccessibilityFar from City Center/CBD *, Far from Public Transportation, Away from Attractions, Far from Airport,
Inconvenient Location, Poor Accessibility
CodingCategoricalValue for MoneyUnreasonable Price for QP *, Expensive Room Price, Food Overpriced, Not Value for Money, Expensive
in General
CodingCategoricalSafetyLess Safe, Not Feeling Safe, Unsafe Neighborhood
CodingCategoricalRoom SpaceSmall Room Space, Small Toilet Space
CodingCategoricalF & B IssuePoor Dining Environment, Lack of Special Food Service, No Innovative Menu, Limited Variety,
Disappointing Breakfast, Poor Upselling of RFF *, Bad Tasty Food
CodingCategoricalMiscellaneous IssueAnnoying Insects, Uncomfortable Bedding, Disgusting Smell, Lack of Facility Maintenance,
Noise, Bad Outside Views
* Note: CBD: commercial business district; QP: quality provided; RFF: recommendation for food.
Table 3. Reliability testing between two independent coders.
NoCodename5% of Corpus10% of Corpus
Agreement (%)Coder A and Not B (%)Coder B and Not A (%)Agreement (%)Coder A and Not B (%)Coder B and Not A (%)
Avg. Overall Inter-Coder Reliability98.56%97.74%
1Cleanliness98.970.840.1998.741.010.25
2F & B Issue99.090.860.0598.181.660.16
3Hotel Facility99.200.670.1398.790.910.30
4Location Accessibility99.820.180.0199.790.180.03
5Miscellaneous Issue98.121.430.4597.021.891.09
6Room Issue98.541.280.1897.601.640.76
7Safety99.490.360.1699.360.360.29
8Room Space98.900.940.1598.281.250.47
9Service Encounter94.625.070.3191.346.931.73
10Value for Money98.881.050.0798.281.570.14
Table 4. Confusion Matrix.
TitlePredicted
Higher Star-RatingLower Star-Rating
ActualHigher Star-RatingTrue Negative (TN)False Positive (FP)
Lower Star-RatingFalse Negative (FN)True Positive (TP)
Table 5. Prediction results for the variable of Hotel Class.
Model TypeSampleACSensitivity/Recall/TPSpecificity/TNFPFNPF-MeasureAUC
CHAIDTraining Set0.71410.71890.70580.29420.28110.80830.76100.754
Testing Set0.70850.74940.63910.36090.25060.77930.76400.745
C&RTTraining Set0.71410.71890.70580.29420.28110.80830.76100.723
Testing Set0.70850.74940.63910.36090.25060.77930.76400.720
C5.0Training Set0.71040.71980.69500.30500.28020.79530.75570.724
Testing Set0.70690.75130.63400.36600.24870.77130.76120.709
QUESTTraining Set0.70090.70710.69010.30990.29290.80050.75090.715
Testing Set0.70850.74190.64680.35320.25810.79520.76770.728
Note: AC: Accuracy; TP: true positive rate; TN: true negative rate; FP: false positive rate; FN: False Negative Rate; P: Precision; AUC: Area Under Curve.
Table 6. Confusion (coincidence) matrices of each decision tree model.
Model TypeSampleTitlePredictedPer-Class Accuracy (%)TitleOverall Accuracy (%)
Higher Star-RatingLower Star-Rating
CHAIDTraining SetActualHigher Star-Rating62414880.829Correct97971.41
Lower Star-Rating24435559.265Wrong39228.59
Sum868503 1371
Testing SetActualHigher Star-Rating2938377.926Correct44070.85
Lower Star-Rating9814760.000Wrong18129.15
Sum391230 621
C&RTTraining SetActualHigher Star-Rating62414880.829Correct97971.41
Lower Star-Rating24435559.265Wrong39228.59
Sum868503 1371
Testing SetActualHigher Star-Rating2938377.926Correct44070.85
Lower Star-Rating9814760.000Wrong18129.15
Sum391230 621
C5.0Training SetActualHigher Star-Rating61415879.534Correct97471.04
Lower Star-Rating23936060.100Wrong39428.96
Sum853518 1371
Testing SetActualHigher Star-Rating2908677.128Correct43970.69
Lower Star-Rating9614960.816Wrong18229.31
Sum386235 621
QUESTTraining SetActualHigher Star-Rating61815480.052Correct96170.09
Lower Star-Rating25634357.262Wrong41029.91
Sum874497 1371
Testing SetActualHigher Star-Rating2997779.521Correct44070.85
Lower Star-Rating10414157.551Wrong18129.15
Sum403218 621
Table 7. Aggregated variable importance values of OCAs for Hotel Class (training dataset).
Online Complaining AttributesDecision Tree Models
CHAIDC&RTC5.0QUESTV (Fused) *
Hotel Size0.54120.55030.67440.60532.3712
Service Encounter0.20400.12750.21480.10860.6549
Room Space0.08930.09010.07650.04370.2996
Value for Money0.02720.05760.01670.08050.1820
Cleanliness0.03490.05140.01770.05400.1580
Room Issue0.06450.02560.00000.00000.0901
Miscellaneous Issue0.00000.03250.00000.05400.0865
Location Accessibility0.00000.03250.00000.05400.0865
Hotel Facility0.03900.03250.00000.00000.0715
V (Fused) *: total relative importance value for each attribute.
Table 8. The confusion matrixes.
The Confusion MatrixPredicted
Higher Star-RatingLower Star-RatingTotal
ActualHigher Star-Rating9302181148
Lower Star-Rating366478844
Total12966961992
Risk Statistics
Risk Estimate0.2931
SE of Risk Estimate0.0101
Publisher’s Note: MDPI stays neutral with regard to jurisdictional claims in published maps and institutional affiliations.

