


Abstract
Ground motion prediction equations are a key element of seismic hazard assessments. Pakistan lacks a robust ground motion prediction equation specifically developed using a Pakistan seismic ground motion databank. In this study, performance assessment of the ground motion prediction equations for usage in seismic hazard and risk studies in Pakistan, a seismically highly active region, is performed. In this study, an evaluation of the global ground motion prediction equations developed for the shallow active regions is carried out based on a databank of strong ground motion that was compiled in this study. Thirteen ground motion prediction equations were considered applicable, and their goodness of fit was evaluated using the databank of 147 peak ground acceleration of 27 shallow earthquakes in Pakistan. Residual analysis and three goodness of fit procedures were implemented in the evaluation of the equations. The results of this study suggest that global ground motion prediction equations can be applicable in the shallow active regions of Pakistan. These equations were developed based on data from Europe and the Middle East. Next Generation Attenuation West-2 equations were also applicable, but they did not perform as well as the European and Middle Eastern databank-derived equations. A total of four global equations were applicable in Pakistan. The best performing equation in this study should be applied with the highest weight, and the others should be applied with small weights on the logic tree to perform better. These equations can be employed in seismic hazard and risk assessment studies for disaster risk mitigation measures.
1. Introduction
Pakistan has been experiencing major regional earthquakes regularly throughout its history, and these will continue to occur due to its peculiar tectonic setting concerning three major tectonic plates. Therefore, the seismic hazard is high in this part of the world. The most recent large earthquake that struck Pakistan occurred on 26 October 2015 with a magnitude (Mw) of 7.5 (focal depth = 210 km). Its epicenter was in the Hindukush region located northwest of Pakistan, and due to its deep focus, the shaking was felt all over Pakistan and in the neighboring countries. The Awaran earthquake with an Mw of 7.7, having a focal depth of 15 km, occurred on 24 September 2013 in southern Pakistan and is another example of a recent large earthquake. These two earthquakes signify that large earthquakes occur in and in close proximity to Pakistan.
Earthquakes in Pakistan have resulted in damage to infrastructure, loss of human life and monetary losses. Seismic risk in Pakistan is high due to the vulnerability of structures and the high hazard prominence. Poor seismic performance by structures during earthquakes in Pakistan is due to the construction of non-engineered structures and poor seismic design and construction practices.
Working toward a reliable estimate of the seismic hazard in Pakistan is one seismic risk mitigation measure. The seismic hazard map for Pakistan has been revised by Sabetta et al. [1] in line with the Italian Building Code guidelines. This approach provides three parameters for the control of the spectral shape in a dense grid of points and, at the same time, gives design spectra accurately representing the expected seismic motion at the site under consideration.
The seismic actions induced in the structures are computed from the seismic hazard maps. Among the most important inputs to seismic hazard studies are ground motion prediction equations (GMPEs). The development of GMPEs using local strong motion data has received very little attention in Pakistan due to the absence of a sufficient amount of data. If strong motion records were available for the region in abundance, local GMPEs could be developed by regression analysis techniques (e.g., Joyner and Boore [2,3]).
There exists only one GMPE available for Pakistan created by Shah et al. [4], which hereinafter will be called SH12. It was developed for peak ground acceleration (PGA) prediction based on data from northern Pakistan. The functional form of SH12 is given in Equation (1):
where M is the moment magnitude and R is the epicentral distance. The standard deviation of the equation has not been mentioned. It has been estimated to be 1.60 (in logarithmic units) from the data given in SH12. The standard deviation was estimated using Microsoft Excel software. The standard deviation is very high and possible due to the reason that for data in SH12 did not grouped into data-based on site class and the second reason maybe due to the sparsity in the availability of strong motion data.
ln (PGA) = −6.0985 + 1.4004 M − 1.5357 lnR
If the data are not sufficient, then GMPEs developed for other regions can be adopted. However, their use and performance should be assessed before using them. Performance evaluation can be carried out by generating trellis plots of the GMPEs (plots of the predicted intensity values of the GMPEs for different earthquake scenarios) or using the available local strong motions in a data-driven testing. In the data-driven testing, values from real earthquake recordings are evaluated using procedures from the literature (e.g., Scherbaum et al. [5,6]). Thus far, the seismic hazard analyses carried out for Pakistan have used GMPEs adopted from regions outside of Pakistan. The strong motion data compiled for the Middle East region by Danciu et al. [7] include Pakistan. In that dataset, only 11 records were included from Pakistan. Due to this small contribution of Pakistan data, it is appropriate to carry out an independent study using all possible data.
This study refers to evaluation of the horizontal component of ground motion prediction equations. The main purpose of this work is to evaluate the feasibility of the global GMPEs in seismic hazard assessment studies for Pakistan using the local strong motion records in a data-driven testing. The residual analysis and goodness of fit measures proposed by Scherbaum et al. [5,6] and Kale and Akkar [8] are used. Thirteen different GMPEs developed for regions outside of Pakistan have been selected in this analysis, and a strong motion dataset for Pakistan consisting of 147 PGAs from 27 earthquakes has been used.
Global ground motion prediction equation evaluations for usage in seismic hazard analyses has also been a subject of interest in the neighboring countries of Pakistan using similar methods (e.g., Zafrani and Farhadi [9] in Iran and P. Anbazhagan et al. [10] in India). Seismotectonic and seismic hazard studies for this region are active, and some examples of such studies are (1) a seismic hazard map for the Middle East region, including Pakistan, by Girdani et al. [11], (2) macrozonation of the ground displacements in Iran by Farhani et al. [12], and (3) a study on plate deformations of the Eurasian and Arabian plates by Allen et al. [13].
The selected GMPEs include four Next Generation Attenuation (NGA)-West-2 GMPEs and nine other potential candidates. The applicability of NGA-West-2 equations has been demonstrated by various studies for their worldwide applications.
2. Tectonic Settings
Pakistan is located in one of the most seismically active regions of the world due to presence of the Indian-Eurasian and the Arabian-Eurasian plate boundaries. The mountain ranges of the Himalayas, Hindukush, Karakorum, Makran, Kirther, and Suleiman are the products and evidence of the ongoing activities between these plates. Due to the tectonic setting and geology, earthquakes are very frequent in this part of the world (Kazmi and Jan [14]). The Himalayan ranges located in northeast were formed by a head-on collision of the India and Eurasia plates and are seismically very active, with several devastating regional earthquakes generated by this belt. The Kirther and Suleiman ranges and the prominent Chaman Fault systems located in the southwest were also been by the collision of the Indian and Eurasian plates. The Arabian and Eurasian plates’ interaction is represented by the Makran subduction zone located in the southwest of Pakistan.
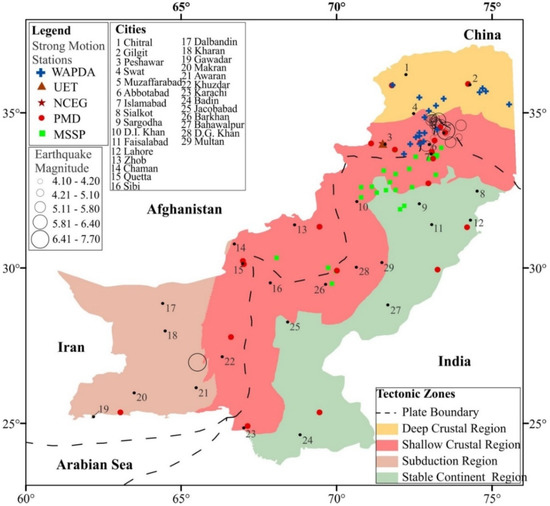
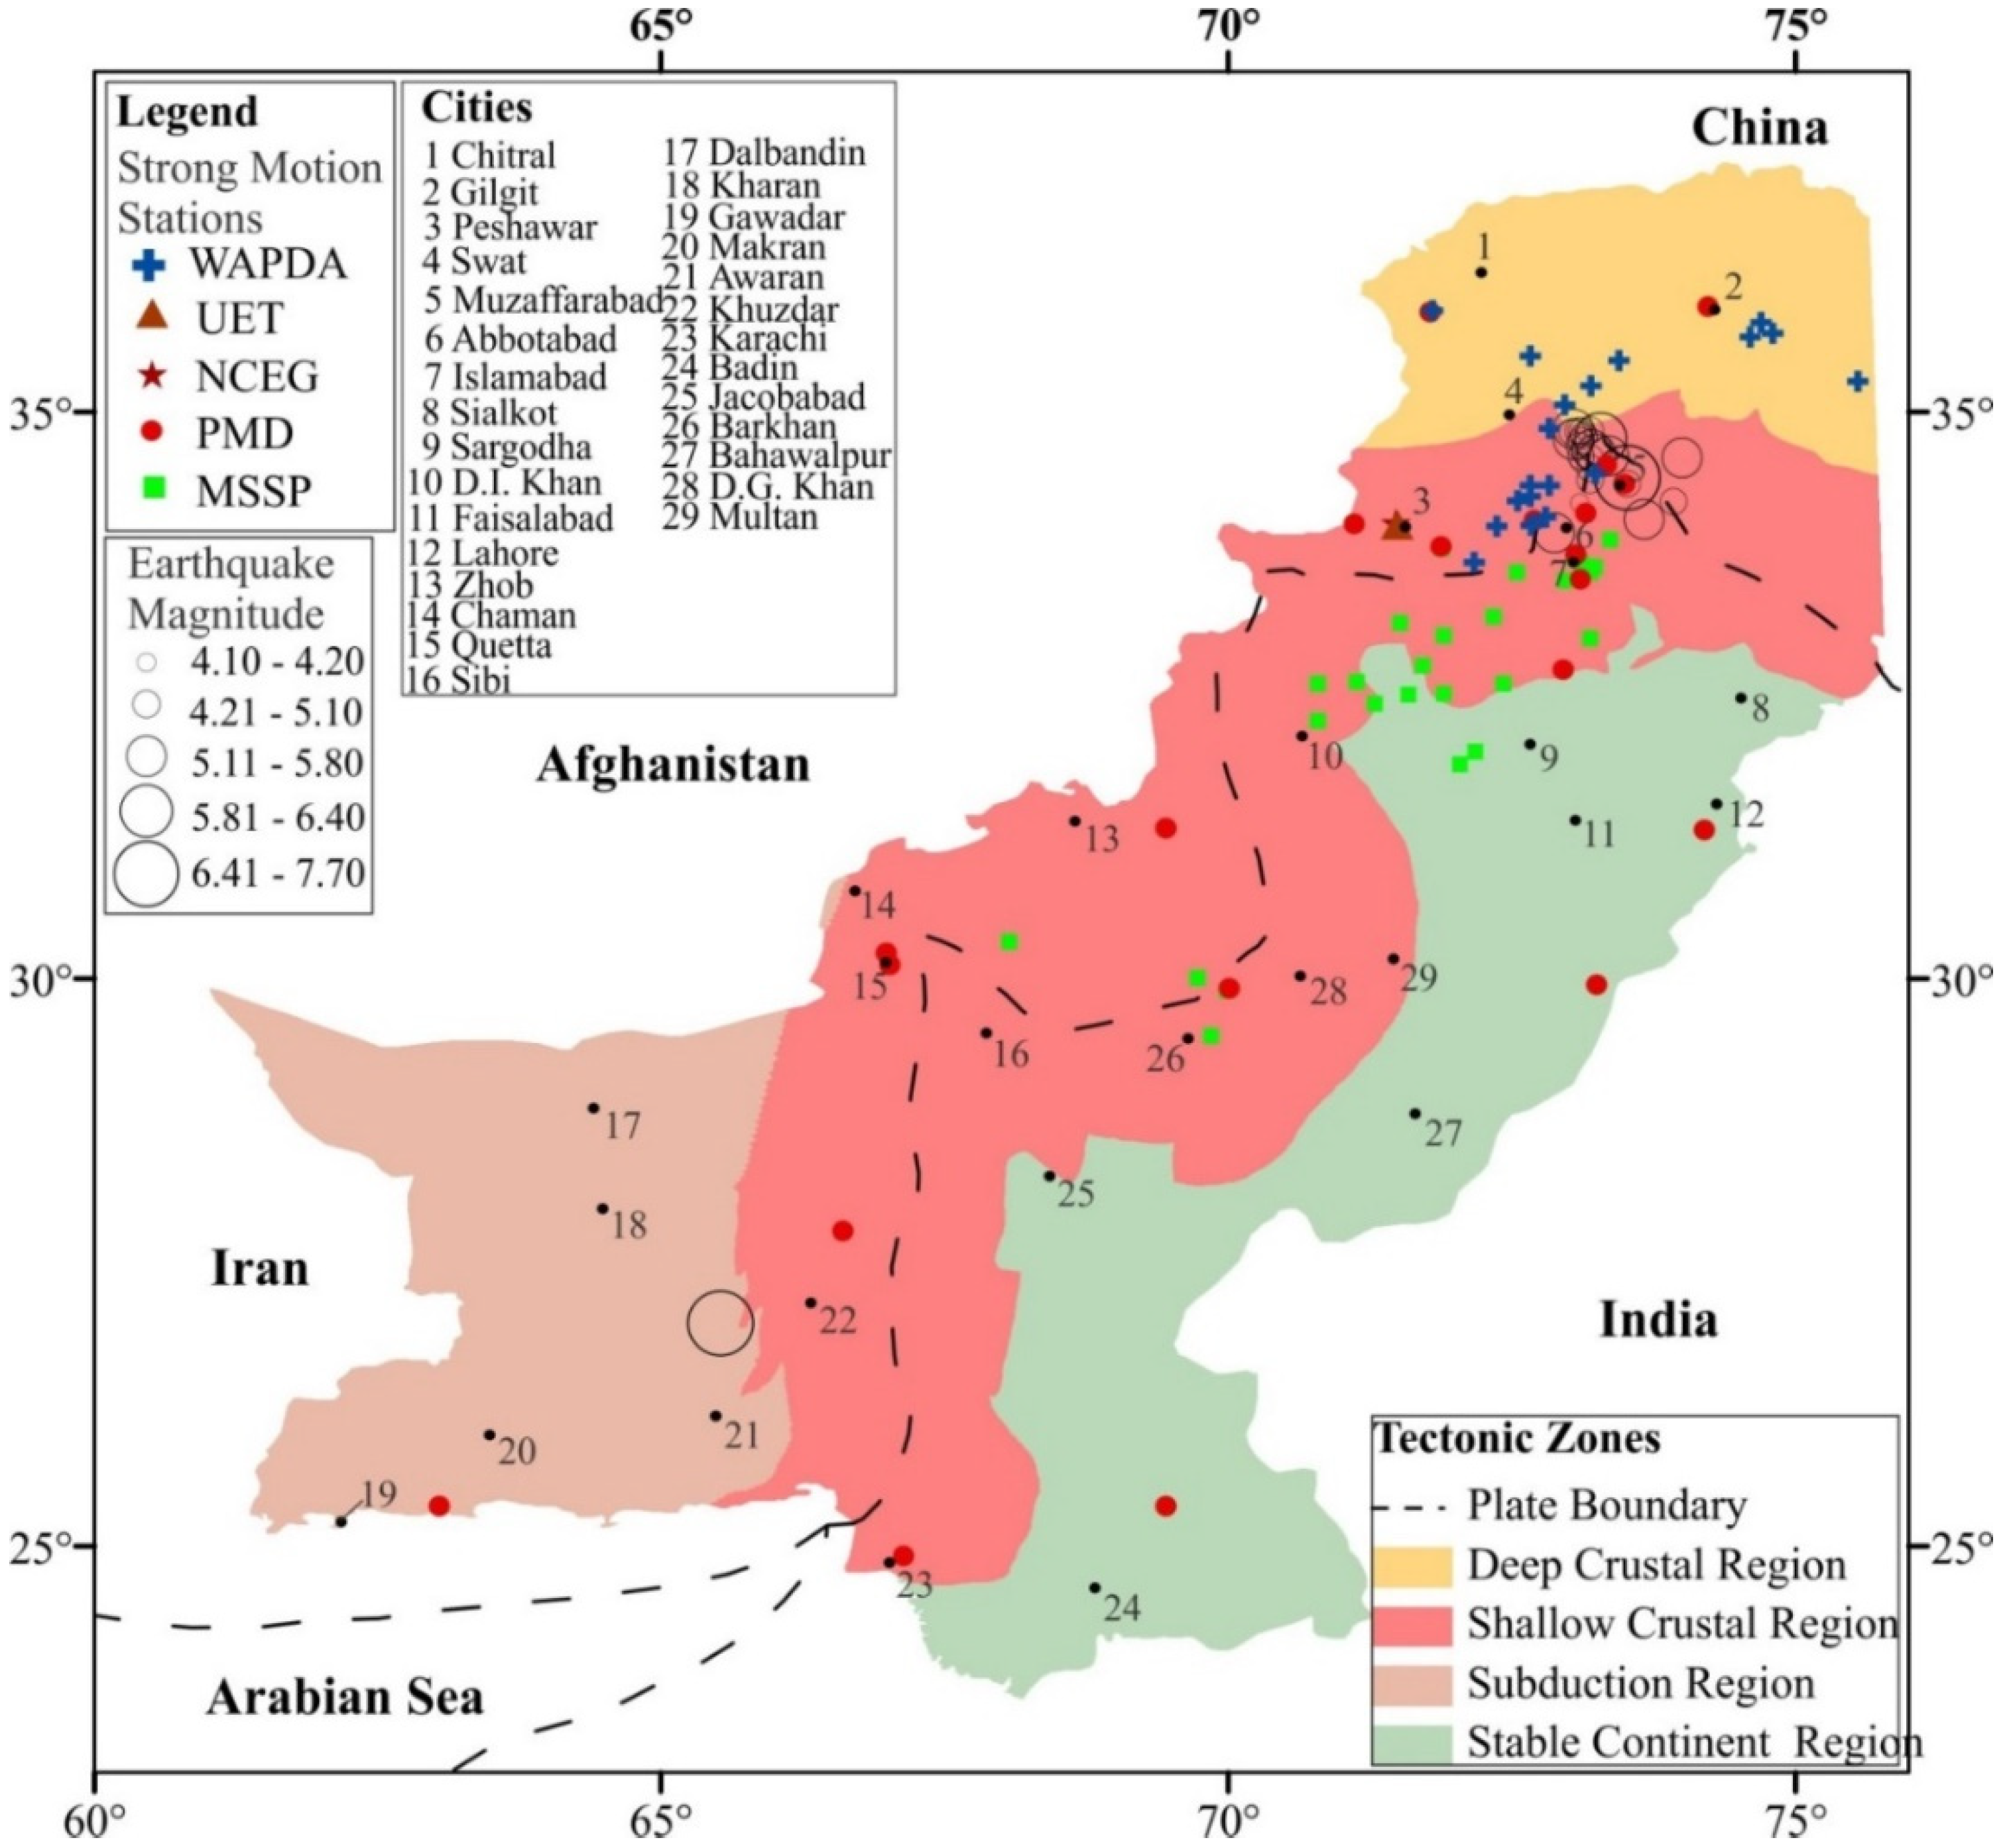
The Indus platform and foredeep in southeastern Pakistan includes the Indus Plain and the Thar and Cholistan deserts. The Sulaiman range and Kirthar foredeep lie on its eastern flank. Its north-south structures are in contact with the fault of the east-west trending Himalayan fold and thrust belt. In synthesis, Pakistan may be classified into four broad tectonic regions: (1) an active shallow tectonic region, (2) a stable continental region, (3) a subduction interface tectonic region and (4) a deep crustal or in-slab subduction tectonic region (Figure 1).
Figure 1.
Tectonic regions in Pakistan along with the strong motion stations operated in the country and the epicenters of the recorded earthquakes.
3. Materials and Method
3.1. Data Collection
In Pakistan, strong motion arrays have been installed by various agencies: the Pakistan Meteorological Department (PMD), the Micro-Seismic Studies Project (MSSP) of the Pakistan Atomic Energy Commission (PAEC) and the Ministry for Water and Power Development Authority (WAPDA). Aside from these agencies, the National Centre of Excellence in Geology (NCEG) also operates a network of three stations in northern Pakistan. The University of Engineering and Technology (UET) operates one station. The information about the number of stations managed by each organization and their geographical coverage of these stations is shown in Figure 1.
WAPDA operates 19 stations at Tarbela Dam and 19 stations at the Bunje, Dasu and Basha observatories. The PMD array consists of 20 stations, while the MSSP operates 28 stations. WAPDA, PMD and the MSSP operate under different ministries, and there is no unified management system controlling the seismic arrays. As a result, there is a complete lack of coordination, and it is difficult to obtain data from any of the agencies. There is a strong need to bring all the agencies under a common platform to adequately manage and disseminate the data.
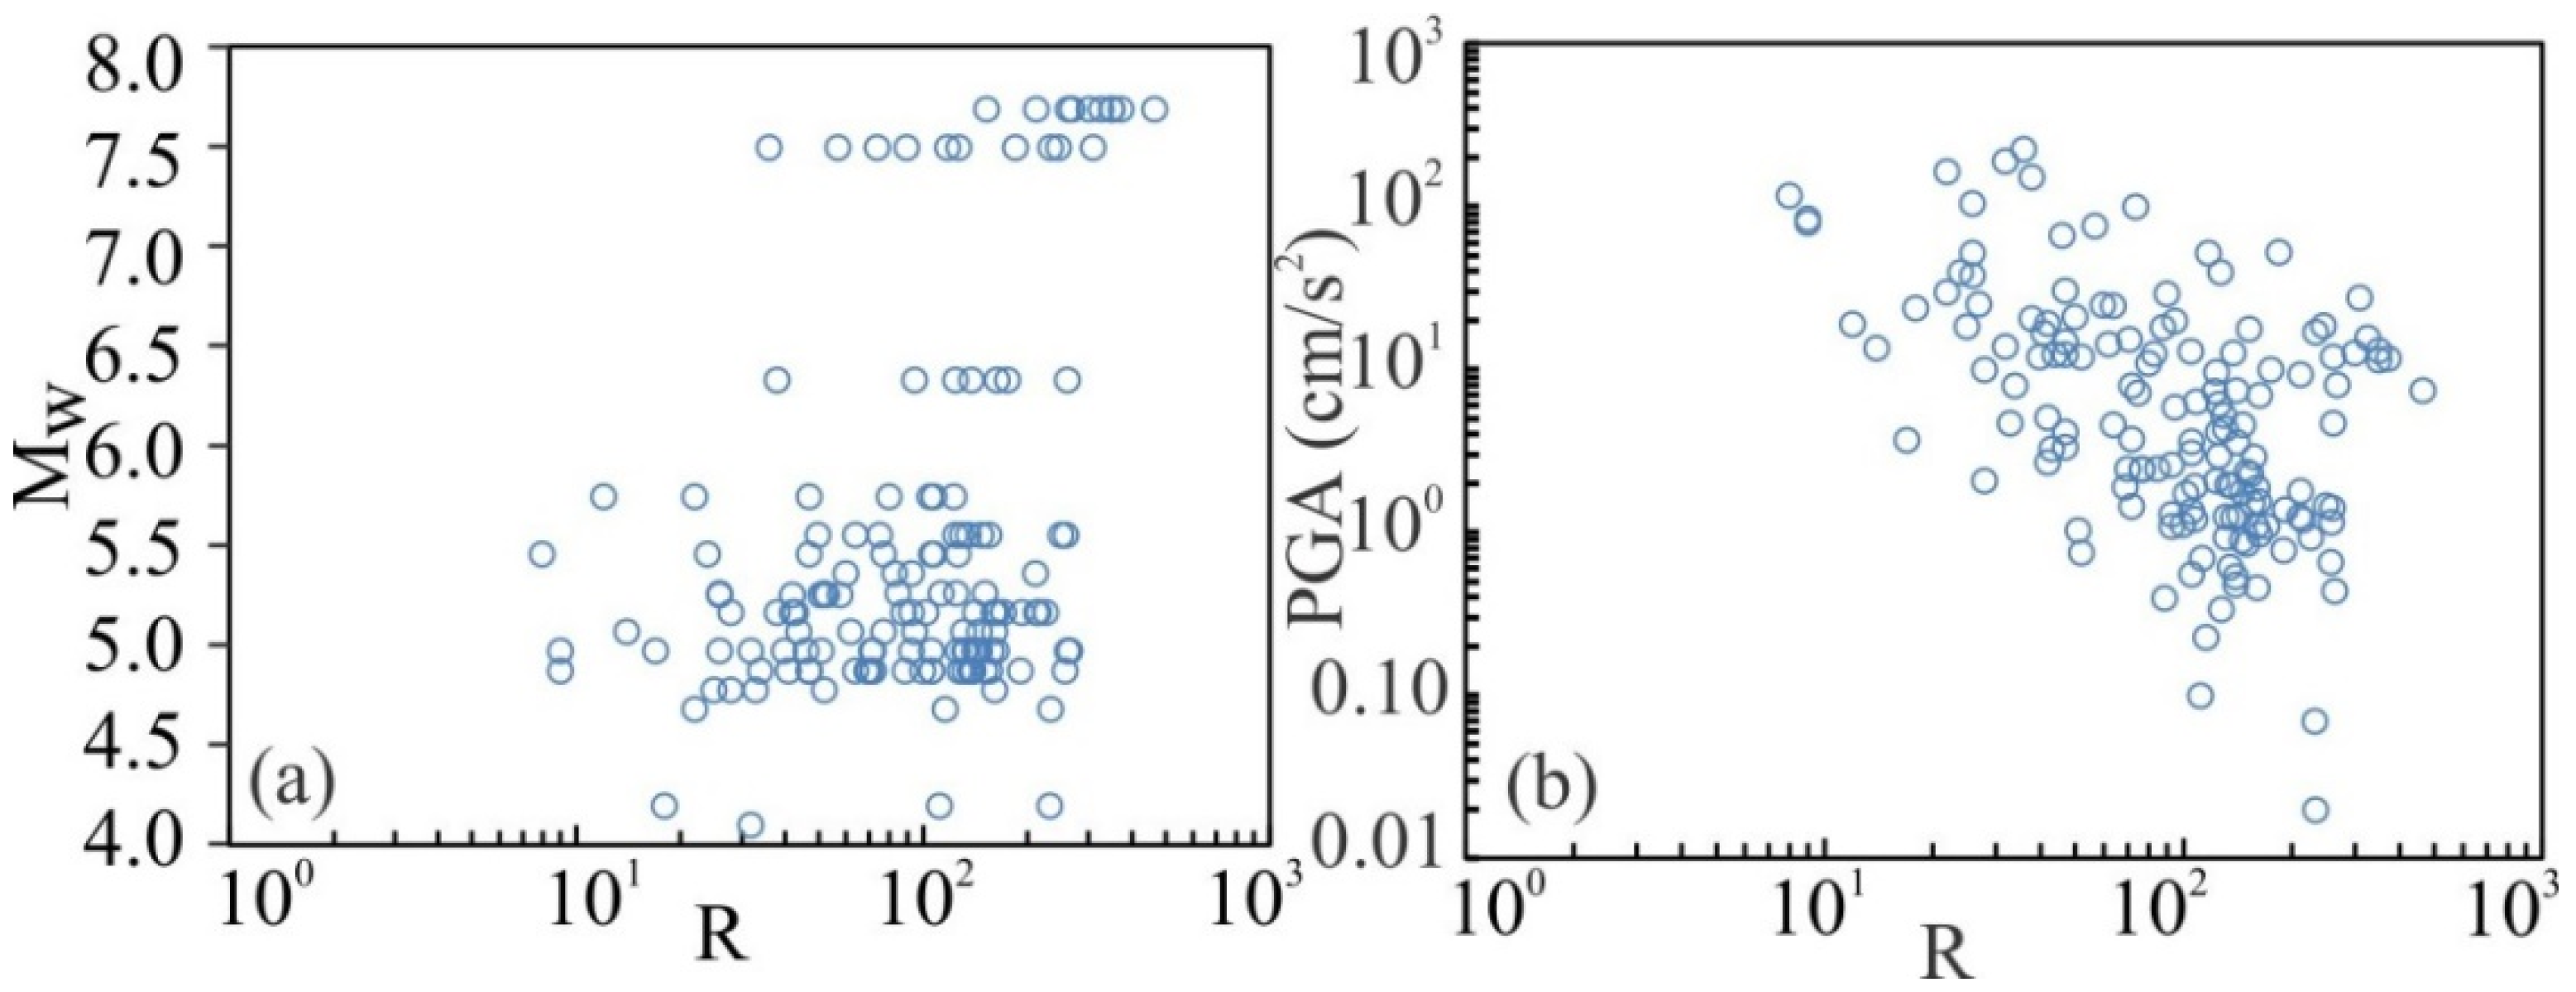
The strong motion data of Pakistan earthquakes have serious drawbacks due to the fact that they are mainly available from other studies, and few records come directly from the local arrays because the Pakistan agencies responsible for maintaining the recording stations do not share data. In this study, an effort was made to collect these data. The compiled data belong to small-to-moderate-magnitude earthquakes, except for 20 records of Kashmir (2005, Mw = 7.6, focal depth = 26 km) and Awaran (2013, Mw = 7.7, focal depth 15 km) earthquakes. The dataset has coverage from 2005 to 2018, and in Figure 1, only the epicenters of these earthquakes have been plotted. This dataset mostly consists of multiple recordings made at different locations for an earthquake evident form Appendix A. The dataset consists of 147 records with Mw between 4.1 and 7.7 and distances between 8 and 466 km. The datasets were retrieved only in terms of the PGA of the time histories, from the NCEG network (5 data), from Shah et al. [4] (128 data) and from the Douglas and Boore [15] paper (14 data). The focal mechanisms were extracted from the Global CMT catalog for 17 earthquakes, and for the rest, a reverse fault mechanism was assumed based on the prevalent faults where the epicenters were located.
Information about the earthquake magnitudes corresponding to the records were obtained from the United States Geological Survey (USGS) and are reported in Appendix A. When the magnitude was reported in different scales, the conversion to Mw was performed with the equations available in the literature concerning Pakistan.
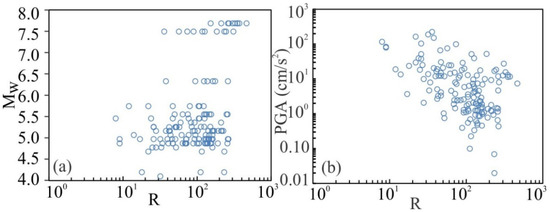
The distributions of the earthquake magnitudes and PGA values are shown in Figure 2 as a function of the distance from the source. There were only five records with a PGA value greater than 100 cm/s2, and the maximum value in the dataset was 221 cm/s2. The reason for such low values is mainly that in many cases, they were recorded from far away distances, as shown in Figure 2. Even if distances larger than 100–200 km are generally out of the range of interest in GMPEs, strong motion recordings are rare for Pakistan, and we wanted to consider all the available data. The site conditions of the recording stations were defined using the shear wave velocity obtained through the approach of Allen and Wald [16]. For stations with unknown locations, a 310-m/s velocity was assumed. Site characterization information was only available for the NCEG observatory (i.e., VS 30 = 320 m/s).
Figure 2.
Distribution of the magnitude and peak ground acceleration recorded in Pakistan as a function of the epicentral distance from the source (a) showing magnitude distribution (b) showing PGA distribution.
3.2. Ground Motion Prediction Equation Evaluation Methods
A total of 13 GMPEs derived for the active shallow regions of the world were used in this study, which were checked for their suitability to predict PGA values for seismic action in Pakistan. The characteristics of these GMPEs are summarized in Table 1.
Table 1.
Characteristics of considered GMPEs.
3.3. Goodness of Fit Measure
The performance of all the selected GMPEs was evaluated using different measures of goodness of fit measures, which are described in following sections.
3.3.1. Residual Analysis
The residuals of each GMPE were analyzed using Equation (2):
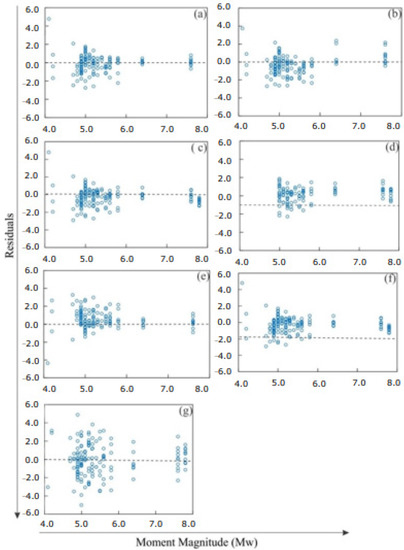
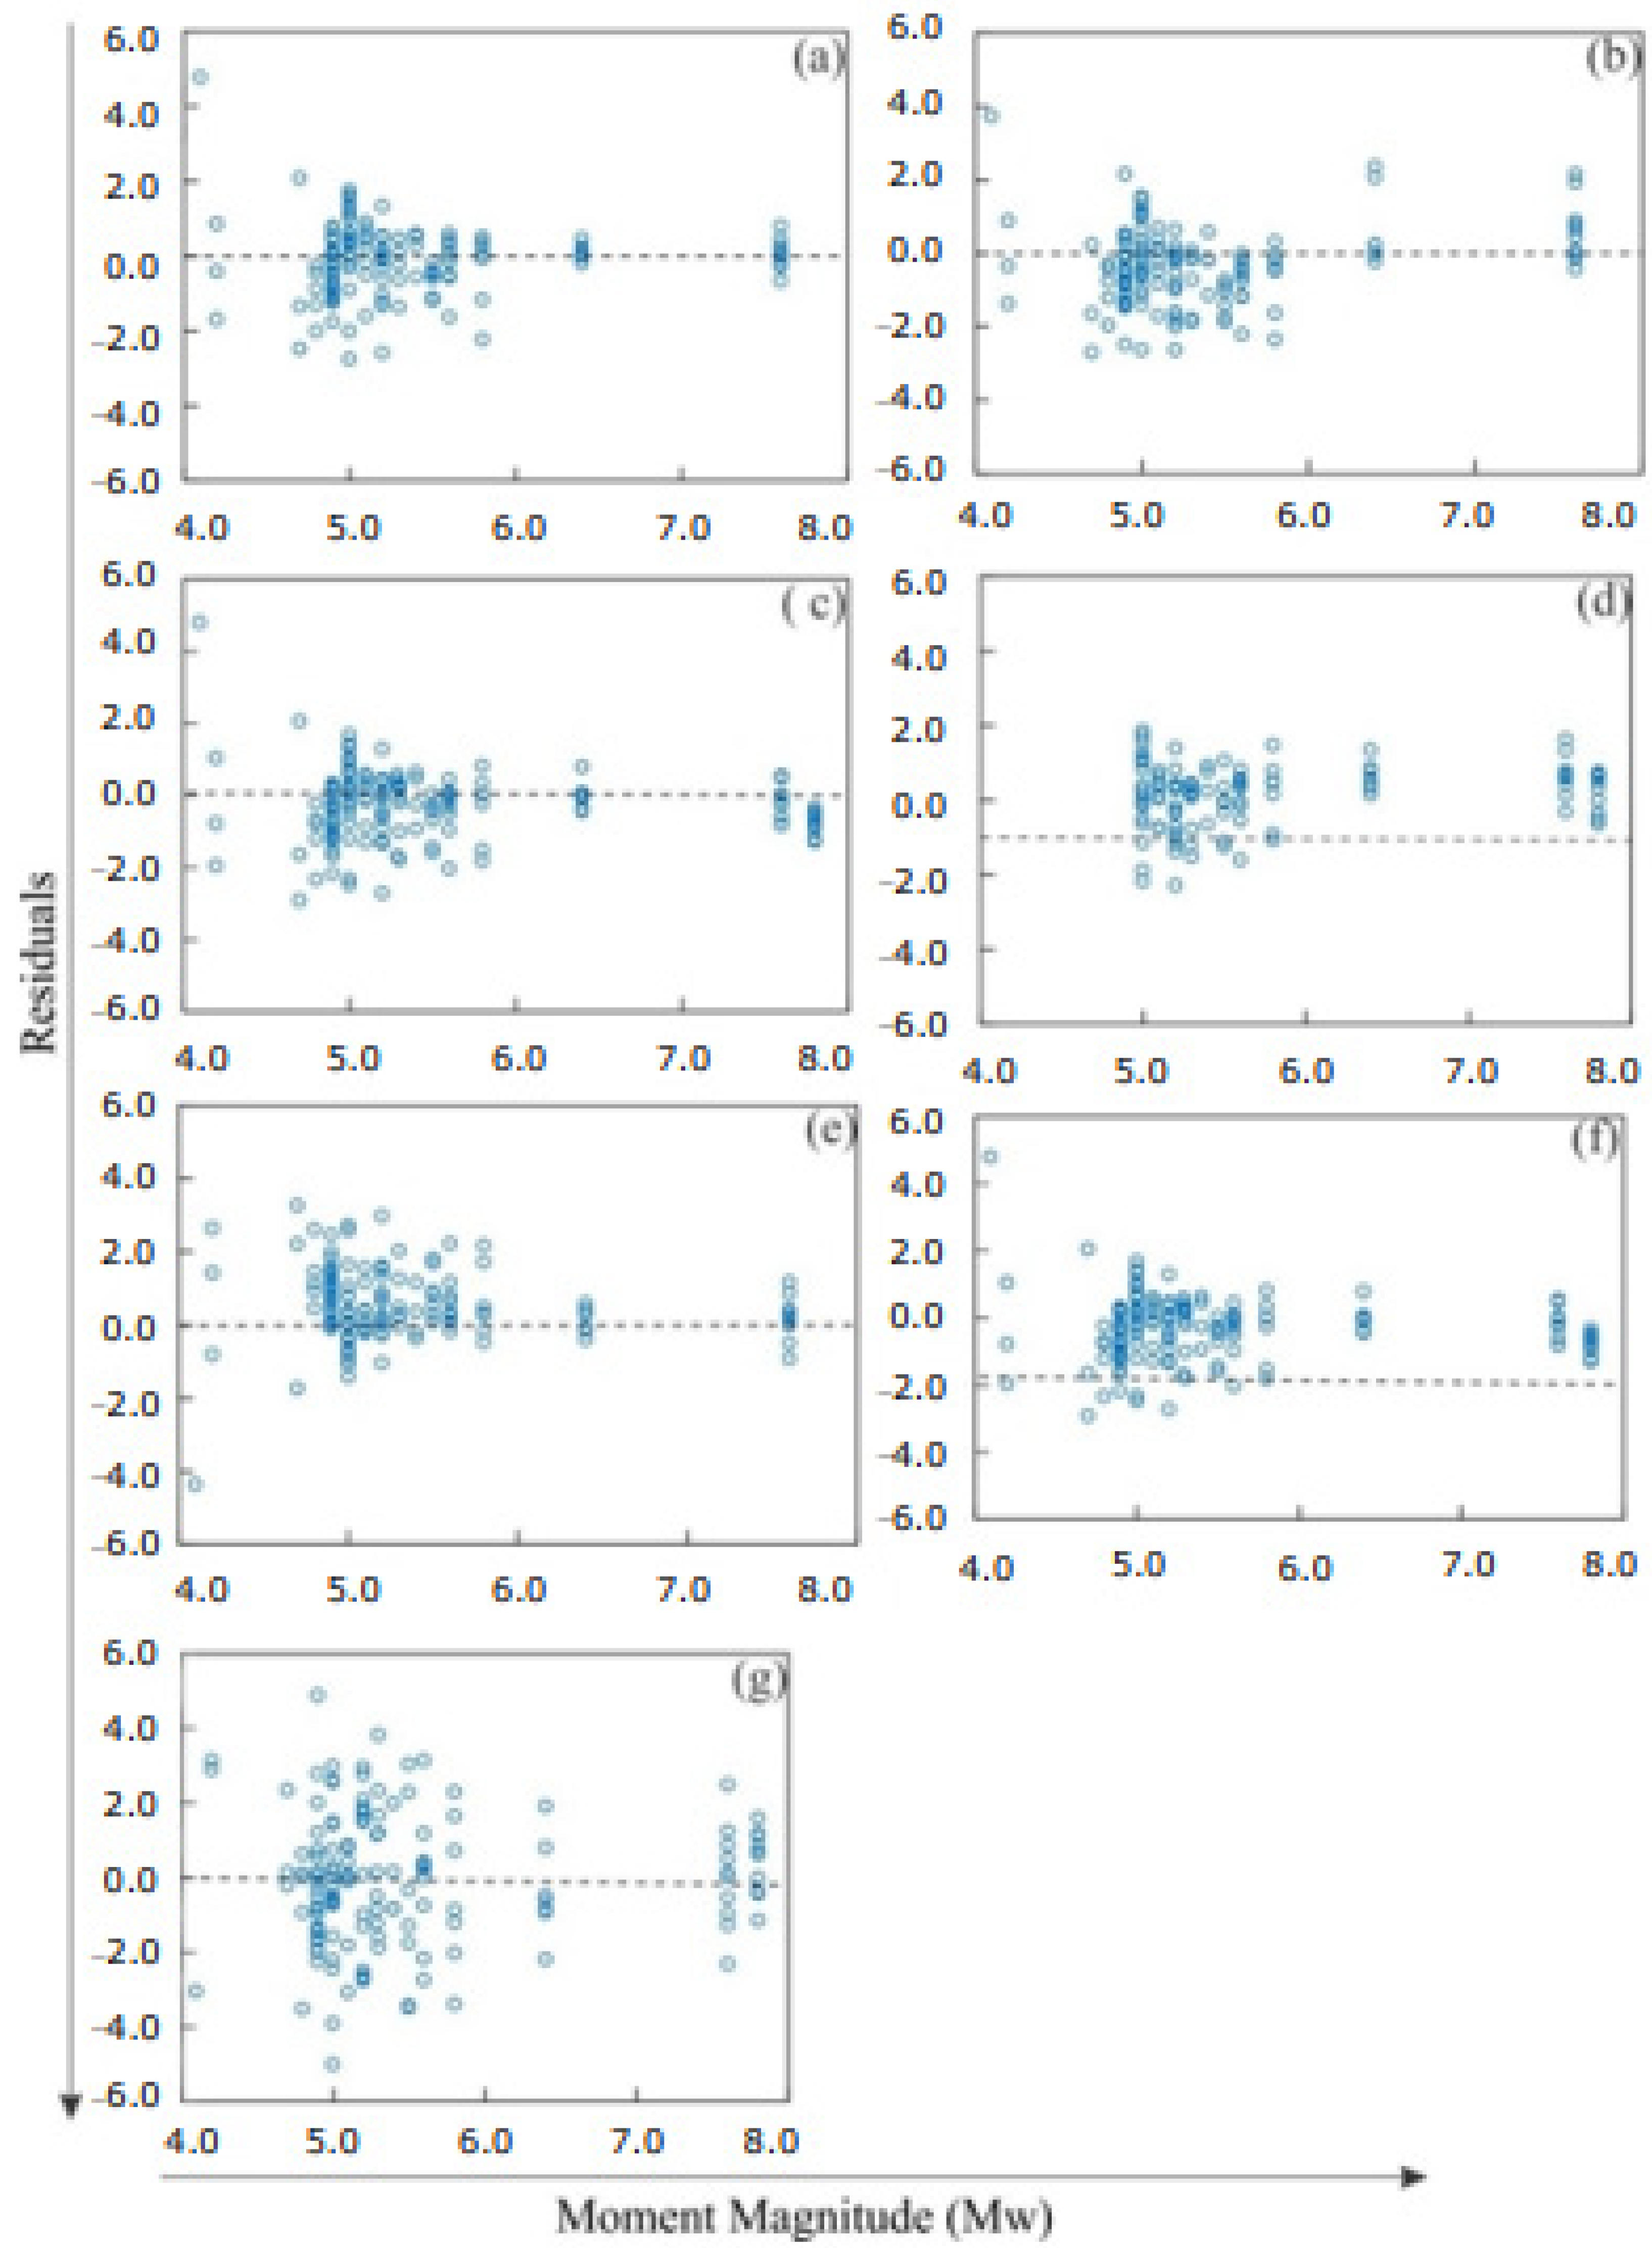
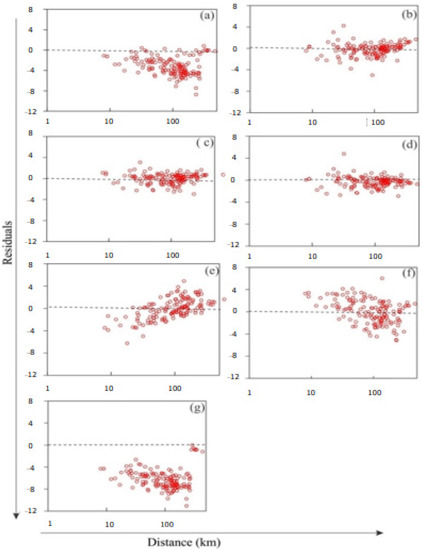
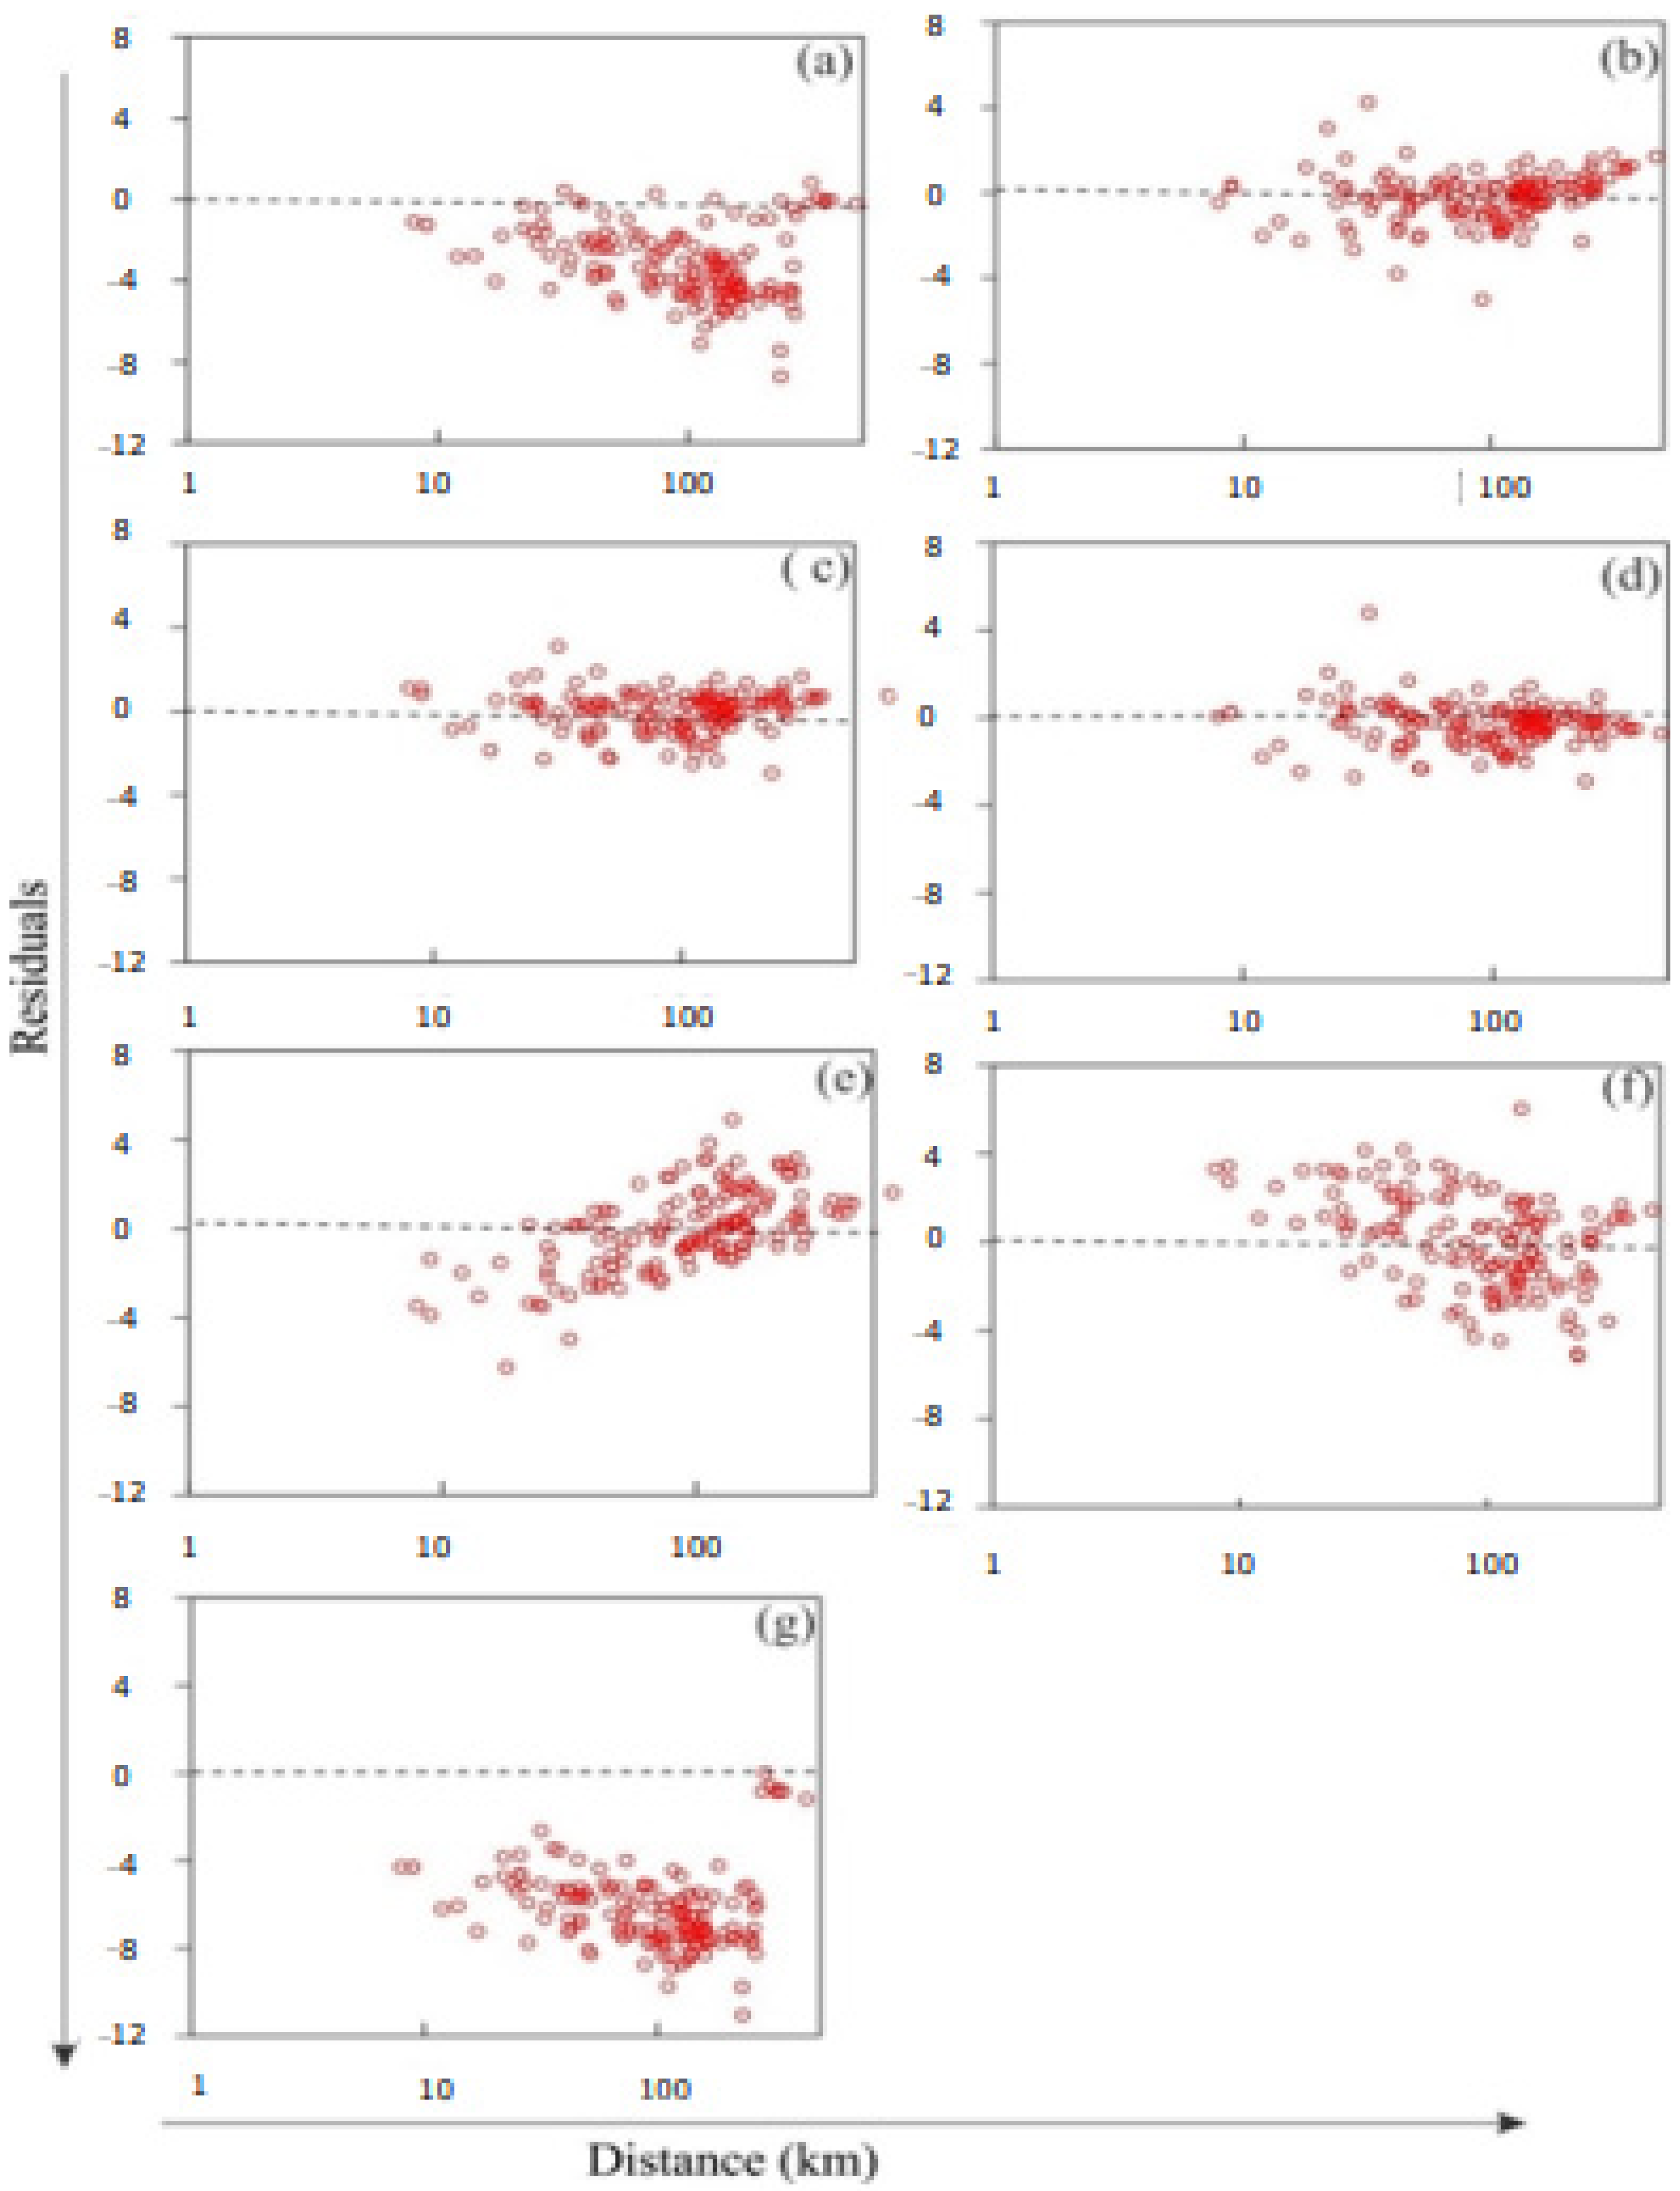
where is the residual, Ypre is the predicted PGA by the GMPE and Yobs is the observed PGA value from the Pakistan database. The negative and positive values of the residuals represent over- and underprediction by the GMPE, respectively. Some examples of the residual plots of the GMPEs as a function of the magnitude and respective distance are shown in Figure 3. The epicentral distance was assumed to be the Joyner and Boore and hypocentral distance (Rhyp) equal to the distance metric Rrup. It can be observed that the ZF18, RK14 and KAN06 [24,26,28] residual plots are scattered with respect to the magnitude (Figure 3) and also with respect to the distance (Figure 4) while the CZ15, BA14 and AK14 [17,21,27] plots show balanced predictions with respect to the magnitude, but the residual distribution of AK14 [21] with respect to the distance is also not particularly balanced. The mean residual values and their standard deviation were calculated. These values indicate that AK14, CZ15, ID14, RK14 and SH12 [4,17,18,21,26,27] had the smallest mean residual values and the lowest standard deviations.
Figure 3.
Residual plots of some selected GMPEs as a function of magnitude: (a) AK14, (b) BA14, (c) CZ15, (d) ID14, (e) RK14, (f) ZF18 and (g) KAN06.
Figure 4.
Residual plots of some selected GMPEs as a function of distance (lnR) in kilometers: (a) AK14, (b) BA14, (c) CZ15, (d) ID14, (e) KAN06, (f) ZF18 and (g) RK14.
3.3.2. Likelihood (LH) Method
The method proposed by Scherbaum et al. [5] assesses the overall performance of GMPEs in a complete sense (Scasserra et al. [29]). It was proposed for the selection and ranking of GMPEs for a rational assignment of weights on a logic tree for a target region. This method scales the performance of GMPEs as an exceedance probability known as the likelihood (LH) value, ranging between 0 and 1.
An LH value of 0.5 is attained for situations where the predictive equation matches the observed dataset perfectly in terms of the mean and standard deviation values. This procedure is also known as the likelihood (LH) method, and it is based on the normalized residual and the standard normal distribution. The final outcome of the LH method is obtained as the median LH (MEDLH), median normalized residual (MEDNR), mean normalized residual (MEANNR) and standard deviation of the normalized residual (STDNR) for the GMPEs.
The misfit between the predicted and observed values is determined by an error function (i.e., LH value) computed by Equations (3) and (4) as proposed by Scherbaum et al. [5]:
The LH values are computed as an error function between the two limits given in the above equation. Z is the normalized residual, and Erf is the error function between the lower and upper limit. xi is the observed value, xj is the predicted one, and σ is the standard deviation. The results of the LH method, given in Table 2, indicate that AK14 [21] and SH12 [4] obtained the highest grade (i.e., category A), followed by CZ15 [27] in category B and ID14, GK15 and RK14 in category C. SH12 [4] also attained a high score because the data used in the test came from Pakistan. The remaining GMPEs yielded the lowest ranking of category D. All the equations were tested within the magnitude and distance ranges for which they were derived. The ranking criteria of categories A, B, C and D were outlined by Scherbaum et al. [5] and are not repeated here.
Table 2.
Ranking of the GMPEs by the LH method.
3.3.3. Log Likelihood (LLH) Method
The method proposed by Scherbaum et al. [6] also known as the LLH method, is an informational theoretical approach based on the log likelihood method to measure the misfit between two probability density functions representing the observed and estimated ground motion data. In the LLH method, these two functions are represented by f(x) and g(x), where f(x) represents the log normal distribution of the observed data and g(x) is the log normal distribution of the data predicted by the GMPE.
The log normal distribution is assumed for both the observed and predicted values. The difference between the predicted and observed data is represented by the LLH values given by Equation (5):
where N is the total number of data points considered. A small LLH value indicates a good relationship between the predictive model and the observed data.
The average LLH value was computed using the above equation for all candidate GMPEs. The observed and predicted values were evaluated in natural log units. The standard deviations of the GMPEs reported in common log units were converted to natural log units. The ranking of all the equations by the LLH method is shown in Table 3.
Table 3.
Ranking of the GMPEs by the LLH method.
3.3.4. Euclidean Distance-Based Ranking (EDR) Method
This method, proposed by Kale and Akkar [8], is also known as the EDR method and is based on the Euclidean distance given by Equation (6):
It is the square root of the sum of the squares of the differences between the N data pairs of the log-observed (pi) and log-predictive (qi) values. The behavior of the median value predicted by the GMPE and the observed data is represented by the following Kappa term in Equation (7):
The k value in Equation (7) is the ratio of the original and corrected Euclidean distances (DE). Ideally, the value of k is 1.0, and its higher values indicate a bias in the median value predicted by the GMPE. There are two DE values required to determined k: DEoriginal and DEcorrected. The k value measures the bias between the observed and predicted data.
The DEorignal value was computed from Equation (6), while DEcorrected was obtained from the observed data, and the corresponding value estimation was obtained by a linear fitting between the observed and estimated values.
The EDR method assumes a log normal distribution and accounts for the influence of sigma on the estimated ground motion and the bias between the observed data and the median in Equation (8).
Mathematically, we have
where the Modified Euclidean Distance (MDE) is the probability-based average that takes sigma into consideration while testing the GMPEs. We also have
where, Pr(|D|) < |dj| is the occurrence probability of “|D|”, which is less than dj. “D” is a random variable, and the difference between the observed value and the prediction by the GMPEs and dj is a discrete value of “D”. A smaller EDR value implies better representation of the observed data by the respective relationship. The EDR method results are given in Table 4.
Table 4.
EDR method results.
4. Results and Discussion
The goodness of fit tools discussed above were adopted for the selection of appropriate GMPEs using the available earthquake dataset in the shallow active regions of Pakistan. Residual analysis of the GMPEs showed that ZF18, BI14 and GK14 [23,24,25] mostly underpredicted the given dataset, while the other GMPEs showed a balanced prediction performance. The residuals shown in Figure 3 and Figure 4 were not normalized with the standard deviation values of the respective GMPEs. Due to this, we did not want to consider the effect of the standard deviations on the performance of the GMPEs.
Considering the LH method (Table 2), SH12 and AK14 [4,21] reached the category A, CZ15 [27] fell into category B, and ID14, GK15 and RK14 [18,25,26] reached category C, while all the rest were placed in category D. The GMPEs from the neighboring countries (i.e., ZF18 and RK14 [24,26]) did not perform well and were ranked extremely low on the list. The GMPEs from California (NGA) were also ranked extremely low, except for ID14 [18].
The results of the ranking by the LHH method are reported in Table 3, and they suggest the GMPEs of CZ15, AK14, CB14, ID14 and SH12 [4,17,18,21,27] as the most feasible candidates, having the lowest LLH values. The results of the LHH method did not fully complement the LH method. As an example, the GMPE CZ15 [27] performed quite well based on the LLH method, while the LH method placed it in class B. However, it was also observed that for the top five GMPEs, the difference in LLH values was very small, ranging from 1.42 to 1.78. The EDR method indicated CZ15 [27] as the best GMPE in predicting the observed dataset, followed by AK14, KAN06, BI14 and AB10 [21,22,28], with a score ranging from 0.57 to 0.96.
In conclusion, the GMPEs recommended by all three evaluation procedures were AK14 [21] and CZ15 [27]. They were placed in categories A and B by the LH method, respectively, first under the LLH method and second when using the EDR methods.
The mean values of the residuals of the GMPEs were generally negative, indicating overprediction of the GMPEs in the given dataset, except for CY14, KAN06 and RK14 [20,26,28]. AK14 [21] had the lowest absolute mean of the residuals.
The final recommendation about the GMPEs was made based on the following:
- GMPEs qualified in all LH, EDR and LHH methods (category I);
- GMPEs recommended by at least two methods (category II).
In category I, the EDR and LLH qualifying score means that the corresponding GMPE is ranked among the top five. The LH qualifying score means that the GMPE has not attained category D. Category II means that the GMPE is ranked in the top five grades by the LHH and EDR methods.
The GMPEs of CZ15 [27] and AK14 [21] were recommended by all three procedures (category I), while the GMPEs of CB14, ID14 and SH12 [4,18,19] were recommended by the LH and LLH methods, respectively (category II). SH12 [4] was also suggested by two procedures, but it was not included in the final recommendation due to its inappropriate functional form. A summary of the ranking of the selected GMPEs is presented in Table 5.
Table 5.
Scores of the GMPEs according to the different methods considered.
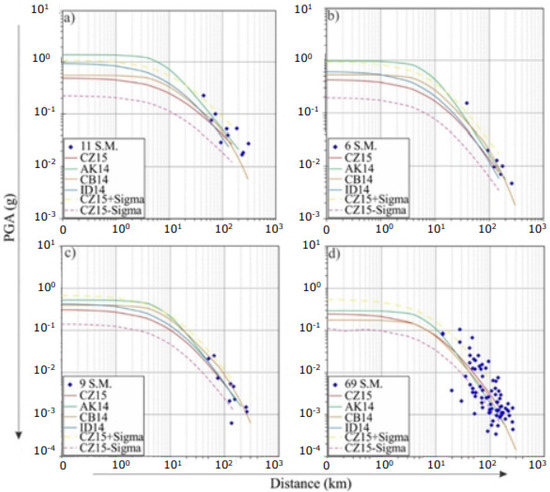
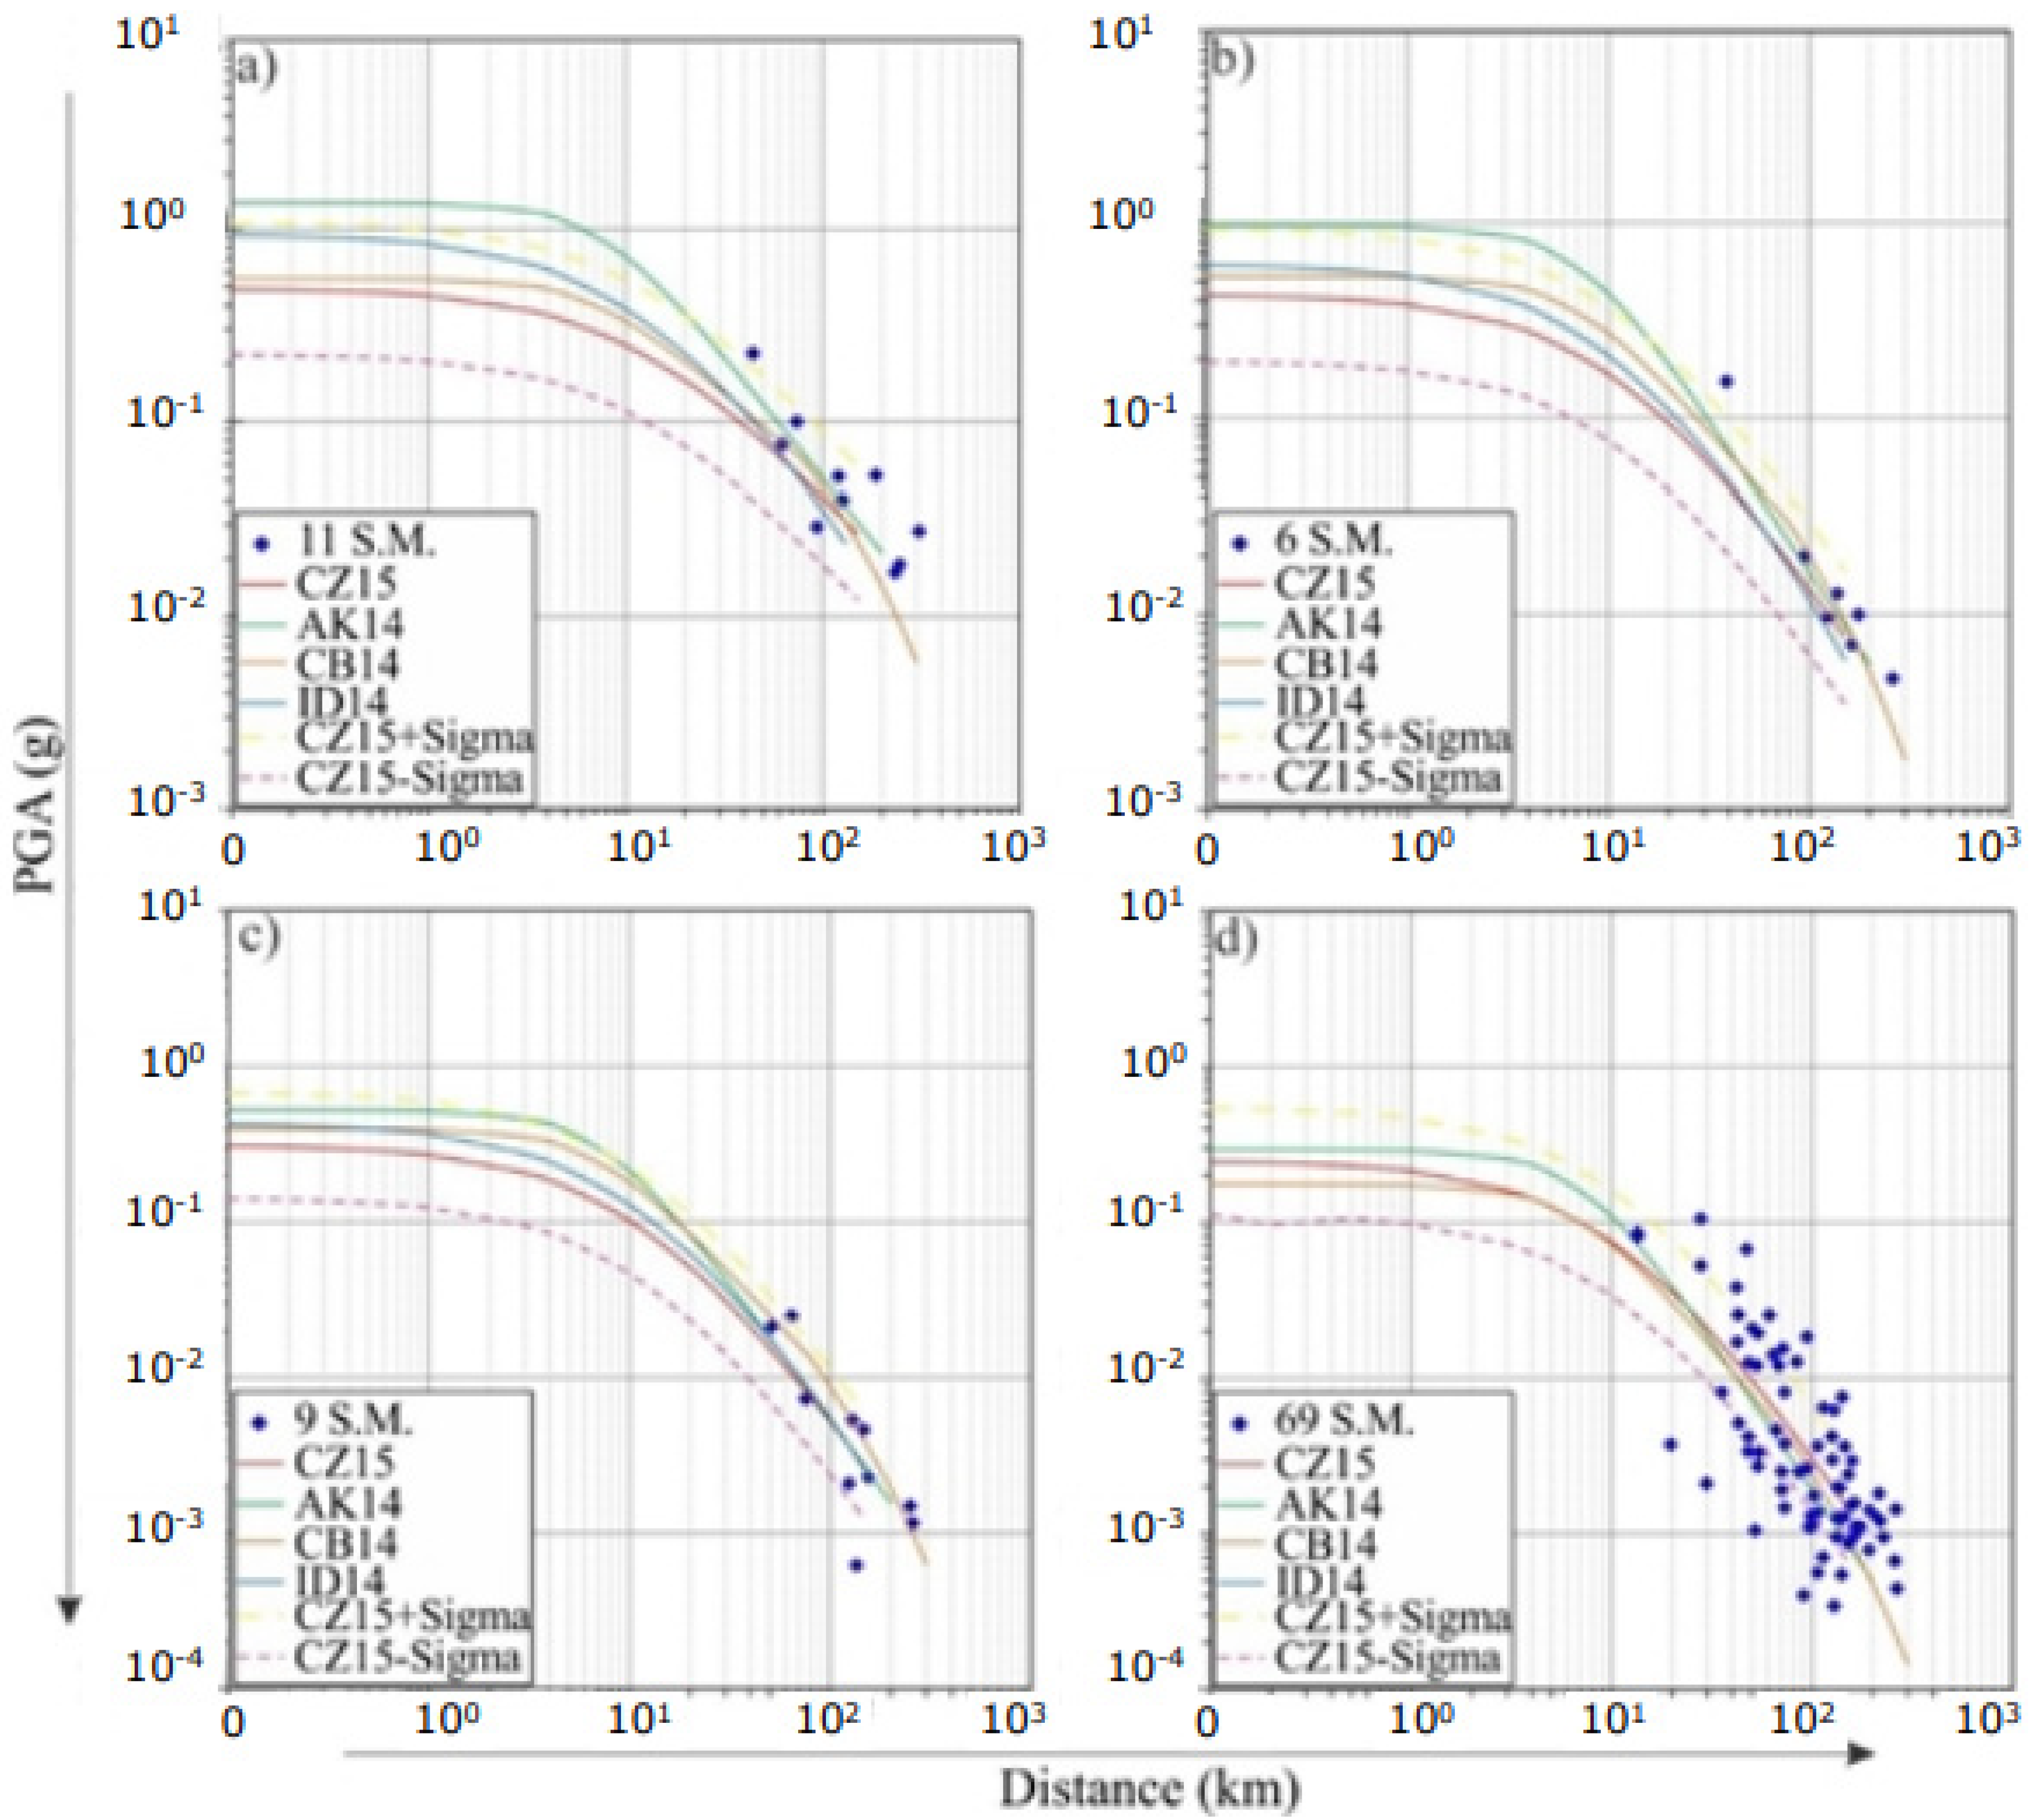
A comparison of the four selected GMPEs (i.e., CZ15, AK14, CB14 and ID14 [18,19,21,27]) with the recorded strong motion data (SM) is shown in Figure 5. A total of 97 PGA values were plotted against the GMPEs for the rock site conditions (i.e., Vs = 800 m/s) and reverse fault mechanism. The median predicted values were used in the plots, and the GMPEs were applied within the magnitude and distance ranges for which they were derived. The selected GMPEs exhibited good agreement with the local strong motion data.
Figure 5.
Comparison of the recommended GMPEs with the Pakistan PGA strong motion data (S.M.) in terms of distance and for different classes of magnitude: (a) Mw 7.6, (b) Mw 6.4, (c) Mw 5.6 and (d) Mw 4.9, 5.0, 5.2 and 5.3.
It can be observed that four distinct tectonic regions exist in Pakistan: (1) active shallow regions, (2) shallow subduction, (3) stable continental and (4) deep sub-crustal regions. Therefore, at least four different types of GMPEs are required to implement seismic hazard assessments in Pakistan. Earthquake records are mostly available in the shallow active regions, and for other tectonic regions in Pakistan, GMPEs must be selected from the literature. Since the Hindukush region is a very active deep crustal source, there are several data records through the NCEG network, but they are mainly far field records. Data-driven testing can be carried out with these data records to suggest feasible candidate GMPEs for Hindukush.
The limitation of this work is the usage of PGA data only for evaluation of the global round motion prediction equations, as spectral acceleration were not available for the recorded data in Pakistan. This was due to the absence of data sharing by the department responsible for the recording and sharing of data in Pakistan. This compiled databank is mostly from the literature, and it was subjected to some evaluation procedures for better understanding of the performance of global ground motion prediction equations in the shallow active regions in Pakistan. The absence of near field strong motion data is another key limitation of the compiled databank. These limitations can be overcome as more and more data become available in the future, and with the current state, this was the best databank that could be compiled for this exercise.
Seismic site classes based on direct measurement of the shear wave velocity from the recording stations were also not available, and an indirect procedure using the topographic slope proxy as measure of the shear wave velocity profile at the station location was created. This is one of the limitations of the current study. Moreover, direct measurement of the site classes of the recording stations will increase the accuracy of the strong motion data in Pakistan further.
Faults are also not characterized well in Pakistan, as their dip and strike directions and their values limit the uncertainties of data in Pakistan. The availability of this data will enhance the accuracy of the results in the use of the site to source distance metrics for studying GMPEs. In this study, the hypocentral and epicentral distances were considered equivalent metrics for the site-to-source distances used by the GMPEs under study.
The exact locations of some of the stations maintained by the MSSP were also missing this data, and its absence presents a limitation of this study.
Information on the combination rule for the two horizontal components was also not available for the strong motion data compiled in this study. These all are the limitations of this study.
5. Conclusions
A total of 147 PGA values recorded in the shallow active region of Pakistan were used to form a strong motion dataset for Pakistan. This dataset was used in this work for the selection and ranking of the global GMPEs available in the literature which were suitable to be adopted in Pakistan. The major contribution to the analyzed dataset was extracted from the literature because, due to a lack of coordination, strong motion data records are not shared by the agencies operating seismic arrays in Pakistan. This is also the reason why only PGA values are available, and they were used as a ground motion intensity measure. The methods of Scherbaum et al. [5,6] and Kale and Akkar [8] were used to perform data-driven testing on the available dataset. With the use of three different tests, we found that four global GMPEs could be employed in seismic hazard studies for the shallow active regions of Pakistan. Two of these GMPEs (i.e., CZ15 and AK14 [21,27]) had the best rankings and were classified into category I. In addition, a further two (ID14 and CB14 [18,19]) had acceptable rankings, even though they were classified into category II.
Since the Pakistan dataset is not very large, and the seismic site information was not directly available, our suggestion is to use all four of the selected GMPEs combined in a logic tree to appropriately consider their epistemic uncertainty. The GMPEs classified in category I could carry higher weights compared with the category II GMPEs. Category I GMPEs may be assigned weights of 70%, and those in category II may be assigned weights of 30% on the logic tree. The weights proposed are based on expert judgement.
Direct measurement of the seismic site class was not available, and a slope proxy was used to extract the values. Recording stations with unknown exact locations were assigned a shear wave velocity of 310 m/s. The strong motion data lacks near-source data. These are all the limitations of this study.
Author Contributions
Conceptualization, M.W., F.S..; data curation, M.W., Z.U.R. and I.A.; formal analysis, M.W., Z.U.R., I.A. and M.M.S.S.; investigation, F.S., Z.U.R., I.A. and M.A.; methodology, M.W., F.S., Z.U.R., M.A. and M.M.S.S.; project administration, M.A. and M.M.S.S.; resources, M.M.S.S.; software, M.W., Z.U.R. and I.A.; supervision, F.S.; validation, F.S.; visualization, F.S., I.A.; writing—original draft, M.W. and F.S., M.A. All authors have read and agreed to the published version of the manuscript.
Funding
This research is partially funded by the Ministry of Science and Higher Education of the Russian Federation as a part of World-Class Research Center Program: Advanced Digital Technologies (Contract No. 075-15-2022-311, dated 20 April 2022).
Institutional Review Board Statement
Not Applicable.
Informed Consent Statement
Not Applicable.
Data Availability Statement
The data that support the findings of this study are available within the article.
Conflicts of Interest
All the authors have seen the final version of the paper and have declared no potential conflicts of interest regarding the publication of this research work in its current form.
Appendix A
It must be remarked that that the site characterization of the recording stations was not available, and the corresponding definition was extracted from the topographic slope based on the approach of Allen and Wald (2009). The seismic site definition of records from Boore and Douglas (2018) was adopted as reported by their study. It was observed that the site conditions of the recording stations generally varied from soil (180 m/s < Vs < 360 m/s) to soft rock conditions (360 m/s < Vs < 760 m/s). The seismic site conditions are mentioned in the Appendix A to the paper.
Definitions of the site-to-source distances for the records in the databank were available as epicentral and hypocentral distances (i.e., Repi and Rhpo). GMPEs with epicentral and hypocentral formulations were preferred over their formulation in terms of RJB and Rhpo (i.e., AK14 and BI14). For the rest of the GMPEs, the epicentral distance was set equal to RJB, and Rhpo was considered equivalent to Rrup.
The PGA values had a major contribution from SH12, though information was not available about the type horizontal component in SH12 concerning whether the reported PGA values were the largest of two components or the geometric mean of the two horizontal components. The NCEG dataset was the geometric mean of the horizontal components.
Table A1.
Strong motion databank used in the evaluation of predictive equations.


References
- Sabetta, F.; Waseem, M.; Khan, N.A.; Lodi, S.H.; Rafi, M.M.; Asif, M.A.; Briseghella, B.; Nuti, C. A proposal for a new formulation of the Pakistan seismic design action. In Proceedings of the 1st South Asia Conference on Earthquake Engineering (SACEE’19), Karachi, Pakistan, 21–22 February 2019. Paper No. 51. [Google Scholar]
- Joyner, W.B.; Boore, D.M. Peak horizontal acceleration and velocity from strong motion records including records from the 1979 Imperial Valley California Earthquake. Bull. Seismol. Soc. Am. 1981, 71, 2011–2038. [Google Scholar] [CrossRef] [Scilit]
- Joyner, W.B.; Boore, D.M. Methods of regression analysis of strong motion data. Bull. Seismol. Soc. Am. 1993, 83, 469–487. [Google Scholar] [CrossRef] [Scilit]
- Shah, M.A.; Iqbal, T.; Qaiser, M.; Ahmed, N.; Tufail, M. Development of Attenuation for North Pakistan. In Proceedings of the 15th World Earthquake Conference on Earthquake Engineering (15WCEE), Lisbon, Portugal, 24–28 September 2012. [Google Scholar]
- Scherbaum, F.; Cotton, F.; Smit, P. On the use of response spectral reference data for the selection and ranking of ground-motion models for seismic hazard analysis in regions of moderate seismicity: The case of rock motion. Bull. Seismol. Soc. Am. 2004, 94, 1–22. [Google Scholar] [CrossRef] [Scilit]
- Scherbaum, F.; Delavaud, E.; Riggelsen, C. Model selection in seismic hazard analysis: An information-theoretic perspective. Bull. Seismol. Soc. Am. 2009, 99, 234–3247. [Google Scholar] [CrossRef] [Scilit]
- Danciu, L.; Kale, Ö.; Akkar, S. The 2014 earthquake model of middle east: Ground motion model and uncertainties. Bull. Earthq. Eng. 2018, 16, 3497–3533. [Google Scholar] [CrossRef] [Scilit]
- Kale, O.; Akkar, S. A novel procedure for selecting and ranking candidate ground motion prediction equations for seismic hazard analysis: Euclidean distance based ranking (EDR) method. Bull. Seismol. Soc. Am. 2013, 103, 1069–1084. [Google Scholar] [CrossRef] [Scilit]
- Zafarani, H.; Farhadi, A. Testing ground motion prediction equations for small to moderate earthquakes magnitude data in Iran. Bull. Seismol. Soc. Am. 2007, 107, 912. [Google Scholar] [CrossRef] [Scilit]
- Anbazhagan, P.; Sreenivas, M.; Ketan, B.; Moustafa, S.S.R.; Al-Arifi, N.S.N. Selection of Ground Motion Prediction Equations for Seismic Hazard Analysis of Peninsular India. J. Earth Eng. 2015, 20, 699–737. [Google Scholar] [CrossRef] [Scilit]
- Giardini, D.; Danciu, L.; Erdik, M.; Şeşetyan, K.; Tümsa, M.B.D.; Akkar, S.; Gülen, L.; Zare, M. Seismic hazard map of the Middle East. Bull. Earthq. Eng. 2018, 16, 3567–3570. [Google Scholar] [CrossRef] [Scilit]
- Farahani, S.; Behnam, B.; Tahershamsi, A. Macrozonation of seismic transient and permanent ground deformation of Iran. Nat. Hazards Earth Syst. Sci. 2020, 20, 2889–2903. [Google Scholar] [CrossRef] [Scilit]
- Allen, M.; Jackson, J.; Walker, R. Late Cenozoic reorganization of the Arabia-Eurasia collision and the comparison of short-term and long-term deformation rates. Tectonics 2004, 23, 1–16. [Google Scholar] [CrossRef] [Scilit]
- Kazmi, A.H.; Jan, M.Q. Geology and Tectonics of Pakistan; Graphic Publishers: Karachi, Pakistan, 1997. [Google Scholar]
- Douglas, J.; Boore, D.M. Peak ground accelerations from large (M ≥ 7.2) shallow crustal earthquakes: A comparison with predictions from eight recent ground-motion models. Bull. Earthq. Eng. 2018, 16, 1–21. [Google Scholar] [CrossRef] [Scilit]
- Allen, T.I.; Wald, D.J. Topographic Slope as a Proxy for Global Seismic Site Conditions (VS 30) and Amplification around the Globe; U.S. Geological Survey Open-File Report 2007-1357; USGS: Reston, VA, USA, 2007; 69p.
- Boore, D.M.; Stewart, J.P.; Seyhan, E.; Atkinson, G.M. NGA West 2 equations for predicting PGA, PGV, and 5% damped PSA for shallow crustal earthquakes. Earthq. Spectra 2014, 30, 1057–1085. [Google Scholar] [CrossRef] [Scilit]
- Idriss, I.M. An NGA-West 2 empirical model for estimating the horizontal spectral values 724 generated by shallow crustal earthquakes. Earthq. Spectra 2014, 30, 1155–1177. [Google Scholar] [CrossRef] [Scilit]
- Campbell, K.W.; Bozorgnia, Y. NGA-West2 ground motion model for the average horizontal components of PGA, PGV, and 5%-damped linear acceleration response spectra. Earthq. Spectra 2014, 30, 1087–1115. [Google Scholar] [CrossRef] [Scilit]
- Chiou, B.; Youngs, R.R. Update of the Chiou and Youngs NGA model for the average horizontal component of peak ground motion and response spectra. Earthq. Spectra 2014, 30, 1117–1153. [Google Scholar] [CrossRef] [Scilit]
- Akkar, S.; Sandıkkaya, M.A.; Bommer, J.J. Empirical ground motion models for point-and extended-source crustal earthquake scenarios in Europe and the Middle East. Bull. Earthq. Eng. 2014, 12, 359–387. [Google Scholar] [CrossRef] [Scilit]
- Akkar, S.; Bommer, J.J. Empirical equation for prediction of PGA, PGV and Spectral Acceleration in Europe, the Mediterranean region and the Middle East. Seismol. Res. Lett. 2010, 81, 173–215. [Google Scholar] [CrossRef] [Scilit]
- Bindi, D.; Massa, M.; Luzi, L.; Ameri, G.; Pacor, F.; Puglia, R.; Augliera, P. Pan-European ground-motion prediction equations for the average horizontal component of PGA, PGV, and 5%-damped PSA at spectral periods up to 3.0 s using the RESORCE dataset. Bull. Earthq. Eng. 2014, 12, 391–430. [Google Scholar] [CrossRef] [Scilit]
- Zafarani, H.; Luzi, L.; Lanzano, G.; Soghart, M.R. Empirical equations for the prediction of PGA and pseudo spectral accelerations using Iranian strong-motion data. J. Seismol. 2018, 22, 263–285. [Google Scholar] [CrossRef] [Scilit]
- Graizer, V.; Kalkan, E.O. Update of the Graizer-Kalkan Ground Motion Prediction Equations for Shallow Crustal Continental Earthquakes; U.S. Geological Survey Open-File Report; USGS: Reston, VA, USA, 2015; 79p. [CrossRef] [Scilit]
- Raghukanth, S.T.G.; Kavitha, B. Ground Motion Relations for Active Regions in India. Pure App. Geop. 2014, 171, 2241–2275. [Google Scholar] [CrossRef] [Scilit]
- Cauzzi, C.; Faccioli, E.; Vanini, M.; Bianchini, A. Updated predictive equations for broadband (0.01–10 s) horizontal response spectra and peak ground motions, based on a global dataset of digital acceleration records. Bull. Earthq. Eng. 2015, 13, 1587–1612. [Google Scholar] [CrossRef] [Scilit]
- Kanno, T. A New Attenuation Relation for Strong Ground Motion in Japan Based on Recorded Data. Bull. Seism. Soc. Am. 2006, 96, 879–897. [Google Scholar] [CrossRef] [Scilit]
- Scasserra, G.; Stewart, J.P.; Bazzurro, P.; Lanzo, G.; Mollaioli, F. A comparison of NGA ground-motion prediction equations to Italian data. Bull. Seismol. Soc. Am. 2009, 99, 2961–2978. [Google Scholar] [CrossRef] [Scilit]

Publisher’s Note: MDPI stays neutral with regard to jurisdictional claims in published maps and institutional affiliations. |
© 2022 by the authors. Licensee MDPI, Basel, Switzerland. This article is an open access article distributed under the terms and conditions of the Creative Commons Attribution (CC BY) license (https://creativecommons.org/licenses/by/4.0/).