Article

Optimum Tilt Angle and Orientation of Photovoltaic Thermal System for Application in Greater Toronto Area, Canada

1
Department of Mechanical Engineering, University of Alaska Anchorage, 3211 Providence Dr., Anchorage, AK 99508, USA
2
Mechanical and Industrial Engineering Department, Ryerson University, Toronto, ON M5B 2K3, Canada
*
Author to whom correspondence should be addressed.
Sustainability 2019, 11(22), 6443; https://doi.org/10.3390/su11226443
Submission received: 17 October 2019 / Revised: 12 November 2019 / Accepted: 13 November 2019 / Published: 15 November 2019
(This article belongs to the Special Issue Photovoltaic Power)

Abstract

:
We present a study conducted to obtain optimum tilt angle and orientation of a solar panel for the collection of maximum solar irradiation. The optimum tilt angle and orientation were determined using isotropic and anisotropic diffuse sky radiation models (isotropic and anisotropic models). The four isotropic models giving varying optimum tilt angles in the range of 37 to 44°. On the other hand, results of the four anisotropic models were more consistent, with optimum tilt angles ranging between 46–47°. Both types of models indicated that the collector tilt should be changed four times a year to receive more solar radiation. The results also indicate that the solar panel should be installed with orientation west or east of due south with a flatter tilt angle. A 15° change in orientation west or east of due south results in less than 1% reduction of the total solar radiation received. For a given optimum tilt angle, the effect of photovoltaic/thermal (PV/T) orientation west or east of due south on the outlet temperature was determined using a one-dimensional steady state heat transfer model. It was found that there is less than 1.5% decrease in outlet temperature for a PV/T panel oriented up to 15° east or west of due south from March to December. This result indicates that existing roofs with orientations angles up to 15° east or west of due south can be retrofitted with a PV/T system without changing the roof shape.

1. Introduction

Solar energy has been recognized as an indigenous and unlimited source of energy. Solar energy boosts sustainability and energy security, leads to pollution reduction, keeps fossil fuel prices lower than otherwise, and lowers the cost of mitigating climate change [1].
The quantity of solar energy received by a photovoltaic (PV) panel is determined by the local insolation and influenced by the orientation and tilt angle of the PV panels [2,3,4,5]. Proper installation of a PV panel, through appropriate inclination and orientation, should maximize the solar radiation received. Tracking systems that follow the course of the sun are used to maximize daily solar energy received by PV panels. However, because these devices are expensive and need energy for their operation it is recommended to find the best tilt and orientation angles. The tilt angle can be corrected from time to time, for example, seasonally [6]. Generally, it is recommended that a PV system should be installed with a tilt angle which is equal to the latitude of the site [2,7].
Models have been proposed by several authors for the determination of the best (optimum) tilt angles. Although the models use the same technique of determining ground reflected and beam radiation they do differ in the way they convert the diffuse component value of a horizontal surface to that of a tilted surface [6,8,9,10]. The diffuse component is assumed to be anisotropic or isotropic. In isotropic models the intensity of the diffuse radiation is assumed to be uniformly distributed over the sky dome. On the other hand, anisotropy of the diffuse radiation in the circumsolar region (sky near the solar disk) plus isotopically distributed diffuse component from the rest of the sky dome is assumed in anisotropic models [10].
Solar radiation prediction on inclined surfaces using both isotropic and anisotropic models has been presented by many researchers [2,6,11,12,13,14,15,16,17,18,19,20]. Benghanem [6] conducted a case study for Madinah, Saudi Arabia. He found that the yearly optimum tilt angle was about the same to latitude of the site. This fixed tilt angle reportedly resulted in about 8% loss of collected energy when compared to the energy collected by tilting the PV monthly. Ulgen [21] reported seasonal variation of the optimum tilt angle for a solar collector in Izmir, Turkey. For winter months, December, January, and February, the optimum tilt angle was found to be 55.7°. For spring months, March, April, and May, the optimum tilt angle was 18.3°. For summer months, June, July, and August, the optimum tilt angle was 4.3° and, finally, for fall months, September, October, and November, the optimum tilt angle was 43°. Beringer et al. [22] conducted an experimental case study of optimum tilt angle of PV systems for Hannover, Germany. They determined that there was a small difference in the performance of PV cells at various tilt angles. They reported a difference of only 6% between yearly average and the summer season, and 10% for the winter season and the yearly average. They reasoned that this was due to the temperature that affects the performance of an open circuit voltage. The reduction in performance of the PV cells was due to higher temperature. Hachem et al. [23] also came to a similar conclusion, and reported that the annual electricity generation of the building integrated photovoltaic/thermal (BIPV/T) system was not significantly affected by a tilt angle that ranged between 30° and 50° for the latitude considered (45° N).
The effect of tilt angle and air pollution on the amount energy collected by a photovoltaic module was investigated by Asl-Soleimani [24] for Tehran, Iran. They found a 30° tilt angle to be the optimum, which is about 5° less than the latitude of the city. Also, they reported that the energy output of the modules was reduced by more than 60% due to the influence of air pollution.
Several researchers have used TRNSYS (Transient System Simulation Tool) simulation to investigate the effect of PV tilt angle and orientation on their performance. The performance of mono-crystalline silicon PV modules at various tilt angles and orientation was investigated using TRNSYS simulation for Cairo, Egypt, by Hussein et al. [25]. They found that south-facing optimum tilt angle to vary between 20–30°. The impact of PV orientation and tilt angle on grid-connect PV performance in maritime climatic conditions was investigated using TRNSYS by Mondol et al [7]. They found that south-facing orientation and a tilt angle of 30° leads to maximum PV output, while east and west orientations with 90° tilt lead to minimum PV output. The monthly optimum tilt angle varied from 10 to 70° [7].
The negative impact of rising temperature on PV output has been reported by many researchers [26,27]. As mentioned previously, Beringer et al. [22] reported that the temperature effect resulted in little differences in the performance (power output) of solar cells at various tilt angles. Circulation of air or water behind PV modules eliminates the heat, leading to enhanced performance of PVs. Photovoltaic/thermal (PV/T) systems enhance the electrical performance and provide thermal energy for use of space heating or domestic hot water heating. As a result, since the mid-1970s, PV/T systems have been researched intensively [28,29,30,31,32,33,34,35,36,37,38,39,40,41,42,43,44,45,46].
The potential of water-based PV/T systems was evaluated by Kazem for the case of Sohar, Oman [47]. He reported that the evaluated PV/T system showed better electrical performance during the testing period, with 6% higher power than a conventionally installed PV panel. Ramos et al. [48] used TRNSYS to evaluate PV/T systems for space and domestic hot water heating application in various European cities. They found that 60% of the heating demand can be met in Seville, Rome, Madrid, and Bucharest. PVT systems coupled with borehole thermal energy storage systems (BTES) were studied by Aldybyan and Chiasson [42], who reported electrical energy efficiency improvements of the PV/T cells by up to 4.7%. Abudullah et al. conducted a review of solar PV/T systems with different absorber designs and analyzed their potential performance and production efficiency [49]. They reported that water-based PV/T systems have better performance as compared to the air-based PV/T systems. Chen and Dai [50] compared the performance of flat plate solar thermal collectors to that of a PV/T collector and found that the PV/T collectors showed a delay on the dynamic response. They attributed this to the additional thermal capacity and thermal resistance of the PV/T systems.
In recent years, researchers have experimentally and numerically investigated the effect adding different types of nanoparticles has on the heat transfer characteristics of the fluid in PV/T systems [51,52,53]. Ali et al. reported that nano-SiC resulted in higher convective heat transfer as compared to nano-CuO and nano-alumina [52]. Ali et al. [53] reported that adding nanofluid/nano-phase change material (PCM) to PV/T system resulted in electrical and thermal efficiencies of 13.7%, 13.2%, 72%, and 71.3%, respectively.
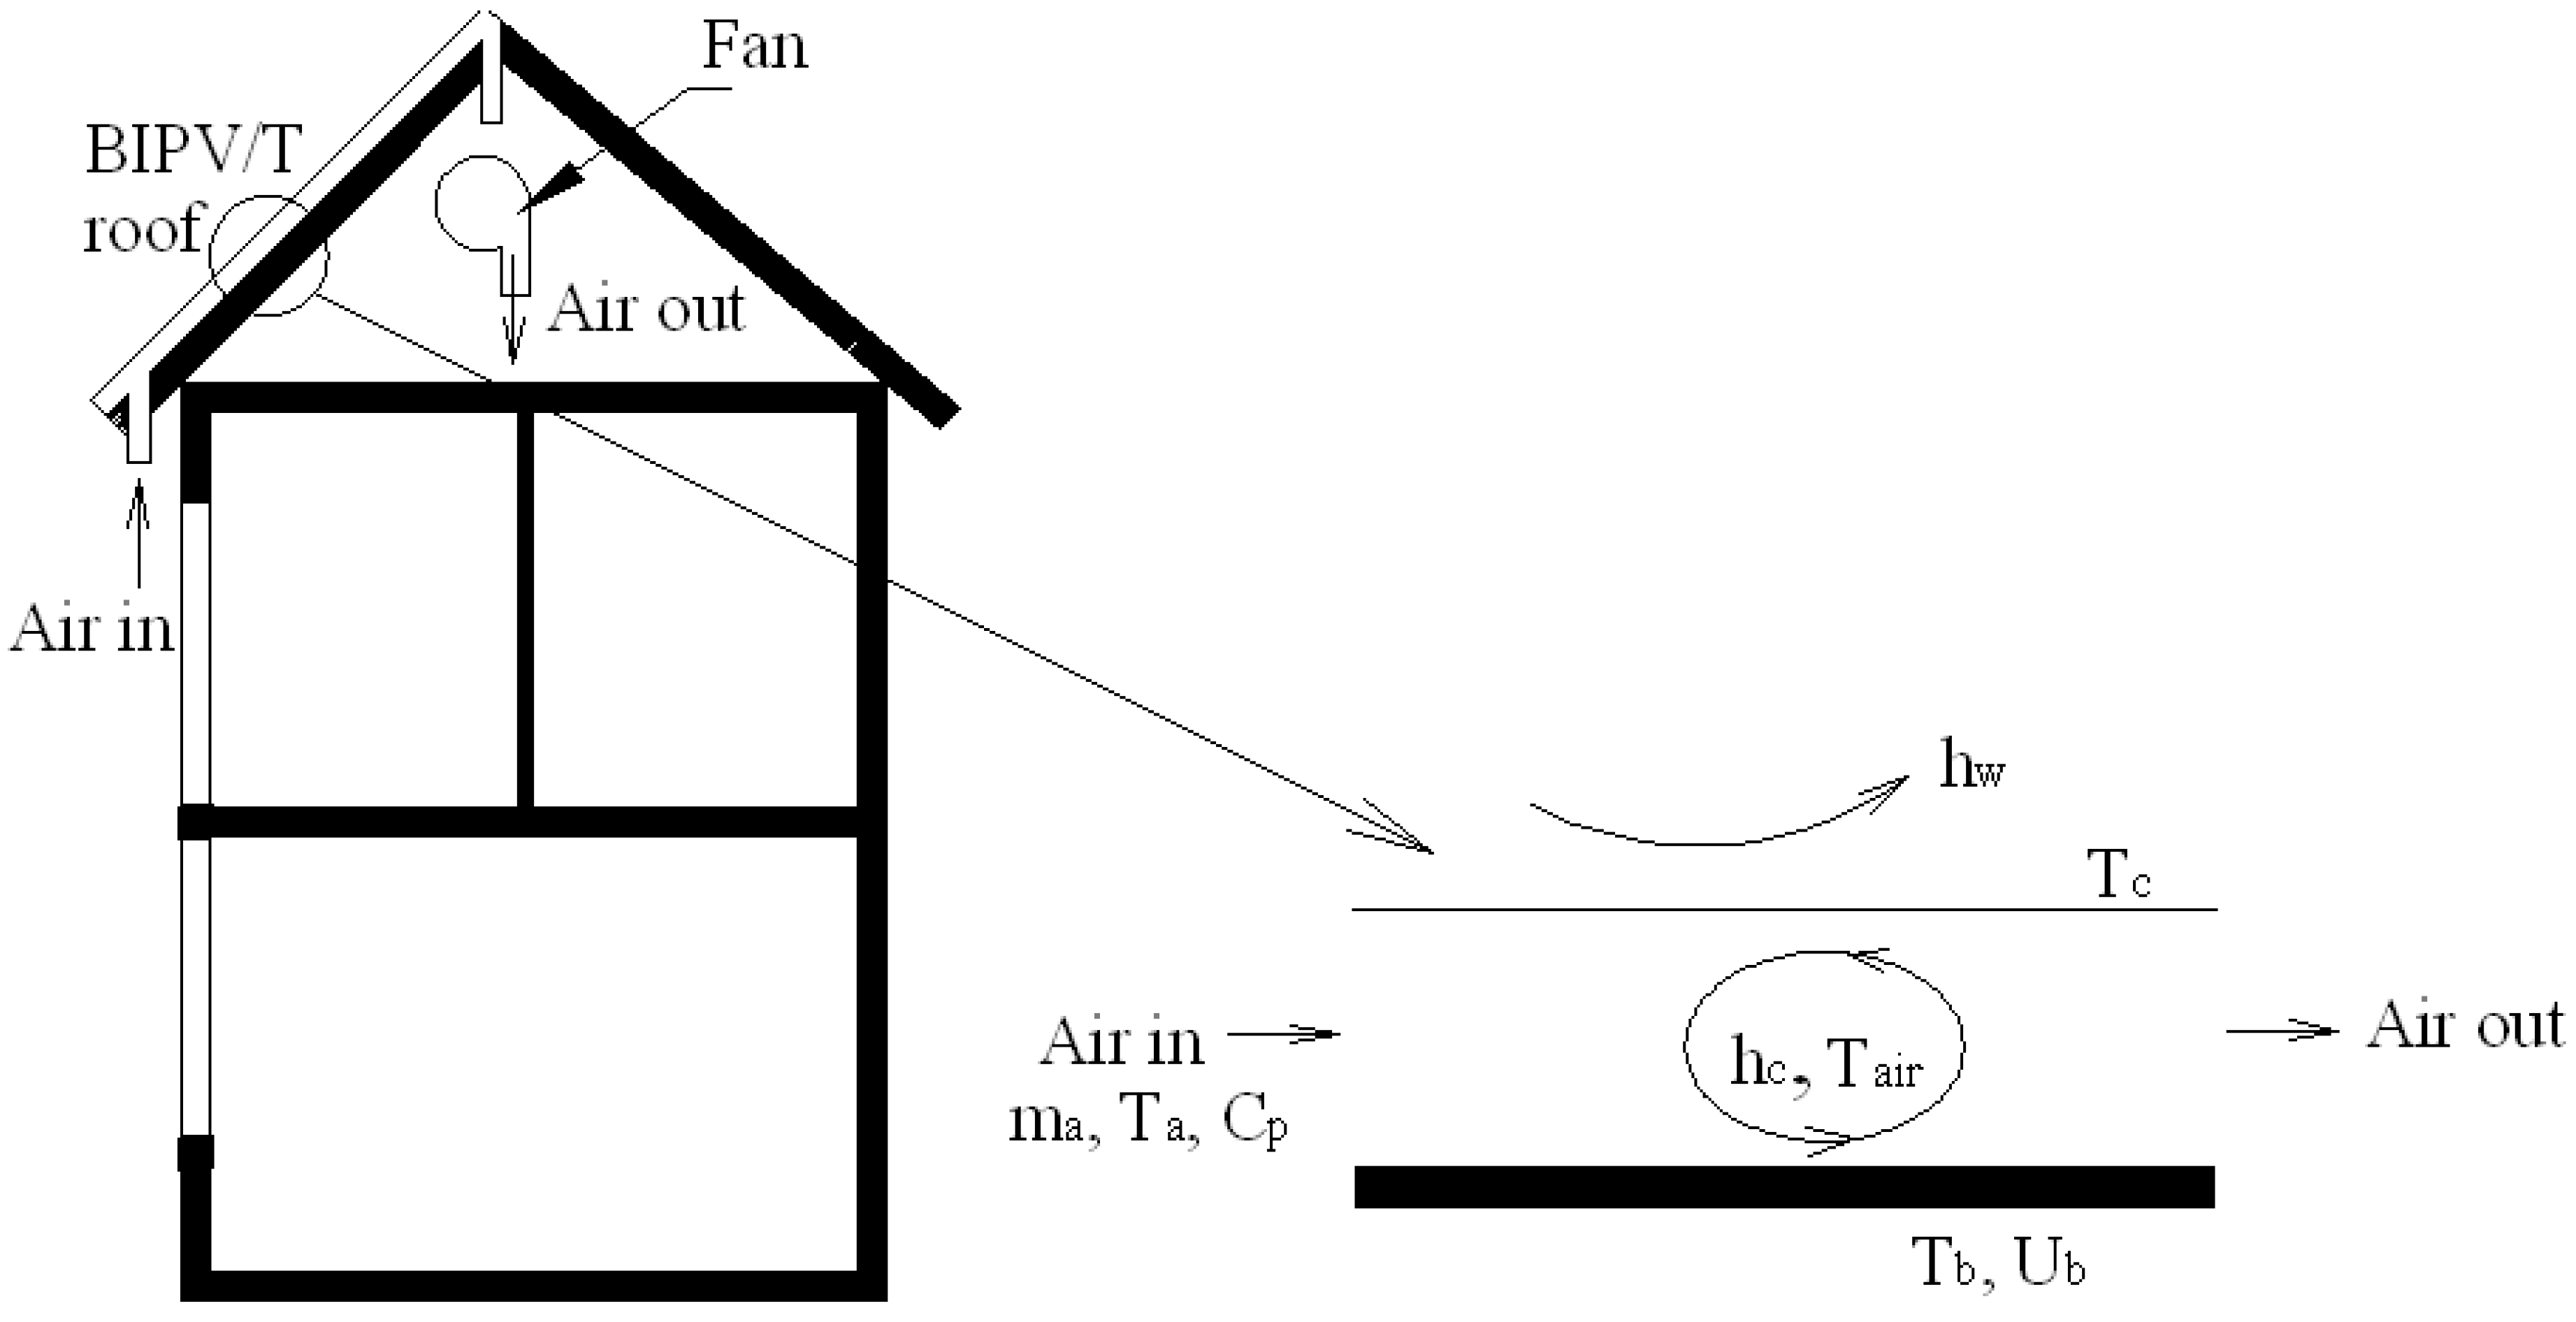
Buildings in geographical sites with low solar radiation and ambient temperatures require space heating for most of the year. Thus, PV/T systems that allow air circulation for removal of heat can be useful and cost effective [54]. This conclusion is relevant to Canadian climatic conditions. Because of air circulation, thermal energy extraction, and enhanced performance, a PV/T system can lead to a quicker payback time as compared to a PV system alone. The most current practice of installing PV/T systems is as separate systems on rooftops, treating them as distinct systems from the building envelop. They are usually attached to the outer layer of the construction, requiring additional mounting systems. This leads to longer payback time. Integrating PV/T systems to the building envelope in a system known as building integrated photovoltaic thermal (BIPV/T) system has the possibility to meet all the building envelope needs such as thermal insulation and mechanical resistance [23]. BIPV/T systems have several functions including electricity and thermal energy production. BIPV/T can also improve the cost effectiveness of building construction as compared to add-on PV/T systems [23].
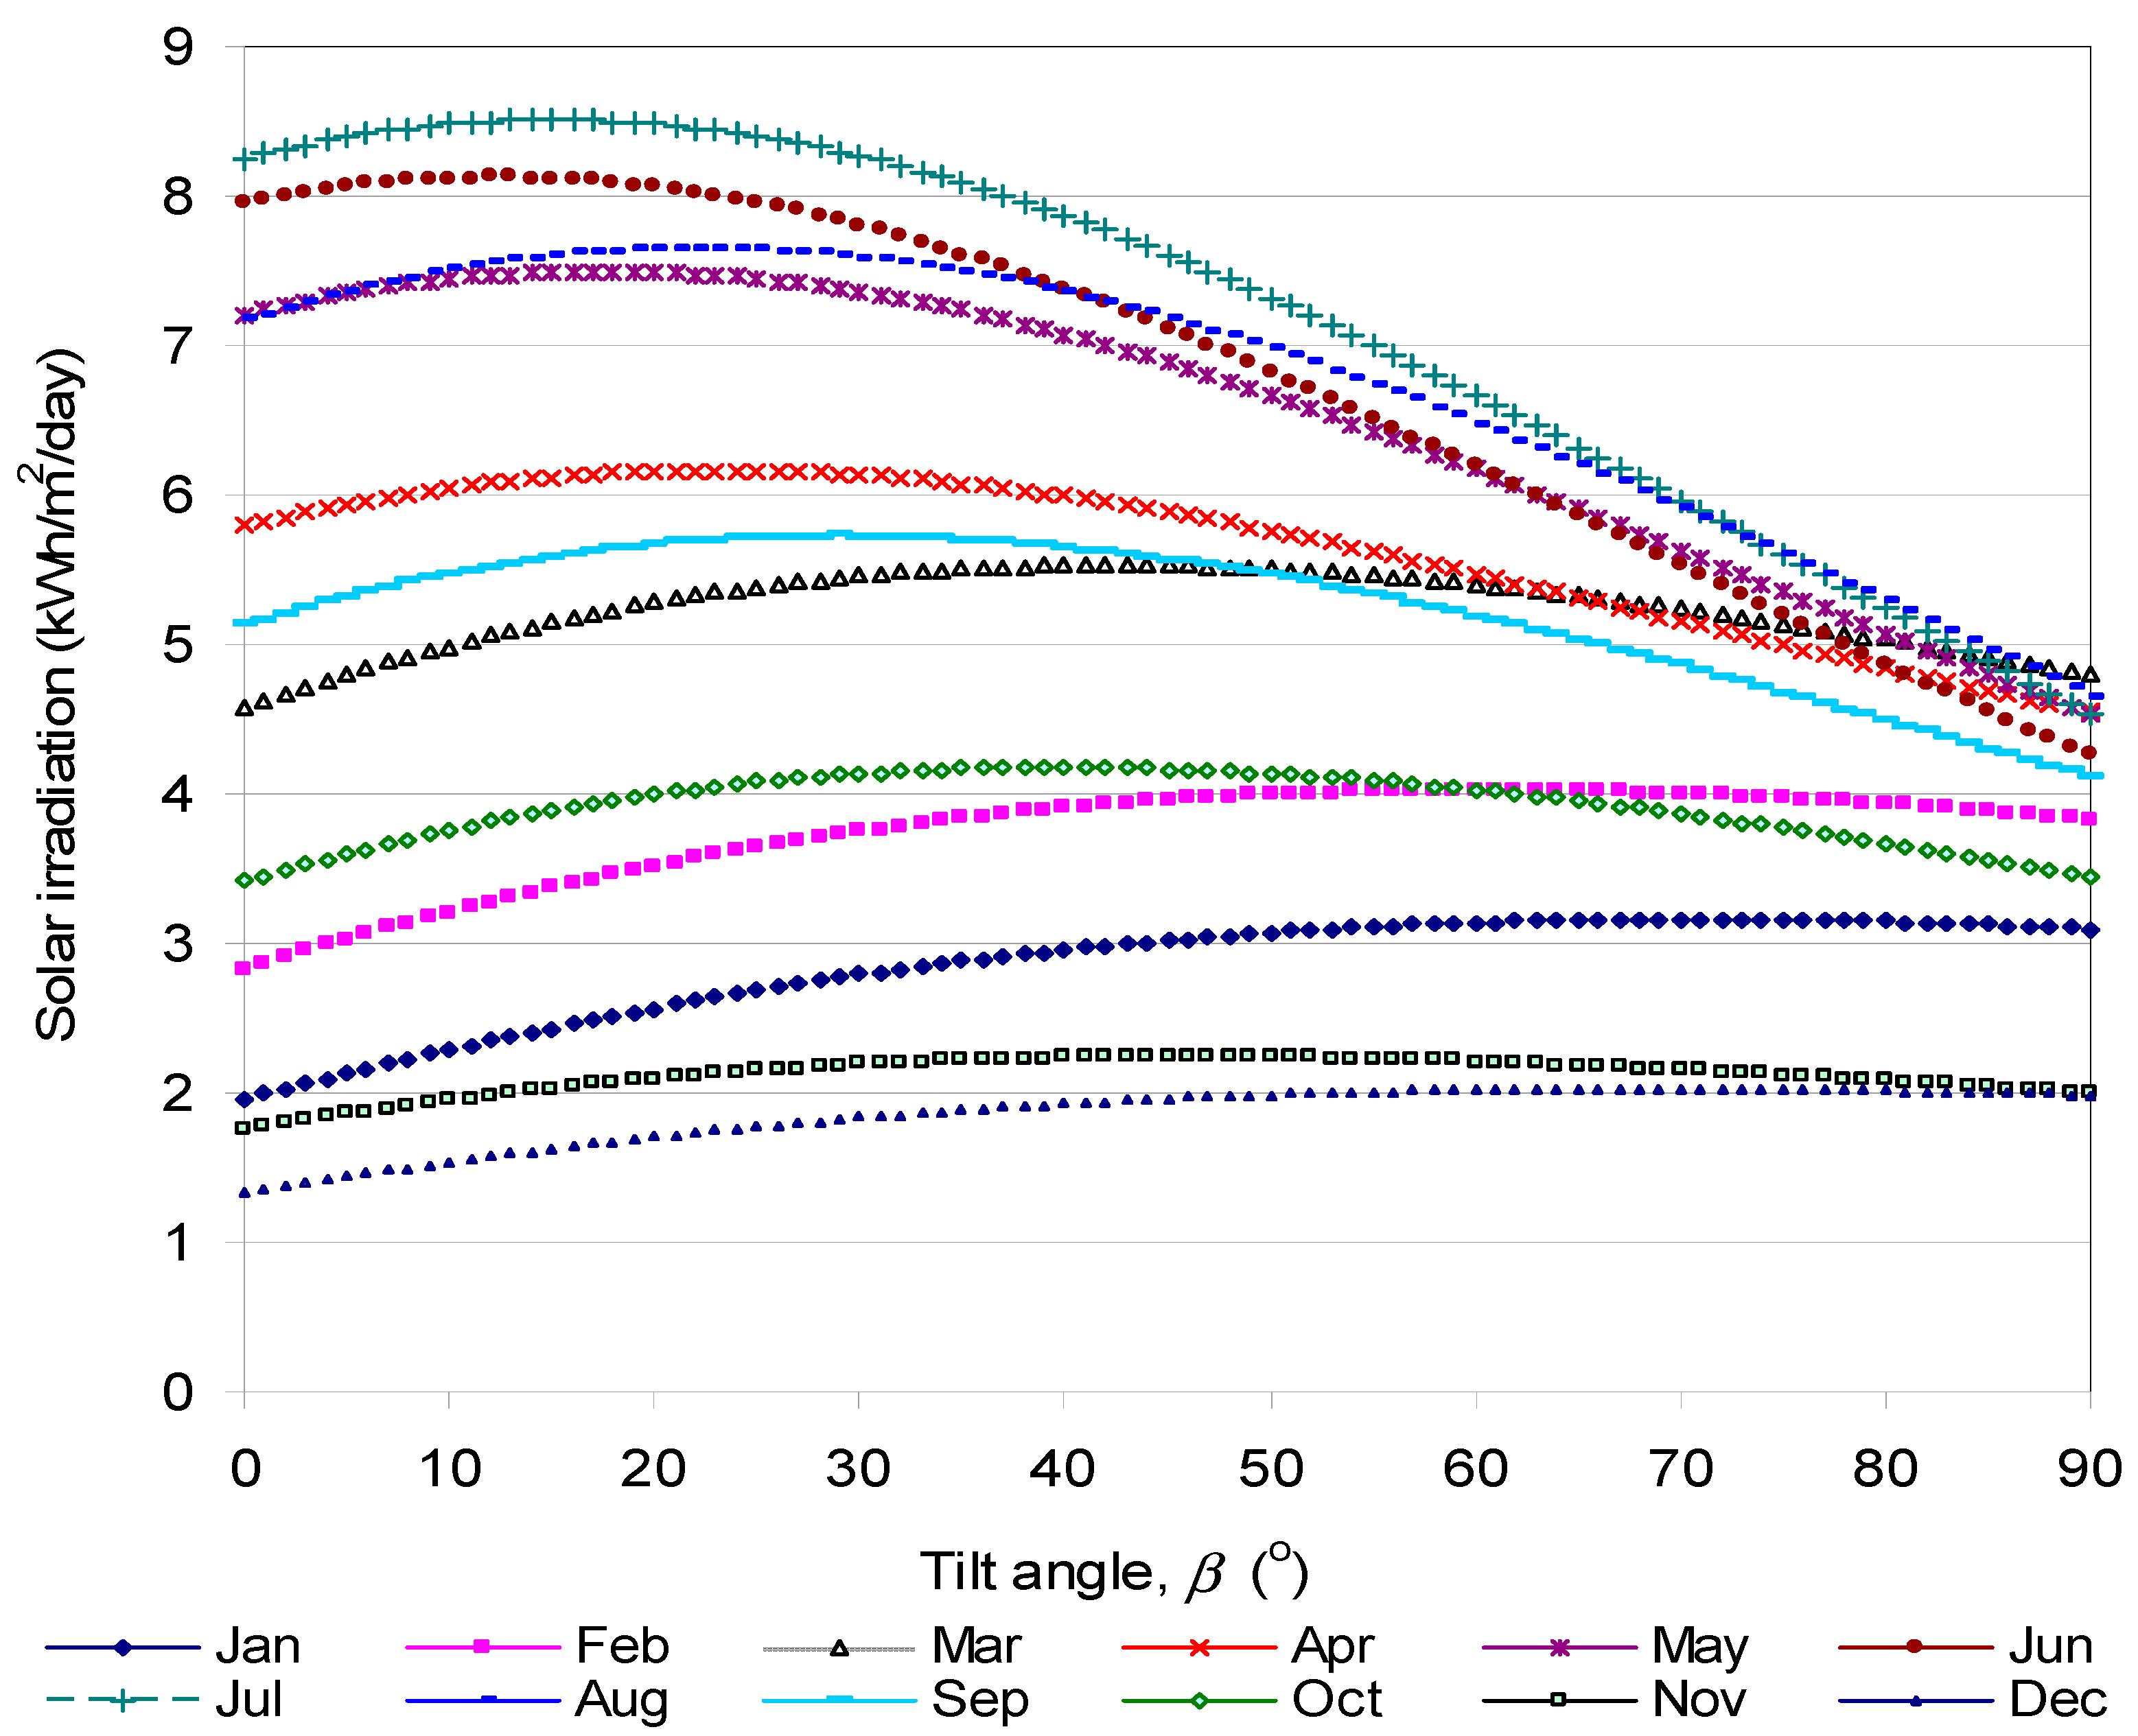
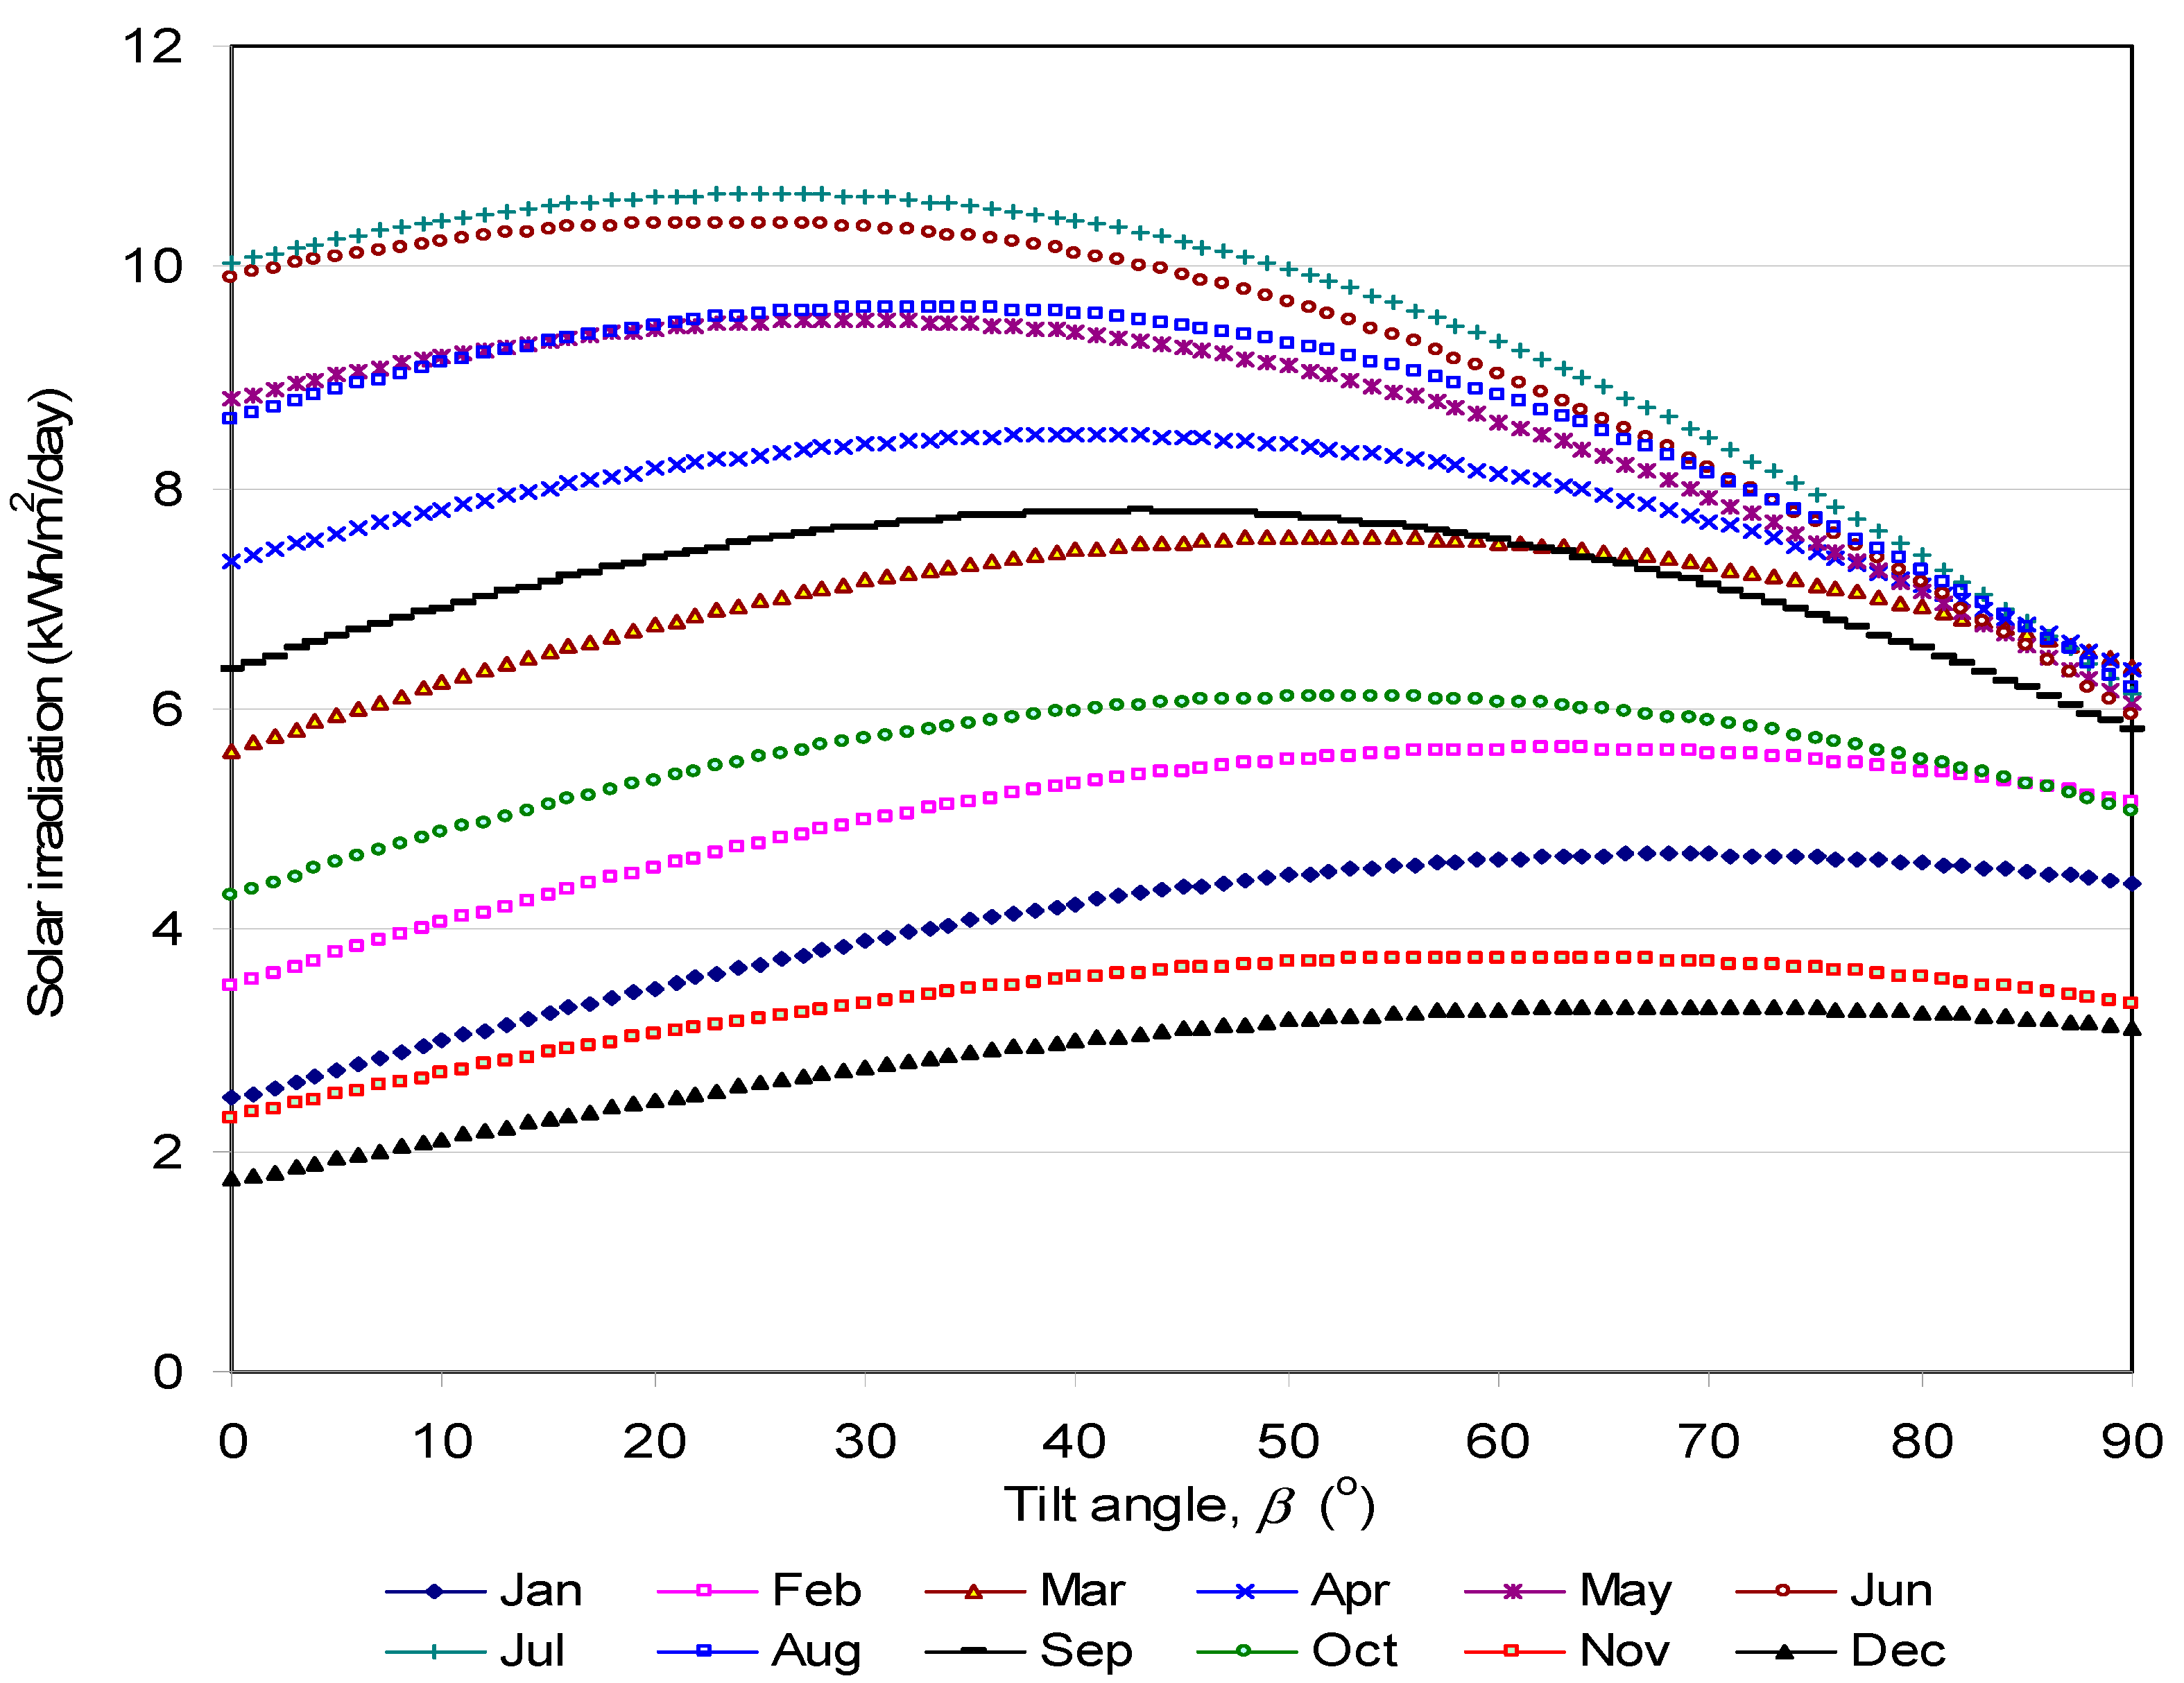
In summary, the orientation and tilt angle of a solar panel are important parameters that influence the output of the system and thus have been applied to solar thermal panels. However, there is limited work on optimizing the PV/T orientation and tilt angles for application in climatic conditions of the Greater Toronto Area (GTA), Canada. Specifically, the thermal output of a PV/T system has not been reported for GTA application. The potential of coupling a PV/T system to an air source heat pump will also be assessed.
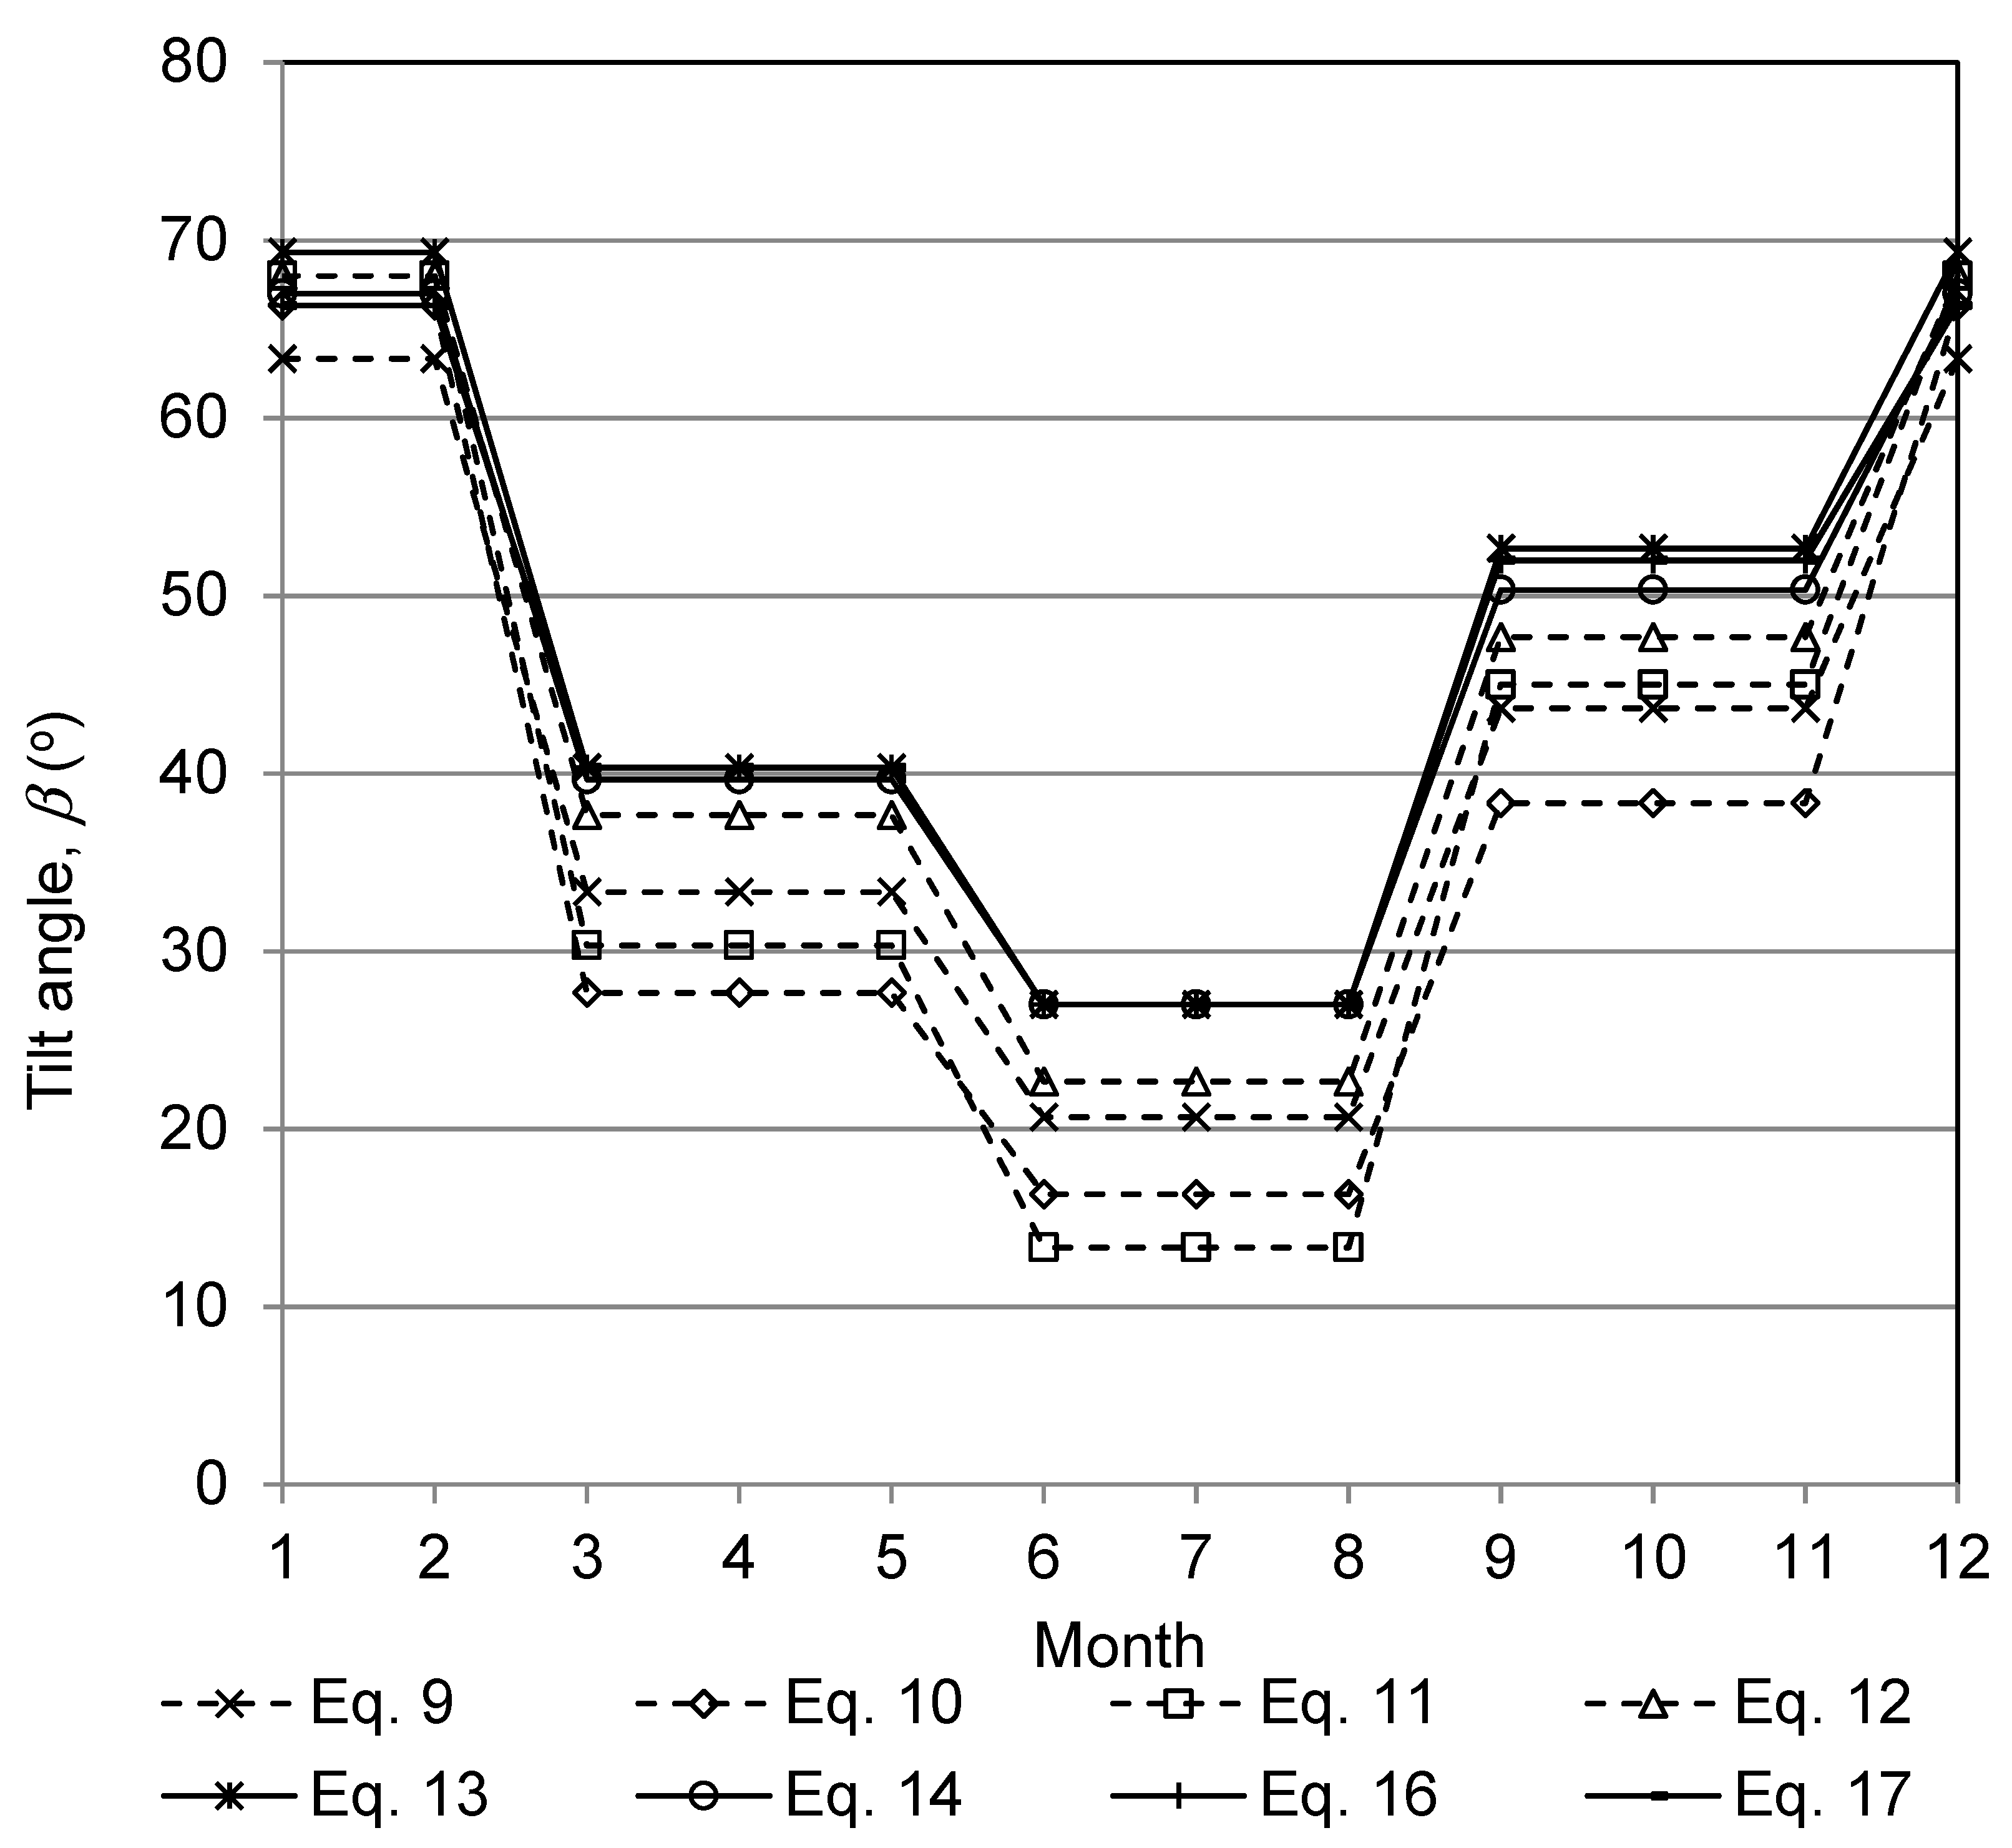
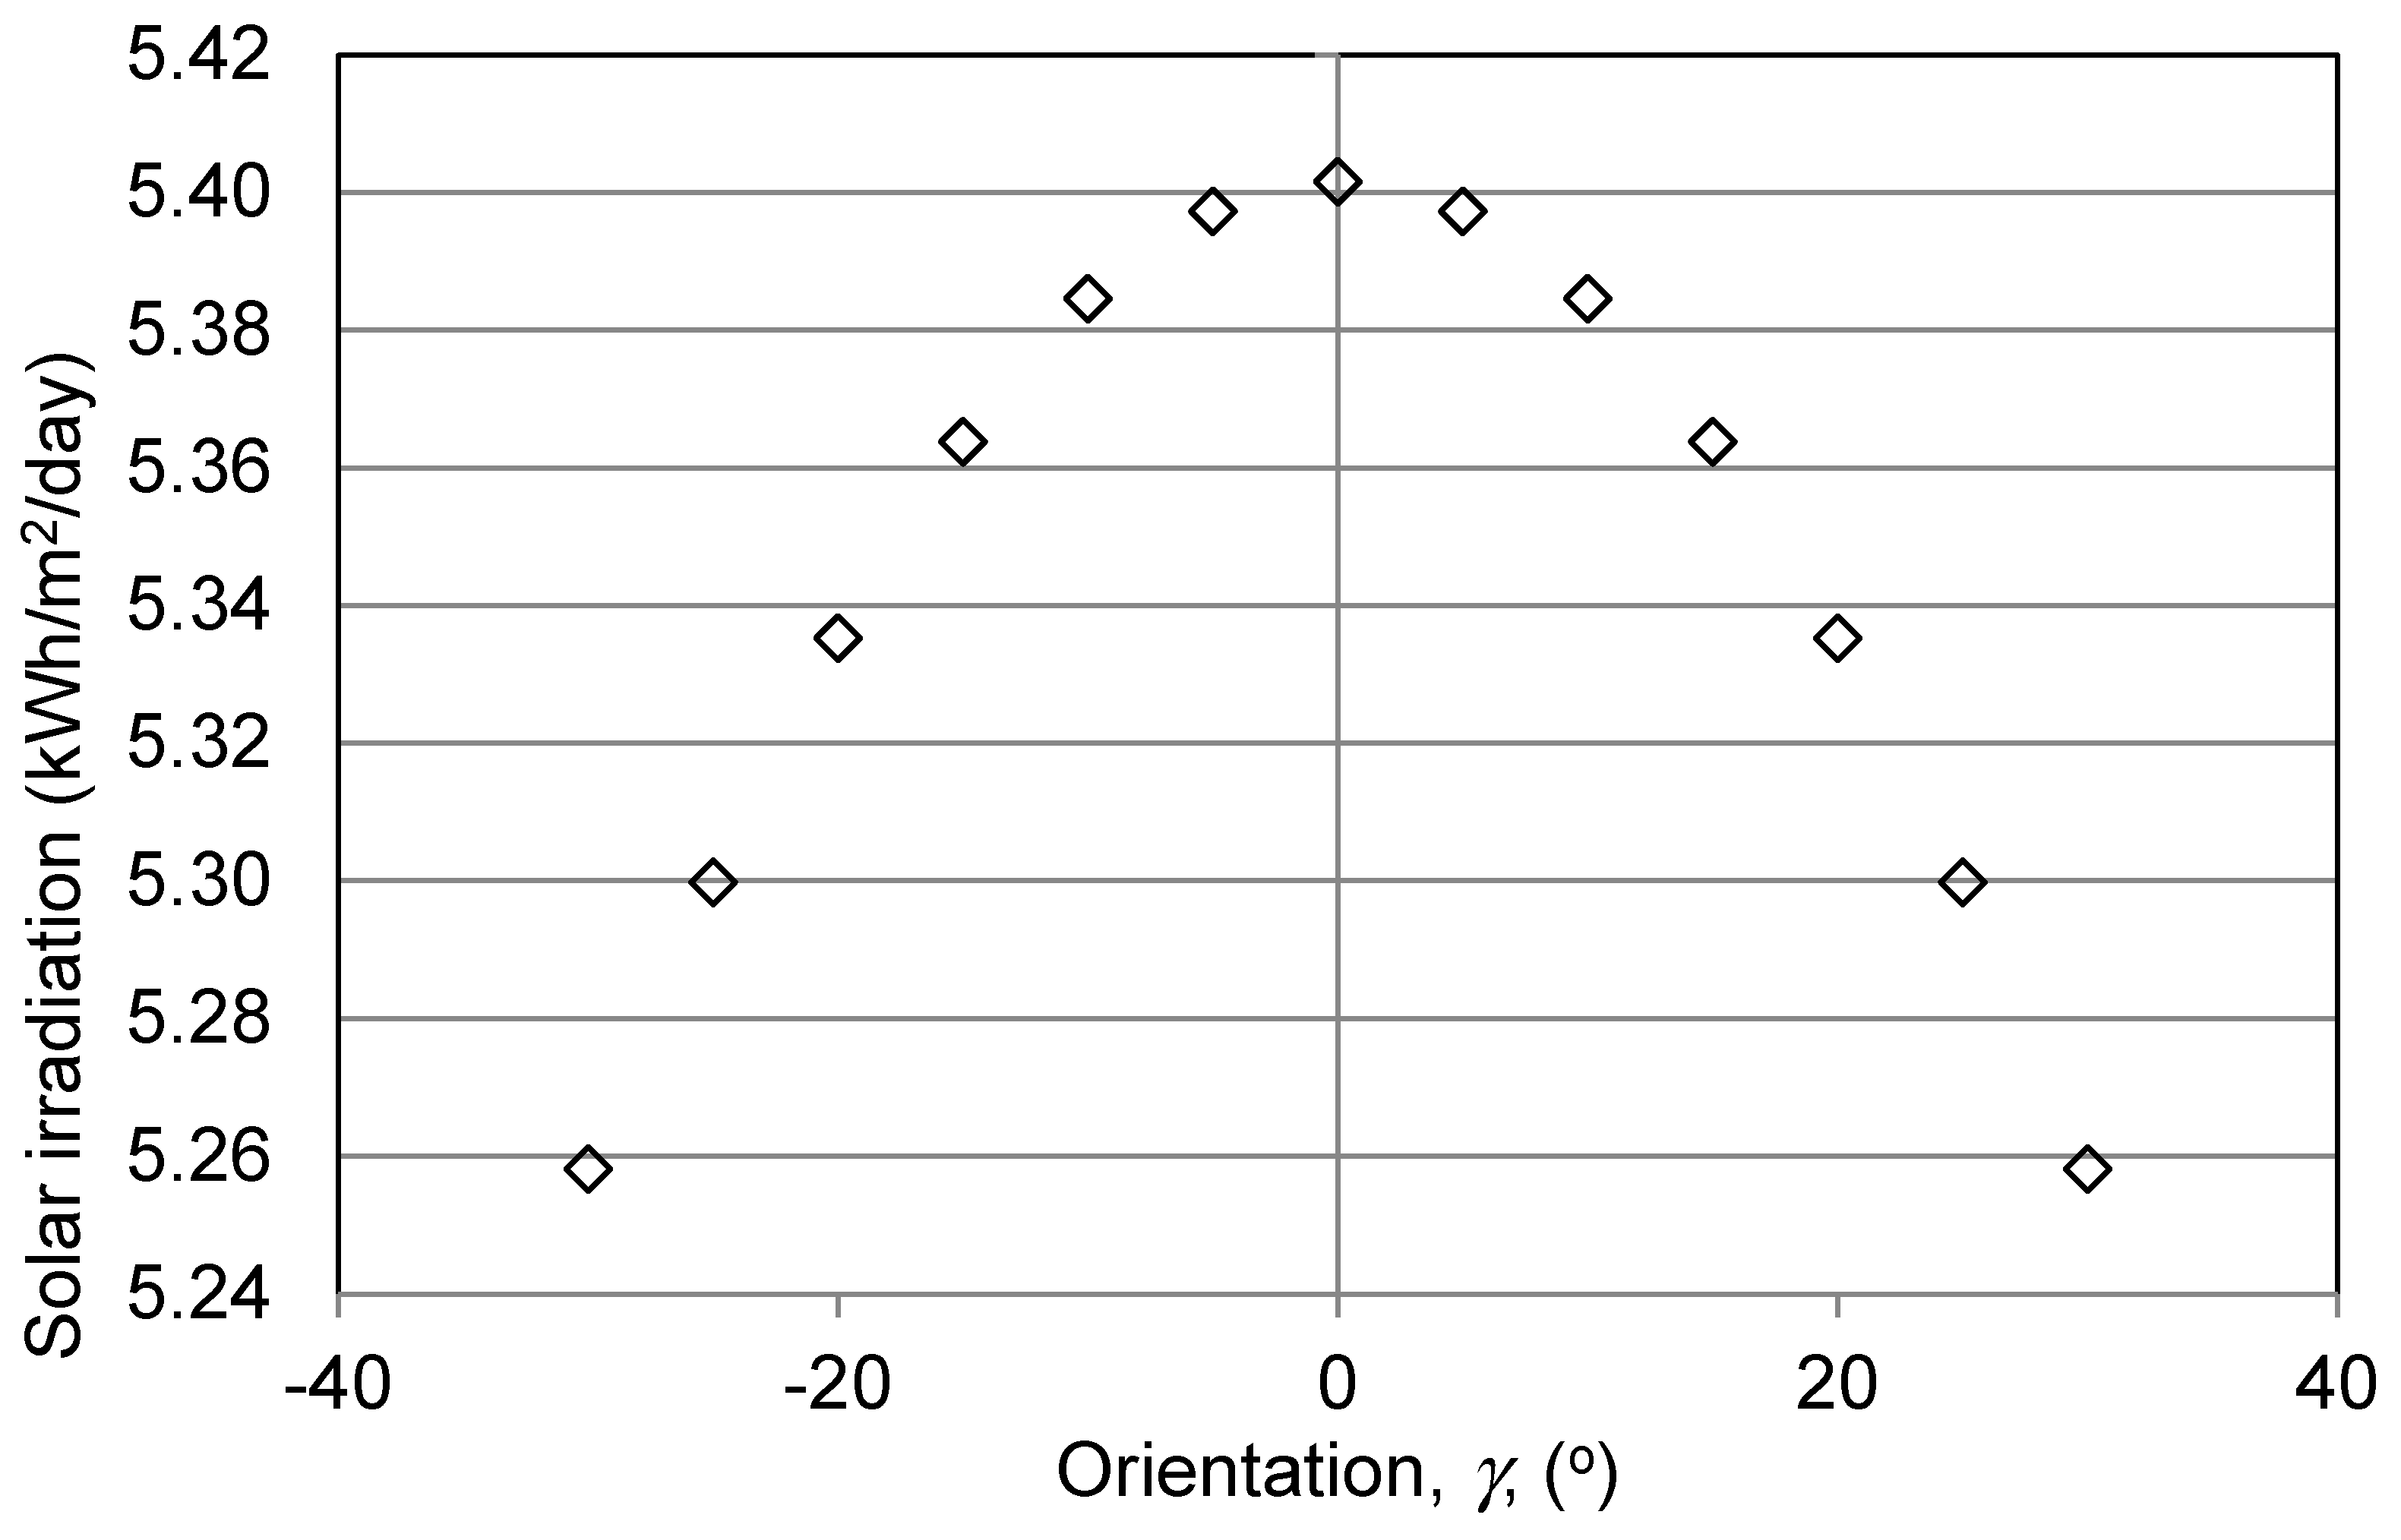
The objective of this work was to determine optimum tilt and orientation angles of a PV/T systems for application in the Greater Toronto Area (GTA), Canada. The optimum tilt angles and orientations will be determined using four isotropic and four anisotropic models for the GTA climatic conditions. In addition, we intended to examine the influence of orientation of a PV/T system on the outlet temperature of the cooling air using a one-dimensional steady state heat transfer model.

2. Models for Determining Insolation on Tilted Surfaces

The overall solar radiation received on a surface is composed of (1) beam radiation, (2) diffuse radiation, and (3) reflected radiation [6,8,55]. The beam radiation and the diffuse radiation on a horizontal surface with correlation procedures are used to obtain insolation on tilted surfaces [8]. The monthly average daily total radiation on a tilted surface (HT) is obtained from the direct beam (HB), diffuse (HD), and reflected components (HR) of the radiation on a tilted surface. Thus, for a surface tilted from the horizontal, the incident total radiation (HT) is given by [7,21,55]:
H T = H B + H D + H R
where HB is the daily beam radiation received on a tilted surface and is expressed as [7]:
H B = ( H g H d ) R b
where Hg, Hd, and Rb are the monthly mean daily global, the monthly mean daily diffuse radiation on a horizontal surface, and the ratio of the beam radiation on a tilted surface to that on a horizontal surface, respectively. Rb, the ratio of the beam radiation on the tilted surface to that on a horizontal surface, is expressed as [8]:
R b = cos ( θ ) cos ( θ z )
where θ is the angle of incidence of beam radiation and cos(θ) is expressed as [8]:
cos ( θ ) = sin ( δ ) sin ( ϕ ) cos ( β ) sin ( δ ) cos ( ϕ ) sin ( β ) cos ( γ ) + cos ( δ ) cos ( ϕ ) cos ( β ) cos ( ϖ ) + cos ( δ ) sin ( ϕ ) sin ( β ) cos ( γ ) cos ( ϖ ) + cos ( δ ) sin ( β ) sin ( γ ) sin ( ϖ )
where 
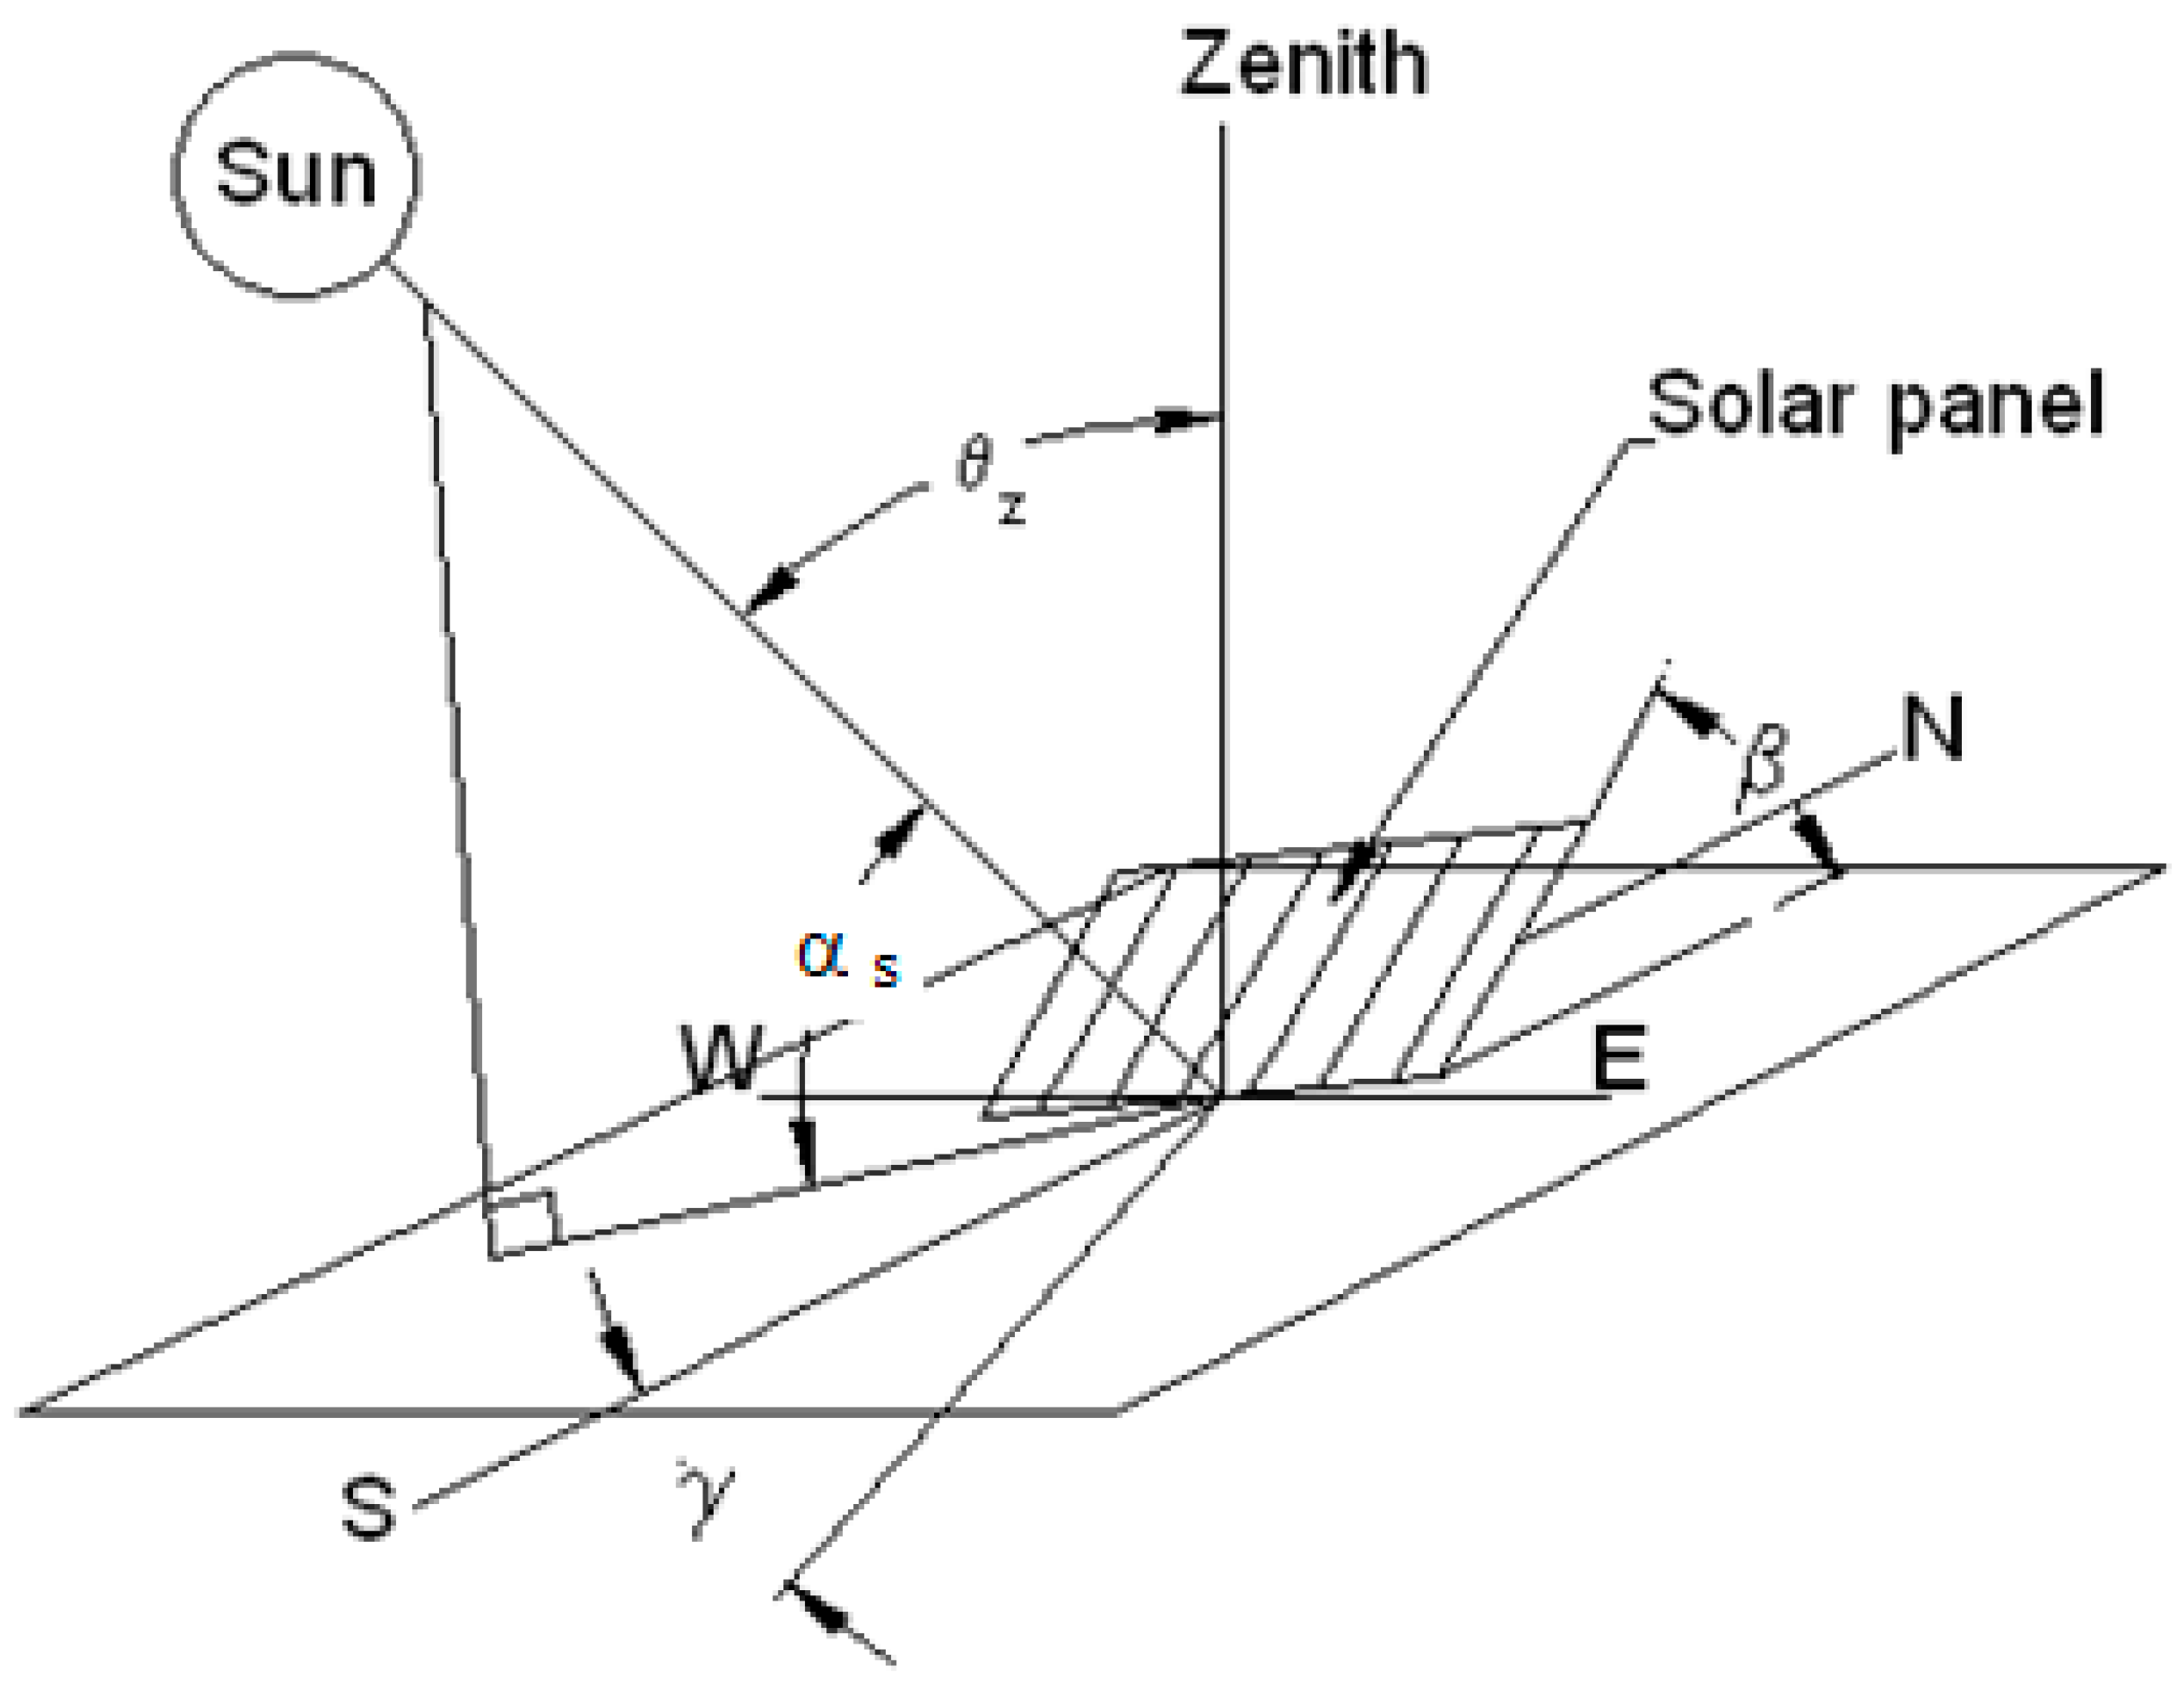
φ is the latitude of the location, δ is the declination, ω is the hour angle, β is the tilt angle, and 
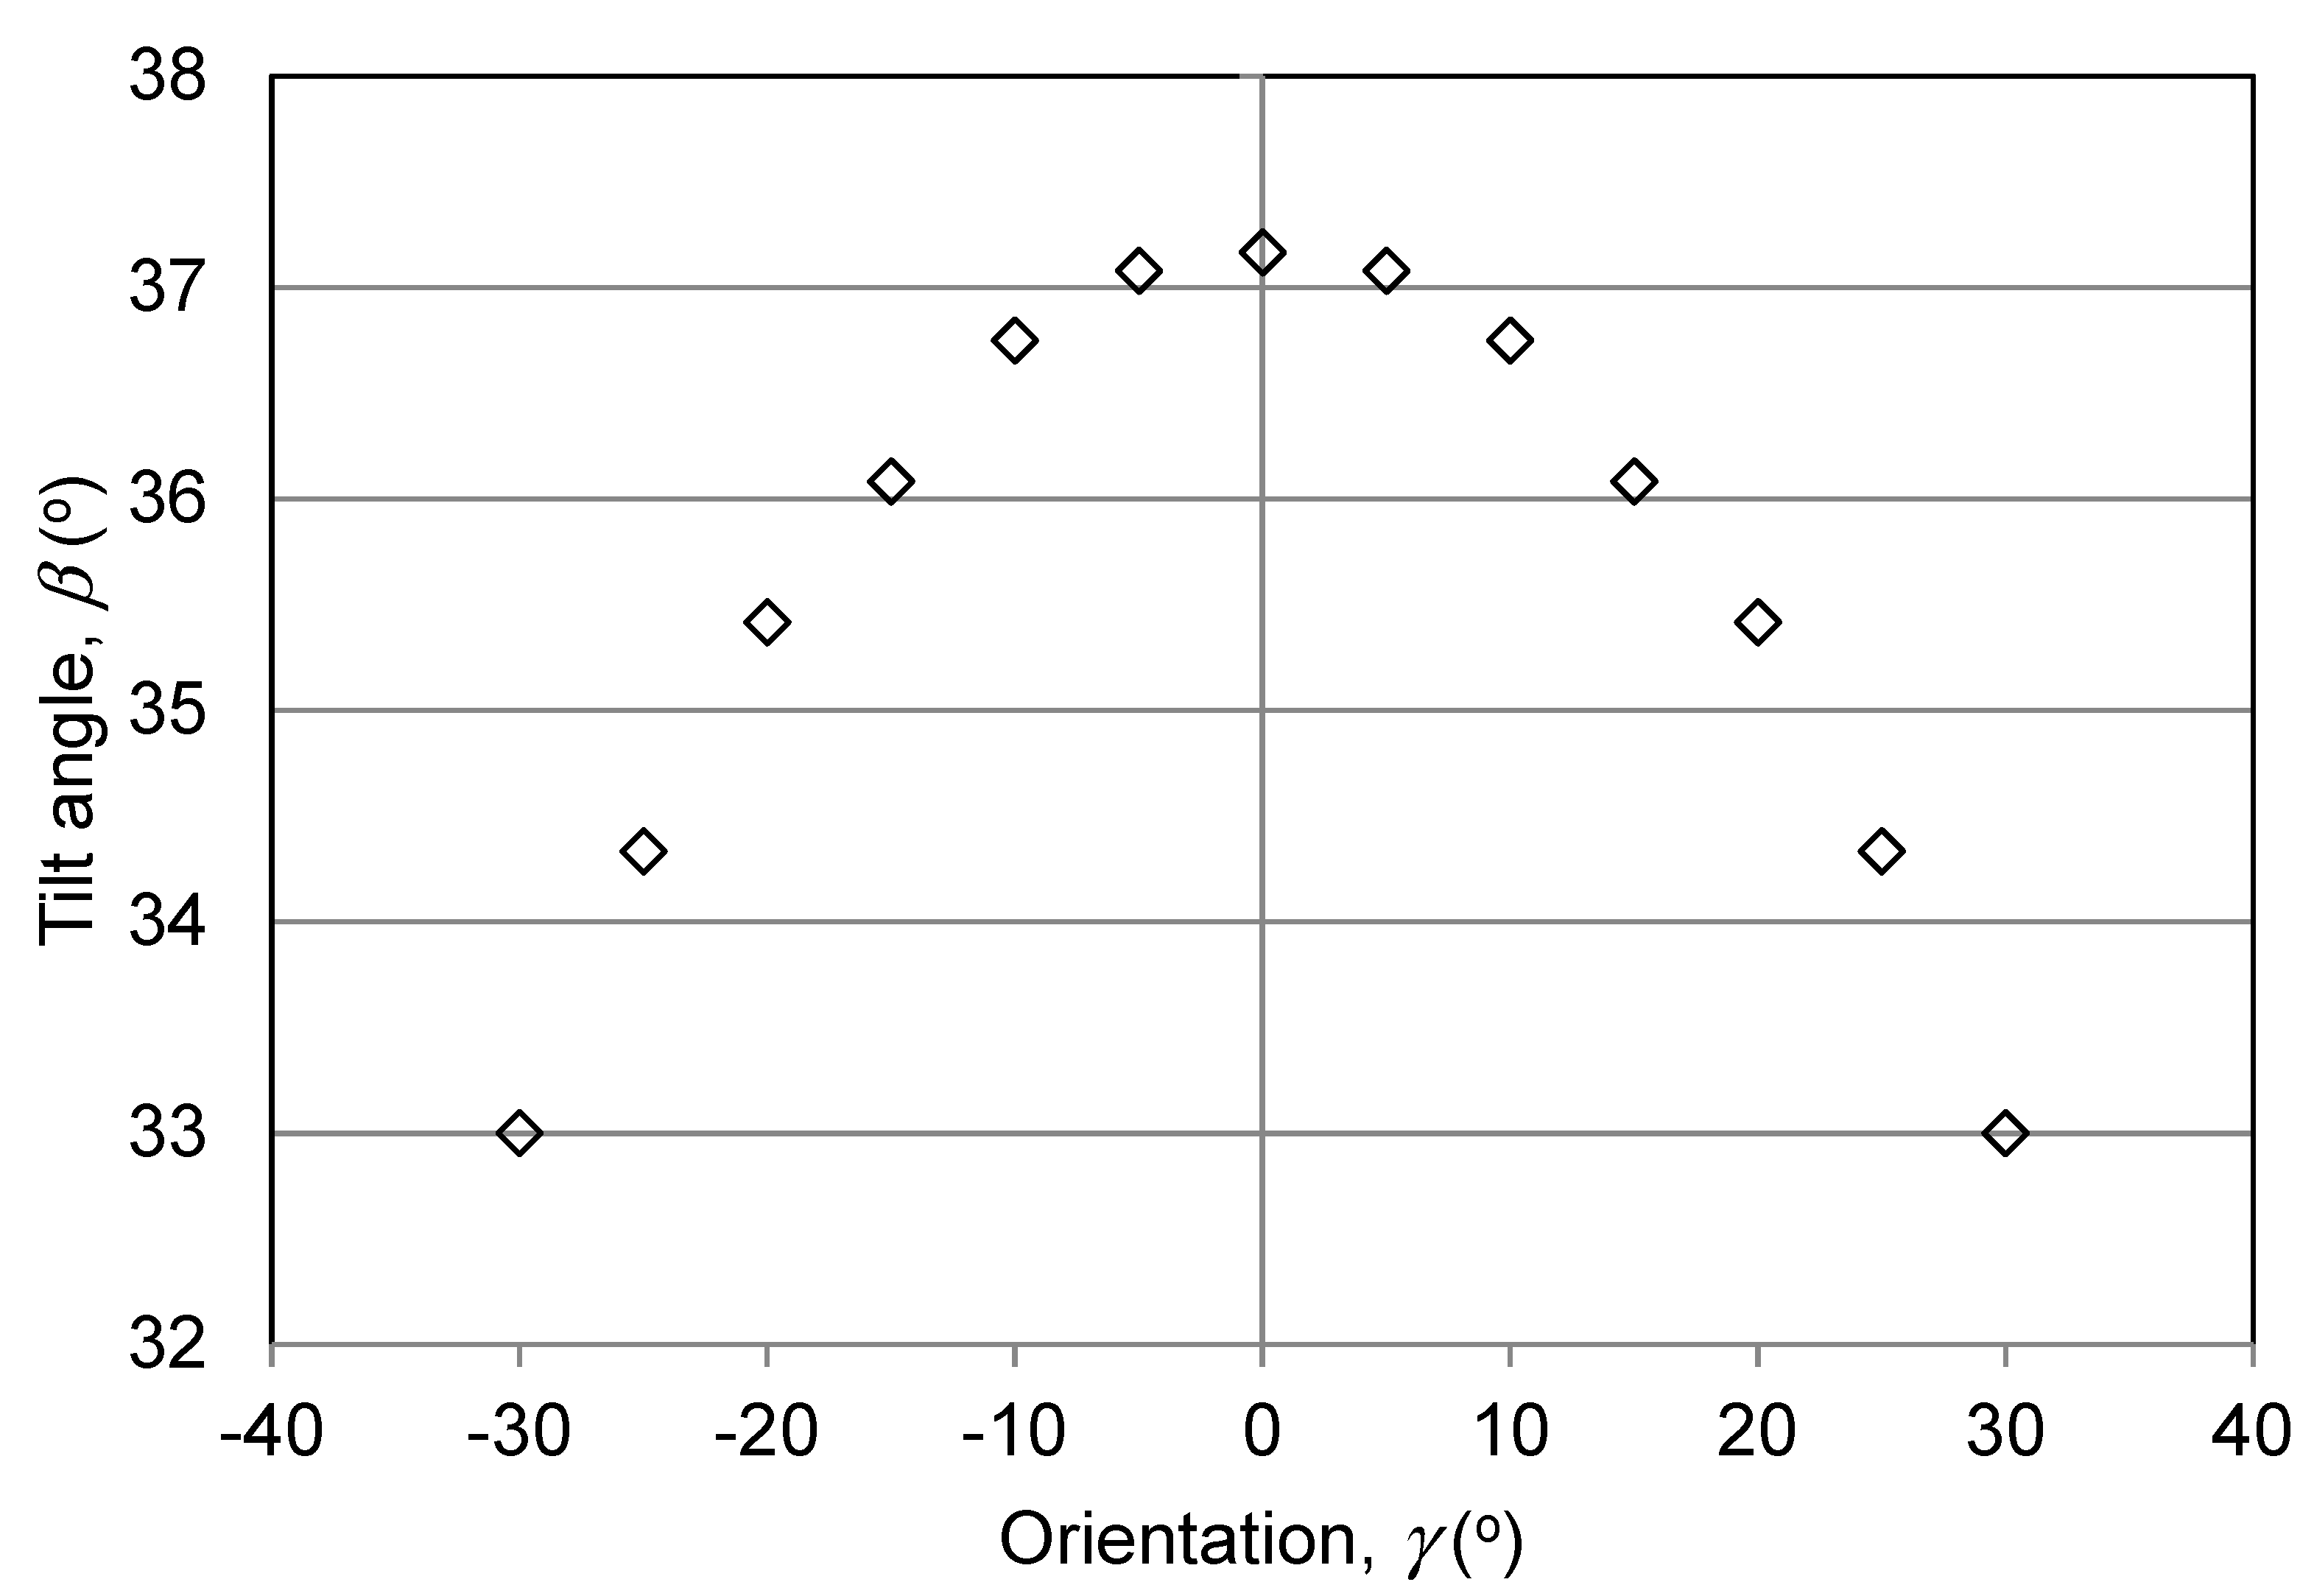
γ is the surface azimuth angle (Figure 1).
The value of cos (θz) is obtained by setting β = 0° in Equation (4) [8].
cos ( θ z ) = cos ( δ ) cos ( ϕ ) cos ( ϖ ) + sin ( δ ) sin ( ϕ )
The declination, δ, is expressed as [8]:
δ = ( 23.45 ) sin ( 360 284 + n 365 )
where n is the nth day of the year. In this study, the values proposed by [8] were used.
The daily ground-reflected radiation is expressed as [7,21]:
H R = H g ρ ( 1 cos ( β ) 2 )
where β is the tilt angle of the solar panel from horizontal and ρ is the ground reflectance (ground or surface albedo). Its value varies from 0.2 for a snow-free surface and 0.6 with fresh snow [55]. The sky-diffuse radiation is expressed by [7,8,21]:
H D = R d H d
where Rd is the ratio of the average daily diffuse radiation on a tilted surface to that on a horizontal surface. Four isotropic and four anisotropic models proposed by various investigators [11,12,13,14,15,16,17,18,19] were used to calculate global radiation on tilted surfaces from the available data on a horizontal surface.

2.1. Isotropic Models

R d = 1 + cos ( β ) 2   Liu   and   Jordan   [ 12 ]
R d = 3 + cos ( 2 β ) 4   Badescu   [ 13 ]
R d = 1 β 180   Tian   [ 14 ]
R d = 1 3 ( 2 + cos ( β ) )   Koronakis   [ 15 ]

2.2. Anisotropic Models

R d = H b H 0 R b + ( 1 H b H 0 ) ( 1 + cos ( β ) 2 ) ( 1 + H b H g sin 3 ( β 2 ) )   Reindl   et   al .   [ 16 ]
where Hb is the daily beam radiation incident on a horizontal surface, Hg is the daily global radiation incident on a horizontal surface, H0 is the extraterrestrial daily radiation incident on a horizontal surface, and Rb is the ratio of the average daily beam radiation incident on an inclined surface to that on a horizontal surface given by Equation (3).
R d = H b H 0 R b + Ω cos ( β ) + ( 1 H b H 0 Ω ) ( 1 + cos ( β ) 2 )   Skartveit   and   Olseth   [ 17 ]
where
Ω = [ M a x [ 0 , ( 0.3 2 H b H 0 ) ] ]
R d = 0.51 R b + 1 + cos ( β ) 2 1.74 1.26 π ( sin ( β ) ( β π 180 ) cos β π sin 2 ( β 2 ) ) Steven , M . H .   Unsworth   [ 18 ]
R d = H b H 0 R b + ( 1 H b H 0 ) ( 1 + cos ( β ) 2 )   Hay   [ 19 ]

3. Thermal Energy Generated by a PV/T Module

In this section, analytical expressions for the outlet air temperature (Figure 2) and the mean air temperature flowing behind the PV/T panels will be developed. These models will be used to assess the influence of orientation angle on the outlet temperature. Figure 2 illustrates the PV/T system schematically. The outlet and mean temperature of the air in the duct will be determined using energy balance equations with the following assumptions:
(1)
1D steady state heat transfer,
(2)
heat loss of the PV module through radiation is neglected, and
(3)
negligible heat capacity of the PV/T system compared to the heat capacity of the air.
For the PV cell:
α c ( 1 η e l ) I b d x = h w ( T c T a ) b d x + h c ( T c T a i r ) .
For the back insulation surface:
U b ( T b T a ) = h c ( T a i r T b ) .
For the air stream flowing in the duct:
m a C p d T a i r d x d x = h c ( T c T a i r ) b d x + h c ( T b T a i r ) b d x .
Combination of the above three equations gives:
d T a i r = h c b m a C p ( ( α c ( 1 η e l ) I + h w T a ) ( h c + U b ) + T a U b ( h c + h w ) ( h c + h w ) ( h c + U b ) + T a i r ( h c ( h c + U b ) + h c ( h c + h w ) 2 ( h c + h w ) ( h c + U b ) ( h c + h w ) ( h c + U b ) ) ) .
The solution to this equation is:
T a i r = ( A e B x ( A + B T a ) ) B
where
A = h c b m a C p ( ( α c ( 1 η e l ) I + h w T a ) ( h c + U b ) + T a U b ( h c + h w ) ( h c + h w ) ( h c + U b ) )
B = h c b m a C p ( h c ( h c + U b ) + h c ( h c + h w ) 2 ( h c + h w ) ( h c + U b ) ( h c + h w ) ( h c + U b ) ) .
At the outlet, i.e., x = L:
T a i r = ( A e B L ( A + B T a ) ) B .
The mean air temperature is given by:
T m = 1 L 0 L T a i r d x = A B ( A + B ( T a T a e B L ) ) A e B L B 2 L .

4. Determination of Heat Transfer Coefficients

The average convection heat transfer coefficient due to wind was determined using the following equation [8]:
h w = 2.8 + 3 v w
where vw is the velocity of wind obtained from the measured data for GTA from the National Climate Data and Information Archive 2011 [56].
The conduction heat loss through the backside insulation is given by:
U b = k i n s δ i n s
where kins and δins are the thermal conductivity and thickness of the insulating material, respectively.
The convective heat transfer coefficient between the PV panel and the air, and between the back insulation and the air was assumed to be the same, hc, and it was calculated using the correlation developed [57] and used by [58].
h c = k D H ( 0.0182 Re 0.8 Pr 0.4 ( 1 + s D H L ) )
where k is the thermal conductivity of the air and DH is the hydraulic diameter of the channel and S is given by [58]:
S = 14.3 log ( L D H ) 7.9   for   0 < L D H 60
S = 17.5   for   L D H > 60 .
The hydraulic diameter DH is determined using the cross-sectional area, A, and the wetted perimeter, p, of the PV/T channel, as follows [59]:
D H = 4 A p .

5. Methodology

The total solar radiation on a tilted surface was computed for different tilt angles (varied from 0 to 90° in steps of 1°) for each month of the year for GTA. The average daily total radiation on a surface was calculated using Matlab R2010a (MathWorks®). Data of monthly average daily global irradiation (Hg), diffuse irradiation (Hd), and beam irradiation (Hb) on a horizontal surface were obtained from Meteonorm global meteorological database version 7 for GTA (latitude = 43.7° N, longitude = −79.2° E, elevation = 157m). The solar reflectivity (ρ) was assumed 0.2 for spring, summer, and fall seasons and 0.6 for winter months. The daily extraterrestrial radiation, H0, was calculated using Equation (32) [8].
H 0 = 86400 G s c π ( 1 + 0.033 cos ( 2 π n 365 ) ) ( cos ( ϕ ) cos ( δ ) sin ( ϖ s s ) + π 180 ϖ s s sin ( ϕ ) sin ( δ ) )
where Gsc = 1367 W/m2 is solar constant, and the sunset hour angle, ωss, is given by [8]
ϖ s s = cos 1 ( tan ( ϕ ) tan ( δ ) ) .
The outlet air temperature (Tairout) and the mean temperatures (Tm) were computed in Matlab® environment for the climatic data of GTA of 2011 using Equation (25) and Equation (26) using the average monthly climatic data [56].

6. Results and Discussion

6.1. Daily Total Solar Radiation

Figure 3 and Figure 4 show the average daily total solar radiation on a south-facing surface obtained using isotropic (Equation (10)) and anisotropic (Equation (16)) models when the angle of the tilt varied from 0 to 90° in steps of 1°. The optimum tilt angles and the monthly average daily total solar radiation on the optimum tilted surface are given in Table 1. Equations (10) and (16) were chosen because Badescu’s model (Equation (10)) is preferred for estimation of solar radiation incident on a tilted surface with the smallest statistical errors among all models and close agreement with measured data [59]. Similarly, the model by Steven and Unsworth (Equation (18)) has been found to be a simple model, which agrees well with integrated values of irradiance results for various locations [18].
The optimum tilt angle in summer is small and it increases for spring and fall seasons reaching maximum for winter months. All models indicated that the radiation on the collector surface is maximum in July and minimum in December (Table 1). Both models (isotropic and anisotropic) showed that a unique optimum tilt angle exists for each month of the year that corresponds to the maximum solar radiation received. Generally, isotropic models predicted optimum tilt angle was between 5° (June) and 71° (January). Anisotropic models, generally, predicted optimum tilt angles between 10.4° (June) and 70° (January). All isotropic models predicted a lower tilt angle than the latitude. This result is in agreement with the results of [60]. Anisotropic models predicted slightly higher tilt angles than the latitude. Figure 5 shows the seasonal average tilt angles. Isotropic models indicate the seasonal optimum tilt angle to be between 63–68°, 30–37°, 13–23°, and 38–48° for winter, spring, summer, and fall, respectively (Figure 5). Anisotropic models indicate the seasonal optimum tilt angle to be between 66–69°, 40°, 27°, and 50–53° for winter, spring, summer, and fall, respectively (Figure 4). These results are in fair agreement with the suggestion of [8] who recommended that a tilt angle that exceeds the latitude by 10–15°for winter months and an inclination of 10–15° less than the latitude for summer months to maximize the insolation received by PV panels. The trend showing low optimum tilt angle for summer and high tilt angle for winter is in agreement with the results of [6] and [12].
Noorian et al. [10] evaluated isotropic and anisotropic models against measured data for Karaj, Iran. Their reported relative root mean square error (RMSE) values predicted by anisotropic models given by Equation (13), Equation (14), Equation (16), and Equation (17) for the south-facing surface. The RMSE were 10.87%, 10.16%, 47.18, and 10.37%, respectively. These RMSE values were smaller than those predicted by isotropic models, except for the one predicted by Equation (16). This suggested that the predictions of anisotropic models were more accurate than the predictions of isotropic models, except for Equation (16). In this work, the RMSE values for the south-facing surface predicted by isotropic models given by Equation (9), Equation (10), Equation (11), and Equation (12) were 13.4%, 13.95%, 13.95%, and 14.89%, respectively.
Table 2 gives the optimum seasonal tilt angles. Both types of models, isotropic and anisotropic, indicate that the collector tilt should be changed four times a year for maximizing output. Generally, the seasonal optimum tilt angles obtained with anisotropic models are more consistent (Table 2). For example, in spring (March, April, and May), the four anisotropic models indicate that the tilt angle should be around 40° while the four isotropic models gave different tilt angles in the range of 27–37°. For summer (June, July, and August) isotropic models gave different tilt angles in the range of 13–23°, while the four anisotropic models gave same the tilt angle around 27°. For winter the tilt angles obtained using the four isotropic models were in the range of 63–68°, while anisotropic models gave the tilt angle in the range of 66° and 69°.
Table 3 gives the yearly average optimum tilt angles. Again, anisotropic models gave consistent results of the yearly average optimum tilt between 46° and 47°. More difference was seen between the four results obtained using isotropic models. The yearly average optimum tilt angles predicted by isotropic models varied from 37 to 44°.

6.2. Energy Losses

Table 4 compares the energy loss when the solar panels are adjusted seasonally with the result obtained when the tilt is kept to the yearly optimum, using isotropic models (Equations (9)–(12)). All the four isotropic models indicate that the maximum loss of energy occurs in September when using seasonally adjusted panels. The last row of Table 4 give the energy loss in July (maximum insolation) when the tilt is kept to the yearly optimum.
Table 5 compares the energy loss when the solar panels are adjusted seasonally with the result obtained when the tilt is kept optimum each month using anisotropic models (Equations (13)–(17)). Similar to the isotropic models, the anisotropic models also show that the maximum loss of energy is in September when using seasonally adjusted panels. Similar to the isotropic models, anisotropic models indicate that the maximum loss of energy occurs in July when the yearly fixed panel tilt angle is used as compared to the monthly optimum tilt (Table 4 and Table 5 last rows).

6.3. Effect of Panel Orientation

Figure 6 shows the optimal tilt angle for a given panel orientation (Equation (10)). The graph is symmetric to due south (0°), and the peak is at due south. The graph also indicates that, in case of geometrical constraints imposed by the particular building, the angle the solar panel could be installed with orientation west or east of due south for optimum output. In the case when angle deviates from due south, the panel should be adjusted to a flatter tilt.
Figure 7 shows the yearly mean daily average solar radiation on a tilted surface. The graph indicates that the maximum (5.4 kWh/m2/day) solar radiation is received when the solar panels are oriented due south. This is in agreement with the results of [61]. The maximum value is reduced by 2.6% when the orientation is 30° west or east of due south (Table 6).
When the solar panel is oriented 15° west or east of due south, the reduction from the maximum value is only 0.6%. This indicates that in case of geometrical constraints imposed by a building the solar panel could be installed with orientation 15° west or east of due south without causing significant reduction in the maximum solar radiation received. It is noted that all istoropic and anistropic models showed that maximum solar rdaiation is received when the solar panels are oriented due south regardless of the season, with tilt angle adjustment. These results indicate that the solar panels could be (1) seasonally adjusted by mechanical means for seasonal optimization or (2) by a single-axis tracker to optimize the monthly solar energy received.

6.4. Outlet and Mean Temperatures

As mentioned in Section 5, the outlet air temperature (Tairout) and the mean temperatures (Tm) were computed in Matlab® environment for GTA climatic conditions of 2011 using Equation (25) and Equation (26). Average monthly climatic data as shown in Table 7 were used. The solar intensity obtained for optimum tilt angle at a given orientation, calculated using Equation (13), were used. Table 8 gives the physical properties of air and the assumed design parameters (V, kins, δins).
Figure 8 shows variations of outlet, mean, and inlet temperatures for a south-facing PV/T panel. The seasonal outlet temperatures are 11 °C, 12 °C, 19.2 °C, and 6.3 °C for winter, spring, summer, and fall, respectively. There is a significant temperature output for winter season. This thermal energy can be used in a variety of ways. The most logical use would be the coupling of the PV/T system to an air source heat pump in order to enhance the coefficient of air source (COP). It should also be noted that the extraction of heat from the back side of the PV/T enhances its electrical performance by keeping the PV/T cool. The relatively lower outlet temperatures in fall and spring is probably caused by higher convection due to higher wind velocities (reaching up to 7 m/s for spring and up to 10.5 m/s for fall) which has a cooling effect on the PV panels.
Figure 9 shows the effect of a PV/T orientation on the outlet temperature from the duct. The effect was examined by varying the orientation angle from 0° (south-facing) up to 45° east or west of due south. Higher outlet temperature decrease with increasing orientation angle was observed for two winter months, January and February. The highest temperature decrease, 49.6%, was found to be for January when the PV/T system was oriented at 45° west or east of due south. There was less than 1.5% decrease in the outlet temperature for a PV/T system oriented up to 15° east or west of due south from March to December. This can be of particular advantage in case of retrofit applications, i.e., almost all of the thermal energy can be recovered without altering the shape of the roof (i.e., for roofs oriented up to 15° east or west of due south).

7. Conclusions

In this study, the optimum tilt angle and orientation of a PV/T system for the collection of maximum solar radiation were determined using isotropic and anisotropic diffuse sky radiation models. The effect of PV/T orientation on the outlet temperature was examined using a 1D steady state heat transfer model. The most important findings are:
  • Generally, the seasonal optimum tilt angles obtained with anisotropic models are more consistent suggesting that the predictions of anisotropic models were more accurate than the predictions of isotropic models. These finding are in agreement with the findings of other researches who reported that, in general, the RMSE values predicted by anisotropic models were smaller than those predicted by isotropic models.
  • Both types of models indicated that the panels should be seasonally adjusted for better performance. Isotropic models gave widely varying optimum tilt angles in the range of 37 to 44° and the four anisotropic models gave optimum tilt angles between 46–47°.
  • In case of geometrical constraints imposed by a particular building, the PV/T system could be installed with orientation west or east of due south with a flatter tilt angle without significant effect on the performance.
  • The reduction of the total solar radiation received on a solar panel oriented 15° west or east of due south is insignificant (less than 1%). The reduction in solar radiation received increases with increasing orientation west or east of due south. This result also indicates that a single-axis tracking system could be installed to obtain monthly optimum angle.
  • There is less than a 1.5% decrease in the outlet temperature for PV/T oriented up to 15° east or west of due south from March to December. This indicates that existing roofs within the mentioned orientations angles can be retrofitted with a PV/T system without changing the roof shape with minimal reduction in the outlet temperature.
  • There is a significant temperature output for the winter season. This thermal energy can be used to substantially enhance the COP of an air source heat pump by coupling it in the winter season.

Author Contributions

G.H.: forma analysis, data acquisition, methodology, writing original draft, reviewing and editing. A.S.F.: Funding acquisition, project administration, supervision.

Funding

This research was supported by NSERC and MITACS Elevate PDF.

Conflicts of Interest

The authors declare no conflicts of interest.

Abbreviations

Nomenclature
bwidth of a collector [m]
Cpspecific heat capacity of air [J /kgK]
DHhydraulic diameter [m]
HBdaily beam radiation incident on an inclined surface [kWh/m2/day]
Hbdaily beam radiation incident on a horizontal surface [kWh/m2/day]
hcconvection heat transfer in the air channel [W/Km2]
HDdaily sky-diffuse radiation incident on an inclined surface [kWh/m2/day]
Hddaily sky-diffuse radiation incident on a horizontal surface [kWh/m2/day]
Hgdaily global radiation incident on a horizontal surface [kWh/m2/day]
H0extra-terrestrial daily radiation incident on a horizontal surface [kWh/m2/day]
HRdaily ground reflected radiation incident on an inclined surface [kWh/m2/day]
HTdaily global radiation on a tilted surface [kWh/m2/day]
hwwind convection heat transfer coefficient [W/Km2]
Isolar radiation intensity [W/m2]
kthermal conductivity of air [W/mK]
kinsthermal conductivity of insulation material [W/mK]
Llength of the collector [m]
mamass flow rate of air [kg/s]
nnth day of the year
pwetted perimeter of a channel [m]
PrPrandtl number
Rbratio of average daily beam radiation incident on an inclined surface to that on a horizontal surface
Rdratio of average daily sky-diffuse radiation incident on an inclined surface to that on a horizontal surface
ReReynolds number
Taambient temperature [°C]
Tairair temperature [°C]
Tbbackside temperature [°C]
TcPhotovoltaic (PV) panel temperature [°C]
Tmmean temperature [°C]
Ubbackside heat loss [W/Km2]
vvelocity of air inside the duct [m/s]
vwwind velocity [m/s]
Greek symbols
αcPV panel absorptance
αssolar altitude angle
ηelelectrical conversion efficiency of a PV panel
γsurface azimuth angle [°]
βsurface slope from the horizontal [°]
δdeclination [°]
δinsinsulating material thickness [m]
φlatitude [°]
θzzenith angle and the sun’s position relative to the north-south axis, [°]
ρground albedo, ground reflectivity
ρaair density [kg/m3]
ωsssunset hour angle [°]
Γscsolar constant [W/m2]

References

  1. OECD/IEA. Solar Energy Perspectives: Executive Summary; OECD/IEA: Paris, France, 2011. [Google Scholar]
  2. Thanailakis, P.T.A. Direct computation of the array optimum tilt angle in constant-tilt photovoltaic systems. Sol. Cells 1985, 14, 83–94. [Google Scholar]
  3. Kern, J.; Harris, I. On the optimum tilt of a solar collector. Sol. Energy 1975, 17, 97–102. [Google Scholar] [CrossRef]
  4. Bari, S. Optimum slope angle and orientation of solar collectors for different periods of possible utilization. Energy Convers. Manag. 2000, 41, 855–860. [Google Scholar] [CrossRef]
  5. Bairi, A. Method of quick determination of the angle of slope and the orientation of solar collectors without a sun tracking system. Sol. Wind Technol. 1990, 7, 327–330. [Google Scholar] [CrossRef]
  6. Benghanem, M. Optimization of tilt angle for solar panel: Case study for Madinah, Saudi Arabia. Appl. Energy 2011, 88, 1427–1433. [Google Scholar] [CrossRef]
  7. Mondol, J.D.; Yohanis, Y.G.; Norton, B. The impact of array inclination and orientation on the performance of a grid-connected photovoltaic system. Renew. Energy 2007, 32, 118–140. [Google Scholar] [CrossRef]
  8. Duffie, J.; Beckman, W. Solar Engineering of Thermal Processes, 2nd ed.; John Wiley and Sons: New York, NY, USA, 1991. [Google Scholar]
  9. Gopinathan, K.K. Solar radiation on variously oriented sloping surfaces. Sol. Energy 1991, 47, 173–179. [Google Scholar] [CrossRef]
  10. Noorian, A.M.; Moradi, I.; Kamali, G.A. Evaluation of 12 models to estimate hourly diffuse irradiation on inclined surfaces. Renew. Energy 2008, 33, 1406–1412. [Google Scholar] [CrossRef]
  11. Dave, J.V. Isotropic distribution approximation in solar energy estimations. Sol. Energy 1979, 22, 15–19. [Google Scholar] [CrossRef]
  12. Liu, B.Y.H.; Jordan, R.C. Daily insolation on surfaces tilted towards the equator. Trans. ASHRAE 1962, 53, 526–541. [Google Scholar]
  13. Badescu, V. A new kind of cloudy sky model to compute instantaneous values of diffuse and global solar irradiance. Theor. Appl. Climatol. 2002, 72, 127–136. [Google Scholar] [CrossRef]
  14. Tian, Y.Q.; Davies-Colley, R.J.; Gong, P.; Thorrold, B.W. Estimating solar radiation on slopes of arbitrary aspect. Agric. For. Meteorol. 2001, 109, 67–74. [Google Scholar] [CrossRef]
  15. Koronakis, P.S. On the choice of the angle of tilt for south facing solar collectors in the Athens basin area. Sol. Energy 1986, 36, 217–225. [Google Scholar] [CrossRef]
  16. Reindl, D.T.; Beckman, W.A.; Duffie, J.A. Evaluation of hourly tilted surface radiation models. Sol. Energy 1990, 45, 9–17. [Google Scholar] [CrossRef]
  17. Skartveit, A.; Olseth, J.A. Modelling slope irradiance at high latitudes. Sol. Energy 1986, 36, 333–344. [Google Scholar] [CrossRef]
  18. Steven, M.D.; Unsworth, M.H. The angular distribution and interception of diffuse solar radiation below overcast skies. Q. J. R. Meteorol. Soc. 1980, 106, 57–61. [Google Scholar] [CrossRef]
  19. Hay, J.E. Calculation of monthly mean solar radiation for horizontal and inclined surfaces. Sol. Energy 1979, 23, 301–307. [Google Scholar] [CrossRef]
  20. Felske, J.D. The effect of off-south orientation on the performance of flat-plate solar collectors. Sol. Energy 1978, 20, 29–36. [Google Scholar] [CrossRef]
  21. Ulgen, K. Optimum tilt angle for solar collectors. Energy Sour. Part A Recovery Util. Environ. Eff. 2006, 28, 1171–1180. [Google Scholar] [CrossRef]
  22. Beringer, S.; Schilke, H.; Lohse, I.; Seckmeyer, G. Case study showing that the tilt angle of photovoltaic plants is nearly irrelevant. Sol. Energy 2011, 85, 470–476. [Google Scholar] [CrossRef]
  23. Hachem, C.; Athienitis, A.; Fazio, P. Design of roofs for increased solar potential BIPV/T systems and their applications to housing units. ASHRAE Trans. 2012, 118, 660–676. [Google Scholar]
  24. Asl-Soleimani, E.; Farhangi, S.; Zabihi, M.S. The effect of tilt angle, air pollution on performance of photovoltaic systems in Tehran. Renew. Energy 2001, 24, 459–468. [Google Scholar] [CrossRef]
  25. Hussein, H.M.S.; Ahmad, G.E.; El-Ghetany, H.H. Performance evaluation of photovoltaic modules at different tilt angles and orientations. Energy Convers. Manag. 2004, 45, 2441–2452. [Google Scholar] [CrossRef]
  26. Devarakonda, L.; Mil’shtein, S. Limiting Solar Cell Heat-Up by Quantizing High Energy Carriers. ISRN Renew. Energy 2012, 2012. [Google Scholar] [CrossRef]
  27. Zhang, L.; Jing, D.; Zhao, L.; Wei, J.; Guo, L. Concentrating PV/T hybrid system for simultaneous electricity and usable heat generation: A review. Int. J. Photoenergy 2012, 2012. [Google Scholar] [CrossRef]
  28. Florschuetz, L.W. On heat rejection from terrestrial solar cell arrays with sunlight concentration. In Proceedings of the Photovoltaic Specialista Conference Record Mater, Scottsdale, AZ, USA, 6–8 May 1975; IEEE: Piscataway, NJ, USA. [Google Scholar]
  29. Wolf, M. Performance analyses of combined heating and photovoltaic power systems for residences. Energy Convers. 1976, 16, 79–90. [Google Scholar] [CrossRef]
  30. Florschuetz, L.W. Extension of the Hottel-Whillier model to the analysis of combined photovoltaic/thermal flat plate collectors. Sol. Energy 1979, 22, 361–366. [Google Scholar] [CrossRef]
  31. Kern, E.C., Jr.; Russell, M.C. Combined photovoltaic and thermal hybrid collector systems. In Proceedings of the 13th Photovoltaic Specialists Conference, Washington, DC, USA, 5–8 June 1978. [Google Scholar]
  32. Hendrie, S.D. Evaluation of combined photovoltaic/thermal collectors. In Proceedings of the Silver Jubilee Congress, Atlanta, GA, USA, 28 May–1 June 1979. [Google Scholar]
  33. Zondag, H.A. Flat-plate PV-Thermal collectors and systems: A review. Renew. Sustain. Energy Rev. 2008, 12, 891–959. [Google Scholar] [CrossRef]
  34. Raghuraman, P. Analytical Predictions of Liquid and Air Photovoltaic/Thermal, Flat-Plate Collector Performance. J. Sol. Energy Eng. 2010, 103, 291–298. [Google Scholar] [CrossRef]
  35. Skoplaki, E.; Palyvos, J.A. On the temperature dependence of photovoltaic module electrical performance: A review of efficiency/power correlations. Sol. Energy 2009, 83, 614–624. [Google Scholar] [CrossRef]
  36. Tripanagnostopoulos, Y. Aspects and improvements of hybrid photovoltaic/thermal solar energy systems. Sol. Energy 2007, 81, 1117–1131. [Google Scholar] [CrossRef]
  37. Braunstein, A.; Kornfeld, A. On the development of the solar photovoltaic and thermal (pvt) collector. IEEE Trans. Energy Convers. 1986, EC-1, 31–33. [Google Scholar] [CrossRef]
  38. Lalović, B.; Kiss, Z.; Weakliem, H. A hybrid amorphous silicon photovoltaic and thermal solar collector. Sol. Cells 1986, 19, 131–138. [Google Scholar] [CrossRef]
  39. O’Leary, M.J.; Clements, L.D. Thermal-electric performance analysis for actively cooled, concentrating photovoltaic systems. Sol. Energy 1980, 25, 401–406. [Google Scholar] [CrossRef]
  40. Mbewe, D.J.; Card, H.C.; Card, D.C. A model of silicon solar cells for concentrator photovoltaic and photovoltaic/thermal system design. Sol. Energy 1985, 35, 247–258. [Google Scholar] [CrossRef]
  41. Joshi, A.S.; Dincer, I.; Reddy, B.V. Performance analysis of photovoltaic systems: A review. Renew. Sustain. Energy Rev. 2009, 13, 1884–1897. [Google Scholar] [CrossRef]
  42. Nfaoui, M.; El-Hami, K. Optimal tilt angle and orientation for solar photovoltaic arrays: case of Settat city in Morocco. Int. J. Ambient Energy 2018. [Google Scholar] [CrossRef]
  43. Al-Waeli, A.H.A.; Sopian, K.; Kazem, H.A.; Chaichan, M.T. Photovoltaic/Thermal (PV/T) systems: Status and future prospects. Renew. Sustain. Energy Rev. 2017, 77, 109–130. [Google Scholar] [CrossRef]
  44. Moradi, K.; Ebadian, M.A.; Lin, C.X. A review of PV/T technologies: Effects of control parameters. Int. J. Heat Mass Transf. 2013, 64, 483–500. [Google Scholar] [CrossRef] [Green Version]
  45. Michael, J.J.; Iniyan, S.; Goic, R. Flat plate solar photovoltaic-thermal (PV/T) systems: A reference guide. Renew. Sustain. Energy Rev. 2015, 51, 62–88. [Google Scholar] [CrossRef]
  46. Abdelrazik, A.S.; Al-Sulaiman, F.A.; Saidur, R.; Ben-Mansour, R. A review on recent development for the design and packaging of hybrid photovoltaic/thermal (PV/T) solar systems. Renew. Sustain. Energy Rev. 2018, 95, 110–129. [Google Scholar] [CrossRef]
  47. Kazem, H.A. Evaluation and analysis of water-based photovoltaic/thermal (PV/T) system. Case Stud. Therm. Eng. 2019, 13, 100401. [Google Scholar] [CrossRef]
  48. Ramos, A.; Chatzopoulou, M.A.; Guarracino, I.; Freeman, J.; Markides, C.N. Hybrid photovoltaic-thermal solar systems for combined heating, cooling and power provision in the urban environment. Energy Convers. Manag. 2017, 150, 838–850. [Google Scholar] [CrossRef]
  49. Abdullah, A.L.; Misha, S.; Tamaldin, N.; Rosli, M.A.M.; Sachit, F.A. Photovoltaic thermal /solar (PVT) collector (PVT) system based on fluid absorber design: A review. J. Adv. Res. Fluid Mech. Therm. Sci. 2018, 48, 196–208. [Google Scholar]
  50. Chen, J.F.; Zhang, L.; Dai, Y.J. Performance analysis and multi-objective optimization of a hybrid photovoltaic/thermal collector for domestic hot water application. Energy 2018, 143, 500–516. [Google Scholar] [CrossRef]
  51. Al-Waeli, A.H.A.; Sopian, K.; Chaichan, M.T.; Kazem, H.A.; Hasan, H.A.; Al-Shamani, A.N. An experimental investigation of SiC nanofluid as a base-fluid for a photovoltaic thermal PV/T system. Energy Convers. Manag. 2017, 142, 547–558. [Google Scholar] [CrossRef]
  52. Al-Waeli, A.H.A.; Chaichan, M.T.; Kazem, H.A.; Sopian, K.; Safaei, J. Numerical study on the effect of operating nanofluids of photovoltaic thermal system (PV/T) on the convective heat transfer. Case Stud. Therm. Eng. 2018, 12, 405–413. [Google Scholar] [CrossRef]
  53. Al-Waeli, A.H.A.; Chaichan, M.T.; Sopian, K.; Kazem, H.A.; Mahood, H.B.; Khadom, A.A. Modeling and experimental validation of a PVT system using nanofluid coolant and nano-PCM. Sol. Energy 2019, 177, 178–191. [Google Scholar] [CrossRef]
  54. Chow, T.T. A review on photovoltaic/thermal hybrid solar technology. Appl. Energy 2010, 87, 365–379. [Google Scholar] [CrossRef]
  55. Basant Agrawal, G.N.T. Building Integrated Photovoltaic Thermal Systems: For Sustainable Developments, 1st ed.; Royal Society of Chemistry: London, UK, 2010. [Google Scholar]
  56. Historical Climate Data. Available online: http://www.climate.weatheroffice.gc.ca/ (accessed on 8 March 2019).
  57. Tan, H.M.; Charters, W.W.S. Effect of thermal entrance region on turbulent forced-convective heat transfer for an asymmetrically heated rectangular duct with uniform heat flux. Sol. Energy 1969, 12, 513–516. [Google Scholar] [CrossRef]
  58. Shahsavar, A.; Salmanzadeh, M.; Ameri, M.; Talebizadeh, P. Energy saving in buildings by using the exhaust and ventilation air for cooling of photovoltaic panels. Energy Build. 2011, 43, 2219–2226. [Google Scholar] [CrossRef]
  59. White, F.M. Fluid Mechanichs, 7th ed.; University of Rhode Island: Kingston, RI, USA, 2011. [Google Scholar]
  60. Rowlands, I.H.; Kemery, B.P.; Beausoleil-Morrison, I. Optimal solar-PV tilt angle and azimuth: An Ontario (Canada) case-study. Energy Policy 2011, 39, 1397–1409. [Google Scholar] [CrossRef]
  61. Chang, T.P. Output energy of a photovoltaic module mounted on a single-axis tracking system. Appl. Energy 2009, 86, 2071–2078. [Google Scholar] [CrossRef]
  62. Incropera, F.P.; Dewitt, D.P.; Bergman, T.L.; Lavine, A.S. Fundamentals of Heat and Mass Transfer, 6th ed.; Wiley: Hoboken, NJ, USA, 2007. [Google Scholar]
Figure 1. Zenith, slope, solar altitude angle, and surface azimuth angles for a tilted solar panel.
Sustainability 11 06443 g001
Figure 2. Schematic of the roof integrated photovoltaic/thermal (PV/T) and the thermal energy recovery system.
Sustainability 11 06443 g002
Figure 3. Monthly average daily solar radiation availability of tilted surfaces using an isotropic Equation (10) [13].
Sustainability 11 06443 g003
Figure 4. Monthly average daily solar radiation availability of tilted surfaces using an anisotropic Equation (16) [18].
Sustainability 11 06443 g004
Figure 5. Optimum seasonal tilt angles.
Sustainability 11 06443 g005
Figure 6. Yearly optimal tilt angle for different orientations (Equation (10)).
Sustainability 11 06443 g006
Figure 7. Yearly average solar radiation on a tilted surface for different orientations (Equation (10)).
Sustainability 11 06443 g007
Figure 8. Average monthly variation of the outlet, mean, and inlet temperatures.
Sustainability 11 06443 g008
Figure 9. Effect of photovoltaic (PV) panel orientation on the outlet temperature.
Sustainability 11 06443 g009
Table 1. Optimum tilt angle (βopt in degrees) and monthly average daily solar radiation on a tilted surface (HT in kWh/m2/day) for each month of the year for a south-facing solar collector in the Greater Toronto Area (GTA), Canada.
MonthIsotropic ModelsAnisotropic Models
Equation (9)Equation (10)Equation (11)Equation (12)Equation (13)Equation (14)Equation (16)Equation (17)
HTβoptHTβoptHTβoptHTβoptHTβoptHTβoptHTβoptHTβopt
January3.28663.16713.22713.38714.08723.99704.68683.9968
February4.19604.02604.08644.30644.93654.84635.63634.8463
March5.74475.53425.54495.86526.63546.57537.56526.5752
April6.31316.16236.01266.39366.90396.87388.48406.8740
May7.58227.50187.33167.63258.04288.04289.51298.0429
June8.18168.12127.9758.21188.56238.562310.4238.5623
July8.58198.51158.34128.61219.05259.062510.66259.0625
August7.76277.65227.50237.81298.39338.39339.63338.3933
September5.88355.72295.63345.96386.61436.58427.79436.5843
October4.35454.18404.17474.44495.12545.05526.10535.0553
November2.36512.24462.26542.44562.84612.77573.75602.7760
December2.12642.03682.07692.20692.59712.51683.31682.5168
Table 2. Seasonal average optimum tilt angle for south-facing solar panels in GTA.
MonthSeasonIsotropic ModelsAnisotropic Models
Equation (9)Equation (10)Equation (11)Equation (12)Equation (13)Equation (14)Equation (16)Equation (17)
βopt (o)βopt (o)βopt (o)βopt (o)βopt (o)βopt (o)βopt (o)βopt (o)
Decemberwinter63.3366.3368.0068.0069.3367.0066.3366.33
January
February
MarchSpring33.3327.6730.3337.6740.3339.6740.3340.33
April
May
JuneSummer20.6716.3313.3322.6727.0027.0027.0027.00
July
August
SeptemberFall43.6738.3345.0047.6752.6750.3352.0052.00
October
November
Table 3. Yearly average optimum tilt angles for south facing collectors for GTA obtained using isotropic and anisotropic models.
Isotropic ModelsAnisotropic Models
Equation (9)Equation (10)Equation (11)Equation (12)Equation (13)Equation (14)Equation (16)Equation (17)
βopt40.2537.1739.1744.0047.3346.0046.4246.42
Table 4. Loss of energy under different tilt conditions of solar panel for isotropic models. SL: Energy loss when using the seasonal adjustment. YL: Energy loss when using fixed angle throughout the year calculated only for the maximum insolation (July). Y. Avg.: Yearly average. HT: Daily global radiation on a tilted surface. S: Seasonal.
Equation (9)Equation (10)Equation (11)Equation (12)
MonthHTS HTSL (%)HTS HTSL (%)HTS HTSL (%)HTS HTSL (%)
December2.123.20 2.033.07 2.073.12 2.203.30
January3.28−2.53.16−2.83.22−3.13.38−2.4
February4.19−244.02−244.08−244.30−23
March5.746.54 5.536.40 5.546.29 5.866.63
April6.31 6.16 6.01 6.39
May7.58−147.50−157.33−147.63−13
June8.188.17 8.128.09 7.977.94 8.218.21
July8.58−58.51−5.28.34−4.88.61−4.6
August7.76 7.65 7.50 7.81
September5.884.20−295.724.05−295.634.02−295.964.28−28
October4.35−3.44.18−3.14.17−3.64.44−3.6
November2.36 2.24 2.26 2.44
Y. Avg.5.53 5.40 5.34 5.60
YL (%)37 37 36 35
Table 5. Loss of energy under different tilt conditions of solar panel for anisotropic models. SL: Energy loss when using the seasonal adjustment. YL: Energy loss when using fixed angle throughout the year calculated only for the maximum insolation (July). Y. Avg.: Yearly average. HT: Daily global radiation on a tilted surface. S: Seasonal.
Equation (13) Equation (14) Equation (16) Equation (17)
MonthHTS HTSL (%)HTS HTLS (%)HTS HTSL (%)HTS HTSL (%)
December2.593.87 2.513.78 3.314.54 2.513.78
January4.08−5.13.99−5.34.68−33.99−5.3
February4.9321.54.84−225.63−194.84−22
March6.637.19 6.577.16 7.568.52 6.577.16
April6.90 6.87 8.48 6.87
May8.04−10.68.04−119.51−108.04−11
June8.568.67 8.568.67 10.4010.23−1.68.568.67
July9.05−4.29.06−4.310.66−49.06−4.3
August8.39 8.39 9.63 8.39
September6.614.86−26.56.584.80−277.795.88−256.584.80−27
October5.12−5.15.05−56.10−3.65.05−5
November2.84 2.77 3.75 2.77
Y. Avg.6.14 6.10 7.29 6.10
YL (%)32.1 32.6 31.6 32.6
Table 6. Daily global radiation on a tilted surface for different panel orientations (east or west of south), (γ: orientation).
γ−30−25−20−15−10−5051015202530
HT5.2585.3005.3355.3645.3855.3975.4025.3975.3855.3645.3355.3005.258
Table 7. Average monthly climatic data.
MonthJanuaryFebruaryMarchAprilMayJuneJulyAugustSeptemberOctoberNovemberDecember
Avg. T (°C)−120.144.763.439.781828.623.0811.149.512.15.6
Wind v (m/s)3.071.963.137.426.982.444.914.76.410.55.125.83
Tairout (°C)1.1817.421.612.120.44444.738.620.614.2179.6
Tm (°C)3.8712.717.310.11837.140.834.818.413.215.98.7
Table 8. Parameters used for computing the outlet and mean temperatures. Physical properties obtained from [62].
αcηelma [kg/s]Cp [J/kgK]ρa [kg/m3]V [m/s]ν [m2/s]k [WmK]kins [W/mK]δins [m]
0.90.15310071.1614115.89 × 10−60.02630.0350.03

