


Abstract
The MLC1 gene is involved in an autosomal recessive neurological disorder, megalencephalic leucoencephalopathy with subcortical cysts (MLC), which is characterized by macrocephaly during the first year of life and swollen white matter (leucoencephaly). Variants of MLC1 have also been associated with psychiatric disorders such as schizophrenia, major depression and bipolar disorder. Currently, little is known about the encoded protein (MLC1). Judging from its similarity to other known proteins, it may serve as a trans-membrane transporter. However, the function of the encoded protein and its gene regulation has not been investigated successfully so far. We investigated the 5' region of the murine Mlc1 with respect to regulatory elements for gene expression. A promoter search and an in silico analysis were conducted. Luciferase reporter gene constructs with potential promoter regions were created to study promoter activity in vitro. We found two alternative first exons for the murine Mlc1 but were not able to detect any promoter activity for the investigated reporter gene constructs in different cell lines, thus pointing to the presence of essential cis-acting elements far outside of the region. In silico analysis indicated an uncommon promoter structure for Mlc1, with CCAAT-boxes representing the only noticeable elements.
Introduction
Autosomal recessive mutations, either homozygous or compound heterozygous, of MLC1 cause megalencephalic leucoencephalopathy with subcortical cysts (MLC). This disease was first described in 1995 by van der Knaap and colleagues as a neurological disorder characterized by macrocephaly and leucoencephalopathy. Onset occurs during the first year of life and subsequently leads to deterioration of motor functions and mental decline. Magnetic resonance imaging (MRI) showed swollen white matter of the cerebral hemisphere and subcortical cysts in the anterior-temporal and frontoparietal regions.1 Furthermore, several reports point to an association of MLC1 variants with several psychiatric disorders. Meyer and co-workers described a Leu309Met mutation of MLC1, co-segregating with schizophrenia in a large family.2 Similarly, a Leu308Gln mutation co-segregated with bipolar disorder in a single affected family, and single nucleotide polymorphisms of MLC1 have been associated with schizophrenia and bipolar disorder,3 and Verma, personal communication. Rubie and colleagues found the Leu309Met mutation in a single schizophrenic patient and his father,4 and Selch and co-workers confirmed association of MLC1 polymorphisms with schizophrenia.5 Additionally, Spijker and colleagues described a change in MLC1 gene expression level in patients suffering from major depression.6 The MLC1 gene (OMIM *605908) is mainly expressed in astrocytes, as well as in ependymal cells, Bergman glia and leucocytes.7–9 In mice, MLC1 expression has also been detected in neurons.10 Immunostaining and electron microscopy demonstrated the localization of MLC1 in perivascular astrocytic end-feet and astrocyte-astrocyte contact regions. MLC1 is concentrated at brain barriers like pia mater and ependyma.7,9 However, the actual function of MLC1 is still unknown. It has been reported that Mlc1 is a protein with most probably eight trans-membrane domains and a marginal sequence identity to ABC2 transporters and the potassium channel Kv1.1.2,7,11 Since most of the proteins containing eight trans-membrane domains have transporter or channel function,7 the function of Mlc1 as trans-membrane transport protein seems to be probable, even if no ion transport activity could be demonstrated and no ligand of Mlc1 has been identified so far.2,11 The murine Mlc1 is located on chromosome 15E3. It consists of 12 exons, whereby the translation start site (TLSS) is located in exon 2. The gene encodes a 382 amino acid protein, which shows 87% sequence identity to the human protein. To date, nothing is known about the regulation of Mlc1, however, whilst determining the genomic structure, Steinke et al. suggested a putative promoter region. Several transcription start sites (TSS) were found in a 5' region of approximately 70 bp, with the putative TSS being deposited in the GenBank database under accession no. BG297871,12 in line with the transcriptional start site provided by Ensembl version 56. In this study, the 5' region of Mlc1 was analyzed in more detail to achieve further information about the structure of the regulatory region and the regulation of Mlc1. Several putative promoter regions have been investigated by luciferase reporter gene assays. Mlc1 was also studied with respect to four potential alternative first exons, and in silico analyses of the upstream region of Mlc1 were conducted.
Materials and Methods
Expression studies
Whole brain, testis, amygdalae, hippocampi, hypothalami, cortex and cerebella of Mus musculus domesticus Black 6 (C57BL/6) were used for mRNA isolation. Reverse transcription into cDNA was performed with the RevertAid First Strand cDNA Synthesis Kit (Fermentas) using oligodT-primers. Primers used for expression analysis of the alternative first Mlc1 exons are shown in Table 1. Primers were optimized on genomic DNA. The PCR for Mlc1 exon1A was performed using 10 pmol of each primer, 200 µM dNTPs, 2.0 mM MgCl2, 50 mM KCl, 10 mM TrisHCl (pH 8.3), 0.0025 mg/mL BSA, 0.025% Tween20 and 1 U Taq-Polymerase. PCR for Mlc1 exon1B, exon1C and exon1E were performed using 10 pmol of each primer, 200 µM dNTPs, 1.5 mM MgCl2, 50 mM KCl, 10 mM TrisHCl (pH 8.3), 0.0025 mg/mL BSA, 0.025% Tween20 and 1 U Taq-Polymerase. The following thermocycler protocol was used: initial denaturation step (4 min, 94°C), followed by 39 cycles of denaturation (30 sec, 94°C), annealing (30 sec at appropriate temperature) and extension (30–60 sec, 72°C), ending with a final extension (10 min, 72°C) and cooling down to 4°C. PCR for Mlc1 expression was conducted with an annealing temperature of 63°C. Purity of cDNA was controlled by taking intron spanning Beta-actin (ActB) primers (for: 5'-AGGCTGTGCTGTCCCTGTAT-3'; rev: 5'-GTTTGCTCCAACCAACTGCT-3') using an annealing temperature of 60°C. Primers for detection of Pomp pseudogene expression (for: 5'-GGCTGTGCTAGAGGTCCTTG-3'; rev: 5'-AGAGCTCCGCAACTGGAATA-3') worked at an annealing temperature of 57°C.

Table 1.
Primer pairs for expression analysis of putative first Mlc1 exons.
Assembly of luciferase reporter gene constructs
Reporter gene constructs were assembled by cloning putative promoter sequences into the pGL3-Basic vector (Promega). The putative promoter sequences were originated from the 5' region of Mlc1 (ENSMUSG 00000035805; Ensembl version 56) and amplified by PCR. High Fidelity Taq Polymerase from Fermentas was used for amplification. The primers used contained MluI- and XhoI-specific restriction sites for subsequent cloning into the pGL3-Basic vector. Primer sequences, sizes and positions of the investigated putative promoter sequences are shown in Table 2. Restriction sites and nucleotide overhang of 3 bp, which were used for a better restriction efficiency, are underlined.
Table 2.
Primers for creating pGL3-luciferase constructs.
Cell culture
Experiments were performed in two Mlc1-expressing cell types, U373 MG glioblastoma-astrocytoma cells (ECACC 89081403), and a murine astrocyte cell line generated by transfecting primary astrocytes with an expression plasmid encoding the SV40 large T-antigen. Both cell types were grown in D-MEM High Glucose, supplemented with 10 % fetal calf serum (FCS), 2 mM L-glutamine and 1 % penicillin/streptomycin (Pen/Strep) at 37°C in a humidified atmosphere of 5 % CO2. Cells were passaged at around 80 % confluency.
Transfection and stimulation
Cells were seeded at a density of 8×10⁴ cells/mL in 24-well plates 24 hours prior to transfection. Transfection was done with Superfect (Qiagen) in a v/w ration of 10:1 (µL Superfect: µg DNA). 1 µg DNA contained 0.96 µg pGL3-luciferase constructs and 0.04 µg pGL4-74 (HRLUC/TK, Renilla luciferase; Promega). After 24 hours of incubation, cells were treated with one of the following: 50 µM dexamethasone (Dex), 50 µM Forskolin (For), 2 µM phorbol 12-myristate acetate (PMA) for 24 hours, or with lipopolysaccharide (LPS) for 30 minutes.
Luciferase assay
Cells were harvested in 50 µL Passive Lysis Buffer (PLB; Promega) 48 hours after transfection. Firefly and Renilla luciferase activities were measured sequentially with 10 µl of total cell lysates and 50 µL of luciferase assay reagent (LAR), followed by the addition of 50 µl of Stop & Glo reagent. The activity was determined by luminescence measurement for 10 sec in a liquid scintillation spectrophotometer (Berthold). The luminescence was given in Relative Light Units (RLU). Experiments were done in triplicates or quadruplicates from three independent trials. Promoter activities are given as ratio of firefly luciferase activity (RLU) divided by the activity of Renilla luciferase (RLU). While the firely luciferase activity indicates promoter activity, activity of Renilla luciferase is used as a control for transfection efficiency.
In silico analysis
PROSCAN Version 1.7 (http://www-bimas.cit.nih.gov/molbio/proscan/) was used for in silico analysis of the 5' region of Mlc1. Further in silico analysis was conducted for the region between 350 bp upstream of the first exon of Mlc1 released in the ensembl database and the beginning of the TLSS in exon 2. Search for common promoter elements like TATA-, CCAAT- and GC-boxes was done according to the consensus sequences described by Suzuki and colleagues.13 Sequences were considered as binding sites if they showed ≥80% identity to the given consensus sequences and fit 100 % to the core sequence (Table 3). Consensus sequences for CCAAT- and GC-boxes were checked in both directions (forward and reverse complementary). The ratio of observed CpG to received CpG was calculated to identify CpG-islands. The used formula: CpG(O/R) = (CpG/(Cs*Gs))*N was taken from Gardiner and Garden.14 CpG(O/R) means ratio of observed and received CpGs, N is the number of nucleotides investigated. Moving averages of % G+C content and ratio of observed CpG to received CpG were calculated with CpGPlot from EMBL-EBI (http://www.ebi.ac.uk/Tools/emboss/cpgplot/) using a 200 bp window (N=200) moving across the sequence at 1 bp intervals. In addition, a search by TRANSFAC Version 2009.1 was accomplished to search for potential transcription factor binding sites. The UCSC database (UCSC version, February 2009) was used to check for regions conserved between mouse and human of the Mlc1/MLC1 5' region up to the next 5' gene Mov10l1/MOV10L1.
Table 3.
Consensus sequence of TATA-, GC- and CCAAT-Box.
Results
Structural characterization of the 5' region of Mlc1
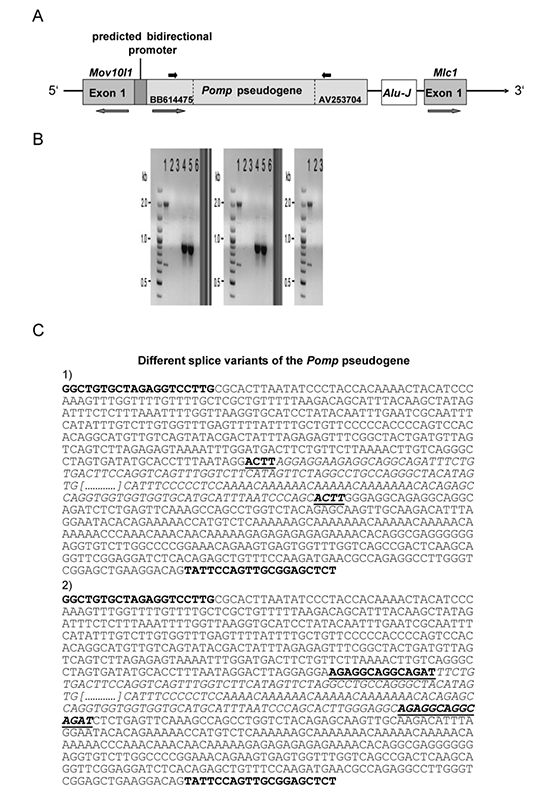
As a first step to find any regulatory regions for Mlc1, an analysis with the promoter search PROSCAN Version 1.7 software was conducted. The closest putative promoter predicted by PROSCAN was located 4.3 kb upstream of Mlc1. Interestingly, this predicted promoter region of 345 bp seemed to work in a bi-directional modus. The sequence is flanked by Mov10l1, the adjacent annotated gene on the opposite strand with respect to Mlc1, and BB614475, located on the same strand as Mlc1. A database search for ESTs between Mov10l1 and Mlc1 provided two sequences, GenBank accession numbers BB614475 and AV253704, both being located on the same strand as Mlc1 and part of the same cDNA clone (clone ID: 921504G13) (Figure 1A). The expressed sequence of clone ID: 921504G13 AV253704 has already been reported by Steinke and colleagues.12 They described a high sequence similarity to the Homo sapiens voltage-gated K channel beta subunit 4.1 mRNA (Hspc014), which is officially named proteasome maturation protein gene (Pomp). Additionally, they described an Alu-J-like element being located between AV253704 and Mlc1 (Figure 1).12 As the expression of BB614475 and AV253704 were known for testis (according to the RIKEN gene bank entry), we wanted to test whether i) the whole sequence between BB614475 and AV253704 is transcribed; and ii) BB614475 and AV253704 were also expressed in the murine brain. Therefore, PCRs with murine testis and murine brain cDNA were conducted. The forward primer was located in BB614475 and the reverse primer in AV253704. The result showed that there is no expression in murine brain. For murine testis, the result showed one small PCR product of ∼700 bp and one larger of 2015 bp. Direct sequencing of the smaller amplicon revealed two different splice variants of the Pomp pseudogene, showing the same size of 675 bp. Splicing occurred at repetitive sequences; therefore, it is not possible to provide the exact splicing positions. Sequencing of the 2015 bp amplicon confirmed the expected size and sequence of the murine genomic DNA. The last 707 bp of the larger amplicon show a 87% identity to Pomp, but there was no similarity for the first 1308 bp. Due to the partial similarity to Pomp, we have consequently termed this the Pomp pseudogene. As far as a contamination of the PCR with gDNA could be excluded, this experiment showed that there are at least three different Pomp mRNAs transcribed. Expression levels and sequences of the Pomp pseudogene splice variants are shown in Figure 1 (b,c). Even if the Pomp pseudogene may have no influence on Mlc1 expression, as it is not expressed in brain, this transcript seems to be an interesting finding because of its unconventional splicing.
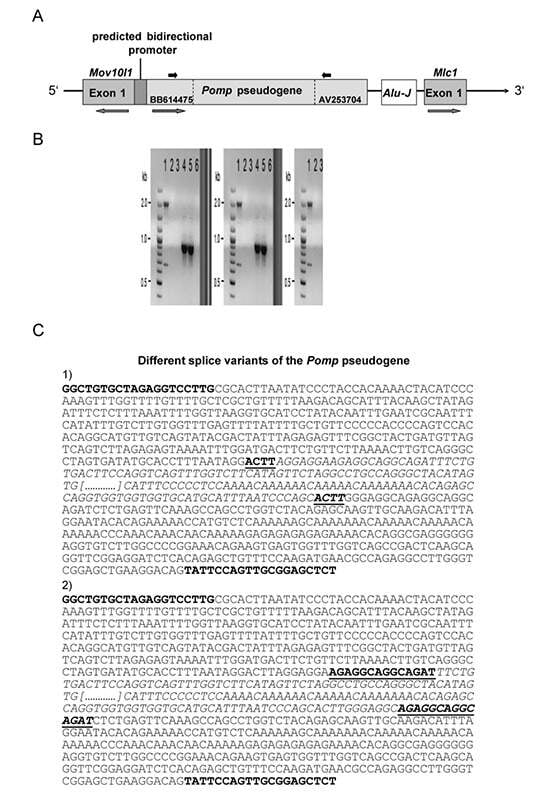
Figure 1.
A) schemic overview of the 5' region of the murine Mlc1 gene. The 5' region of Mlc1 consists of an Alu-J-like element and a Pomp pseudogene. The sole promoter predicted by PROSCAN software is a bidirectional promoter 4.3 kb upstream of Mlc1, evidently acting for Mov10l1 and the Pomp pseudogene. The grey arrow bars display the orientation of the genes and the black arrow bars display the position of the primers which were used to check for the Pomp pseudogene expression. B) expression of the Pomp pseudogene in murine testis and brain. Expression of Pomp pseudogene was shown in testis (lane 1). Beside the expected fragment of 2015 bp, a smaller fragment of 675 bp was detected. No expression for the Pomp pseudogene was detected in brain tissue (lane 2). As positive control, ActB was used (lane 4: testis, lane 5: brain tissue). As negative controls, water was used instead of cDNA (lane 3 and 6). C) different splice variants of the Pomp pseudogene in testis. Splicing occurred at certain repeats (bold and underlined). Bold letters represent the position of the primer pair for expression analysis. Italicized letters represent the sequence which was spliced out. Portion of unshown sequence is replaced by dots.
Expression studies
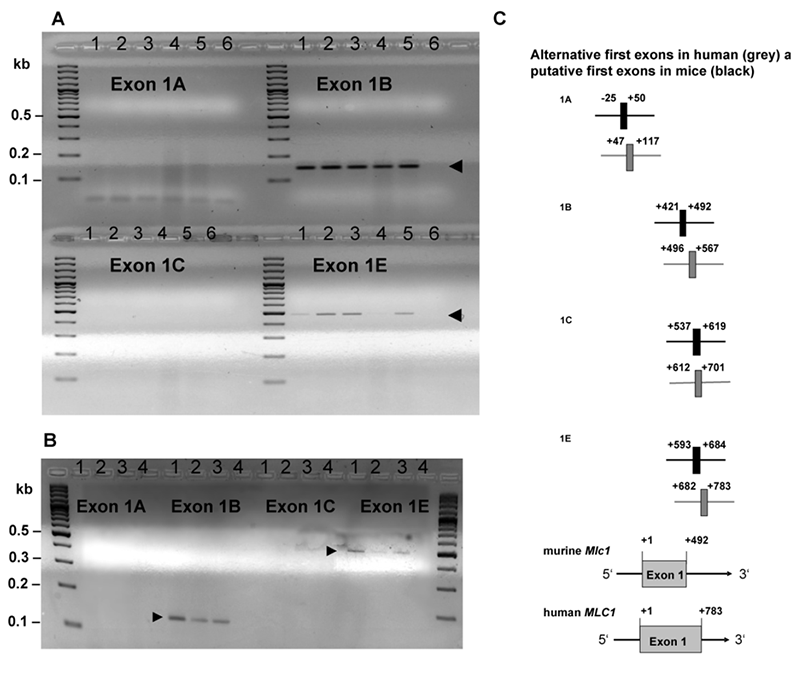
For the human MLC1, several alternative first exons are known, which are described in the database of transcriptional start sites (DBTSS). To investigate if alternative first exons of Mlc1 in mice exist, we compared the sequence of the human MLC1 first exons with the orthologous murine Mlc1 sequence. Several MLC1 first exons were released in the DBTSS, but only first exons with common acceptor- and donor-sites (GT/AG) were examined for sequence similarity to the murine Mlc1 in the present study. Sequences of the first exons fulfilling this condition (exon 1A, exon 1B, exon 1C and exon 1E) were used for alignments with the orthologous murine sequence. Sequence identity varied from 47.8% (exon 1E) to 76.7% (exon 1B). To test the expression of the alternative first exons in mice, PCRs with cDNA from different murine brain regions and a murine astrocyte cell line were conducted. For this, the forward primer was located in the orthologous first exon sequence and the reverse primer was located in exon 2, downstream of the translation start site (TLSS). Used primers and expected amplicon sizes are shown in Table 1. Expression was detected for Mlc1 exon 1B and exon 1E only (Figure 2 a,b). Real time PCR experiments were conducted to compare the expression rate of both exons. The experiment failed to quantify the expression rate of exon1E, so no conclusion of the relationship between expression of exon1B and exon1E can be drawn. Expression for both first exons could be detected in amygdala, hippocampus, hypothalamus, cerebellum, cortex and the murine astrocyte cell line. Sequencing of exon 1B resulted in a 143 bp sequence with a splice position at +492 bp/+1010 bp. This diverged from the data provided by Ensembl, where the exon 2 of Mlc1 starts at position +993 bp. All positions are according to the Mlc1 exon 1 released in the Ensembl database version 56 (ENSMUSG 00000035805), where +1 is representing the transcriptional start site of exon 1. The murine exon 1E showed a size of 480 bp, which was assumed to be the identical size of the related genomic DNA sequence. The sequencing of exon 1E confirmed this assumption as the same sequence as the genomic DNA is shown. Sequencing data are available on request.
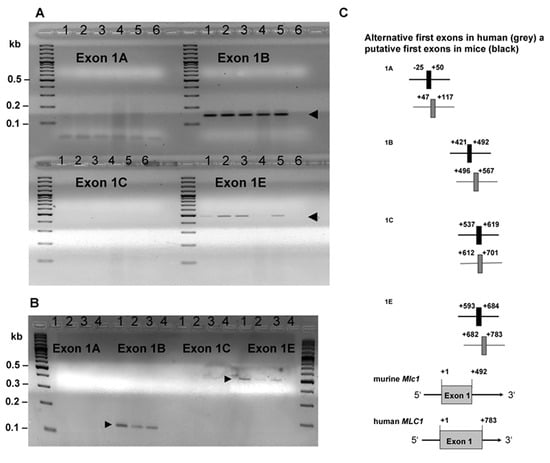
Figure 2.
A) Expression analysis of the alternative first exons for murine Mlc1 in amygdalae (lane 1), hypothalamus (lane 2), hippocampus (lane 3), cerebellum (lane 4) and cortex (lane 5). Water instead of DNA was used as negative control (lane 6). Expression was detected in all tissues of exon 1B (143 bp band) and 1E (480 bp band). Expression of exon 1A and 1C could not be detected. B) Expression analysis of the alternative first exons for murine Mlc1 in the astrocyte cell line shows expression of exon 1B and 1E (see arrows). Lanes 1 to 3 contain three independent preparations of cDNA from the same astrocyte cell line. Water instead of DNA was used as negative control (lane 4). C) Schematic overview of the alternative first exons of the MLC1 gene in human (in grey) and the putative first Mlc1 exons in mice (in black). Positions of the alternative first exons of human MLC1 were taken from the database for transcriptional start sites (DBTSS version 4.0) and all positions are referring to the transcriptional start site (+1) of MLC1 exon 1 released in the Ensembl database version 56. Putative first exons of the murine Mlc1 were chosen by sequence similarity to the human sequences. Figures are not to scale.
Luciferase reporter gene assay
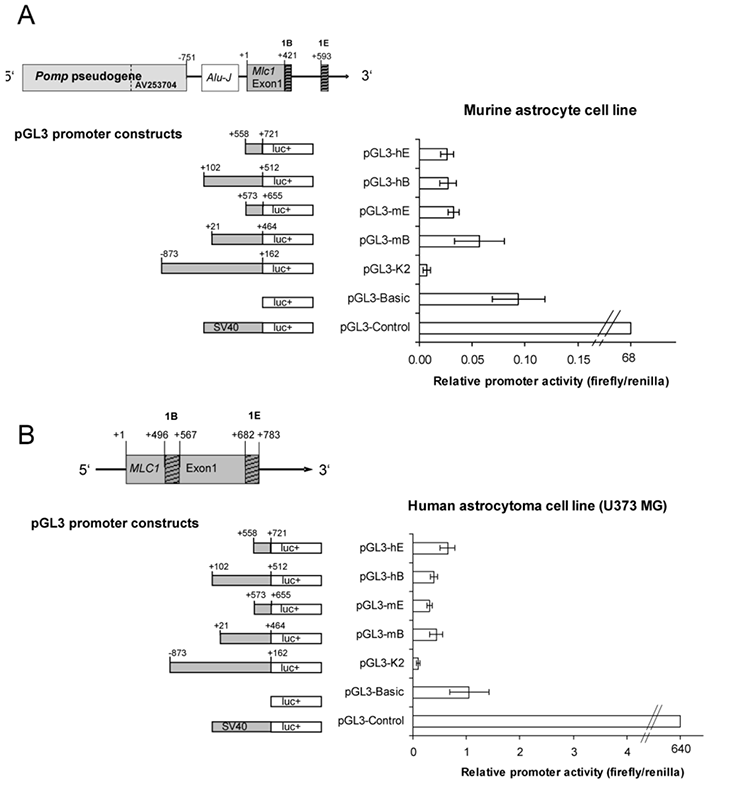
In order to investigate the regulatory activity of the region upstream of the TSS of Mlc1, reporter gene plasmids based on pGL3-Basic (Promega) were constructed. Initially, two fragments, from position -4183 bp to +96 bp (pGL3-K1) and from position -871 bp to +51 bp (pGL3-K2) were inserted into pGL3-Basic. The positions are corresponding to the Mlc1 exon 1 released in the Ensembl database (version 56). The aim was to find out whether the sole predicted promoter region 4.3 kb upstream of Mlc1 shows any effect on gene expression, or if there is any regulatory element present downstream of the Pomp pseudogene, which was not predicted by the applied software. Measurement of luciferase activity of pGL3-K1 and pGL3-K2 did not show any promoter activity compared to pGL3-Basic (data not shown). The expression analysis of putative alternative first exons revealed only expression for exon 1B and exon 1E, hence further pGL3-luciferase constructs were assembled with the regions immediately upstream of the first exon 1B and 1E. Additionally, pGL3-luciferase constructs with the putative promoter regions of the human exons 1B and 1E were created (Figure 3). All pGL3-luciferase constructs revealed lower activity levels compared to pGL3-Basic, which served as negative control (Figure 3 a,b). PGL3-K2, where no expression could be detected for the corresponding exon 1A, has been used as a further negative control. For these experiments, pGL3-Control was used as positive control. All cells were co-transfected with pGL4 to check for transfection efficiency. To investigate whether the promoter reacts under certain stimulations, activity was measured under treatment with dexamethasone, forskolin, PMA, or LPS. The results showed no sensitivity of the putative promoter regions to any of the tested stimulants under the applied conditions (data not shown).
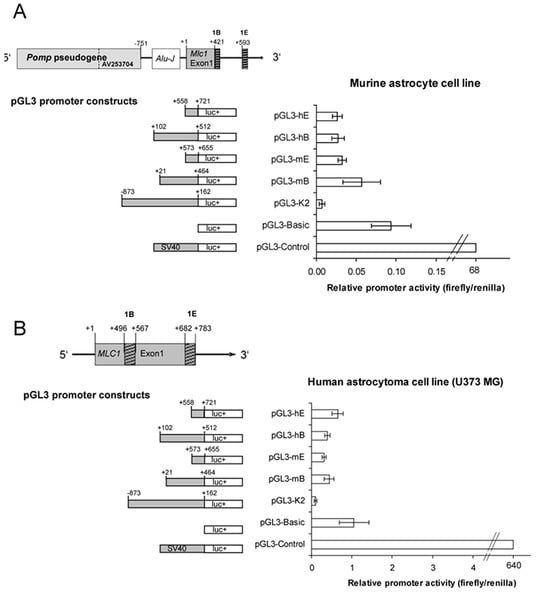
Figure 3.
A) Reporter gene constructs used and the relative promoter activity in the murine astrocyte cell line. All positions are referring to the transcriptional start site (+1) of Mlc1 exon 1 released in the Ensembl database version 56. Ratio of Luciferase activity (RLU)/Renilla activity (RLU) was used to calculate for promoter activity. Data represent the mean ± SD of three independent triplicates under basal conditions. Murine pGL3-promoter constructs (pGL3-mB, pGL3-mE and pGL3-K2) and human pGL3-promoter constructs (pGL3-hB and pGL3-hE) showed lower activity than the negative control (pGL3-Basic), which contains no promoter. pGL3-Control contains a strong SV40 promoter and was used as positive control. B) Used reporter gene constructs and the relative promoter activity in the human astrocytoma cell line U373 MG. All positions are referring to the transcriptional start site (+1) of MLC1 exon 1 released in the Ensembl database version 56. Ratio of Luciferase activity (RLU)/Renilla activity (RLU) was used to calculate for promoter activity. Data represent the mean ± SD of three independent triplicates under basal conditions. Murine pGL3-promoter constructs (pGL3-mB, pGL3-mE and pGL3-K2) and human pGL3-promoter constructs (pGL3-hB and pGL3-hE) showed lower activity than the negative control (pGL3-Basic), which contains no promoter. pGL3-Control contains a strong SV40 promoter and was used as positive control.
In silico study
For in silico analysis of the murine and the human putative Mlc1 promoters, the whole sequence from position −350 bp to the TLSS was investigated. The human MLC1 TLSS is located at position +1020 bp, whereas the murine TLSS is located at +1015 bp. Positions are according to Mlc1 exon 1 from Ensembl database version 57. Consensus sequences were taken from Suzuki and colleagues, who studied over 1000 promoter regions.13 They described GC-boxes for 97%, CCAAT-boxes for 64% and TATA-boxes for 32% of the investigated promoter regions. In our study, we did not detect any GC-boxes or TATA-boxes consistent with the consensus sequences provided by Suzuki and colleagues (Table 3).
The analysis revealed no CCAAT-boxes for human and only two putative CCAAT-boxes for mice, which had previously been described by Steinke and colleagues.12 The CCAAT-boxes are located at positions −119 to −109 and −32 to −22. Additionally, a sequence analysis with TRANSFAC Version 2009.1 was performed for human and mouse to search for potential nuclear factor 1 (NF-1), specificity protein 1 (SP-1) and activating proteins (AP-1, AP-2) binding sites. Two NF-1 binding sites were found for the mouse. As NF-1 is known for binding at CCAAT-boxes, the first putative NF-1 binding site was identical to the CCAAT-box at position −119 to −109. The second putative NF-1 binding site was at position +279 to +289. The match to the consensus core sequence was 1.000, and the overall matrix sequence was 0.773 for the first NF-1 binding site and 0.911 and 0.754 for the second one. There were no predicted binding sites for AP-1, AP-2 and SP-1. Since the preferred regions of CCAAT-boxes involved in transcription are generally located −105 to −70 from the TSS,13 and the fact that Mlc1 expression could not be detected for exon 1A but only for exon 1B and exon 1E in this study, the CCAAT-boxes are seemingly located somewhat further away from the identified TSS. Next, the regions −350 to +1015 (for mouse) and −350 to +1020 (for human) were screened for CpG-islands. CpG-islands are known to occur often in promoter regions, especially of brain- specific genes, and may influence gene transcription.13,15 Our results showed a GC-content of 46.5% in human and mouse. Ratios of observed CpGs to received CpGs (CpG(O/R)) were 0.2 for mouse and 0.5 for human Mlc1, respectively. As CpG-islands are conventionally defined as sequences (> 200 bp) with a high GC-content (>50%) and a CpG(O/R) ratio >0.6,14 the regions which have been investigated contained no CpG-island. The comparison between the human and the murine Mlc1 5' region up to the next annotated gene Mov10l1 revealed four blocks of conserved regions. The first block overlaps with the first exon of Mlc1 and contains around 130 bp of the upstream adjacent Alu-J-like element, which has been described by Steinke et al. The second block (∼160 bp) covers the space between the Pomp pseudogene and the Alu-J-like element, overlapping 15 bp of the Alu-J-like element. The third block contains around 780 bp and is located in the middle of the Pomp pseudogene as part of the intron. The fourth block showing conservation covers the promoter region of Mov10l1, including the flanking sequences of Mov10l1 and around 200 bp of the flanking Pomp pseudogene. A schematic overview is given in Figure 4.

Figure 4.
Schematic overview of the murine Mlc1 5' region up to the adjacent gene Mov10l1 and the regions showing conservation compared to the human sequence. The hatched box represents the promoter region of Mov10l1 and the Pomp pseudogene. The Pomp pseudogene is marked in grey. The light grey coloured box represents the intron of the Pomp pseudogene. Black bars mark the different conserved blocks (block 1 to block 4).

Discussion
The brain-specific expression of the megalencephalic leucoencephalopathy with subcortical cysts gene MLC1, and its involvement in neurological disorders like MLC as well as mental disorders like schizophrenia and bipolar disorder, supports the importance of the role of MLC1 for brain development and physiological brain function. A certain homology to ABC2-transporters, which are known to play a role in drug resistance,16 has been reported by Leegwater and colleagues.11 As the membrane spanning MLC1 is predominantly located at astrocytic end-feet at the blood brain barrier and glial-limiting membrane, a functional role as a selective transport protein, most probably as an exporter, could be presumed. Furthermore, Ambrosini and colleagues described an association between the dystrophin-glycoprotein complex (DGC) and MLC1. DGC is essential to anchor the cell membrane to the extra cellular matrix and its need for the stability of the blood brain barrier.17,18 Defects in MLC1 may affect stability of the DGC, causing instability and dysfunction of the blood brain barrier; the latter has been found in schizophrenic and depressive patients.19–21 So far, neither the real function of the protein, nor the gene regulation of MLC1 is known. Here, we studied the upstream region of the murine Mlc1 to find regulatory elements and define a promoter region. As no promoter could be identified by promoter prediction software, Mlc1 was investigated for promoter elements known to be essential for initiation of transcription. Suzuki and colleagues described binding sites for transcription factors appearing in most of the promoter regions they investigated.13 They mentioned an appearance of GC-boxes for 97%, CCAAT-boxes for 64% and TATA-boxes for 32% of the investigated promoter regions. Here, we detected three CCAAT-boxes in the mouse, which may act as NF-1 binding site. Beside NF-1, CCAAT-boxes are potential binding sites for the nuclear factor NF-Y, which requires a high conservation of the five core nucleotides.22 NF-1 and NF-Y are known to be ubiquitous transcription factors acting on a variety of genes. While NF-1- mediated gene expression might be influenced by the organization of DNA into chromatin leading to a ∼100 fold change in gene activity,23 NF-Y seems to be acting as a switch between gene activation and repression by influencing deposition of positive and negative histone methyl marks.24,25 Nevertheless, the CCAAT-boxes we found were not located within the usual region of about −105 to −70 bp from the TSS. TATA-boxes and GC-boxes were absent in the human and murine Mlc1 promoter region. Carninci and colleagues mentioned that roughly 90% of TATA-independent transcription initiation occurs within a CpG island.26 Roider and colleagues also showed that for genes which are predominantly expressed in brain it is common to have CpG islands in their promoter region.15 Beside the lack of TATA-boxes and GC-boxes, our study did not show any CpG-island within the promoter region, therefore, the promoter region of Mlc1 is quite uncommon. Additionally, reporter gene assays with pGL3-luciferase-constructs showed no promoter activity, further supporting the lack of promoter-specific functional elements. Measurements of pGL3-mB, pGL3-mE, pGL3-hB and pGL3-hE revealed no significant differences in activity, independent of the presence or absence of CCAAT-boxes. Although no transcription for first exons of MLC1/Mlc1 genes could be demonstrated by this method, neither under basal nor under stimulated conditions, Mlc1 expression was detectable in the cells by polymerase chain reaction. It is known that there are post-transcriptional regulating processes, like miRNAs, which are able to bind at AUGs of the 5'UTR and inhibits translation of the mRNA.27 This may be one explanation for finding no activity of our reporter gene. However, it has been published that MLC1 protein is expressed in astrocyte membranes and we had verified the gene expression.10,17 Thus, it can be assumed that there is a translation process. Furthermore, we tested several promoter constructs, containing different parts of the 5'UTR and hence, sequences with different ATGs. It would be highly improbable if every construct would contain such a repressive ATGs. Therefore, a more probable assumption is that either a distal enhancer element or an activating co-factor is crucial for Mlc1 expression, which is not included in the investigated promoter region. It was shown that other genes, like the Keratin 19 gene (K19), has an upstream promoter, which needs an enhancer element to be active. As an example, Hu and colleagues conducted a CAT-reporter gene assay showing the same low CAT-activity for the plasmid with and without the K19 promoter, with the plasmid containing the K19 promoter and the 3' flanking sequence of the K19 revealing a 10-fold increase in expression level.28 Other reports also found crucial enhancer elements for promoter activity, as shown for the importance of the 5'UTR intron of the Ubiquitin C gene for its expression.29 Interestingly, there are also some reports on MLC1 supporting the assumption that there might be a crucial enhancer element or an activating co-factor. Despite MLC being considered as an autosomal recessive disorder, Boor and colleagues described patients suffering from MLC but containing only one or no mutated MLC1 allele. In these patients, linkage analysis revealed linkage to the MLC1-locus. 5'-UTR and 3'-UTR had been screened for mutations with a negative result. Boor and colleagues investigated expression of MLC1 in lymphoblastoid cell lines of affected versus non-affected patients. The result showed that MLC1 expression of patients with only one or no mutated MLC1 allele compared to patients with homozygous MLC1 mutations revealed a reduced expression level of MLC1, leading to the assumption that there must be a second mutation somewhere near the MLC1 gene which affects expression of MLC.30 Leegwater and colleagues found a few MLC-affected patients with no mutated MLC1 allele showing no linkage to the MLC1 locus on chromosome 22qtel,11,31 which indicates a second gene locus for the disease. Lopez-Hernandez and colleagues recently found the second gene locus causing MLC.32 They describe mutations in HEPCAM, encoding for an IgG-like cell adhesion molecule that interacts with MLC1. If there is still another important gene locus affecting MLC1 expression remains still unclear. However, we found no regulatory element upstream of Mlc1, which was capable of activating the gene's transcription. Furthermore, the predicted promoter 4.3 kb upstream of Mlc1 does not influence activity of the investigated pGL3-K1. Since this predicted promoter fills the whole intergenic spacer between Mov1l and the Pomp pseudogene, and both genes are demonstrably expressed in testis, it is rather likely that this bi-directional promoter is specific for both genes but not for Mlc1. It is quite striking that a pseudogene, which obviously originated from retrotransposition because it lacks intronic regions, and an Alu-J-like element, that belongs to a family of transposable elements, are located in the 5' prime region of the murine Mlc1. It can be assumed that the 5' region of Mlc1 was a subject of repeated transposon integration events in former times. Therefore, it would make sense that this region is somehow repressed as a kind of protection. Even if there is no Pomp pseudogene or Alu-J-like element in the 5' prime region of human MLC1, there are two blocks showing conservation which contains flanking parts of the Alu-J-like element described in mice. Interestingly, the 5' region of exon1A and 1B shows a low CpG content and contains no CpG-islands. A high CpG content correlates with repressed gene activity via methylation.33 It was further observed that 70% of all genes expressed in the brain contain CpG-islands.15 Although Mlc1 is expressed in brain, it does not harbour CpG-islands. In summary, the promoters of both human and murine MLC1/Mlc1 genes display unusual structural and functional features, with yet undetected cis-acting elements and trans-acting co-factors likely playing a crucial role for Mlc1 gene expression.
Acknowledgments
we thank Ulrike Schuelter for her technical expertise. This work was supported by the Deutsche Forschungsgemeinschaft [ME 1923/5-1, ME 1923/5-3, GRK 1389].
Conflict of interest
the authors report no conflicts of interest.
References
- van der Knaap, MS; Barth, PG; Stroink, H; et al. Leukoencephalopathy with swelling and a discrepantly mild clinical course in eight children. Ann Neurol 1995, 37, 324–34. [Google Scholar]
- Meyer, J; Huberth, A; Ortega, G; et al. A missense mutation in a novel gene encoding a putative cation channel is associated with catatonic schizophrenia in a large pedigree. Mol Psychiatry 2001, 6, 302–6. [Google Scholar]
- Verma, R; Mukerji, M; Grover, D; et al. MLC1 gene is associated with schizophrenia and bipolar disorder in Southern India. Biol Psychiatry 2005, 58, 16–22. [Google Scholar]
- Rubie, C; Lichtner, P; Gartner, J; et al. Sequence diversity of KIAA0027/MLC1: are megalencephalic leukoencephalopathy and schizophrenia allelic disorders? Hum Mutat 2003, 21, 45–52. [Google Scholar]
- Selch, S; Strobel, A; Haderlein, J; et al. MLC1 polymorphisms are specifically associated with periodic catatonia, a subgroup of chronic schizophrenia. Biol Psychiatry 2007, 61, 1211–4. [Google Scholar]
- Spijker, S; Van Zanten, JS; De Jong, S; et al. Stimulated gene expression profiles as a blood marker of major depressive disorder. Biol Psychiatry 2010, 68, 179–86. [Google Scholar]
- Boor, PK; de Groot, K; Waisfisz, Q; et al. MLC1: a novel protein in distal astroglial processes. J Neuropathol Exp Neurol 2005, 64, 412–9. [Google Scholar]
- Schmitt, A; Gofferje, V; Weber, M; et al. The brain-specific protein MLC1 implicated in megalencephalic leukoencephalopathy with subcortical cysts is expressed in glial cells in the murine brain. Glia 2003, 44, 283–95. [Google Scholar]
- Teijido, O; Martinez, A; Pusch, M; et al. Localization and functional analyses of the MLC1 protein involved in megalencephalic leukoencephalopathy with subcortical cysts. Hum Mol Genet 2004, 13, 2581–94. [Google Scholar]
- Teijido, O; Casaroli-Marano, R; Kharkovets, T; et al. Expression patterns of MLC1 protein in the central and peripheral nervous systems. Neurobiol Dis 2007, 26, 532–45. [Google Scholar]
- Leegwater, PA; Yuan, BQ; van der Steen, J; et al. Mutations of MLC1 (KIAA0027), encoding a putative membrane protein, cause megalencephalic leukoencephalopathy with subcortical cysts. Am J Hum Genet 2001, 68, 831–8. [Google Scholar]
- Steinke, V; Meyer, J; Syagailo, YV; et al. The genomic organization of the murine Mlc1 (Wkl1, KIAA0027) gene. J Neural Transm 2003, 110, 333–43. [Google Scholar]
- Suzuki, Y; Tsunoda, T; Sese, J; et al. Identification and characterization of the potential promoter regions of 1031 kinds of human genes. Genome Res 2001, 11, 677–84. [Google Scholar]
- Gardiner-Garden, M; Frommer, M. CpG islands in vertebrate genomes. J Mol Biol 1987, 196, 261–82. [Google Scholar]
- Roider, HG; Lenhard, B; Kanhere, A; et al. CpG-depleted promoters harbor tissue-specific transcription factor binding signals--implications for motif overrepresentation analyses. Nucleic Acids Res 2009, 37, 6305–15. [Google Scholar]
- Dean, M. ABC transporters, drug resistance, and cancer stem cells. J Mammary Gland Biol Neoplasia 2009, 14, 3–9. [Google Scholar]
- Ambrosini, E; Serafini, B; Lanciotti, A; et al. Biochemical characterization of MLC1 protein in astrocytes and its association with the dystrophin-glycoprotein complex. Mol Cell Neurosci 2008, 37, 480–93. [Google Scholar]
- Cohn, RD. Dystroglycan: important player in skeletal muscle and beyond. Neuromuscul Disord 2005, 15, 207–17. [Google Scholar]
- Gudmundsson, P; Skoog, I; Waern, M; et al. The relationship between cerebrospinal fluid biomarkers and depression in elderly women. Am J Geriatr Psychiatry 2007, 15, 832–8. [Google Scholar]
- Muller, N; Ackenheil, M. Immunoglobulin and albumin content of cerebrospinal fluid in schizophrenic patients: relationship to negative symptomatology. Schizophr Res 1995, 14, 223–8. [Google Scholar]
- Schwarz, MJ; Ackenheil, M; Riedel, M; Muller, N. Blood-cerebrospinal fluid barrier impairment as indicator for an immune process in schizophrenia. Neurosci Lett 1998, 253, 201–3. [Google Scholar]
- Mantovani, R. A survey of 178 NF-Y binding CCAAT boxes. Nucleic Acids Res 1998, 26, 1135–43. [Google Scholar]
- Blomquist, P; Belikov, S; Wrange, O. Increased nuclear factor 1 binding to its nucleosomal site mediated by sequence-dependent DNA structure. Nucleic Acids Res 1999, 27, 517–25. [Google Scholar]
- Mantovani, R. The molecular biology of the CCAAT-binding factor NF-Y. Gene 1999, 239, 15–27. [Google Scholar]
- Donati, G; Gatta, R; Dolfini, D; et al. An NF-Y-dependent switch of positive and negative histone methyl marks on CCAAT promoters. PLoS One 2008, 3, e2066. [Google Scholar]
- Carninci, P; Sandelin, A; Lenhard, B; et al. Genome-wide analysis of mammalian promoter architecture and evolution. Nat Genet 2006, 38, 626–35. [Google Scholar]
- Ajay, SS; Athey, BD; Lee, I. Unified translation repression mechanism for microRNAs and upstream AUGs. BMC Genomics 2010, 11, 155. [Google Scholar]
- Hu, L; Gudas, LJ. Activation of keratin 19 gene expression by a 3' enhancer containing an AP1 site. J Biol Chem 1994, 269, 183–91. [Google Scholar]
- Bianchi, M; Crinelli, R; Giacomini, E; et al. A potent enhancer element in the 5'-UTR intron is crucial for transcriptional regulation of the human ubiquitin C gene. Gene 2009, 448, 88–101. [Google Scholar]
- Ilja Boor, PK; de Groot, K; Mejaski-Bosnjak, V; et al. Megalencephalic leukoencephalopathy with subcortical cysts: an update and extended mutation analysis of MLC1. Hum Mutat 2006, 27, 505–12. [Google Scholar]
- Leegwater, PA; Boor, PK; Yuan, BQ; et al. Identification of novel mutations in MLC1 responsible for megalencephalic leukoencephalopathy with subcortical cysts. Hum Genet 2002, 110, 279–83. [Google Scholar]
- Lopez-Hernandez, T; Ridder, MC; Montolio, M; et al. Mutant GlialCAM causes megalencephalic leukoencephalopathy with subcortical cysts, benign familial macrocephaly, and macrocephaly with retardation and autism. Am J Hum Genet 2011, 88, 422–32. [Google Scholar]
- Chevalier-Mariette, C; Henry, I; Montfort, L; et al. CpG content affects gene silencing in mice: evidence from novel transgenes. Genome Biol 2003, 4, R53. [Google Scholar]
©2011 Darja Henseler, Jonathan D. Turner, Matthias Eckhardt, Maaike van der Mark, Yanina Revsin, Michelle K. Lin, Thorsten Kranz, Claude Muller, Jobst Meyer. This work is licensed under a Creative Commons Attribution-NonCommercial 4.0 International License.