


Abstract
This study investigates how the initial oxygen fraction in a confined space affects post-vent combustion, gas composition, and pressure hazards during thermal runaway (TR) of 58 Ah prismatic Li(Ni0.8Co0.1Mn0.1)O2 lithium-ion cells. Thermal abuse experiments were conducted in a 250 L sealed chamber under five initial oxygen fractions (20%, 15%, 10%, 5%, and 0% O2), with synchronized measurements of cell temperature, vent-jet temperature, chamber pressure, voltage, and post-event gas composition. A first-vent event occurred reproducibly at a cell surface temperature of approximately 155 °C, followed by TR onset at about 170 °C. Although the onset temperatures were only weakly affected by ambient oxygen concentration, the post-vent hazard escalation depended strongly on oxygen availability. As the initial oxygen fraction increased from 0% to 20%, the peak vent-jet temperature increased from 353 °C to 1172 °C, and the peak chamber pressure rose from 90.7 kPa to 523.1 kPa. Gas chromatography showed that H2, CO2, CO, CH4, and C2H4 were the dominant gaseous products. Lower oxygen fractions promoted retention of combustible species, whereas higher oxygen fractions enhanced oxidation and increased the CO2/CO ratio. An oxygen-participation parameter, η, was introduced to quantify the fraction of initially available chamber oxygen consumed during post-vent oxidation. The increase in η was positively associated with oxygen-involved heat release and chamber overpressure. When the accessible oxygen fraction was limited to 10% or below, secondary combustion and pressure buildup were markedly suppressed, although a localized near-field thermal hazard remained significant around 10% O2. These results provide quantitative guidance for enclosure inerting, vent management, and post-vent hazard mitigation in high-energy lithium-ion battery systems.
1. Introduction
Lithium-ion batteries (LIBs) have become the dominant energy-storage technology for electric vehicles, grid storage systems, and other high-power applications because of their high energy density and long cycle life [1,2]. However, under abusive conditions such as overheating, internal short circuit, overcharge, or mechanical damage, LIBs may undergo thermal runaway (TR), a self-accelerating failure process accompanied by rapid heat generation, gas venting, fire, and even explosion [3,4,5]. These hazards are particularly severe for high-nickel cathode chemistries, such as Li(Ni0.8Co0.1Mn0.1)O2 (NCM811), because their high energy density is often associated with increased thermal instability and more violent venting behavior during TR [6,7].
During TR, a large amount of gas is released from the cell within a short period. Previous studies have shown that the vented products typically contain substantial fractions of CO2, CO, H2, and light hydrocarbons such as CH4 and C2H4, while the exact composition depends strongly on cathode chemistry, state of charge, trigger method, and test environment [8,9,10,11,12]. For high-nickel cells in particular, the post-event mixed gas is often rich in combustible species, which can readily ignite after mixing with air and thereby produce secondary combustion, flame jetting, and a hazardous pressure rise [13,14]. In addition to fire and explosion hazards, the release of toxic gases such as CO also raises major concerns for enclosed or semi-enclosed battery systems [15]. Therefore, vent-gas composition is not merely a by-product of TR; it is a key determinant of event severity, including post-vent heat release, flame formation, and overpressure development.
The combustion behavior of TR post-event mixed gas has attracted increasing attention in recent years [16,17]. Available studies have reported lower and upper flammability limits, ignition characteristics, and burning velocities for representative battery vent-gas mixtures, showing that these properties are highly sensitive to the relative contents of H2, CO, hydrocarbons, and diluent species such as CO2 and N2 [18,19]. In particular, hydrogen-rich mixtures can exhibit broad flammability ranges and high reactivity, whereas increasing CO2 and other inert components narrows the explosive envelope. These findings indicate that the hazard of battery post-event mixed gas cannot be assessed solely from the total amount of gas released; instead, it depends on the coupled evolution of gas composition and the surrounding oxygen environment.
At present, substantial progress has been made in characterizing individual aspects of TR, including onset temperature, heat release, gas generation, and pressure response [20,21]. Calorimetric methods such as accelerating rate calorimetry (ARC) are widely used to determine self-heating behavior and TR onset, and modern sealed calorimetric systems can also provide pressure histories and support post-test gas analysis. Likewise, sealed-chamber and external-heating experiments have provided valuable information on vent-gas composition, pressure buildup, and combustion hazards [22,23,24]. Nevertheless, many published studies still focus on only one or two observables, or they use different cells, triggering methods, and chamber conditions, which makes quantitative comparison difficult. As a result, there remains a lack of unified datasets that simultaneously resolve gas composition, temperature evolution, and chamber-pressure response under systematically controlled atmospheric conditions [25,26,27].
Among the environmental variables affecting TR severity, oxygen availability is especially important [28]. Oxygen directly governs whether the vented combustible gases undergo further oxidation after release, thereby affecting flame intensity, heat release, and pressure rise. In practical battery systems, oxygen concentration can deviate significantly from ambient air because of enclosure design, restricted ventilation, inert-gas flooding, or local oxygen depletion after an initial venting event. Such situations may arise in battery-pack housings, sealed or semi-sealed energy-storage cabinets, underground installations, transport compartments, and fire-suppression scenarios. Consequently, the relevant atmosphere for TR is not always normal air (~20.95% O2) but may instead range from oxygen-rich to oxygen-deficient conditions. Understanding how reduced oxygen concentration alters vent-gas composition and thermo-pressure behavior is, therefore, important for enclosure design, explosion mitigation, and emergency response.
Several studies have already suggested that ambient atmosphere can influence TR behavior. Reduced oxygen concentration has been reported to suppress combustion intensity and mass loss, while elevated pressure or oxygen availability may enhance post-vent combustion and pressure development [29,30]. Other investigations under inert or oxygen-lean conditions have shown that battery vent gas remains highly flammable even when the surrounding atmosphere limits immediate ignition. However, quantitative studies that systematically vary the initial oxygen fraction and concurrently track gas composition, temperature, and pressure using the same cell format and test platform remain limited [31]. In particular, the effects of oxygen dilution on CO/CO2 conversion, H2 retention, secondary heat release, and chamber overpressure have not yet been established within a single consistent experimental framework [32,33].
Despite recent progress, a quantitatively consistent framework is still lacking for evaluating how graded oxygen deficiency modifies the transition from primary venting to secondary combustion during battery TR in confined spaces. In particular, the coupled effects of ambient oxygen on combustible-gas retention, carbon-oxide conversion, oxygen-involved heat release, and chamber overpressure have not yet been established within a unified experimental platform using the same cell format, triggering protocol, and chamber geometry. This gap limits both mechanistic interpretation and practical safety design because oxygen control in battery enclosures is increasingly considered in vent routing, inert-gas flooding, cabinet protection, and confined-space hazard mitigation.
To address this issue, this work investigates the TR behavior of 58 Ah prismatic NCM811 cells in a 250 L sealed chamber under five controlled initial oxygen fractions: 20%, 15%, 10%, 5%, and 0% O2. A unified heating–waiting–seeking protocol was employed, and temperature, pressure, voltage, and post-event gas composition were measured in a synchronized manner. On this basis, an oxygen-participation parameter, η, was introduced to quantify the extent to which the initially available chamber oxygen was consumed during post-vent oxidation. The aims of this study are to: (1) establish an integrated dataset linking gas composition, thermal response, and pressure evolution across graded oxygen atmospheres; (2) clarify the mechanistic role of oxygen in secondary combustion and hazard escalation; and (3) identify, for the tested cell–trigger–chamber configuration, a design-relevant oxygen threshold for suppressing post-vent combustion and overpressure.
2. Experimental Setup and Methods
2.1. Sealed Chamber and Instrumentation
The tested cell was a commercial prismatic NCM811 lithium-ion battery with a nominal capacity of 58 Ah. The main specifications provided by the manufacturer are summarized in Table 1. Before the thermal abuse tests, the cells were electrochemically conditioned at 25 °C using a CT-4008-5V20A-A battery test system (Neware Electronics Co., Ltd., Shenzhen, China). Each conditioning cycle consisted of constant-current discharge at 5 A to 2.75 V, followed by a 5 h rest, and then constant-current/constant-voltage (CC–CV) charge at 5 A to 4.35 V, with a final 5 h rest. This procedure was repeated three times to confirm cell consistency. After conditioning, cells that met the performance criteria were fully discharged to 2.75 V, rested for 5 h, and then recharged to 100% state of charge using the CC–CV protocol to 4.35 V. Fully charged cells were allowed to rest for 48 h at room temperature before testing.
Table 1.
Battery samples.
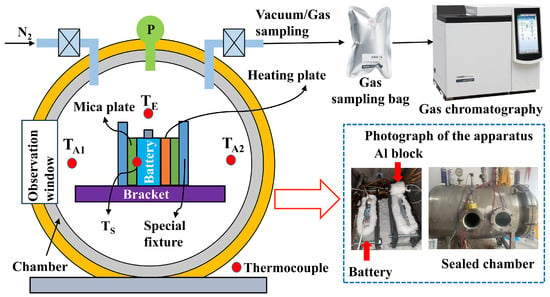
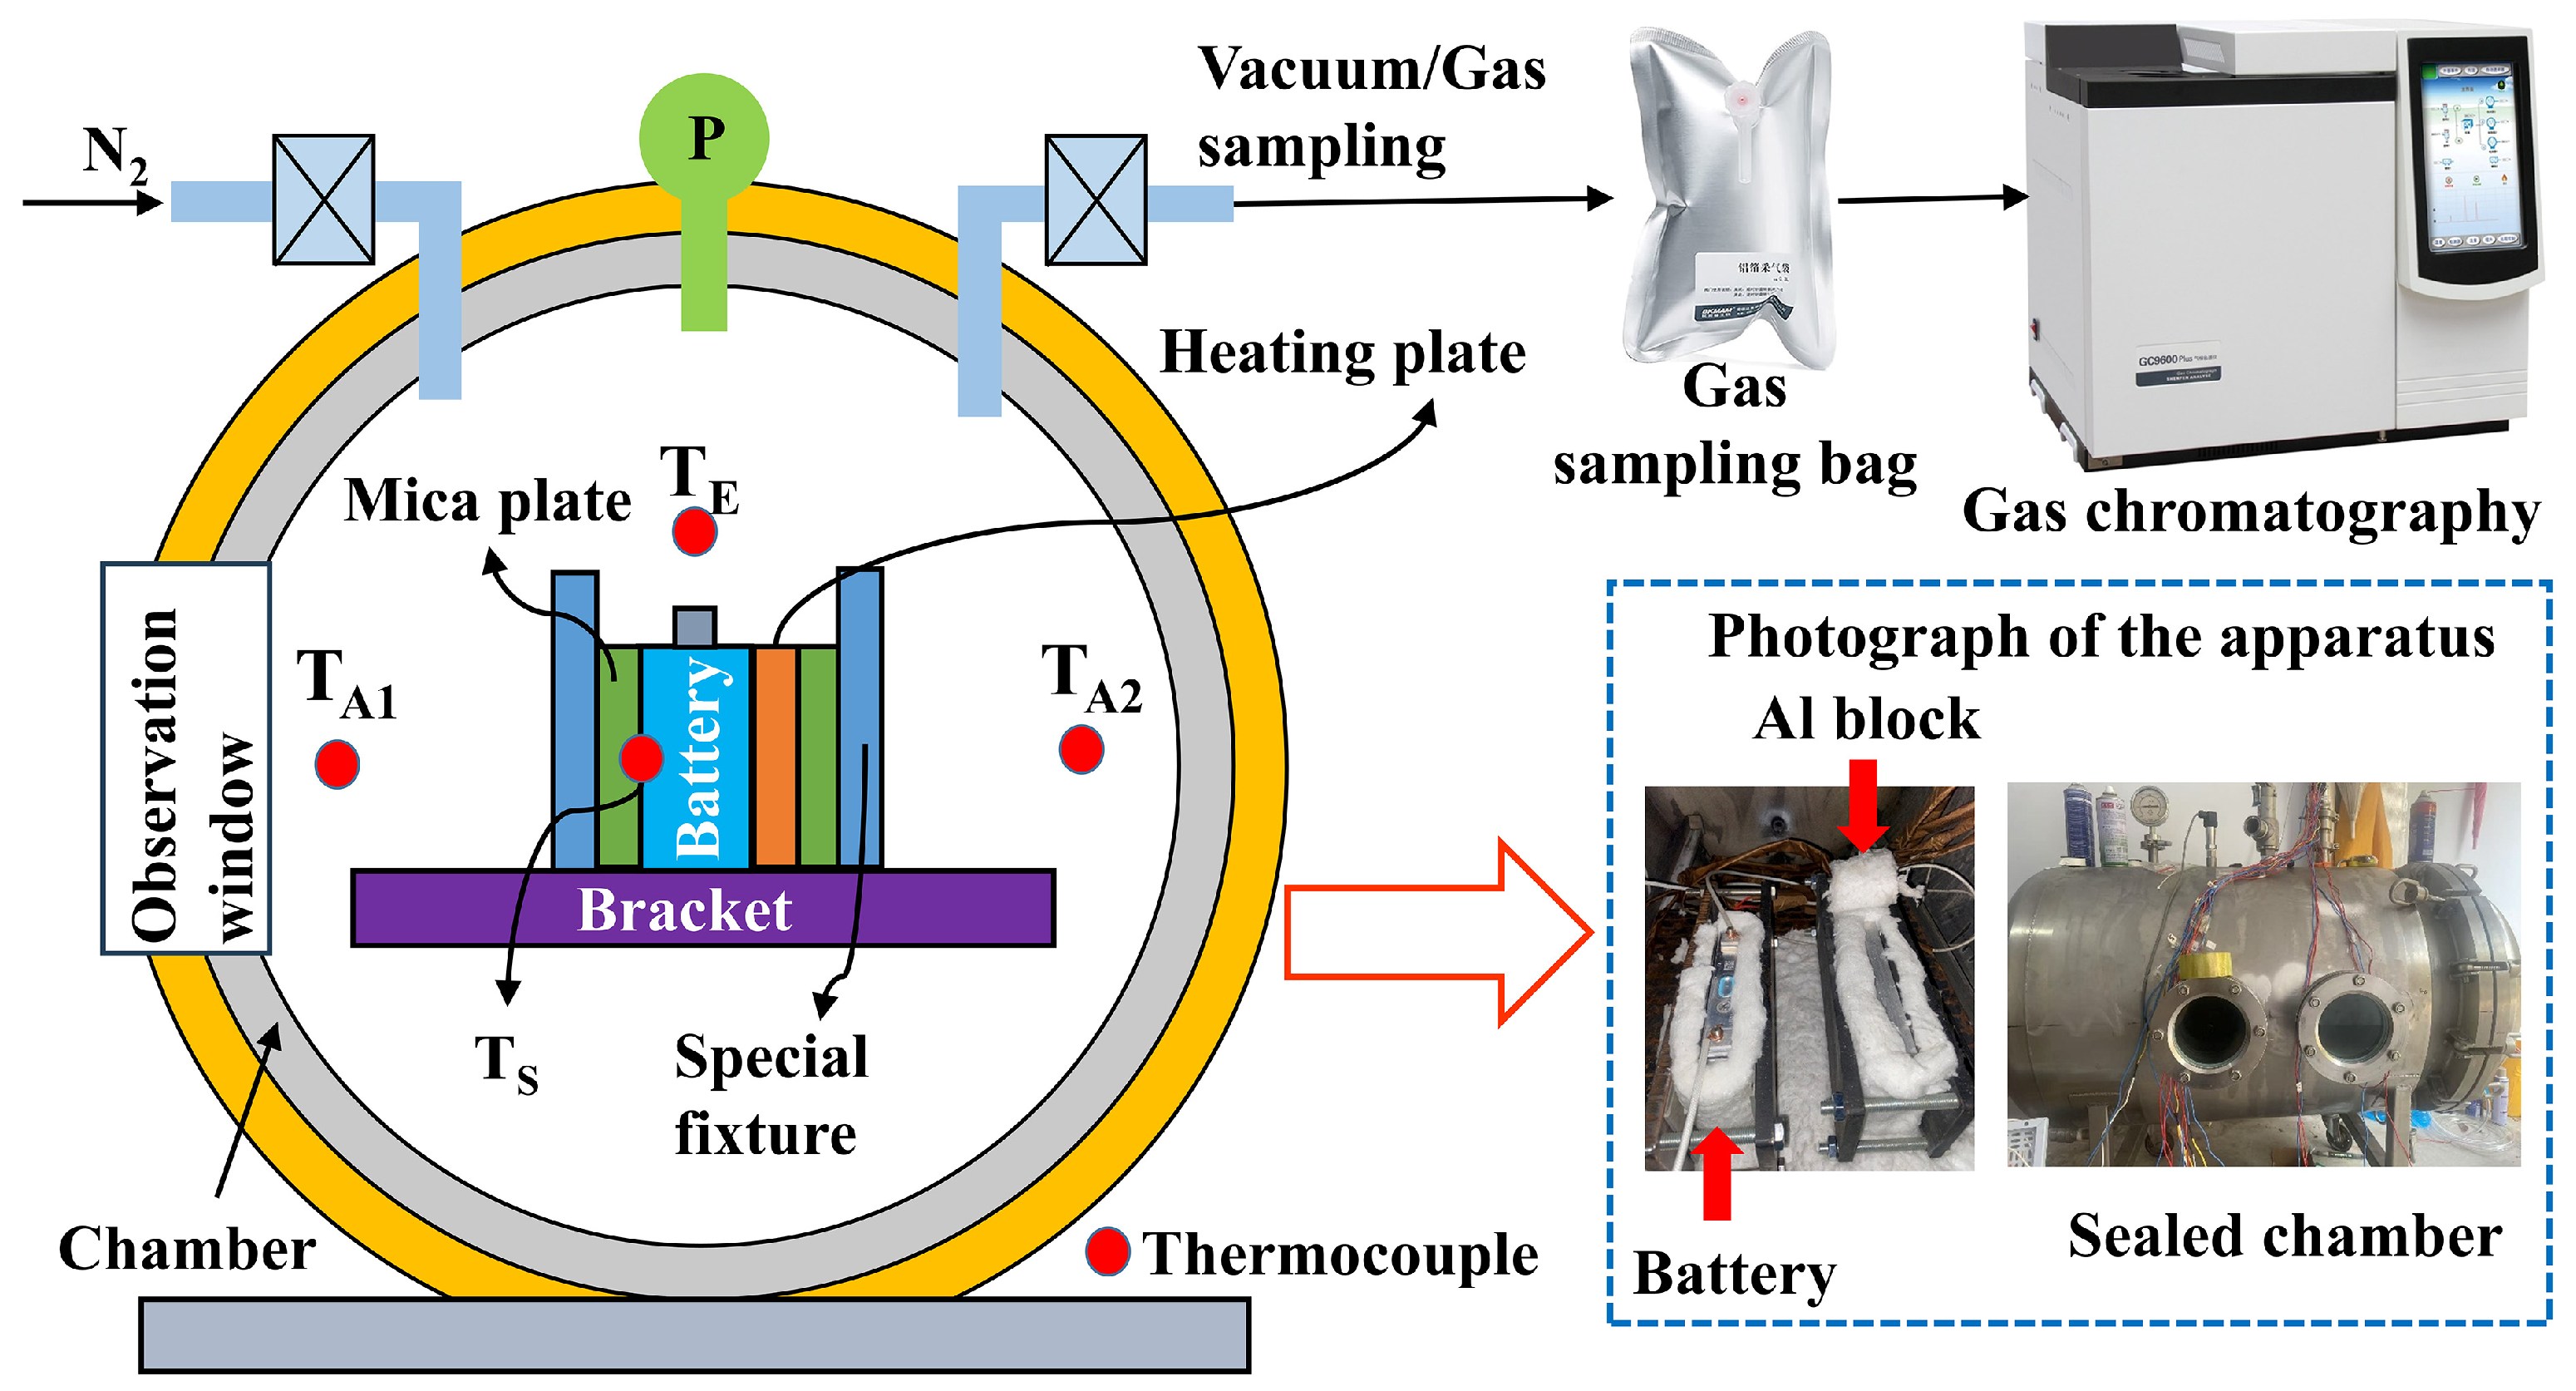
Thermal runaway tests were conducted in a sealed heating and pressure chamber (SHPC) with an internal volume of 250 L, manufactured by Shandong Lineng Industrial Equipment Co., Ltd. (Dezhou, China). The chamber shell was made of 304 stainless steel and was designed to withstand internal pressures up to 10 MPa. As shown in Figure 1, the SHPC consisted of four subsystems: a sealed chamber, an electrical heating system, a temperature and pressure measurement system, and a gas replacement system.
Figure 1.
Working principle diagram of the sealed heating pressure chamber (SHPC).
The heating system was controlled by a Siemens S7-1200 programmable logic controller (PLC) (Siemens AG, Munich, Germany), which regulated the heating sequence and power output. The battery was externally heated through a heating plate in contact with the cell assembly, and the rated power of the heating plate was 400 W. An auxiliary heating plate attached to the equivalent aluminum block was connected in series with the battery-side plate to ensure identical electrical current and nominal heating input during calibration tests. The chamber was equipped with electromagnetic inlet and exhaust valves, allowing evacuation by vacuum pump and atmosphere replacement with high-purity nitrogen (≥99.9%).
Temperature was measured using K-type thermocouples (0–1300 °C). To improve clarity, the thermocouples were designated as follows: TS, cell surface temperature; TE, vent-jet temperature measured 2 cm from the safety valve outlet; TA1 and TA2, chamber-gas temperatures at two different chamber locations; and TAl, equivalent aluminum-block temperature. In the present analysis, the two chamber-gas thermocouples showed similar trends during the pre-runaway and post-runaway stages; therefore, a representative chamber-temperature signal is reported in the main figures, while the exact positions of TA1 and TA2 are indicated in Figure 1. The TS thermocouple was attached to the broad side surface of the prismatic cell facing the heating assembly at the geometrical center of the heated region. Chamber pressure was measured using a pressure transducer with a range of 0–1 MPa. Battery voltage, temperature, and pressure signals (P) were recorded simultaneously through a USB-3122 data acquisition card at 10 Hz.
The aluminum block shown in Figure 1 served as an equivalent thermal calibration body with the same external dimensions as the tested cell. Its purpose was to estimate the effective external heat input transferred from the heating plate under the same assembly, contact, and clamping conditions as the battery test. The special fixture was used to maintain repeatable positioning and mechanical contact between the test object and the heating plate.
After each thermal runaway test, the chamber was allowed to cool to near room temperature before gas sampling. Mixed gases remaining in the chamber were collected from the exhaust port using gas-sampling bags. Prior to sampling, the transfer lines and sampling bags were evacuated or purged with inert gas to minimize cross-contamination. To reduce condensation effects, the gas path was kept as short as practicable, and sampling was performed only after the chamber contents had cooled and mixed sufficiently. Therefore, the measured gas compositions represent post-event mixed dry chamber gas after cooling and mixing rather than time-resolved hot post-event mixed gas at the valve outlet. Because condensable vapors, aerosol species, and short-lived combustion intermediates may not be fully captured in the final gas-bag sample, the results reported in Section 3.2 and Section 3.3, including the η calculation, should be interpreted as reflecting a post-event integrated residual-gas state rather than the instantaneous composition of the transient vent plume.
Gas composition was analyzed using a GC-9800 Plus gas chromatograph (Shandong Hengmei Electronic Technology Co., Ltd., Weifang, China). The instrument was equipped with flame ionization detection (FID) and thermal conductivity detection (TCD), enabling quantification of major permanent gases and light hydrocarbons. In this study, the reported gas fractions were expressed on a dry basis, and species with volume fractions below 1% were grouped as “Others.” The dominant reported species included H2, CO2, CO, CH4, and C2H4.
For each initial oxygen fraction, three independent thermal-runaway tests were conducted to evaluate repeatability. The characteristic parameters discussed in this work, including first-vent temperature, thermal-runaway onset temperature, peak vent-jet temperature, and peak chamber pressure, showed good consistency among repeated tests. In addition, all experiments were performed using the same chamber, sensor arrangement, and data-acquisition protocol. Therefore, although a full calibration-based uncertainty propagation analysis was not carried out in this study, the comparative trends reported here are considered robust because the differences observed between oxygen conditions were larger than the run-to-run variation.
2.2. Atmosphere Preparation and Thermal Abuse Procedure
Five initial oxygen fractions were investigated: approximately 20%, 15%, 10%, 5%, and 0% O2. The chamber atmosphere was adjusted by removing a prescribed fraction of the initial air and replacing it with an equal volume of high-purity nitrogen. After gas replacement, the chamber was sealed and allowed to equilibrate for 2 h to ensure gas mixing. Gas samples were then taken from the chamber and analyzed by gas chromatography to verify that the measured oxygen concentration deviated from the target value by less than 2%. Under these conditions, the spatial variation in oxygen concentration inside the chamber was maintained within 5%.
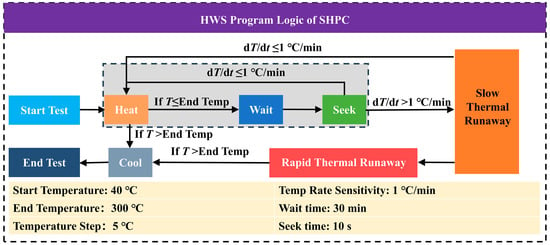
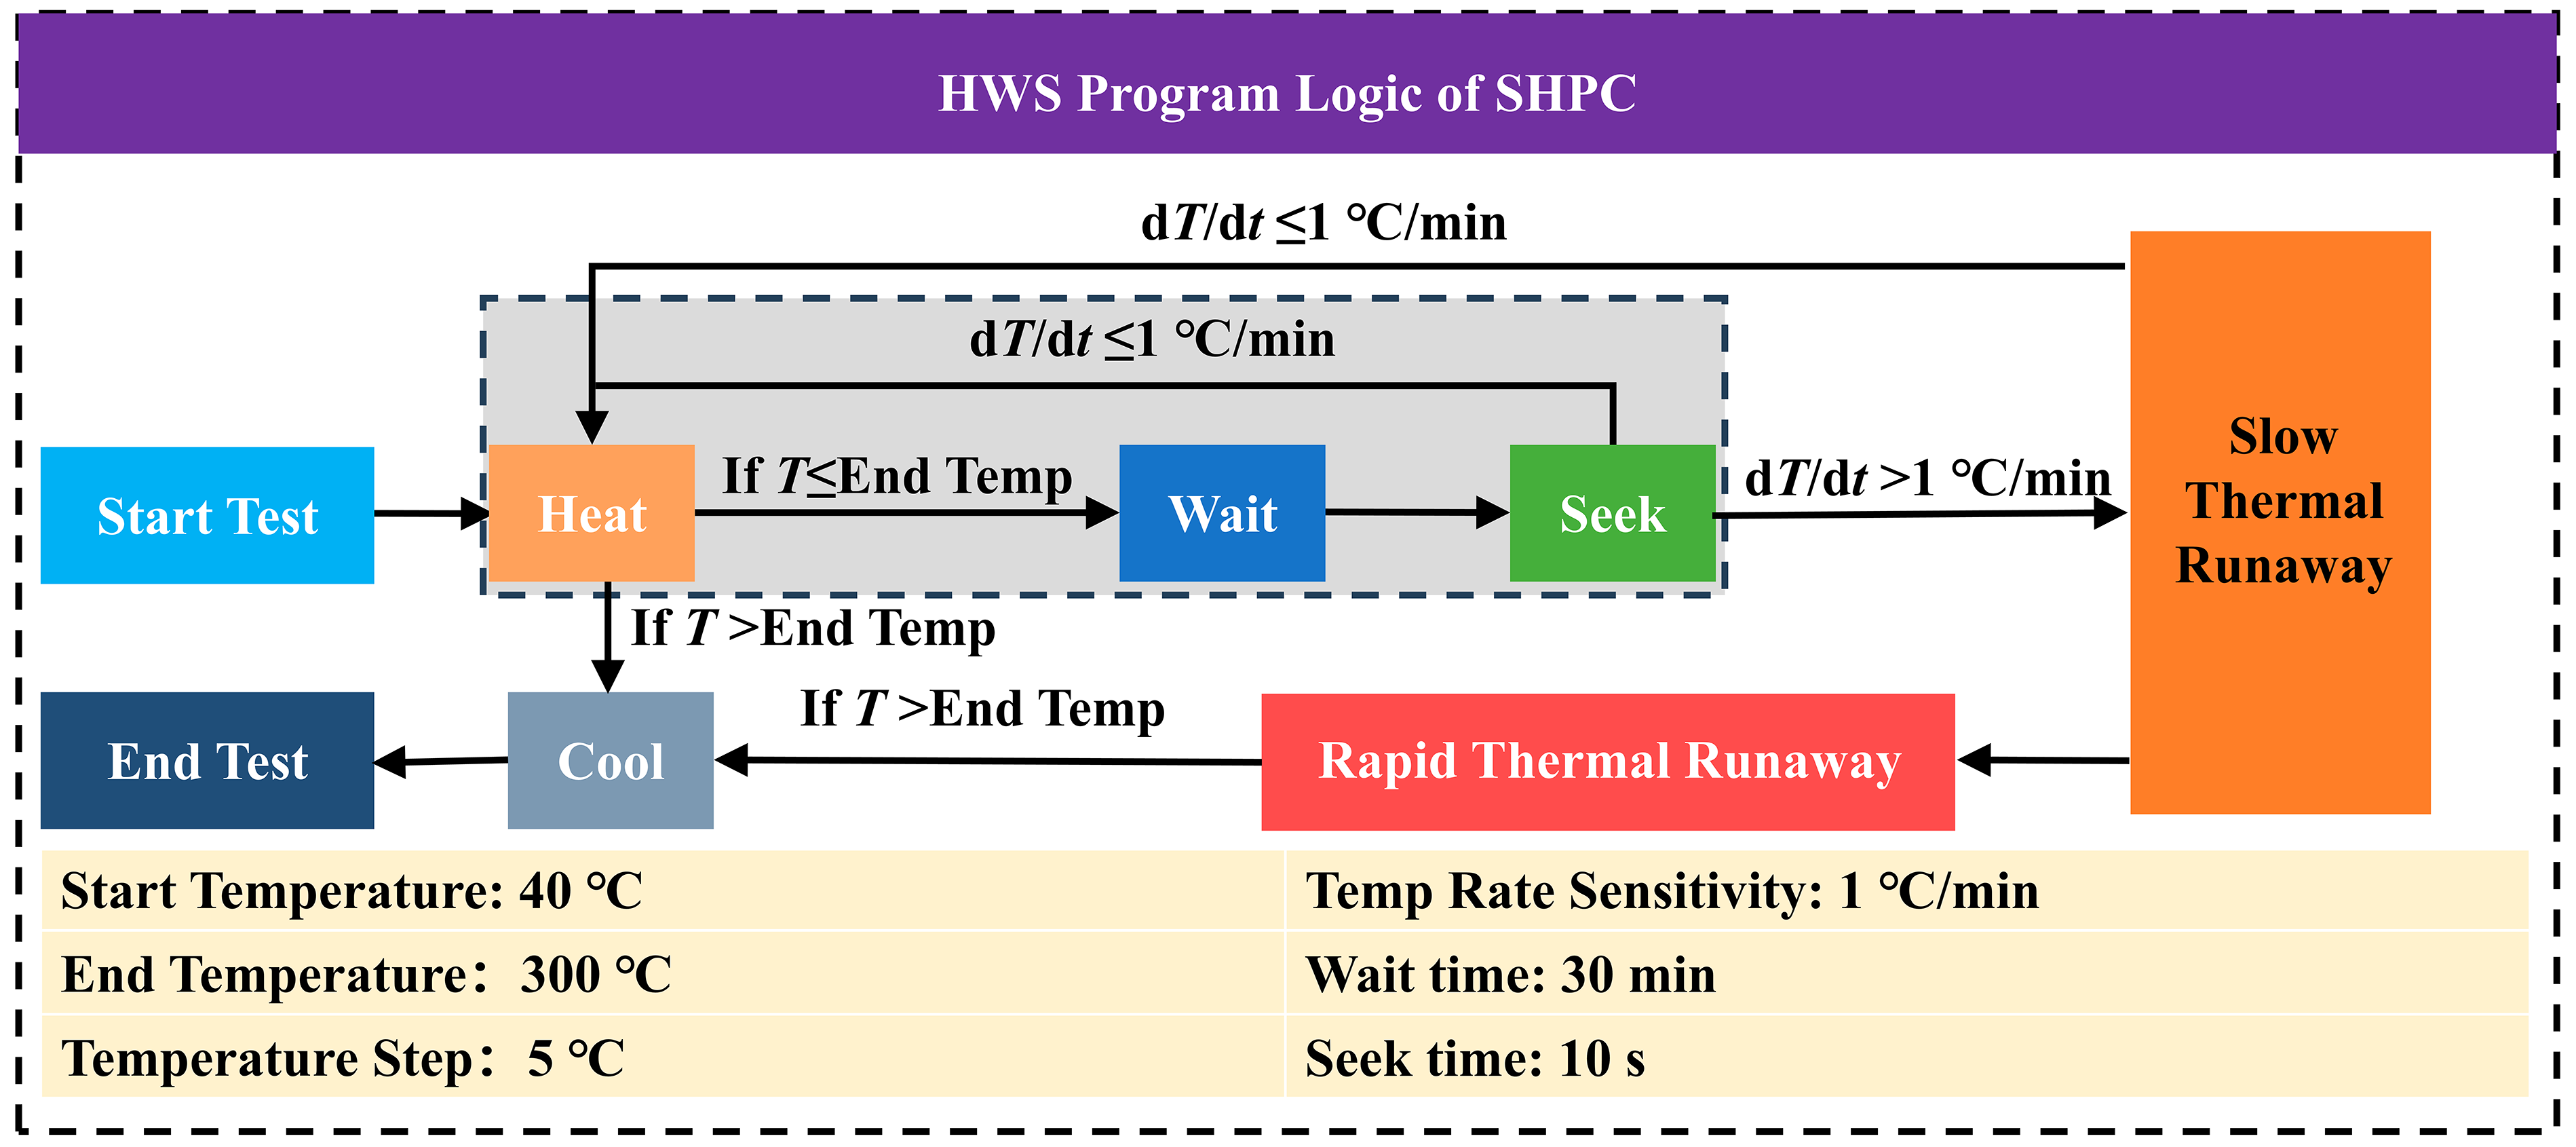
Thermal abuse was imposed using a heating–waiting–seeking (HWS) protocol (see Figure 2 for details) [34]. In the heating stage, the programmed temperature was increased in 5 K increments. In the waiting stage, the cell was held at each temperature level for 30 min to reduce transient gradients and allow thermal stabilization. The HWS procedure was adopted in accordance with GB/T 36276-2023. For each initial oxygen fraction, three independent thermal runaway tests were conducted to evaluate repeatability.
Figure 2.
HWS program of the sealed heating pressure chamber (SHPC) [34].
In this work, the first vent was defined as the earliest pressure-relief event associated with opening of the safety valve, identified by a sudden pressure step and simultaneous vent-jet temperature response. Thermal runaway onset was defined as the point at which the cell entered self-accelerating temperature rise beyond normal external-heating behavior, as determined from the temperature response of the cell in comparison with the equivalent aluminum-block calibration. Because the HWS seek interval was short, the TR-onset judgment was not based solely on a single 10 s derivative threshold but on the combined signatures of accelerated temperature rise, deviation from the aluminum-block reference, venting behavior, and subsequent irreversible runaway progression. Peak pressure and peak temperatures reported in this work refer to the maximum measured values recorded during each test.
2.3. Equivalent Aluminum-Block Calibration
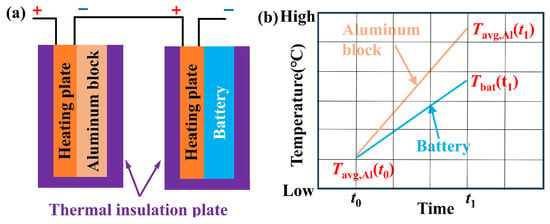
To estimate the effective external heat input retained by the battery before TR onset, an equivalent aluminum-block calibration method was used under the same chamber assembly and heating conditions as those applied to the cell. A solid aluminum block with the same external dimensions as the battery was mounted in the same fixture, and its heating plate was connected in series with that used in the battery test so that both tests experienced the same nominal electrical input, contact condition, and clamping force.
The calibration procedure consisted of two steps. First, the equivalent aluminum block was heated using the same heating–waiting–seeking (HWS) program as that applied to the battery. Second, the thermal response of the aluminum block was used to estimate the effective heat transferred from the heating plate to the battery, with correction for system-level heat losses and thermal-response differences. To improve temperature uniformity within the block, a 30 min waiting stage was applied at each temperature level, and the average aluminum-block temperature, was used to represent its thermal state.
Within a selected calibration interval from t1 to t2, the sensible heat absorbed by the aluminum block was calculated as Equation (1):
where QAl is the sensible heat absorbed by the aluminum block (J), is the mass of the aluminum block (kg), is the specific heat capacity of aluminum (J·kg−1·K−1), and is the temperature rise of the block over the selected interval (K).
As illustrated schematically in Figure 3, during short-duration heating, the heat absorbed by the aluminum block can be taken as an approximation of the heat transferred to the battery. However, under longer heating durations, deviations arise because of heat losses to the surroundings, convective and radiative exchange, and the intrinsic thermal response of the battery. To account for these effects, a correction factor, ϕ, was introduced in Equation (2):
where Qbat is the net heat retained by the battery prior to TR onset and ϕ represents the fraction of the externally supplied heat that is effectively absorbed by the battery under the tested assembly conditions.
Figure 3.
Schematic illustration of the equivalent aluminum-block calibration method used to estimate the net heat retained by the battery prior to thermal runaway onset. (a) Wiring connection diagram; (b) Calculation diagram.
Accordingly, the correction factor can be expressed by Equation (3):
In the present work, Qbat was estimated from the battery mass, the measured specific heat capacity, and the corresponding temperature rise before TR onset. The specific heat capacity of the battery was measured separately using an accelerating rate calorimeter (ARC; BAC-420 series, Yangyi Technology, Hangzhou, China), giving a value of approximately 1194 J·kg−1·K−1. This calibration framework provides a practical means of linking the measured aluminum-block response to the effective heat accumulation of the battery before runaway.
3. Results and Discussion
3.1. Temperature, Pressure, and Voltage Evolution During Thermal Runaway
3.1.1. Effect of Oxygen Concentration on Vent-Jet Temperature and Chamber Pressure
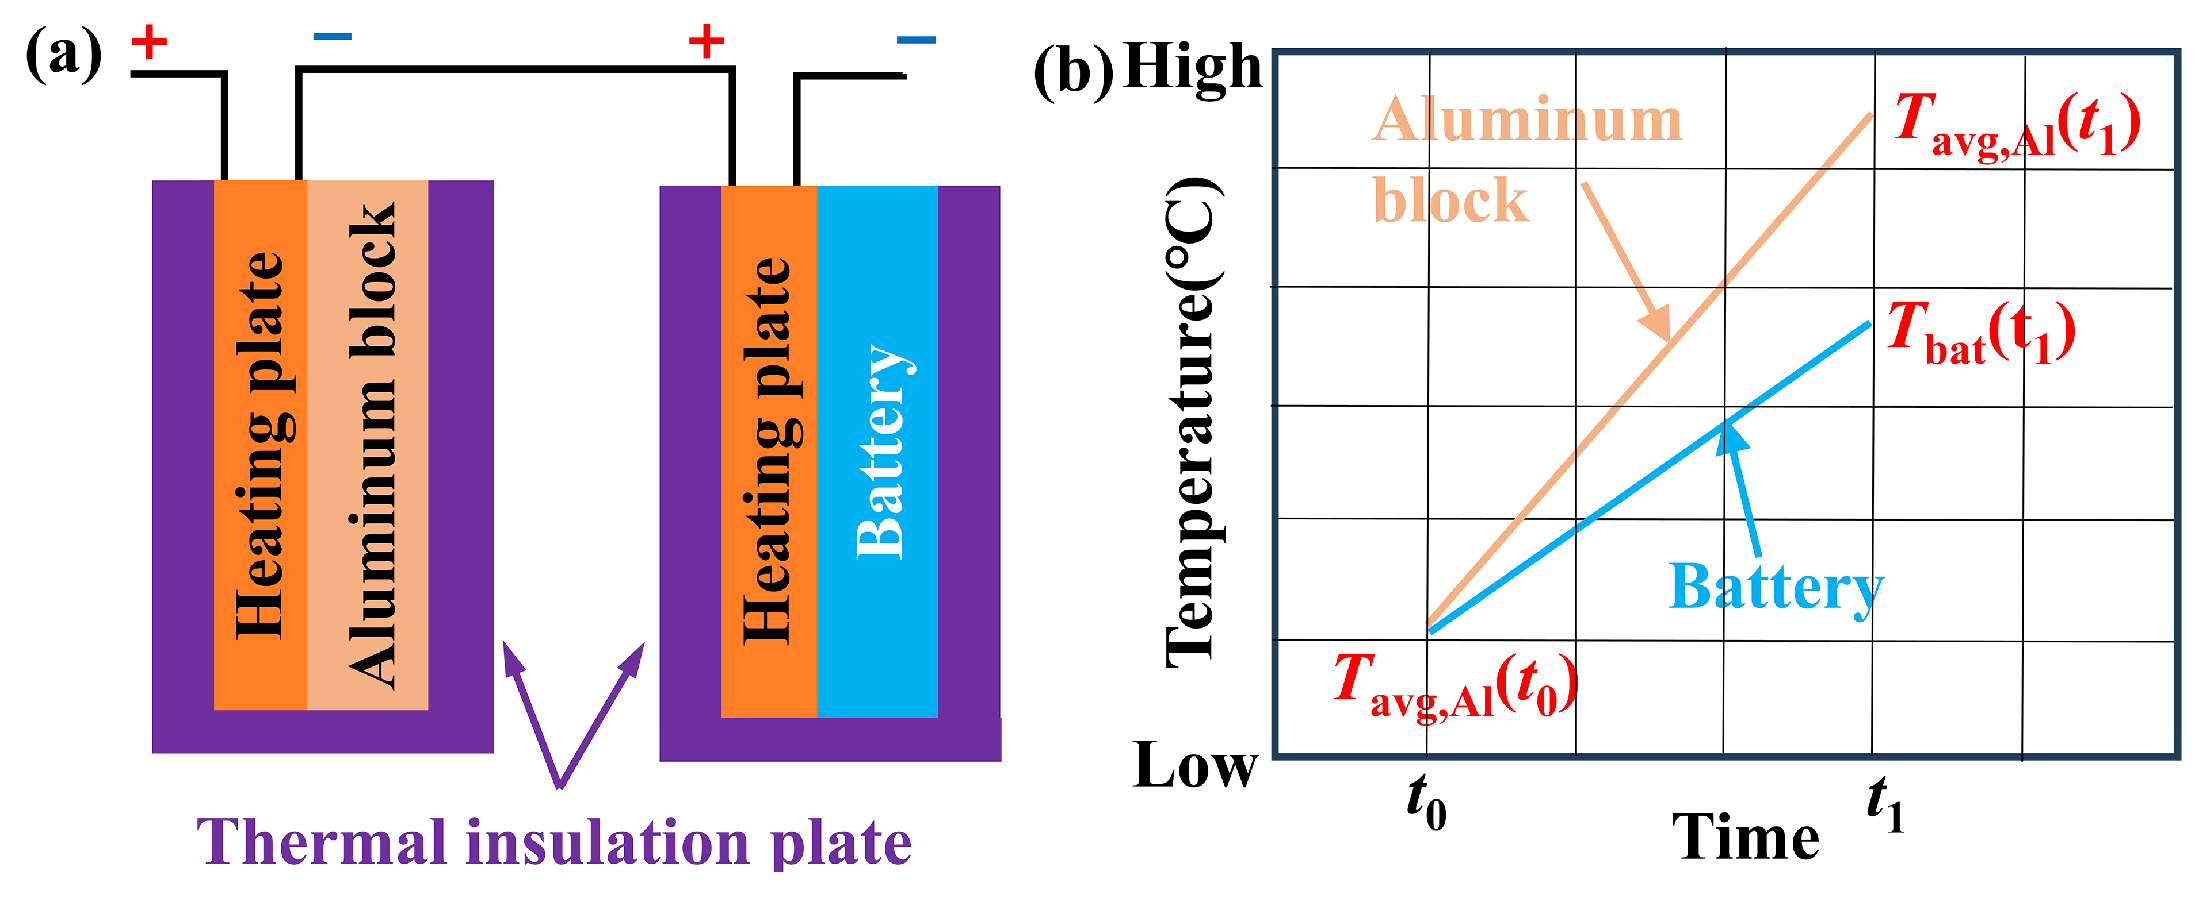
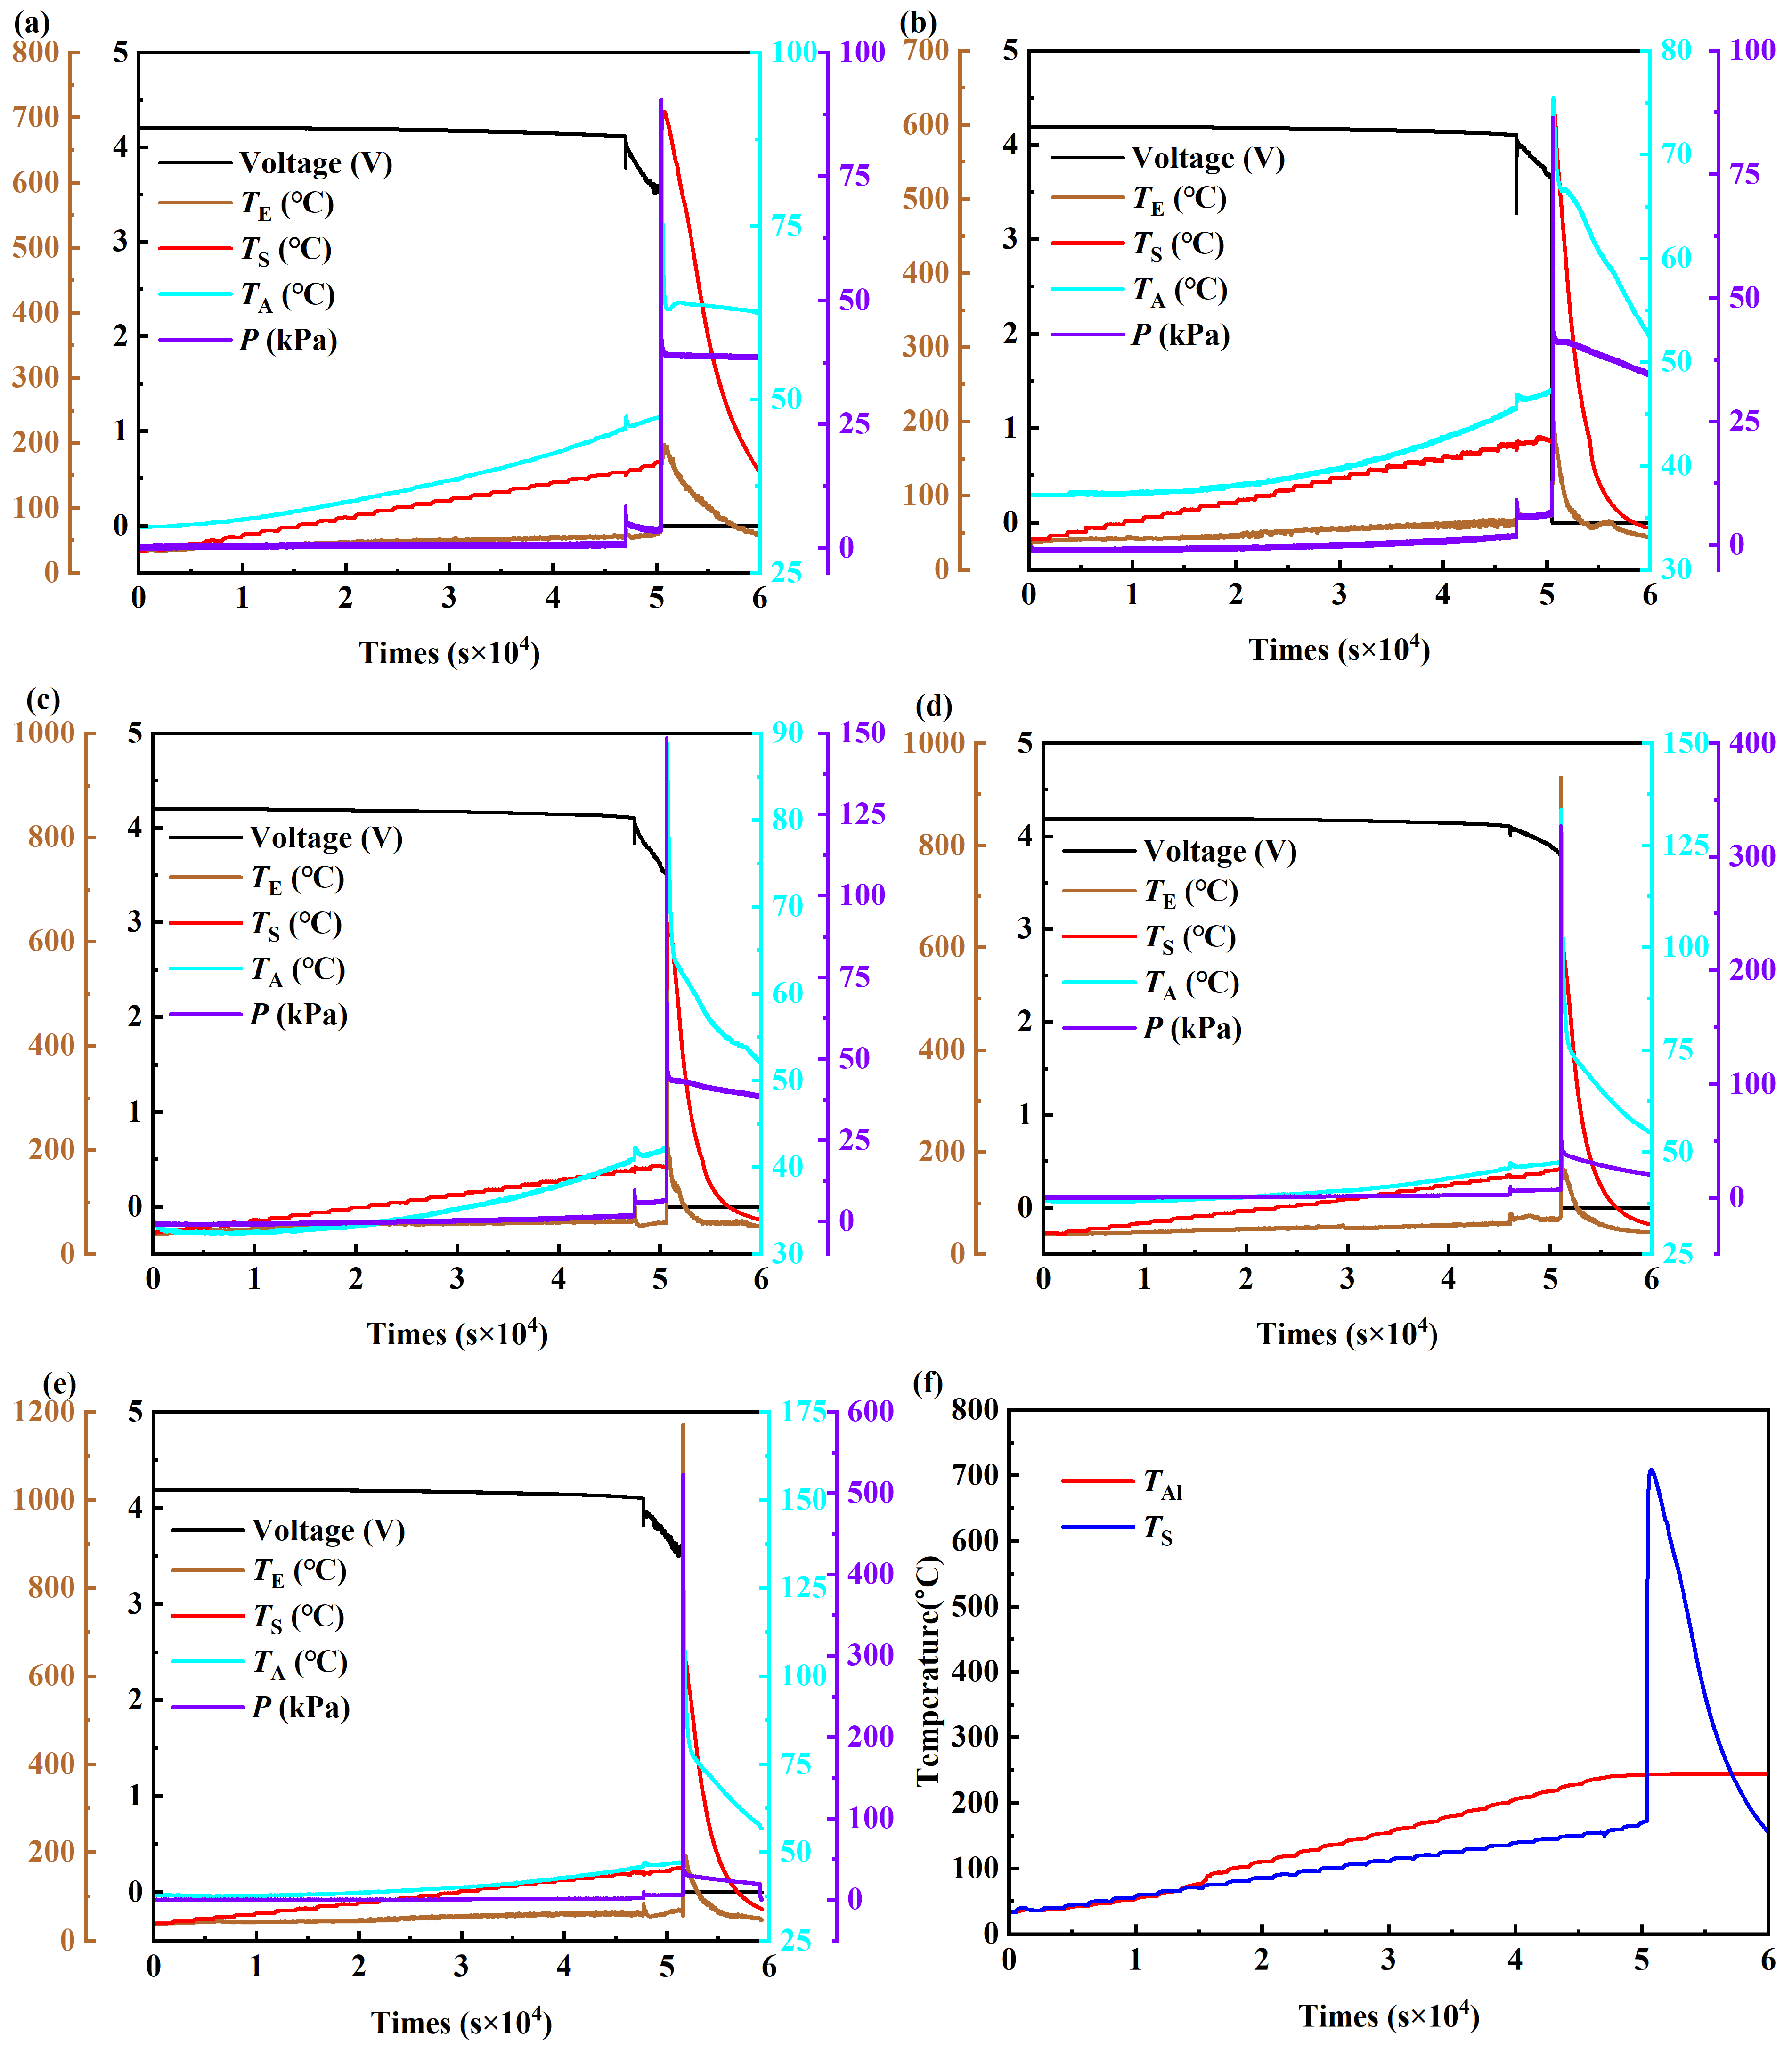
Following the procedure described in Section 2, fully charged 58 Ah prismatic NCM811 cells were subjected to stepwise external heating under five initial oxygen fractions (approximately 20%, 15%, 10%, 5%, and 0% O2) using the HWS protocol. The temporal evolution of vent-jet temperature, chamber temperature, cell surface temperature, cell voltage, and chamber pressure is presented in Figure 4a–e. For comparison, Figure 4f shows the temperature rise of the battery and an equal-volume aluminum block under the same heating conditions.
Figure 4.
Time histories of vent-jet temperature (TE), representative chamber temperature (TA), cell surface temperature (TS), cell voltage, and chamber pressure under different initial oxygen fractions: (a) 0%, (b) 5%, (c) 10%, (d) 15%, and (e) 20% O2. (f) Comparison of the temperature rise of the battery and an equal-volume aluminum block under identical heating conditions.
For clarity, the TE axis was adjusted for individual panels because the peak vent-jet temperature varied substantially across oxygen conditions; using a fully unified TE scale would compress the low-oxygen responses and obscure their transient features.
Across all oxygen conditions, the early stage of thermal runaway evolution showed strong reproducibility. The first vent event consistently occurred when the cell surface temperature reached approximately 155 °C. This event was characterized by a sudden pressure response and a rapid increase in vent-jet temperature, indicating opening of the safety valve and release of internally generated gases. In all cases, the first vent produced only a brief drop in surface temperature, reflecting transient heat removal by gas ejection, but it did not interrupt the subsequent progression toward runaway. A slight voltage decrease was also observed at this stage, suggesting that the first vent coincided with early structural and electrochemical destabilization of the cell.
Comparison with the equivalent aluminum-block response indicates that the true transition from externally driven heating to self-accelerating runaway occurred at a cell surface temperature of approximately 170 °C. At this point, the corresponding aluminum-block temperature was about 244 °C. Using the equivalent calibration method described in Section 2, the net sensible heat absorbed by the aluminum block within the selected interval was estimated to be approximately 208 kJ, while the net heat retained by the battery prior to runaway was approximately 152 kJ. This yielded a correction factor of about 0.732, indicating that roughly 73.2% of the external heat input was effectively retained by the battery before runaway onset. These results support the use of the aluminum-block method to distinguish normal external heating from the onset of self-sustained internal reactions.
The weak dependence of first-vent temperature and TR-onset temperature on ambient oxygen concentration is consistent with the general understanding that these early events are associated primarily with internally driven processes, such as early-stage decomposition reactions, gas generation, and pressure buildup within the cell, rather than with external gas-phase combustion [2,5]. Under this interpretation, the first vent mainly reflects internal gas generation and vent opening, whereas ambient oxygen becomes more important after combustible gases are released into the chamber. Accordingly, the present data suggest that oxygen concentration has limited influence on runaway initiation but has a strong influence on post-vent combustion severity under the tested conditions. The present study does not directly resolve the detailed internal reaction sequence before TR onset; rather, it infers the limited oxygen dependence of onset from the observed temperature and pressure responses under different chamber atmospheres.
Although the first vent and TR onset were relatively insensitive to oxygen concentration, the severity of the post-vent event depended strongly on the initial oxygen fraction. As shown in Figure 4, the peak vent-jet temperature increased from 353 °C at 0% O2 to 424 °C at 5% O2 and then rose sharply to 925 °C at 10% O2 and 934 °C at 15% O2 before reaching 1172 °C at 20% O2. The pronounced increase between 5% and 10% O2 indicates that the vented gas entered a much more reactive combustion regime once sufficient oxygen became available for secondary oxidation.
The chamber-pressure response exhibited the same overall trend. Peak chamber pressure increased from 90.7 kPa at 0% O2 to 523.1 kPa at 20% O2. Only a minor difference was observed between 0% and 5% O2, suggesting that, under severe oxygen deficiency, the vented gases remained largely unburned and contributed limited additional pressurization beyond mechanical venting and thermal expansion. In contrast, pressure increased markedly above 5% O2, indicating progressively stronger gas-phase combustion, larger heat release, and greater gas expansion.
These results show that oxygen concentration has limited influence on runaway initiation but a dominant influence on the post-vent escalation stage. Oxygen dilution, therefore, cannot prevent the internal onset of TR under external heating, but it can substantially suppress the subsequent thermal and pressure consequences associated with combustion of the released gases.
3.1.2. Near-Field Thermal Hazard Under Different Oxygen Fractions
When the near-field thermal hazard was assessed using the vent-jet temperature measured 2 cm from the safety valve, the most severe conditions were observed at intermediate-to-high oxygen fractions. In general, the hazard ranking based on the local jet-temperature signal was 20% > 15% ≈ 10% ≫ 5% > 0% O2. However, the local temperature did not increase monotonically with oxygen fraction, and the near-field thermal exposure often peaked around 10% O2 even though the maximum overall hazard and chamber pressure occurred at 20% O2.
A plausible explanation is that, near 10% O2, the vented fuel-rich gases were more likely to form a locally near-stoichiometric mixture after limited entrainment, producing an intense reaction zone close to the vent outlet. At higher oxygen fractions, stronger entrainment and convective transport may have displaced the main reaction zone farther from the thermocouple position. Therefore, the most severe local thermal exposure near the vent may occur under intermediate oxygen conditions, whereas the most severe global combustion escalation occurs at higher oxygen fractions.
This distinction is important for engineering design because local component exposure near the vent outlet and system-level overpressure escalation are not necessarily governed by the same oxygen condition.
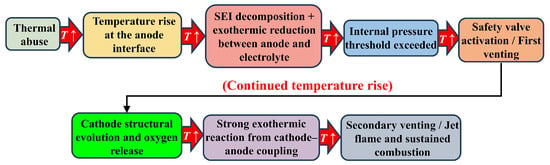
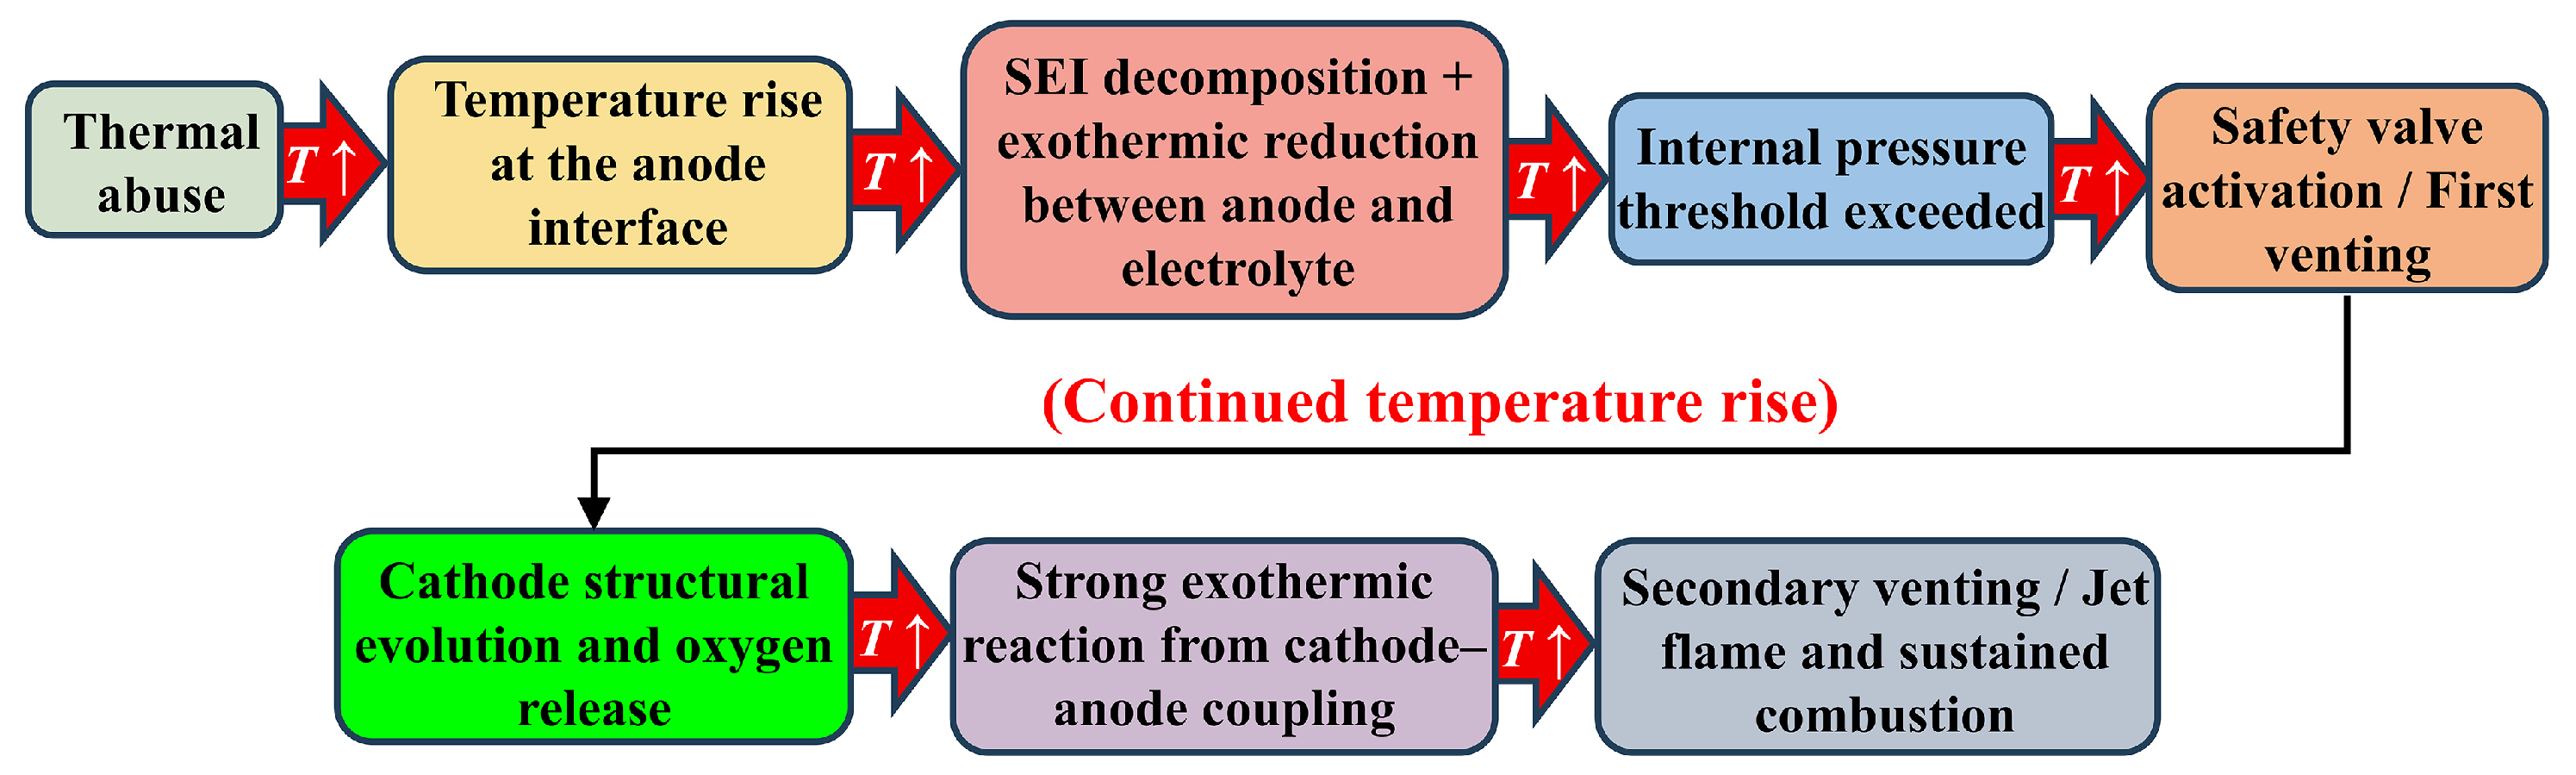
To summarize the sequence of events discussed above, a schematic of the proposed two-stage venting mechanism is shown in Figure 5. In the first stage, external heating triggers decomposition of the solid electrolyte interphase (SEI), followed by early anode-side reactions and gas generation. As internal pressure rises and exceeds the opening threshold of the safety valve, the cell undergoes the first vent, which is typically characterized by a relatively short-duration jet of hot gases and aerosolized products. At this stage, the vented stream is often weakly burning or non-luminous, and the event mainly reflects internal pressure release rather than fully developed gas-phase combustion.
Figure 5.
Schematic illustration of the proposed two-stage venting mechanism during thermal runaway of prismatic NCM811 cells under external heating.
As heating continues, internal reactions intensify, and broader cell components become involved, including more vigorous electrode–electrolyte and cathode-related exothermic processes. This leads to rapid acceleration of gas generation, stronger thermal feedback, and a transition into full thermal runaway. In the second stage, the discharged combustible gases mix more extensively with the surrounding atmosphere and, when sufficient oxygen is available, undergo secondary combustion. This later stage is associated with higher jet temperature, stronger flame development, and more severe chamber pressurization than the first vent. The two-stage framework shown in Figure 5, therefore, helps distinguish the relatively early pressure-relief event from the later oxygen-coupled escalation stage that dominates the overall thermal and pressure hazard.
This interpretation also explains why the first vent temperature is relatively insensitive to ambient oxygen concentration, whereas the post-vent peak temperature and chamber pressure depend strongly on oxygen availability. The first vent is controlled mainly by internal gas generation and vent opening, while the second stage is governed to a much greater extent by gas-phase mixing and oxidation outside the cell.
It should also be noted that the vent-jet temperature was measured in a highly dynamic environment involving hot gases, luminous combustion, particles, and possible sparks. Under such conditions, thermocouple readings above approximately 900 °C may be affected by radiative heating, particle impingement, or transient overshoot and should, therefore, be interpreted as indicative rather than absolute flame temperatures. Nevertheless, the measured trends remain useful for comparative analysis across oxygen conditions because all tests were conducted on the same platform with the same sensor arrangement and operating protocol.
3.2. Post-Event Mixed Gas Composition and Flammability Characteristics
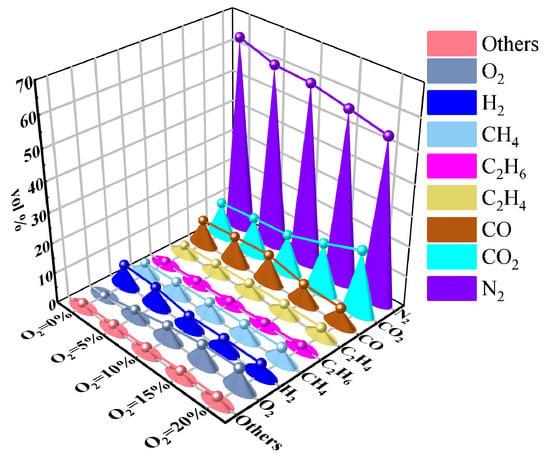
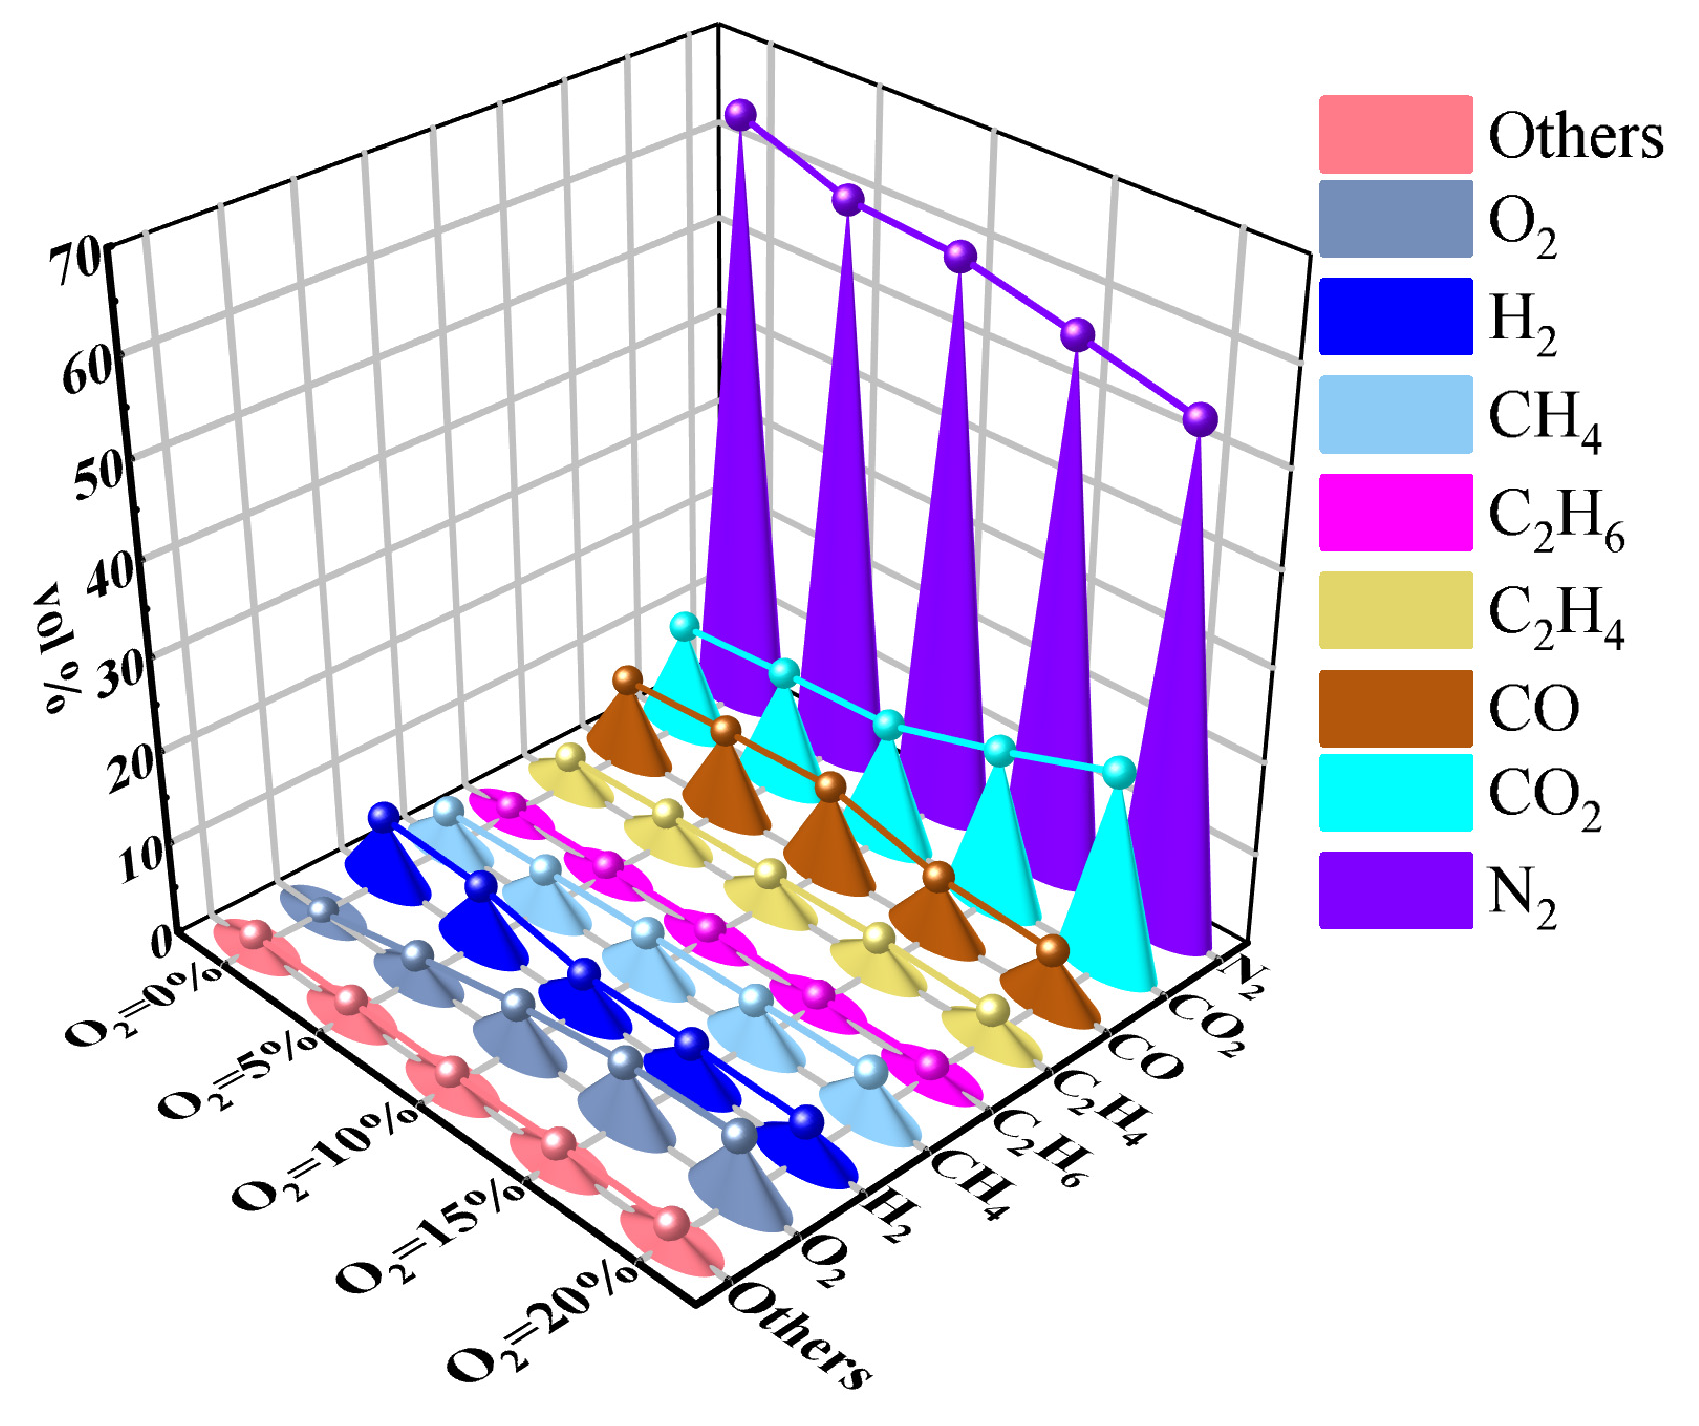
The composition of gases released during TR under different initial oxygen fractions is summarized in Figure 6. The dominant gaseous products were H2, CO2, CO, CH4, and C2H4, while species with measured volume fractions below 1% were grouped as “Others.” Under the 0% O2 condition, the total molar quantity of gas generated was estimated to be approximately 6.02 mol using the ideal-gas relation expressed by Equation (4) [35]. This oxygen-free condition provides a useful baseline because the measured products mainly reflect internal decomposition and pyrolysis inside the cell, without additional oxidation by ambient oxygen.
where, P is the absolute gas pressure, V is the volume of the reaction container, R is the universal gas constant, and T is the thermodynamic absolute temperature.
Figure 6.
Dry composition of post-event mixed chamber gas after thermal runaway of NCM811 cells under different initial oxygen fractions.
3.2.1. Effect of Oxygen Fraction on Post-Event Mixed Gas Composition
Across all oxygen conditions, carbon oxides remained the major species in the post-event mixed dry gas, but their relative proportions changed systematically with the initial oxygen fraction. Under 0% O2, combustible gases accounted for 23.32 vol% of the total vented mixture, including 15.56 vol% reducing gases (H2 + CO) and 7.76 vol% light hydrocarbons (CH4 + C2H4 + C2H6). The characteristic ratios under this condition, including CO2/CO = 1.34, C2H4/C2H6 = 3.71, and H2/CO = 0.82, suggest that, under the 0% O2 condition, the post-event mixed gas retained a strongly fuel-rich character dominated by products associated with internal decomposition and pyrolysis under oxygen-free conditions.
As the initial oxygen fraction increased, the post-event mixed gas shifted toward a more oxidized residual composition. In particular, the CO2/CO ratio increased from 1.34 at 0% O2 to 4.27 at 20% O2, which is consistent with a greater apparent extent of oxidation before final gas sampling. By contrast, the C2H4/C2H6 ratio decreased from 3.71 to 3.09, while the H2/CO ratio showed a non-monotonic trend. Because the present measurements were obtained only after chamber cooling and mixing, these ratio changes should be interpreted as differences in the final residual gas state rather than direct evidence of transient in situ reaction pathways during the chamber event.
The total combustible fraction also exhibited a non-monotonic dependence on oxygen concentration, reaching a maximum of 23.81 vol% at 5% O2 and then decreasing to 17.35 vol% at 20% O2. This result indicates that weak oxygen dilution does not simply reduce the combustible fraction in the final mixed gas. Instead, under the present sampling protocol, the 5% O2 condition was associated with a more fuel-rich residual-gas composition, whereas higher oxygen fractions were associated with a lower residual combustible fraction and a higher CO2/CO ratio in the post-event chamber gas.
The observed differences in residual-gas composition are consistent with different overall extents of oxygen involvement during the event. However, because the present gas samples represent post-event mixed dry gas rather than time-resolved vent-plume samples, these results should not be interpreted as direct resolution of transient combustion chemistry or short-lived intermediates. Instead, they provide a comparative description of how the final chamber gas state varied with the initial oxygen fraction.
3.2.2. Flammability Implications of the Vent-Gas Mixture
To evaluate the practical fire and explosion implications of the post-event mixed gas, the flammability limits of the combustible sub-mixture were estimated using Le Chatelier’s mixing rule. First, the combustible species under each condition were normalized to obtain their volume fractions within the combustible fraction only, denoted as . The lower flammability limit (LFLmix) and upper flammability limit (UFLmix) of the mixture were then calculated using Equation (5) [4]:
where is the normalized volume fraction of combustible component i, and and are the lower and upper flammability limits of the pure component in air, respectively. In this calculation, non-combustible or background species, including N2, CO2, O2, and “Others,” were excluded from the weighted sum and treated as diluent or oxidizing background gases. The literature values of and for H2, CO, CH4, C2H4, and other combustible species were taken from representative published data.
Because the present experiments were conducted under different initial oxygen fractions rather than standard air, a simplified oxygen-concentration correction was further introduced to qualitatively account for the effect of reduced oxygen availability on the flammability limits. Taking 20.95% O2 as the oxygen content of normal dry air, the corrected flammability limits were expressed by Equation (6):
where and are the oxygen-corrected lower and upper flammability limits, respectively, and is the initial oxygen volume fraction (vol%) in the chamber atmosphere. This treatment is intended as a first-order engineering correction for comparing different oxygen conditions. It does not replace direct measurements of limiting oxygen concentration or explosion limits under non-standard atmospheres. Accordingly, the corrected values should be interpreted mainly in a comparative sense.
Based on the corrected flammability limits, the overall flammability range of the vent-gas mixture was calculated using Equation (7):
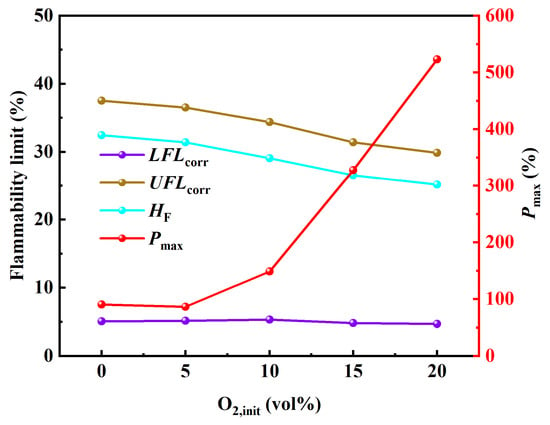
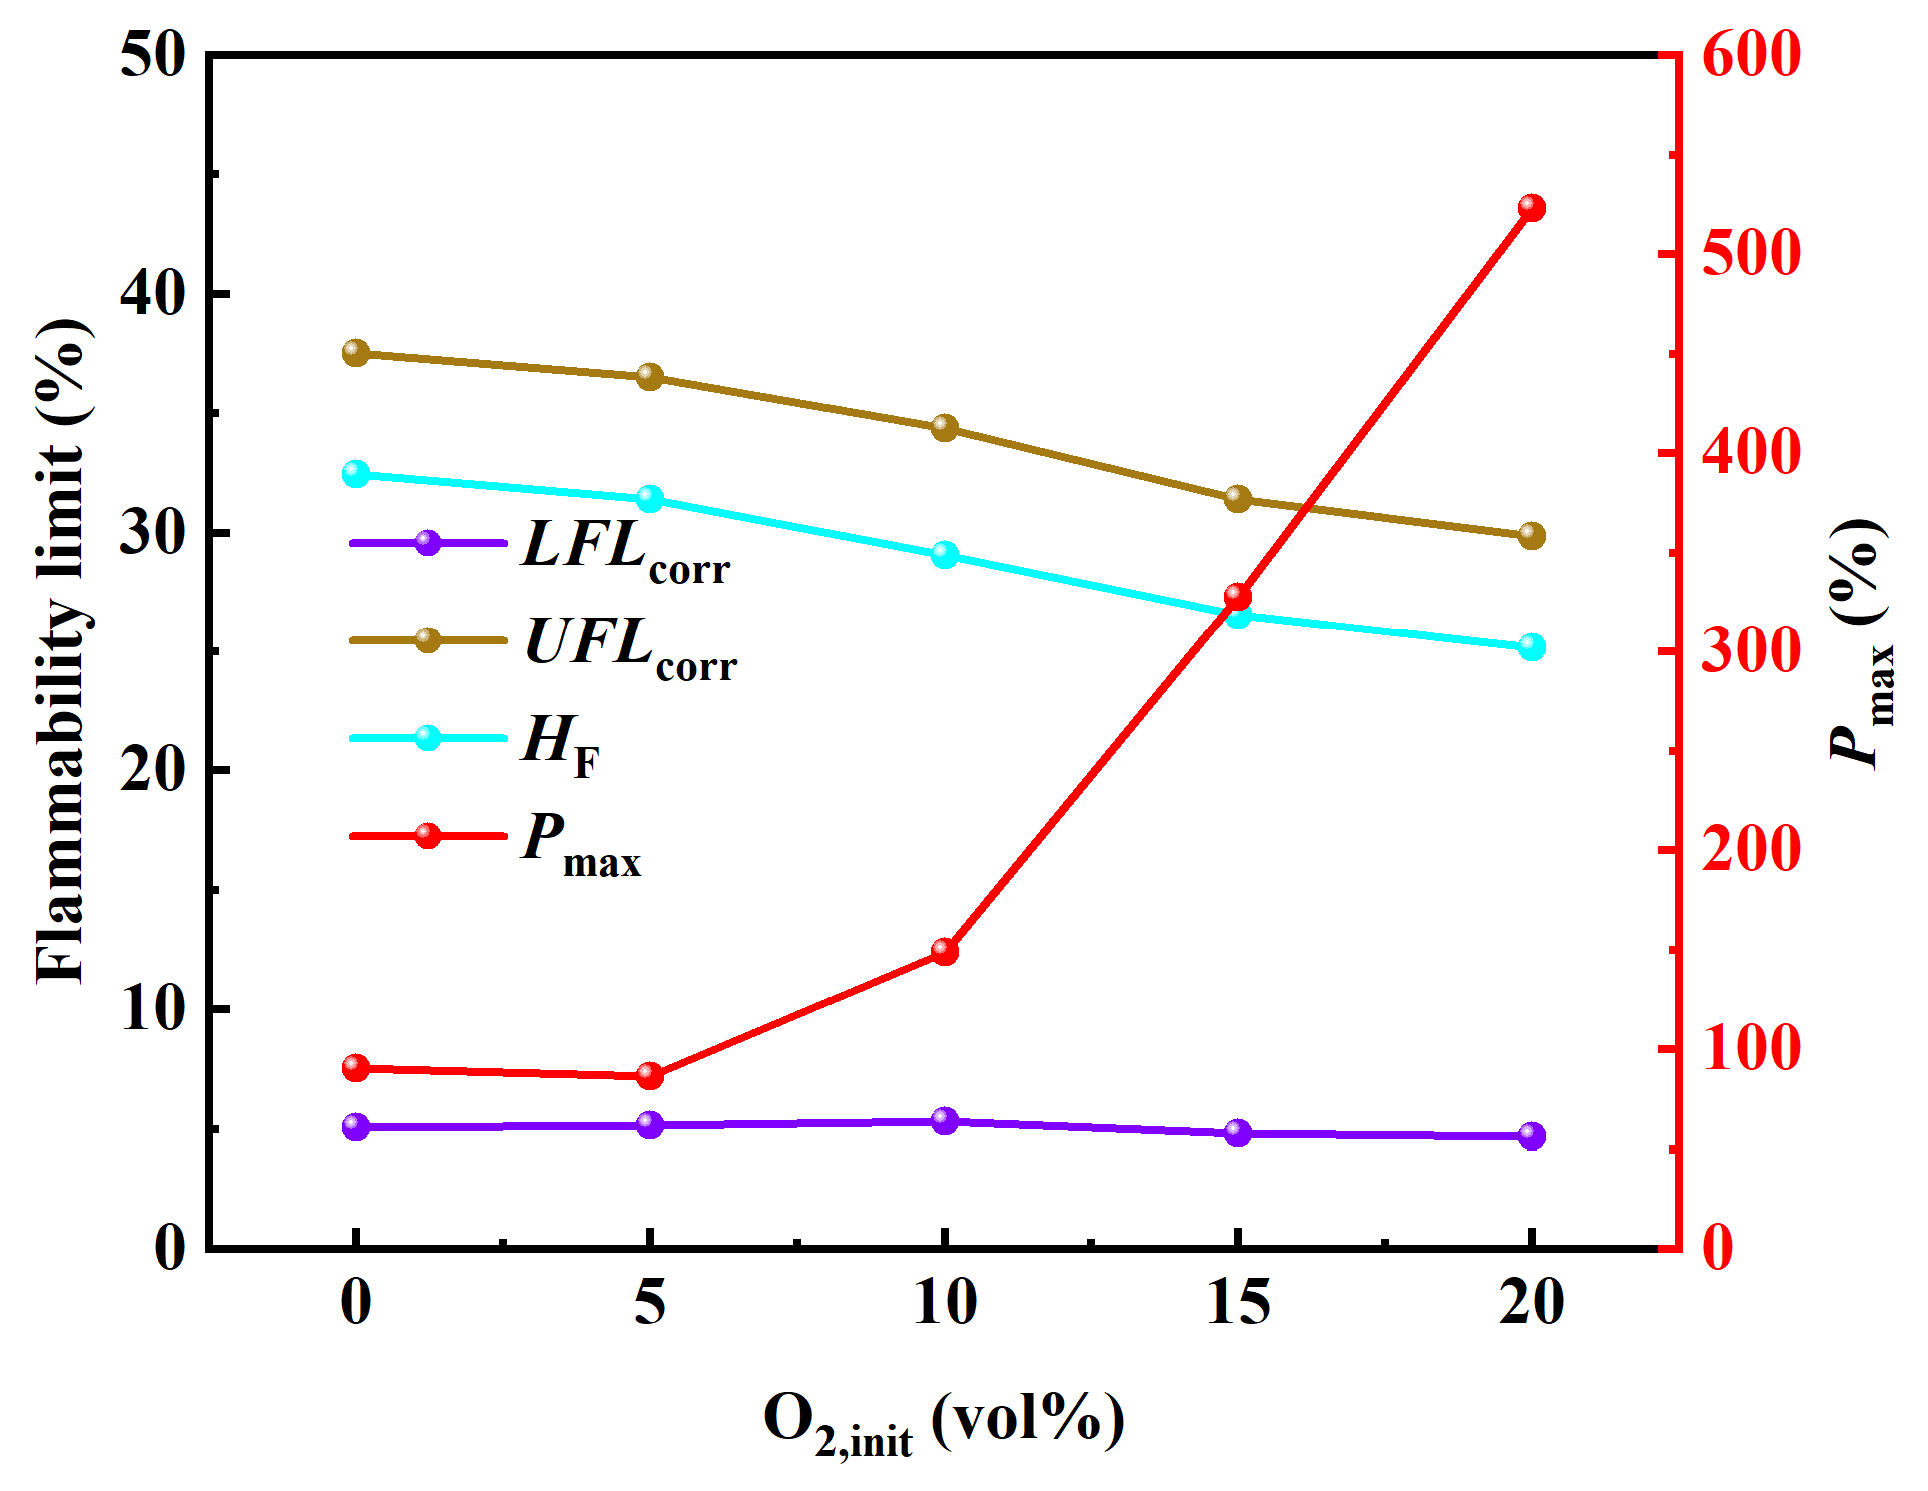
where HF is the flammability range, and UFL and LFL represent the corrected upper and lower flammability limits of the gas mixture, respectively. The variation in HF with initial oxygen fraction is shown in Figure 7 together with the measured peak chamber pressure.
HF = UFL − LFL
Figure 7.
Calculated flammability range of the vent-gas mixture and measured peak chamber pressure as a function of initial oxygen fraction.
As shown in Figure 7, the flammability range decreased monotonically with increasing initial oxygen fraction. Across the full range from 0% to 20% O2, HF contracted by 7.30 vol%, corresponding to a reduction of approximately 22.5% relative to the 0% O2 case. The contraction was most pronounced in the 5–15% O2 interval, whereas the changes in the 0–5% and 15–20% O2 intervals were comparatively modest. Overall, HF decreased by about 0.389 vol% for every 1% increase in initial oxygen concentration.
A more detailed examination shows that the reduction in HF was governed mainly by a decrease in the upper flammability limit rather than by changes in the lower flammability limit. Specifically, the UFL decreased from 37.52 vol% at 0% O2 to 29.86 vol% at 20% O2, whereas the LFL remained close to 5 vol%, with only minor fluctuations. This result is physically consistent with the measured gas-composition trends: increasing oxygen concentration reduced the final H2 fraction while increasing the proportion of diluent species such as CO2. Because hydrogen strongly broadens the fuel-rich combustion regime, its reduction primarily compresses the upper flammability boundary, while the lower boundary remains comparatively stable.
This finding has an important safety implication. A narrower flammability range at higher oxygen fraction does not imply a lower overall hazard. On the contrary, under the present test conditions, higher oxygen availability enhanced post-vent combustion, increased vent-jet temperature, and greatly amplified chamber overpressure, as shown in Section 3.1. Thus, the final hazard reflects two coupled but distinct factors: the composition of the residual mixed gas and the actual combustion intensity during and immediately after venting. In other words, the oxygen-rich cases produced a somewhat less fuel-rich final gas composition but a much more severe combustion event.
The Le Chatelier-based analysis presented here should be regarded as a comparative engineering estimate rather than an exact determination of explosion limits under TR conditions. The gas samples were collected after the event, after cooling and mixing within the chamber, and, therefore, represent post-event mixed dry gas rather than the transient hot vent stream at the moment of release. In addition, the oxygen-correction approach used in Equation (6) is heuristic and becomes less rigorous under strongly oxygen-deficient conditions.
Accordingly, the calculated LFL, UFL, and HF values are most useful for identifying relative trends across oxygen conditions rather than for defining absolute ignition boundaries. A more rigorous assessment would require dedicated flammability measurements under controlled pressure, temperature, and oxygen concentration. Nevertheless, the present analysis remains valuable because it links the measured gas composition to practical hazard interpretation and helps explain why residual-gas composition and actual event severity do not necessarily vary in the same direction.
3.3. Oxygen Participation, Heat Release, and Their Mechanistic Implications
As shown in Figure 6, the post-event mixed gas remained significantly combustible even under oxygen-free conditions, indicating that substantial combustible products generated during thermal runaway were still present in the chamber after the event. If sufficient oxygen was available during the chamber event and the subsequent chamber event, part of this combustible inventory could have been consumed by secondary oxidation. Therefore, rather than resolving transient plume chemistry directly, the present analysis estimates the apparent extent of oxygen participation from the final chamber gas composition.
3.3.1. Influence of Oxygen Fraction on Oxygen Participation and Gas-Phase Oxidation
In the present system, the oxygen available for post-vent oxidation originated predominantly from the initial chamber atmosphere. The contribution of oxygen contained in the vented gas itself was negligible and was, therefore, ignored. Under the assumption of isothermal and isobaric initial conditions (25 °C and 1 atm), the initial amount of oxygen in the chamber was calculated from the chamber volume and the prescribed initial oxygen fraction. To determine the total amount of gas remaining after thermal runaway, N2 was used as an internal reference because it did not participate significantly in the reactions and its molar quantity could be treated as conserved. By combining the measured post-test gas composition with the initial chamber conditions, the amount of oxygen consumed during the event was estimated.
To quantify the extent of environmental oxygen involvement, an oxygen-participation parameter, η, was introduced in Equation (8):
where is the amount of oxygen consumed during post-vent reactions and is the total amount of oxygen initially available in the chamber atmosphere. By definition, η ranges from 0 to 1. A higher value of η indicates that a larger fraction of the accessible oxygen was involved in oxidation of the vented combustible gases.
It should be noted that the oxygen-participation parameter, η, was derived from the post-event mixed dry gas composition rather than from time-resolved sampling of the transient hot vent plume. Therefore, η should be interpreted as an apparent, event-integrated descriptor of oxygen utilization under the present sampling protocol. In principle, the estimated η value may be influenced by gas-sampling time, chamber cooling, condensation of part of the vent products, and continued mixing of the chamber atmosphere before sampling. However, because all tests were conducted using the same chamber, cooling procedure, and post-event sampling protocol, the resulting bias is expected to be systematic across conditions. Accordingly, η remains suitable for comparative analysis of oxygen-participation trends under different initial oxygen fractions, although it should not be interpreted as the exact instantaneous oxygen-consumption fraction during the chamber event.
This parameter provides a practical bridge between gas-composition data and combustion severity. Unlike a simple description of residual O2 concentration, η directly expresses the utilization efficiency of available oxygen under a given atmospheric condition and, therefore, offers a more physically meaningful basis for comparing oxygen-diluted scenarios.
The results indicate that the initial oxygen fraction strongly affected the extent of gas-phase oxidation during and after venting. In general, decreasing the initial oxygen fraction increased the retention of combustible species such as H2 and CO while reducing the yield of the fully oxidized product CO2. For example, as the oxygen fraction decreased from 20% to 10%, the CO fraction increased markedly, whereas the H2 fraction remained appreciable. When oxygen was further reduced to 5% and 0%, the H2 fraction increased further, indicating that hydrogen oxidation was increasingly inhibited under oxygen-deficient conditions. At the same time, the CO2 fraction declined substantially, confirming that the apparent shift in residual composition intermediate species to fully oxidized products became progressively less complete.
These results also suggest a threshold-like change around 10% O2 in the final chamber-gas state and in the inferred oxygen-participation metric. When the initial oxygen fraction was below this level, the post-event mixed gas remained more fuel-rich, and η remained relatively low. At higher oxygen fractions, η increased, and the residual-gas composition shifted toward a more oxidized state. This trend is consistent with the stronger temperature rise and chamber overpressure observed in Section 3.1, but it should not be overinterpreted as direct time-resolved combustion-pathway evidence.
In this sense, η serves as a practical comparative descriptor linking the final gas composition to the macroscopic severity of the chamber event. It reflects the net outcome of oxygen availability and event-scale oxidation under the present protocol rather than resolving detailed flame structure, local mixing, or short-lived intermediates.
3.3.2. Apparent Shift in Residual Composition Oxygen Consumption into Heat Release
To estimate the thermal contribution associated with environmental oxygen uptake, the oxygen-consumption calorimetry concept was adopted. Following the Huggett/Thornton approach, the heat released through oxygen-involved combustion was approximated as proportional to the amount of oxygen consumed [36,37]. Thus, the combustion heat release attributable to oxygen participation was calculated using Equation (9):
where Q is the heat released by oxygen-involved combustion (kJ), is the amount of oxygen consumed (mol), and is the equivalent heat release per mole of oxygen consumed.
In this study, was taken as 419.2 ± 48.0 kJ·mol−1 O2, corresponding to the commonly used Huggett/Thornton coefficient of 13.1 ± 1.5 MJ·kg−1 O2. The calculated heat release is shown in Figure 8. It should be emphasized that this value represents only the heat associated with oxygen-involved post-vent combustion and does not include the intrinsic exothermic decomposition of cell materials under inert conditions. For each oxygen condition, three repeated tests were conducted primarily to verify repeatability and confirm the absence of obvious systematic deviation in the observed oxygen-dependent trends. Accordingly, Equation (10) is presented only as an empirical fit to the tested conditions and should not be interpreted as a general predictive relationship.
Figure 8.
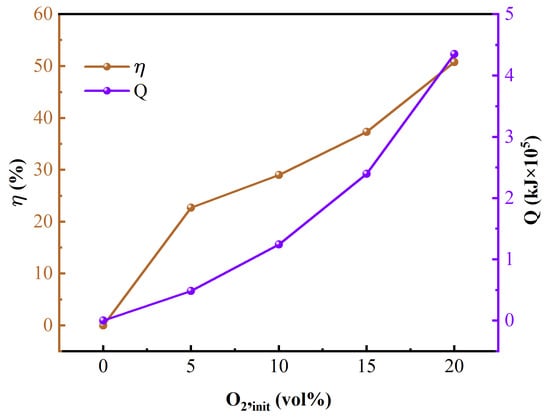
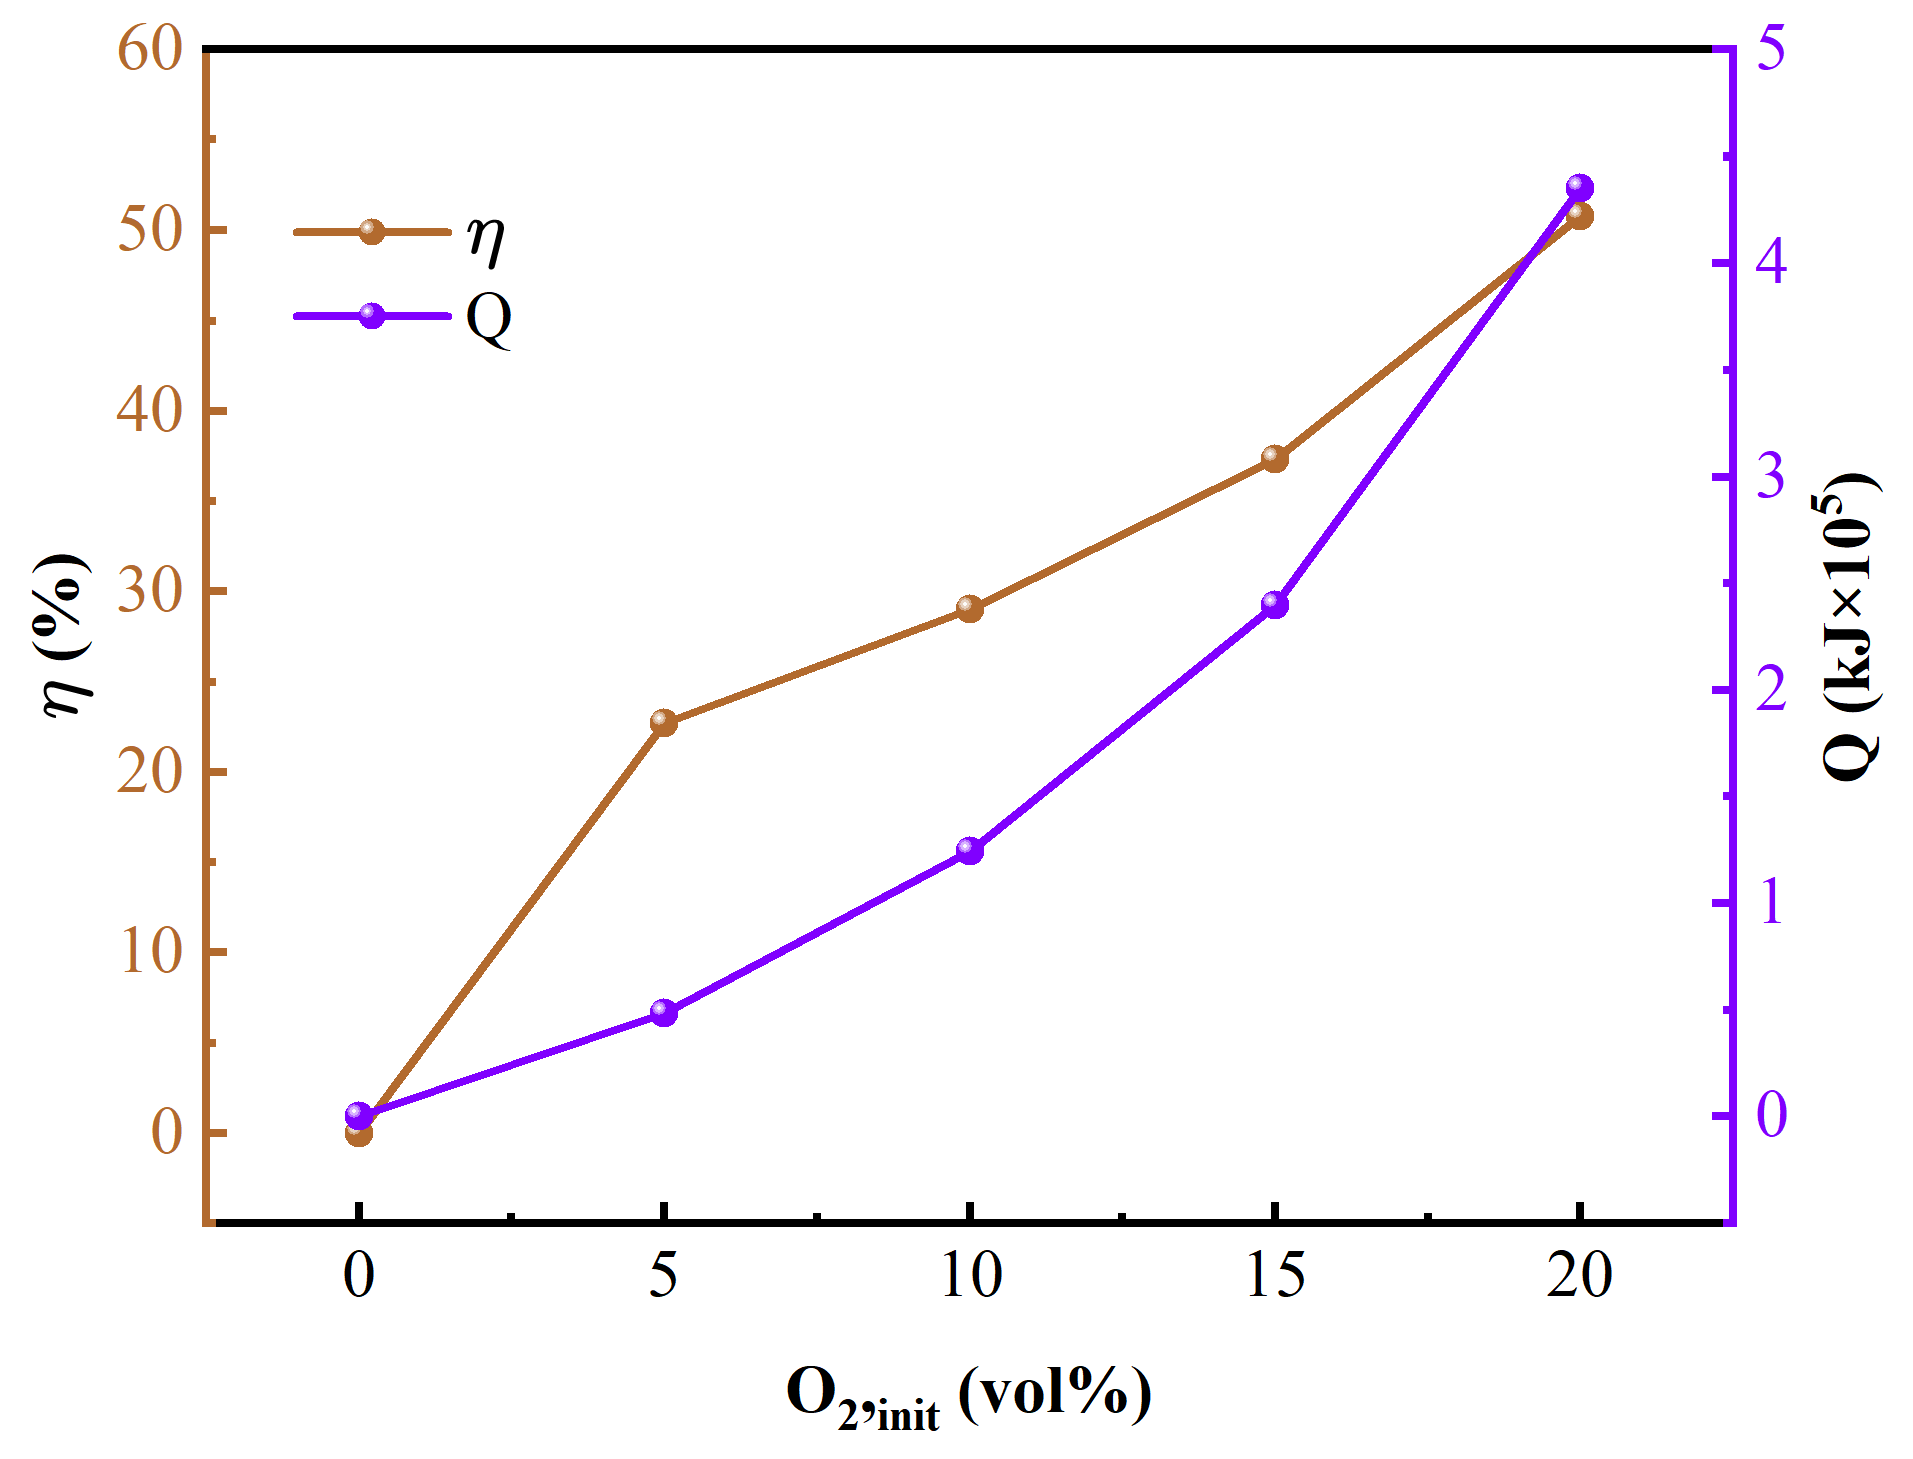
Effect of initial oxygen fraction on oxygen participation (η) and oxygen-involved heat release during post-vent combustion.
As shown in Figure 8, the heat release estimated from apparent environmental oxygen consumption increased strongly with initial oxygen fraction over the range of 5–20% O2. A near-linear relationship was expressed by Equation (10):
where is the initial oxygen fraction in the chamber atmosphere. This empirical relation characterizes the sensitivity of post-vent combustion heat release to oxygen availability within the tested range and should not be extrapolated to the 0% O2 condition.
Quantitatively, the calculated heat release reached approximately 435 kJ at 20% O2 but dropped to about 124 kJ at 10% O2 and 48.7 kJ at 5% O2. Relative to the 20% O2 case, this corresponds to reductions of about 72% and 89%, respectively. These results indicate that oxygen dilution is highly effective in reducing the heat release estimated from environmental oxygen uptake during the chamber event, even though it does not prevent the initial internal onset of thermal runaway.
The oxygen-participation parameter, η, increased significantly with oxygen concentration, rising from 22.7% at 5% O2 to 50.8% at 20% O2. This trend shows that oxygen availability controls not only the magnitude of heat release but also the efficiency with which the released fuel can be oxidized. In oxygen-rich atmospheres, the vented plume can sustain more complete combustion, producing both higher η and higher Q. By contrast, in oxygen-deficient atmospheres, combustion is restricted by limited oxidizer supply and reduced flame stability, so both oxygen utilization and heat release remain low.
Figure 8, therefore, provides more than a calculation result; it offers a mechanistic interpretation of why chamber pressure and vent-jet temperature increased so strongly with oxygen fraction in Section 3.1. Greater oxygen participation means more intense secondary combustion, stronger gas heating, and larger thermal expansion of the chamber contents. In this sense, η can be understood as an intermediate descriptor linking gas composition to macroscopic hazard metrics such as pressure rise and near-field thermal severity.
From an engineering perspective, the identified ~10% O2 threshold may serve as a design-relevant reference for oxygen-control strategies in battery enclosures rather than a universal safety limit. Under the present test conditions, reducing the accessible oxygen fraction to about 10 vol% or below markedly suppressed secondary combustion heat release and chamber overpressure, suggesting that enclosure inerting or oxygen dilution could be effective for limiting escalation after cell venting. For practical battery-pack or energy-storage-cabinet design, this means that maintaining the local accessible oxygen concentration below this level during a thermal-runaway event may help reduce the risk of violent post-vent combustion and pressure buildup. However, this threshold should not be interpreted as complete hazard elimination because thermal runaway can still occur and localized near-vent thermal exposure may remain significant. Therefore, oxygen control should be combined with vent routing, thermal shielding, and pressure-relief design to achieve robust system-level safety.
The present oxygen-participation analysis is intended as a practical engineering framework rather than a full combustion-resolution model. Several limitations should, therefore, be noted. First, the gas compositions used in the analysis were obtained from post-event mixed chamber samples rather than time-resolved measurements of the transient vent plume. Second, the Huggett/Thornton coefficient represents an equivalent heat-release approach and may not fully capture the detailed chemistry of mixed H2/CO/hydrocarbon combustion under battery-fire conditions. Third, the method quantifies only the heat associated with environmental oxygen uptake and does not include the intrinsic exothermic decomposition of the battery itself. Despite these limitations, the analysis remains useful because it provides a consistent way to compare oxygen-diluted atmospheres and to identify the oxygen ranges most relevant to combustion escalation and overpressure control.
4. Conclusions
This study systematically examined the influence of initial oxygen fraction on vent-gas composition and thermo-pressure responses during thermal runaway of 58 Ah prismatic NCM811 cells in a sealed chamber. The main conclusions are as follows:
- The first vent occurred reproducibly at a cell surface temperature of about 155 °C under all oxygen conditions, followed by thermal runaway onset at about 170 °C. These early events were governed mainly by internal cell reactions and were only weakly affected by ambient oxygen concentration;
- Oxygen concentration had a strong effect on post-vent hazard escalation. As the initial oxygen fraction increased from 0% to 20%, the peak vent-jet temperature rose from 353 to 1172 °C, and the peak chamber pressure increased from 90.7 to 523.1 kPa, confirming that oxygen mainly controls the severity of secondary combustion rather than the initiation of runaway;
- H2, CO2, CO, CH4, and C2H4 were the dominant species in the post-event mixed dry gas. Lower oxygen fractions were associated with a more fuel-rich residual-gas composition and broader calculated fuel-rich flammability ranges, whereas higher oxygen fractions were associated with a more oxidized residual-gas state and a higher CO2/CO ratio;
- Under the present test conditions, limiting accessible oxygen to about 10% or below substantially suppressed secondary combustion and pressure buildup, although localized near-field thermal hazards could still remain. The ~10% O2 level should, therefore, be regarded as a condition-specific design reference, and oxygen control should be combined with vent management and thermal protection.
The oxygen-participation metric, η, offers a practical descriptor for linking oxygen availability to post-vent heat release and pressure escalation in confined battery environments. These findings provide condition-specific quantitative guidance for oxygen-control, enclosure inerting, and post-vent hazard mitigation in confined battery environments similar to those tested here.
Author Contributions
Conceptualization, N.W. and L.H.; methodology, N.W.; software, N.W.; validation, N.W.; formal analysis, N.W.; investigation, N.W.; resources, N.W.; data curation, N.W. and L.H.; writing—original draft preparation, N.W.; writing—review and editing, N.W. and L.H.; visualization, N.W.; supervision, N.W.; project administration, L.H. All authors have read and agreed to the published version of the manuscript.
Funding
This research received no external funding.
Data Availability Statement
The original contributions presented in this study are included in the article. Further inquiries can be directed to the corresponding author.
Acknowledgments
During the preparation of this manuscript, the authors used ChatGPT (GPT-5.4 Thinking) to improve the English language, including grammar, clarity, concision, and overall readability. After using this tool, all authors carefully reviewed and edited the content as necessary and take full responsibility for the content of the publication.
Conflicts of Interest
The authors declare no conflicts of interest.
Abbreviations
The following abbreviations are used in this manuscript:
| DMC | Dimethyl carbonate, C3H6O3 |
| EMC | Methyl ethyl carbonate, C4H8O3 |
| CC–CV | Constant current–constant voltage |
| NCM811 | Li(Ni0.8Co0.1Mn0.1)O2 |
| LIB | Lithium-ion battery |
| SOC | State of charge |
| TS | Cell side surface center temperature, °C |
| TE | Cell jet zone temperatures near the cell safety valve, °C |
| TH | Heating plate temperature, °C |
| TR | Thermal runaway |
| UFL | Upper flammability limit |
| LFL | Lower flammability limit |
References
- Xu, L.; Wang, S.; Li, Y.; Li, Y.; Sun, J.; Zhao, F.; Wang, H.; Wang, Y.; Xu, C.; Feng, X. Thermal Runaway Propagation Behavior and Gas Production Characteristics of NCM622 Battery Modules at Different State of Charge. Process Saf. Environ. Prot. 2024, 185, 267–276. [Google Scholar] [CrossRef] [Scilit]
- Jia, Z.; Wang, S.; Qin, P.; Li, C.; Jin, K.; Sun, J.; Wang, Q. Investigation of Gas Diffusion Behavior and Detection of 86 Ah LiFePO4 Batteries in Energy Storage Systems during Thermal Runaway. Process Saf. Environ. Prot. 2024, 184, 579–588. [Google Scholar] [CrossRef] [Scilit]
- Huang, W.; Feng, X.; Pan, Y.; Jin, C.; Sun, J.; Yao, J.; Wang, H.; Xu, C.; Jiang, F.; Ouyang, M. Early Warning of Battery Failure Based on Venting Signal. J. Energy Storage 2023, 59, 106536. [Google Scholar] [CrossRef] [Scilit]
- A Wang, H.; Xu, H.; Zhang, Z.; Wang, Q.; Jin, C.; Wu, C.; Xu, C.; Hao, J.; Sun, L.; Du, Z.; et al. Fire and Explosion Characteristics of Vent Gas from Lithium-Ion Batteries after Thermal Runaway: A Comparative Study. eTransportation 2022, 13, 100190. [Google Scholar] [CrossRef] [Scilit]
- Willstrand, O.; Pushp, M.; Andersson, P.; Brandell, D. Impact of Different Li-Ion Cell Test Conditions on Thermal Runaway Characteristics and Gas Release Measurements. J. Energy Storage 2023, 68, 107785. [Google Scholar] [CrossRef] [Scilit]
- Wei, N.; Zhang, F.; Zhang, W.; Li, X. Comparative Study on the Thermal Runaway Characteristics of Li(NixCoyMnz)O2 Batteries. Heliyon 2024, 10, e31203. [Google Scholar] [CrossRef] [Scilit]
- Shen, H.; Wang, H.; Li, M.; Li, C.; Zhang, Y.; Li, Y.; Yang, X.; Feng, X.; Ouyang, M. Thermal Runaway Characteristics and Gas Composition Analysis of Lithium-Ion Batteries with Different LFP and NCM Cathode Materials under Inert Atmosphere. Electronics 2023, 12, 1603. [Google Scholar] [CrossRef] [Scilit]
- Wang, H.; Wang, Q.; Zhao, Z.; Jin, C.; Xu, C.; Huang, W.; Yuan, Z.; Wang, S.; Li, Y.; Zhao, Y.; et al. Thermal Runaway Propagation Behavior of the Cell-to-Pack Battery System. J. Energy Chem. 2023, 84, 162–172. [Google Scholar] [CrossRef]
- Zhao, C.; Sun, J.; Wang, Q. Thermal Runaway Hazards Investigation on 18650 Lithium-Ion Battery Using Extended Volume Accelerating Rate Calorimeter. J. Energy Storage 2020, 28, 101232. [Google Scholar] [CrossRef] [Scilit]
- Karmakar, A.; Zhou, H.; Vishnugopi, B.S.; Mukherjee, P.P. Thermal Runaway Propagation Analytics and Crosstalk in Lithium-Ion Battery Modules. Energy Technol. 2024, 12, 2300707. [Google Scholar] [CrossRef] [Scilit]
- Mei, W.; Liu, Z.; Wang, C.; Wu, C.; Liu, Y.; Liu, P.; Xia, X.; Xue, X.; Han, X.; Sun, J.; et al. Operando Monitoring of Thermal Runaway in Commercial Lithium-Ion Cells via Advanced Lab-on-Fiber Technologies. Nat. Commun. 2023, 14, 5251. [Google Scholar] [CrossRef] [Scilit]
- Li, W.; Wang, H.; Zhang, Y.; Ouyang, M. Flammability Characteristics of the Battery Vent Gas: A Case of NCA and LFP Lithium-Ion Batteries during External Heating Abuse. J. Energy Storage 2019, 24, 100775. [Google Scholar] [CrossRef] [Scilit]
- Jia, Z.; Qin, P.; Li, Z.; Wei, Z.; Jin, K.; Jiang, L.; Wang, Q. Analysis of Gas Release during the Process of Thermal Runaway of Lithium-Ion Batteries with Three Different Cathode Materials. J. Energy Storage 2022, 50, 104302. [Google Scholar] [CrossRef] [Scilit]
- Yang, J.; Pan, T.; Li, Y.; Wang, J.; Wu, Z.; Duan, Q.; Jin, K.; Wang, Q.; Sun, J. Thermal Runaway in Large-Capacity Sodium-Ion Batteries: Safety Performance Evaluation under Thermal, Electrical, and Mechanical Abuse Conditions. J. Energy Storage 2025, 130, 117405. [Google Scholar] [CrossRef] [Scilit]
- Wei, N.; Li, M. Experimental Investigation of Thermal Runaway in 40Ah Prismatic Lithium Batteries at Different SOC. An. Acad. Bras. Ciênc. 2024, 96, e20230648. [Google Scholar] [CrossRef] [Scilit]
- Zhang, L.; Liu, L.; Terekhov, A.; Warnberg, D.; Zhao, P. Thermal Runaway of Li-Ion Battery with Different Aging Histories. Process Saf. Environ. Prot. 2024, 185, 910–917. [Google Scholar] [CrossRef] [Scilit]
- Lou, Z.; Huang, J.; Su, Z.; Zhang, D.; Wei, X.; Yao, H. Effects of Ventilation Conditions on Thermal Runaway of Lithium-Ion Batteries Packs in an Energy-Storage Cabin. Process Saf. Environ. Prot. 2025, 196, 106899. [Google Scholar] [CrossRef] [Scilit]
- Wang, Q.; Wang, H.; Xu, C.; Jin, C.; Wang, S.; Xu, L.; Ouyang, J.; Feng, X. Multidimensional Fire Propagation of Lithium-Ion Phosphate Batteries for Energy Storage. eTransportation 2024, 20, 100328. [Google Scholar] [CrossRef] [Scilit]
- Li, C.; Wang, H.; Shi, C.; Wang, Y.; Li, Y.; Ouyang, M. A Fitting Method to Characterize the Gaseous Venting Behavior of Lithium–Ion Batteries in a Sealed Chamber during Thermal Runaway. Energies 2023, 16, 7874. [Google Scholar] [CrossRef] [Scilit]
- Li, C.; Wang, H.; Li, Y.; Lu, L. Venting Particle-Induced Arc of Lithium-Ion Batteries during the Thermal Runaway. eTransportation 2024, 22, 100350. [Google Scholar] [CrossRef] [Scilit]
- Li, H.; Shen, H.; Li, M.; Gao, Q.; Xu, C.; Feng, X. A Simplified Mathematical Modeling Approach for Thermal Runaway of Li(Ni0.8Co0.1Mn0.1)O2 Pouch Cells Based on Thermal Runaway Experimental Data. J. Energy Storage 2024, 90, 111829. [Google Scholar] [CrossRef] [Scilit]
- Li, Y.; Jiang, L.; Huang, Z.; Jia, Z.; Qin, P.; Wang, Q. Pressure Effect on the Thermal Runaway Behaviors of Lithium-Ion Battery in Confined Space. Fire Technol. 2023, 59, 1137–1155. [Google Scholar] [CrossRef] [Scilit]
- Li, W.; Xue, Y.; Feng, X.; Liu, J.; Zhang, F.; Rao, S.; Zhang, T.; Gao, Z.; Du, Z.; Ni, C.; et al. Enhancing Understanding of Particle Emissions from Lithium-Ion Traction Batteries during Thermal Runaway: An Overview and Challenges. eTransportation 2024, 22, 100354. [Google Scholar] [CrossRef] [Scilit]
- Liu, P.; Wang, C.; Sun, S.; Zhao, G.; Yu, X.; Hu, Y.; Mei, W.; Jin, K.; Wang, Q. Understanding the Influence of the Confined Cabinet on Thermal Runaway of Large Format Batteries with Different Chemistries: A Comparison and Safety Assessment Study. J. Energy Storage 2023, 74, 109337. [Google Scholar] [CrossRef] [Scilit]
- Sun, H.; Zhang, L.; Duan, Q.; Wang, S.; Sun, S.; Sun, J.; Wang, Q. Experimental Study on Suppressing Thermal Runaway Propagation of Lithium-Ion Batteries in Confined Space by Various Fire Extinguishing Agents. Process Saf. Environ. Prot. 2022, 167, 299–307. [Google Scholar] [CrossRef] [Scilit]
- Feng, X.; Ouyang, M.; Liu, X.; Lu, L.; Xia, Y.; He, X. Thermal Runaway Mechanism of Lithium Ion Battery for Electric Vehicles: A Review. Energy Storage Mater. 2018, 10, 246–267. [Google Scholar] [CrossRef] [Scilit]
- Zou, K.; Xu, J.; Zhao, M.; Lu, S. Effects and Mechanism of Thermal Insulation Materials on Thermal Runaway Propagation in Large-Format Pouch Lithium-Ion Batteries. Process Saf. Environ. Prot. 2024, 185, 1352–1361. [Google Scholar] [CrossRef] [Scilit]
- Wang, Z.; He, C.; Geng, Z.; Li, G.; Zhang, Y.; Shi, X.; Yao, B. Experimental Study of Thermal Runaway Propagation Suppression of Lithium-Ion Battery Module in Electric Vehicle Power Packs. Process Saf. Environ. Prot. 2024, 182, 692–702. [Google Scholar] [CrossRef] [Scilit]
- Zhao, L.; Hou, J.; Feng, X.; Xu, J.; Xu, C.; Wang, H.; Liu, H.; Hou, B.; Rui, X.; Gu, Y.; et al. The Trade-off Characteristic between Battery Thermal Runaway and Combustion. Energy Storage Mater. 2024, 69, 103380. [Google Scholar] [CrossRef] [Scilit]
- Yang, X.; Wang, H.; Li, M.; Li, Y.; Li, C.; Zhang, Y.; Chen, S.; Shen, H.; Qian, F.; Feng, X.; et al. Experimental Study on Thermal Runaway Behavior of Lithium-Ion Battery and Analysis of Combustible Limit of Gas Production. Batteries 2022, 8, 250. [Google Scholar] [CrossRef] [Scilit]
- Hu, J.; Liu, T.; Wang, X. Effect of Discharge Operation on Thermal Runaway Incubation Process of Lithium-Ion Battery: An Experimental Study. Process Saf. Environ. Prot. 2024, 185, 25–35. [Google Scholar] [CrossRef] [Scilit]
- Ouyang, D.; Pang, Y.; Liu, B.; Wang, Z. An Experimental Investigation on Thermal Runaway Features of Lithium-Ion Cells under Tunnel Situations. Process Saf. Environ. Prot. 2024, 181, 26–32. [Google Scholar] [CrossRef] [Scilit]
- Xing, Y.; Wei, N.; Li, M. Quantitative Analysis of Lithium-Ion Battery Eruption Behavior in Thermal Runaway. Batteries 2024, 10, 182. [Google Scholar] [CrossRef] [Scilit]
- Qi, C.; Wang, H.; Li, M.; Li, C.; Li, Y.; Wei, N.; Zhang, H. Study on the Multi-Stage Evolution of Thermal Runaway and the Flammability Threshold of Gas Generation in Lithium Iron Phosphate Batteries Based on SOC Gradient. Micromachines 2025, 16, 544. [Google Scholar] [CrossRef] [Scilit] [PubMed]
- Xie, W.; Zhang, L. Experimental Study on Thermal Runaway and Venting Gas Explosion Hazards in Prismatic Lithium-Ion Batteries at Different States of Charge. Process Saf. Environ. Prot. 2025, 198, 107118. [Google Scholar] [CrossRef] [Scilit]
- Willstrand, O.; Pushp, M.; Ingason, H.; Brandell, D. Uncertainties in the Use of Oxygen Consumption Calorimetry for Heat Release Measurements in Lithium-Ion Battery Fires. Fire Saf. J. 2024, 143, 104078. [Google Scholar] [CrossRef] [Scilit]
- Liu, C.; Liu, Y.; Cheng, Z.; Li, Y.; Liu, P.; Liu, L.; Min, Y.; Duan, Q.; Mei, W.; Wang, Q. Experimental Study on the Impact of Safety Valve Venting Pressure on Thermal Runaway in Large-Format Lithium Iron Phosphate Battery. Process Saf. Environ. Prot. 2025, 201, 107563. [Google Scholar] [CrossRef] [Scilit]

Disclaimer/Publisher’s Note: The statements, opinions and data contained in all publications are solely those of the individual author(s) and contributor(s) and not of MDPI and/or the editor(s). MDPI and/or the editor(s) disclaim responsibility for any injury to people or property resulting from any ideas, methods, instructions or products referred to in the content. |
© 2026 by the authors. Published by MDPI on behalf of the World Electric Vehicle Association. Licensee MDPI, Basel, Switzerland. This article is an open access article distributed under the terms and conditions of the Creative Commons Attribution (CC BY) license.