Abstract
Traditional approaches to overcoming energy loss from resistances of vehicular transit velocities have focused primarily on reducing aerodynamic drag through streamlining air flow. These approaches have overlooked significant reductions in resistance on highways by reducing rolling losses and the aerodynamic drag associated with boundary layer separation and leading-edge stagnation regions. Ground effect vehicles are able to make significant strides towards reducing these two resistances. These vehicles can approach an 80% reduction in resistance compared to conventional frame streamlining alone. These substantial reductions to resistance enable a more effective and broader range of electric vehicles, including electric trucks and railcars. Lower resistance enables higher speeds at the same power consumption. Examples of digital prototype performances include up to 50% and 30% reductions in resistance through mitigating rolling/drivetrain and boundary layer separation losses, respectively. Digital prototypes are able to reach a lift-to-drag efficiency of 25 while maintaining a 0.2 aspect ratio. A cascade of additional advantages arises from aerodynamic lift-enabling rubber tires on steel rails for multimodal and widespread service. This paper details the mechanisms of how to achieve substantial reductions in energy consumption and enable transit transformations. The technology enables open-ended evolution with far greater possibilities than current transit options. The technological evolution includes electric automobiles, delivery trucks, semi-trucks, and railcars using batteries and solar sheets with significant competitive advantages over fossil fuels.
Keywords:
ground effect; solar; electric; L/D efficiency; drag; boundary layer separation; low emission 1. Introduction
The economic viability of displacing liquid fuels for trucks and buses with electric power is highly dependent on the energy efficiency of those vehicles. A 50% energy consumption reduction could either reduce battery costs and weight by half or double the range of a vehicle. As vehicular energy needs decrease, the benefits of solar panels on vehicles (“vehicle-based solar power”) increase. The benefits include: (a) reducing vehicle costs, (b) displacing liquid fuels in sectors like freight in air transit, which are highly dependent on liquid fuels, and (c) enabling higher-speed ground transit.
A new ground effect flight transit (GEFT) technology uses aerodynamic suspension to displace rolling losses at cruising speeds. The generation of aerodynamic lift in the GEFT designs is a “free” cruising-speed benefit that emerges as aerodynamic drag is reduced beyond that of alternative approaches. A significant advantage of GEFT technology is high compatibility with existing infrastructure, including market introduction options based on only incremental changes to vehicles and rails or highways.
An additional benefit emerges by displacing wheel-based traction with the aerodynamic navigation of ground effect flight on railway vehicles to allow highspeed railcar transit on tracks unsuitable for highspeed trains. While trains require steel wheels to reduce rolling losses for the train units, GEFT railcars could use rubber tires which opens evolutionary options for highway–railway multimodal transit with benefits of increased route availabilities and reduced transit times and costs. These options include high-speed cruising lanes with 21st century control, tracking, and scheduling options applied to vehicles on highways [].
In the early decades of the 21st century, numerous drag reduction features have become commonplace on trucks, including: (a) roof, side, and underbody fairings; (b) trailer panels known as boat tails, and (c) gap reductions between the tractor and trailer [,]. These enhancements focus on streamlining air flow. Even battery placement for electric vehicles has a notable impact on decreasing streamlining and aerodynamic efficiency; therefore, the ability to reduce battery size is an important efficiency metric [].
Research into aerodynamic drag reduction methods is an active and critical function of recent research. Vehicle weight and drag have been identified as key factors limiting the range and capabilities of electric vehicles []. Computational fluid dynamics, CFD, has played a leading role in testing features for drag reduction, including identifying up to 59% reductions in aerodynamic drag for trucks through streamlining with passive flow control devices, with CFD accuracy being within 5% of the physical tests [,,]. Fifty-nine percent aerodynamic drag reduction translates to about a 30% reduction in resistances, which include drag and rolling losses. CFD on railcars has been effective for modeling and identifying operational gap lengths for ideal aerodynamics, rear deflectors, and turbulence mitigation [,,].
While previous work in the field has focused on frame streamlining to reduce aerodynamic drag, this work focuses on atypical methods of reducing energy consumption for transit:
- Reduced drag due to mitigating boundary layer separation (BLS) at the vehicle’s rear,
- Reduced drag due to streamlining the vehicle undercarriage,
- Reduced drag due to reducing the impact of the leading-edge stagnation point(s), and
- Reduced rolling/mechanical losses due to aerodynamic suspension replacing wheeled suspension.
Data substantiating these mechanisms are in the author’s published papers, albeit not explicitly separated into these categories [,].
Boundary layer separation (BLS) remains one of the largest losses of aerodynamic efficiency. BLS occurs when streamlined flow separates from the surface of an aircraft or wing, particularly near the aft of the vehicle. This creates a region of higher pressure on the wing than would otherwise be present, as well as potential turbulence in the flow and eddy currents [,]. Multiple approaches have been attempted to prevent BLS and maintain the efficiency of streamline flow. A common method is to attempt to augment the surface texture of the wing to maintain attachment to the streamlines, which generally has the benefit of delaying boundary layer separation but does not generally show significant increases in efficiency [,,,,]. A second approach is to use engineered airflows to combine with the separating airflow to prevent separation, such as using flow suction on the wing itself [,]. A similar approach is applied to GEFT with an upper surface propulsor to augment and direct the streamline flow [].
Table 1 summarizes the types and sources of energy savings possible with GEFT technology [,]. The data identifies that rolling losses can exceed aerodynamic losses at current operational standards, especially as aerodynamic efficiency continues to increase. Addressing drivetrain and rolling losses becomes a priority for electric vehicles and trucks [,]. One method of reducing rolling losses is to cruise in ground effect flight.

Table 1.
Engine power balance, loaded class 8 tractor trailer with benchmark urban and highway data from Canadian Transport Report []. The highway data is at about 70 mph.
GEFT technology is a result of the rapid evolution of technologies stemming from a new approach to understanding how air flow generates aerodynamic lift [,,]. The potential benefits of GEFT technology are profound, including: (a) over a trillion dollars per year in saved money value of time over transit ranging from commuter transit to intercity routes dominated by long-haul airliners, (b) saving consumers thousands of dollars per year per consumer, (c) a fast track to substantial reductions in global warming and potential greening of cities, and (d) relieving societal and political reliance on petroleum [].
The data of Table 1 substantiate how GEFT technology can reduce energy consumption for trucks and related vehicles by 50%. This paper expands upon [] by going into detail of how a 50% reduction can increase to 80% due to the formation of pressure fields that reduce pressure drag, which aerodynamic streamlining alone does achieve.
The Figure 1 illustration of GEFT includes the key design feature of an upper-surface trailing-section ducted fan. The ducted fan reduces pressures in front of the intake to generate aerodynamic lift and increases velocities and pressures along a trailing taper at the fan discharge. Over the trailing taper, the higher pressures and more-streamlined airflow decrease turbulence and related induced drag.
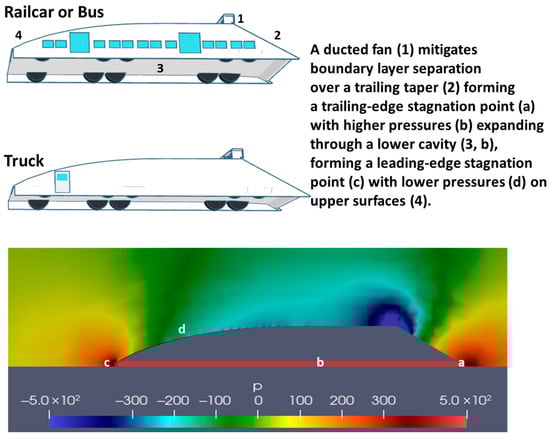
Figure 1.
Illustration of key design features of GEFT including a pressure contour in ground effect flight where higher pressure on the lower surface (red) is aerodynamic lift due to air’s oncoming dynamic pressure.
In addition, the fan-enhanced flow along the trailing taper causes a more robust, higher-pressure trailing-section stagnation point, which is a source of higher cavity pressures. The higher pressure expands through the lower cavity when the cavity is equipped with side fences, a near-horizontal upper cavity surface (i.e., lower surface of fuselage), and a trailing flap. At optimal conditions, the lower pressure in the cavity expands to join with the leading-edge stagnation point. Over the leading edge, the combined impacts of the ducted fan and the leading-edge stagnation point lead to lower pressures in the front upper surface of the vehicle.
GEFT lift-to-drag (L/D) efficiencies in excess of 30 are possible in configurations suitable for transit over highway and railway corridors. The high L/D efficiencies are due to the synergies of the many design features leading to highly favorable pressure fields on the vehicle surfaces. These synergies use the benefits of ground effect flight on lift forces [].
The term “Induced Thrust” has been introduced to identify conditions under which surface pressures create thrust rather than drag []. Induced thrust may occur with or without enhancements of pressure profiles from fan or jet engines. A common example of induced thrust is the lower pressure that forms at surfaces of negative pitch on an aircraft wing flying at high pitch during takeoff or landing. Figure 2 illustrates the pressure contour of an airfoil at a pitch generating a low-pressure area that extends forward to the highest point of the wing, thereby generating induced thrust. Another example is high pressure on the forward underside of slats.
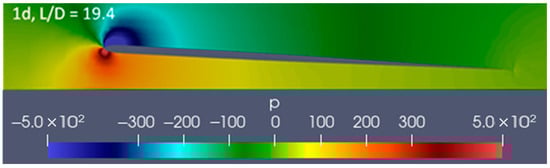
Figure 2.
Illustration of induced thrust on a thin airfoil [].
While several types of drag are articulated in the aircraft literature, CFD literature and software tend to utilize two types of drag: (a) pressure drag and (b) viscous drag. Pressure drag is a forward projection of pressures acting perpendicularly on the surface. Viscous drag is due to viscous flow forces acting tangential to the surface. Induced thrust is a specific category of pressure drag, and as the name implies, it is a form of thrust rather than drag. Induced thrust is a component of pressure acting on the aircraft to provide a force in the thrust direction. Induced thrust becomes increasingly important towards achieving higher L/D efficiencies since small changes in drag can have a large impact on L/D. L/D is a measurement of energy efficiency.
The weight of the vehicle is a design and applications parameter, including the area weight (e.g., wA in g × ρA, 9.8 m/s2 × kg/m2) which is derived from the area density. The aerodynamic resistance is as follows:
where aerodynamic resistance is provided in N/m2, as the force per planform area.
As exemplified by Equation (1), higher L/D leads to lower resistance in GEFT designs. L/D is therefore the primary parameter evaluated for performance in this paper [].
Equation (1) provides the resistance force for steady-level flight where aerodynamic resistance is the only form of resistance. Multiplying (1) by the velocity (U) yields the power per planform area (A) to sustain flight. Then Power, watts, is defined as
A series of work summarized by [] identified the generation of aerodynamic lift by oncoming air velocity at high L/D efficiency []. However, the pervious work has not explicitly identified that the lift generation is a bonus of properly designed ground effect vehicles. This paper evaluates the extent to which generation of lift in GEFT is a beneficial bonus. The studies are designed to create an understanding of what is possible versus optimization of a specific design.
The objective of this work is to convey improved understanding along with digital prototype performances. The goal is rapid progress in transit technology with substantial benefits, including reduced transit costs, times, carbon emissions, and environmental impacts. Expanded use of electric vehicles is a critical part of realizing the benefits of transit evolution.
2. Materials and Methods
Advances in GEFT technology are based on computational fluid dynamic (CFD) simulation of digital prototypes with a focus on ground effect flight at a high lift-to-drag ratio efficiency (L/D). The experiments were completed with OpenFOAM-v2312 software [].
Methods were matched to maintain fidelity and methods analogous to those within the field [,,]. The turbulence model is k-ω SST with the SimpleFOAM-v2312 solver. Two-dimensional (2D) simulations were used to identify trends in performance. Mesh independence was tested through independently doubling global and local mesh densities to ensure a less than 5% difference in pressure, L/D, and kinematic turbulence measurements (k). Simulation convergence was set to 1 × 10⁻⁶ residuals for pressure and velocity. Initial settings were also compared with experimental data for NACA006 airfoils.
Unless otherwise reported, the scale chords of the STLs were 1 m, the fluid was air at 1 atm pressure, and the free stream velocity was 40 m/s. Pressure profiles are symmetrically presented with blue as low pressure, red as high pressure, and passing through green at 0-gauge pressure. Pressures are reported as kinematic pressure in figures, m2/s2: pressure normalized by density, which is approximately 1.23 kg/m3 for air.
For ground effect simulations, the ground was simulated as a lower boundary condition with a velocity equal to the free stream air and zero free stream gauge pressure. Velocity profiles are from the reference frame of the airfoil/digital prototype. Propulsion sources are modeled as rectangular prisms cell zones for accelerating airflow. The CFD meshes simulated free stream flow boundaries conditions at a minimum of 10 chord lengths from the vehicle in all flow directions.
Two-dimensional (2D) CFD simulations were performed on the airfoils of Figure 3. The dimensions were 0.97 (L) × 0.106 m (H) (1st and 2nd airfoils) and 0.92 (L) × 0.095 m (H) (3rd airfoil without flap), with sources at 0.002 × 0.02 m at the leading edge of the vehicle’s trailing taper. The calculated thickness ratio (TR) is 0.1. Simulations were also run on airfoils at half the heights with TR = 0.05. Air flow and moving wall ground velocities were 40 m/s relative to the airfoil. The clearance from the ground was 0.0029 m with one simulation at a clearance of 0.0087 m. Sample 2D simulation files and postprocessing data are included in the Supplemental Materials.
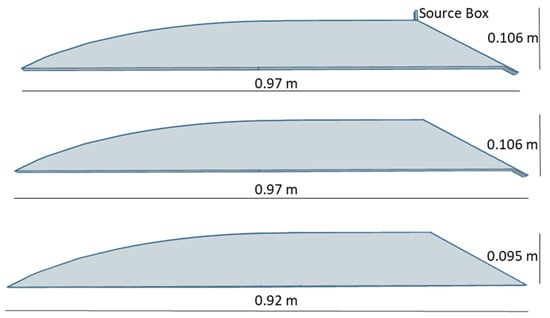
Figure 3.
Airfoils at TR = 0.1 with and without flap and with and without upper-surface trailing-section “Source” to simulate a ducted fan.
OpenFOAM simulations report lift and drag coefficients (CL and CD) based on the same reference value for area, which may be different than the scale of anticipated GEFT vehicles. To the first approximation, within 1–2 orders of magnitude, the simulations results are independent of scale and are typically performed at 40 m/s with a chord near 1 m in length.
Common practice in CFD is to report both CL and CD based on planform area where L/D is equivalent to CL/CD. The data reported in this work are CD as calculated by OpenFoam with a reference area of 1 m2 and further divided by the planform area of the 1 m chord model and L/D as the ratio of CL to CD. Both L/D and CD are considered representative metrics of performance.
L/D efficiency is not highly dependent on velocities between 10 m/s and 70 m/s as boundary layer separation generally does not develop differently within less than an order of magnitude difference.
3. Results
3.1. Two-Dimensional Simulations
Two-dimensional simulations (2D) provide overarching trends in performance under the simplified constraint of the absence of lateral dissipation of lift forces. Toward this goal, 2D simulations of the Figure 3 airfoils were performed with and without the generation of thrust velocity (i.e., ducted fan power, also known as “Source” power) by the upper-surface trailing-section ducted fan.
Example pressure profiles of the Figure 3 airfoil for the 0.05 TR variant airfoil with and without a trailing flap are provided by Figure 4. Studies with a trailing flap aft a lower-surface cavity are of interest since the flap provides a control feature and allows for a lower ground clearance while most of the lower surface remains more-distant from the ground. The cavity may still develop a consistent and beneficial high pressure. The ground would typically be a highway or railway surface, with evolution toward multimodal service that includes railway, highway, and waterway corridors.
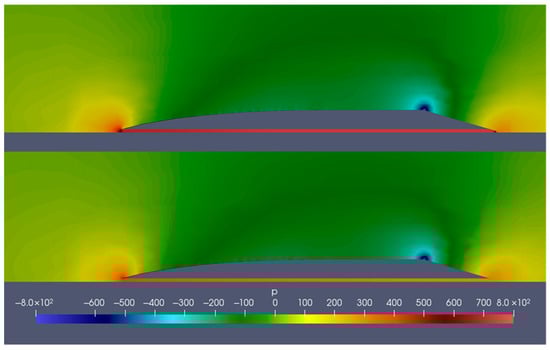
Figure 4.
Pressure (m2/s2) profiles for airfoils at TR = 0.0.05 with (upper) and without (lower) flap. No simulation of ducted fan. The clearances are 0.0029 and 0.0087 m.
The quantifiable impact of the power setting of the ducted fan on performance is provided by Figure 5 and Figure 6 with a summary of values in Table 2 and additional pressure profiles at 0.1 TR by Figure 7. A significant change in performance trends occurs as the TR is increased from 0.05 to 0.1. At the lower TR, velocity flows are substantially streamlined even without power to the ducted fan. At a TR of 0.1, boundary layer separation occurs as illustrated by Figure 7A.
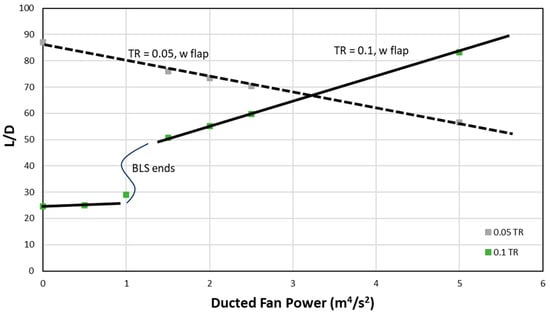
Figure 5.
The lift–drag ratios (L/D) as a function of source power (ducted fan power) for airfoils with flaps at TR of 0.05 (dashed line) and 0.1 (solid line).
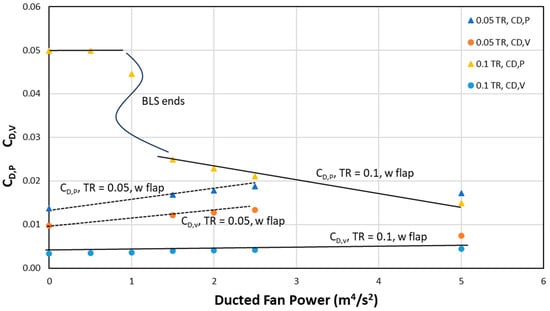
Figure 6.
Pressure drag (upper two lines) and viscous drag (lower two lines) coefficients as reported for airfoils at a TR of 0.1 (solid line) and 0.05 (dashed line).
Table 2.
Two-dimensional CFD results of airfoil simulations. CD-Pressure and CD-Viscous are presented with respect to the planform area. The final column presents CD with respect to frontal projection for comparison with other EV vehicles.
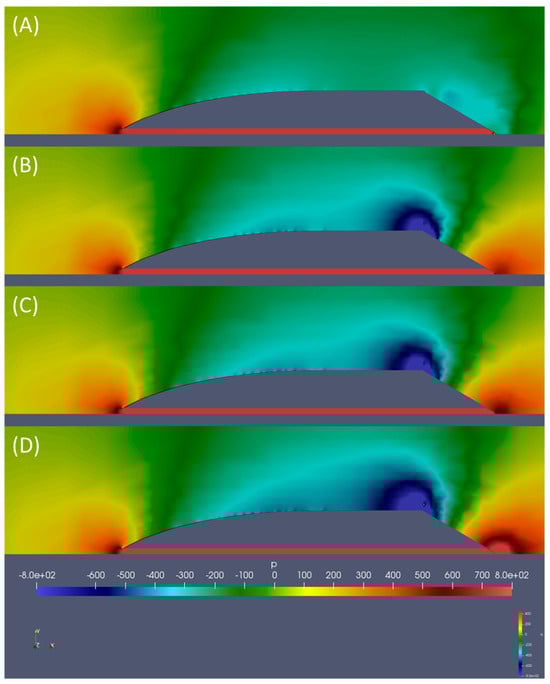
Figure 7.
Pressure(m2/s2) profiles illustrating impact of ducted fan power for 0.1 TR airfoil which exhibits boundary layer separation at zero fan power. Source (i.e., ducted fan) settings are (A) 0, (B) 1.5, (C) 2.5, and (D) 5.0 m4/s2.
Turbulence is a characterizing feature of boundary layer separation, and Figure 8 explicitly exemplifies the turbulence at a 0 source setting with the substantial absence of turbulence observed at higher source settings. Figure 5 highlights the sharp increase in efficiency which is observed as the source mitigates BLS. The phenomenon is observed predominantly for the 0.1 TR airfoil rather than the 0.05 TR airfoil. Since the 0.05 TR airfoil is thin enough it does not inherently express strong BLS. Figure 6 further elucidates the mechanics of the increase in the observation that CD,P decreases significantly as the drag from the BLS turbulence disappears. Separate studies focus on the turbulent energy where the total turbulence rapidly decreases with the onset of source power toward a minimum, with gradual increase at higher source settings []. Increases in turbulence are imminent as the source power increases due to excess source air flow causing jetwash; however, evidence indicates that proximity to the ground moderates the jet wash leading to gradual, rather than substantial, increases in turbulent energy after a minimum is reached.
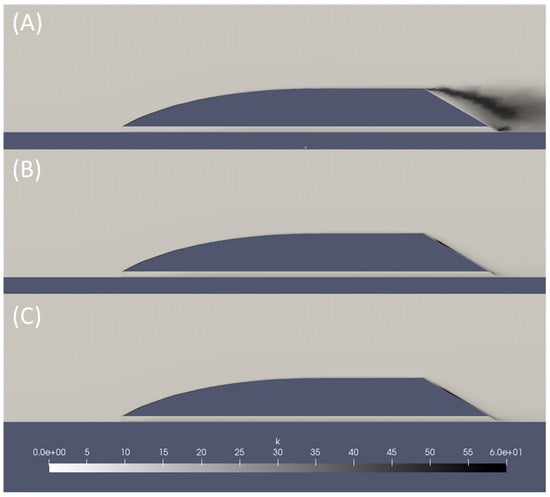
Figure 8.
Turbulent energy, k, profiles for illustrating impact of ducted fan power for 0.1 TR airfoil which exhibits boundary layer separation at zero fan power. Source settings are (A) 0, (B) 2.5, and (C) 5 m4/s2.
Superimposed over the impact of BLS mitigation is the impact on the pressure and viscous drags of Figure 6. As illustrated by the expanded pressure profile images of Figure 9, at zero source setting a lower pressure region over the trailing taper pulls back on airfoil leading to high pressure drag. As the source setting increases, higher pressures form at the surface and expand upward. The higher pressure pushes forward on the vehicle, providing thrust. This pressure is referred to as induced thrust. The pressure drag of the 0.1 TR airfoil eventually becomes less than that of the 0.05 TR airfoil.
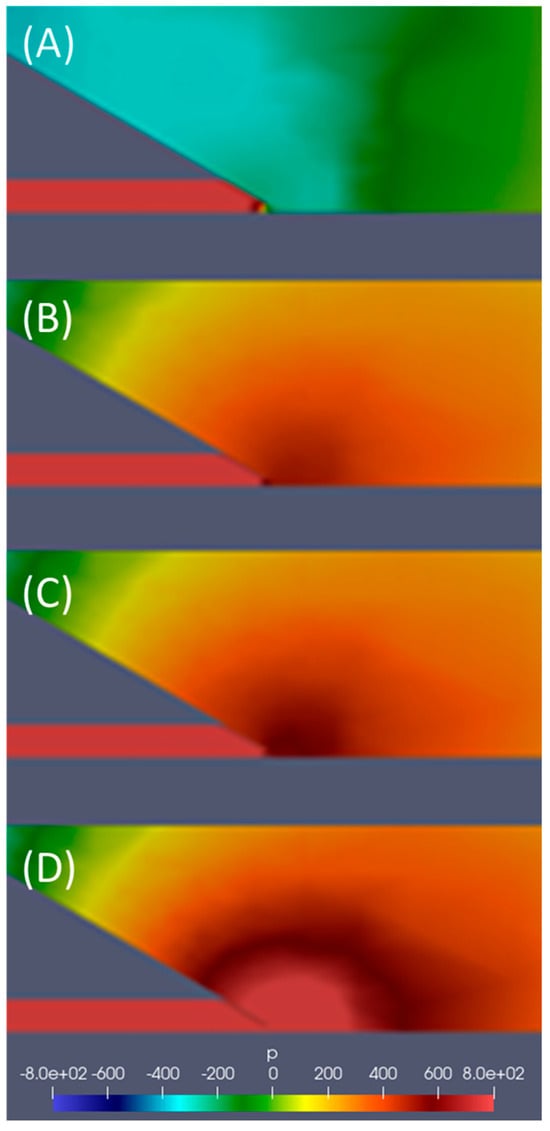
Figure 9.
Expanded pressure profiles of Figure 7 trailing edges. Source settings are (A) 0, (B) 1.5, (C) 2.5, and (D) 5.0 m4/s2.
Viscous drag is substantially linear with respect to the source setting. Most of the viscous drag is from the upper surface of the airfoil since the flap reduces flow below the lower surface. Lower pressure on the upper surface of the 0.1 TR airfoil leads to lower viscous drag.
3.2. Prototype Verifications
Other papers exemplify how the 2D trends of Figure 5, Figure 6, Figure 7, Figure 8 and Figure 9 translate to 3D digital prototype performances [,]. The comparison of two GEFT vehicles in Figure 10 illustrates three important features about the high L/D efficiency of GEFT, including the following:
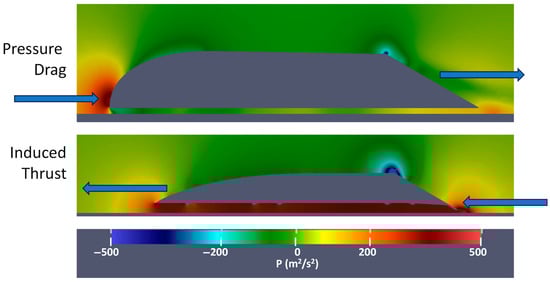
Figure 10.
Illustration of pressure drag and induced thrust on GEFT airfoil designs of different thickness ratios and different ducted fan powers. Only the lower GEFT has power applied to the upper-surface trailing-section ducted fan [].
- Pressure is generated by the trailing flap and expands forward. That pressure can be enhanced by a robust trailing-edge stagnation point developed by ducted-fan air flow over a trailing taper, and
- When the higher pressures in the lower cavity reach the leading edge, the center of the leading-edge stagnation point transition lowers.
The upper pressure contour of Figure 10 illustrates how the higher pressures of a leading-edge stagnation point can impact a large area of the vehicle’s frontal section. The lower image illustrates how the higher pressures from the leading-edge stagnation point can impact a relatively small forward-projection area of the vehicle’s frontal section. The forward projection of the higher pressures of the upper image are dominated by higher pressures causing a pressure drag. The forward projections of the lower image are dominated by a large section of neutral or lower pressures where the pressure drag is substantially displaced with induced thrust.
Rather than acting on the vehicle’s frontal surface, the higher pressures of the leading-edge stagnation point act on the trailing flap of the vehicle’s lower cavity. At the flap, higher pressures on frontal surfaces are substantially balanced by similar pressures on the aft surfaces, leading to a cancelation of much of the pressure drag from the leading-edge stagnation point.
In general, the upper vehicle of Figure 10 has higher pressures in the front and lower pressures in the back, resulting in substantial pressure drag. The lower vehicle has similar pressures in the front and back, leading to a substantial cancelation of pressure drag. The cancelation of the pressure drag is a unique performance manifestation due to the vehicle’s trailing taper extending to the vehicle’s lower edge. Typically, pressure drag coefficients decrease from >0.07 to <0.03, providing total potential drag reductions from 50%, due to reduced rolling losses, to 80% with additional reductions in aerodynamic losses [].
More exact quantification of the reductions is difficult due to the highly coupled nature of propulsion power, lift generation, and pressure drag reduction. However, the data indicate that these phenomena act in harmony to reduce energy requirements in optimal configurations.
The leading-edge stagnation point is a steady-state phenomenon where oncoming air impacts the higher pressures of the stagnation point and air’s dynamic pressure is transformed into static pressure. The steady-state condition is where the generation of higher pressures at the leading section of the leading-edge stagnation point balances the loss of higher pressures from expansion upward over the leading edge, and in some cases, expansion into the vehicle undercarriage.
For contemporary vehicles exhibiting streamlined flow, the higher pressures of the leading-edge stagnation point never achieve the low frontal projection of the Figure 10 lower GEFT. Hence, streamlining alone is insufficient to reach the lower pressure drag of GEFT. Therefore, GEFT can achieve lower aerodynamic drag than alternative vehicles which do not generate aerodynamic lift on the vehicles’ lower surfaces. Hence, GEFT both reduces aerodynamic drag to lower levels than other vehicles and achieves aerodynamic lift as a “free” bonus.
3.3. Work Lost in Jet Wash
The body surfaces of a GEFT vehicle are highly coupled with ducted fan performance. Fundamentally, the vehicle partly forms the fan’s nacelle and nozzle where the propeller shape can have significant impact on design. Because the vehicle body and ducted fan are highly coupled in performance, it is difficult to distinguish between the efficiency of the vehicle and the engine. To address this issue, lost work analyses are performed as a measure of efficiency.
The primary emphasis of the lost work analysis is turbulent energy [,]. The turbulent energy systematically achieves very low values for GEFT as boundary layer separation is mitigated by increased propulsor power before the onset of jetwash []. Jetwash does not necessarily readily show up as turbulent energy as identified by the velocity profiles of Figure 11; the initiation of jetwash can be observed in the third image of Figure 11 through the lightening of the blue near the ground surface. The jetwash is ultimately lost work from an efficiency perspective, but in the proximity of the vehicle it may manifest as a substantially laminar flow and a channel of higher velocity air as illustrated by the lower image of Figure 11.
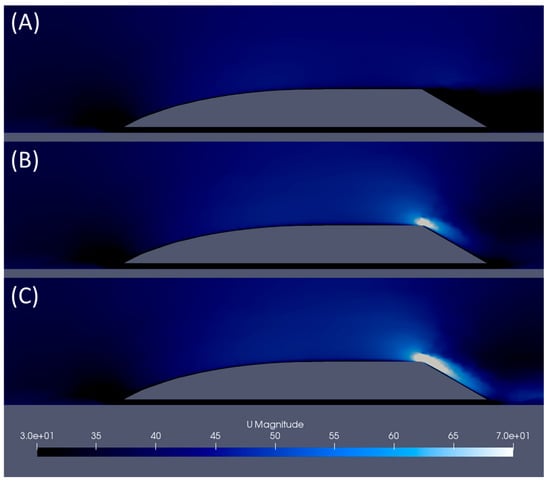
Figure 11.
Airfoil velocities (m/s) at source settings of (A) 0, (B) 2.5, and (C) 5.0 m4/s2.
Figure 11 exemplifies how lower velocities persist below the lower surface due to restricted flow by the flap. This lower velocity leads to lower viscous losses.
3.4. Lower Velocity GEFT
GEFT is designed around the steady-state operation of travel at 40 m/s which provides significant lift from air’s dynamic pressure. The dynamics for the development of forward and rear stagnation points, cavity dynamic pressures, and mitigation of BLS remain the same at lower velocities. The balance of these forces does change with respect to velocity. For example, BLS is less likely to occur at lower velocities, which corresponds to lower Reynald’s numbers, while air’s dynamic pressure is lower, resulting in less total lift from the cavity [,,,,,].
Table 3 provides characteristic values for airfoil operations at 20 m/s and 30 m/s. The steady-state condition is selected for source values operating at low turbulence. Since the average kinetic turbulence has a flat minimum with respect to source setting, the chosen condition is kinetic turbulence 80% of the way between the kinetic turbulence with no source and the minimum in kinetic turbulence energy []. A kinetic turbulence value prior to the minimum is selected in 2D because the BLS-related turbulence has, on average, a greater-weighting on kinetic turbulence than the jetwash turbulence with respect to their impact on lost work.
Table 3.
Selected airfoil characterizations for GEFT at 20 and 30 m/s. Data and sources are provided for selected low turbulence conditions. The GEFT design is similar to Figure 11 with the addition of a slight convex camber on the trailing taper.
The L/D values for 20 and 30 m/s GEFT are able to exceed those of 40 m/s while relying on a Source with a lesser magnitude. A key finding is that at lower velocities BLS still forms and an upper-surface trailing-section source is able to mitigate the BLS to reduce pressure drag.
3.5. Example 3D Digital Prototype L/D
L/D is the primary factor impacting the conversion of a flying vehicle’s load (i.e., total weight) to power requirements. Attaining a robust high pressure in the cavity is a necessary condition for GEFT to achieve high L/D. The highest L/D is achieved when GEFT’s lower cavity provides a robust lift in combination with low drag due to aerodynamics over the upper surface. The required thrust to propel a vehicle forward is equal to the drag acting on the vehicle. Therefore, reduced drag, along with improved lift, provides greater efficiencies, enabling better electric and solar opportunities, as well as higher speeds. Table 4 provides example L/D performances.
Table 4.
Previously reported specifications and coefficient of drag data for GEFT and ground effect thin cambers.
Three-dimensional digital prototypes L/D values are considerably less than those of 2D simulations due to including lateral dissipation of lift pressures in 3D results. Many airfoil sections have been shown to achieve L/D exceeding 100, providing insight into how to achieve increased lift efficiency [,,]. However, these values do not maintain such values in 3D models and applications with full dissipation of lift forces in the lateral direction.
In GEFT designs the ground blocks downward dissipation of lift forces and assists in streamlining of flows behind the vehicle; however, minor increases in drag can make a significant impact on L/D reduction.
Major benefits of GEFT technology arise at L/D between 20 and 40; performances identified as attainable based on CFD of 3D prototypes.
The performances of GEFT are highly dependent on aspect ratio (AR) and thickness ratio. A thickness ratio of 0.11 is consistent with the lower ceiling heights of some aircrafts but is low compared to semi-truck trailer dimensions. However, semi-truck dimensions are dependent on tow-motor loading and unloading which can rapidly change with industry advancements, particularly with robot loading and unloading.
4. Discussion
The objective of this paper is not to provide definitive data on vehicle performances, but rather to provide insight and understanding on how substantially increased efficiencies are possible for vehicles, which has significant implications on electric vehicles, carbon emissions, and multiple other current issues []. Toward this objective, 2D airfoil studies identify overarching trends in performance within the absence of lateral pressure dissipation, which exists for 3D prototypes and actual vehicles. In view of the significant implications, gaining the most insight at each level of escalation of R&D rigor has high importance in expediting the evolution of technology to realize high-impact applications.
The BLS mitigation illustrated in Figure 5 enhances lift generation. However, BLS mitigation primarily increases efficiency through drag reduction rather than generating lift directly. The greatest resistance reductions occur when the GEFT design applies to trucks to both generate lift and mitigate BLS. The application leads to approximately 50% reduction through eliminating rolling and drivetrain losses (Table 1), alongside an additional up to 30% reduction due to the improved aerodynamics related to BLS mitigation and reduction of the impact from the leading-edge stagnation region (Figure 5 and Figure 10).
Figure 5 and Figure 6 illustrate how lift is generated as drag decreases, and so, aerodynamic lift is a “free bonus” of reducing drag. Figure 9 and Figure 10 illustrate how pressure drag is reduced to lower levels with aerodynamic lift than is possible with streamlining alone.
Figure 9D is particularly insightful on how most of the pressure drag of the leading-edge stagnation point can be nullified when the higher pressures progress to a trailing-section flap, where the higher pressures on the flap’s aft surface nullify drag. When the lower surface is horizontal, the only drag within the cavity is viscous drag. That viscous drag is reduced due to substantially lower velocities in the lower cavity.
Figure 9 and Figure 10 further clarify the impacts of changes to the stagnation regions: increasing the trailing edge stagnation region displaces thrust forces from the source to the lower section of the trailing taper, decreasing drag and increasing L/D. When the higher pressures reach the leading-edge stagnation point through the cavity, part of the leading-edge stagnation point is countered by viscous forces generated by this pressure, leading to further decreased L/D from this approach. These lead to further artificially high L/D from 2D simulations. Figure 9A is consistent with a non-optimal low source setting with both boundary-layer separation and loss of higher cavity pressures under the trialing flap. Figure 9B is consistent with thrust forces being transferred to the back side of the flap and L/D values are disproportionally high. The L/D values in Table 4 include these phenomena.
The results identify three sources of reduced energy consumption possible with the GEFT design:
- A.
- Elimination of drag related to boundary layer separation reduces aerodynamic drag by around 50%; about 25% of total resistance (see Figure 6).
- B.
- Displacement of wheel suspension with aerodynamic suspension reduces total resistance to translation (i.e., movement velocities) by up to 50%.
- C.
- Reduction in pressure drag from the leading-edge stagnation point reduces aerodynamic drag by about 15% (see Figure 6)
GEFT’s innovations reside in an upper-surface trailing-section ducted fan used in combination with the vehicle’s trailing taper and lower cavity. The maximum benefit over alternatives is for vehicles of heights consistent with passenger and freight cabins of common automobiles, trucks, buses, and railcars.
Reductions A. and C. can be fully realized as a result of the changes in pressure contours on the vehicle and may be broadly applied to benefits at cruising speeds. Benefits from reduction B. are proportional to the fraction of weight supported by aerodynamic drag.
Essentially all automobiles and trucks have substantial surface areas with surface pitches within 30° of vertical. Those vehicle surfaces have substantial pressure drag due to the leading-edge stagnation region and trailing-section turbulence.
These efficiencies naturally occur at TR = 0.05. but, at TR = 0.05, the heights are too low for passenger service and significant freight service unless the length exceeds 25 m, at which length the aspect ratio [width:length] adversely impacts efficiency. The novel feature of the GEFT design that mitigates boundary layer separation is the upper-surface trailing-section ducted fan which forces air over a relatively high-pitch taper []. This feature allows the development of vehicles with a TR greater than 0.05 that maintain many of the advantages and efficiencies provided by the lower-TR designs.
Numerous designs and techniques to improve electric vehicle efficiency for extended ranges, to compete with traditional gasoline vehicles, are under investigation. These include testing barebone designs, which are primarily planforms for solar generation with a miniscule cabin for a single occupant []. With these small designs, they achieve a practical CD of 0.13 to 0.3 []. Other researchers have developed a CD of 0.8 for light trucking []. GEFT simulations predict significantly better frontal projection CD potential, such as 0.18 at TR = 0.1R. Thickness ratios at and greater than 0.1 include vehicles with larger cabins and payload space. GEFT efficiency savings are further increased through the additional reductions in rolling losses resulting from increased aerodynamic lift compared to other electric vehicles.
It is noteworthy that multiple conventions exist for calculation of CD. For aircraft and the ground effect flight, the CFD standard is to base CD on planform area which equates the CL/CD ratio to L/D as presented in Table 2. For automobiles and trucks, CD is typically calculated based on the frontal-projection area. CFD programs also report both pressure and viscous components of CD. A useful performance metric is the ratio of pressure to viscous drag coefficients for a more specific determination as to the source of drag resistances.
On an inefficient vehicle, the addition of solar panels to a vehicle has negligible impact on lowering vehicle costs, even when the vehicle is used at times of reasonable solar irradiance []. As efficiency increases, the impact of solar panels could lead to substantially reduced battery and energy costs for applications. Hence, a class of vehicles emerges with exceptional daytime performance while remaining reasonably functional at nighttime. Subsequent discussion topics include approaches to increase the effectiveness of direct solar powered vehicles (i.e., power directly from solar panels to electric motors) and scheduling methods to maximize operation at vehicular cruising velocities.
Use of a single-sheet upper surface body comprising a thin and flexible solar print of photovoltaic cells has the propensity to provide both lightweight and high solar power collection. Figure 12 illustrates an ultralight vehicle with this design; such vehicles would be particularly useful as autonomous vehicles with light or no payloads.
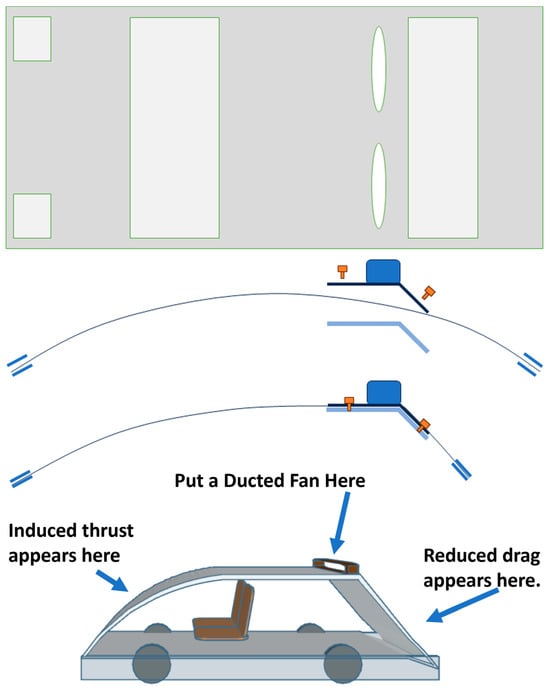
Figure 12.
Illustration of a ground effect vehicle using single-laminated-sheet upper-surface.
A thin laminate upper surface could have a weight as low as 0.35 kg/m2 []. Assuming a similar weight for the lower surface, and a structure consisting of about 4× that weight, a vehicle emerges with a specific weight around 2 kg/m2. This would enable inexpensive construction of a highly useful, lightweight, small vehicle.
Another application scenario would include a towed planform acting as a power source to a lead aircraft with L/D = 20 and velocity of 40 m/s (89.5 mph). The power source could produce an average of [180 W/m2 × 0.3] W/m2, which is an irradiance of 180 W/m2 multiplied by a panel efficiency of 30% []. Daily averaged irradiance can range from 100 to 230 W/m2 depending on location and weather conditions. Under perfectly ideal circumstances (i.e., midday, sunny summer weather in direct orientation to solar radiation), irradiance can reach 1000 W/m2 []. The towed solar panel may have an area density of 2.25 kg/m2. The power required for lift would be gravity times weight with the power requirement proportional to velocity. The associated thrust would be this power divided by the L/D. Therefore, the thrust power, per Equation (2), required to support the towed platform is [9.8 m/s2 × 2.25 kg/m2 × 40 m/s/20] = 44.1 W/m2, which is less than the estimated 54 W/m2 which can be produced by the panel, providing about 25% more power than it needs to be sustained. Under the perfectly ideal circumstances, an excess of five times the power would be achieved, approximately 300 W/m2 produced from the sheet. As solar sheet efficiencies increase to over 40% and more lightweight frames are achieved, excess energy can readily increase towards twice the energy needed to sustain flight in average conditions.
The excess power changes with the addition of payload and battery weights. However, there are significant useful ranges of operation which are enabled by the low resistance of this approach to transit. New solar irradiance predictive algorithms are in development which will be able to allow dynamic integration to optimize vehicle range and efficiency based on local predictive conditions [].
While Figure 12 illustrates an ultralight weight vehicle design, Figure 13 illustrates the approach to increase the surface area for solar power collection with a towed aerial solar planform. Relative to simply pulling a trailer with extra solar panels, the towed aerial solar planform is of lighter weight and could be extended or retracted so as not to impact the maneuverability at lower velocities and while parked. A mature technology would seamlessly extend and retract as automatic functionality of a flexible photovoltaic sheet. The Figure 12 approach further expands the technology’s potential with the addition of an ultralight body embedded with photovoltaic cells.
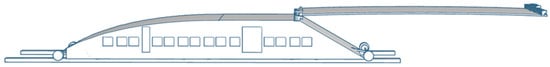
Figure 13.
Hi-Rail (highway-rail) vehicle with an extendable solar sheet platform.
Solar-powered vehicles are a topic worthy of emphasis due to the manner in which the reduced energy requirements identified by this work are able to combine with (a) vehicle design, (b) methods to expand solar collection areas, and (c) research advancing photovoltaic cell efficiency. Designs may emerge with sustainable competitive advantages.
The design of electric vehicles to realize reductions in drag is an exercise in matching the maximum area vehicle weight (wA) to a cruising velocity. L/D is equated to the ratio of the lift and drag coefficients as CL/CD. The range of CL for well-designed GEFT vehicles is 1.2 to 1.4, with the lower surface contribution equaling to about 0.95; pressures approaching air’s dynamic pressure are readily attainable in GEFT’s lower cavity. The amount of lift on a GEFT’s upper surface is relatively low due to low aspect ratios and associated lateral losses of upper-surface lift pressures as well. Table 5 summarizes air’s dynamic pressure as a function of velocity alongside estimated power requirements and load capabilities.
Table 5.
Air’s dynamic pressure at density of 1.25 kg/m3, car width of 2.6 m. The power is estimated by an L/D efficiency of 20 for a 2 m high truck at an aspect ratio of 0.2. Values are examples of “higher pressure” for generating aerodynamic lift, which correlate to air’s dynamic pressure.
For example, a 90-mph 2.6 m wide vehicle with a load up to 265 kg/m can be achieved with a CL of 1.0. A CL of 1.25 would provide 330 kg/m. If the vehicle weight is more than the lift pressure, wheel suspension can support the difference in weight. The power requirements for sustaining the velocity at this maximum weight equals the weight divided by L/D multiplied by velocity per Equation (2).
A list of multiplicative factors consistent with performance conditions are: (a) 0.35 to 0.3 for photovoltaic efficiency for comparison to solar irradiance, (b) 1.2 to 1.4 for including the upper surface lift in the lift coefficient, (c) 1.0 to 2.0 for L/D improvements between 20 and 40, and (d) 1.0 to 2.5 for surface area expansion for vehicles with side and towed solar platforms. Within these ranges, the solar irradiation can provide notable impact on electric vehicles traveling 40 m/s and potentially provide all necessary power for 20 m/s travel at 65 kg/m loads. Available technology is consistent with ultra-light vehicle designs from automobiles to trucks and buses. Heavy truck loads are not viable for 100% direct solar power, but low (e.g., parcel and postal freight) and empty truck loadings are viable. For applications like parcel delivery, the parked time could allow charging to compensate for travel speeds when the full benefit of aerodynamic lift is not realized.
An overarching trend dominates the potential of this technology: specifically, in view of L/D not being a strong function of velocity, maximum load for optimal efficiency (i.e., including reduced rolling losses and reduced pressure drag) increases with increasing velocity. From an application perspective, hybrid electric-solar lightweight vehicles and automobiles could have applications at 30 m/s (and faster), delivery trucks at 40 m/s, heavier trucking at 50 m/s, and high-speed railcars at 40 m/s.
The amount of rolling losses, along with any drivetrain losses coupled to wheel operation, increase with the fraction of load supported by wheel suspension. In many applications, at least some weight on wheels, and related rolling losses, may be preferable to enable wheel-based traction. Traction includes propulsion and navigation. It is entirely possible to provide solely aerial navigation and propulsion, such as with ailerons.
When a GEFT is designed for aerial propulsion and navigation, performance can achieve speeds in excess of 300 mph as readily seen on maglev train benchmarks. To first approximation, neither vehicle weight nor navigational forces are expressed on railway tracks, and so, these higher speeds are attainable on tracks otherwise built without tolerance for highspeed trains.
The best energy efficiencies and lowest transit times are for non-stop transit at the cruising speeds matched with the vehicle load (i.e., vehicle at maximum specific load). A published scheduling method leaves cars parked on the single line which take lead positions in train sequences (“Sequences”) of individual railcars that travel on the track []. This method even works when all stations have stops on a single track without bypass tracks. With switching between tracks, increased flexibility can approach the high flexibility of highway networks with higher railway speed capabilities. This method can evolve toward further-improved service with multimodal vehicles.
The L/D efficiencies of 3D prototypes in Table 5 are low compared to 2D results, which indicates that the lower performance is due to the lateral dissipation of pressures, primarily on upper surfaces. Solutions to this will include either increasing the magnitude of lift pressure on the upper surface or designing the vehicle to achieve induced thrust on the upper surface. Example solutions include additional ducted fans to impact lateral flows or distributed propulsion along the length of the vehicle []. Solutions for this problem should be an area of future research.
Additional advantages of the GEFT configuration include the following:
- Higher speeds with smaller engines due to lower power needs.
- Higher speeds as possible with aerodynamic navigation versus wheel traction navigation.
- Multimodality with eventual seamless transfer between highway, railway, and waterway corridors leading to lower cost infrastructure, increased sustainability, and lower transit times.
- Reduced energy consumption via express operations of single railcars, which eliminate the heavy bogies necessary to accommodate braking and acceleration forces for train railcars, with less stop-and-go travel patterns.
- An evolutionary path leading to some of the most extreme performances such as transit in low pressure tunnels [,,,].
- Reduced carbon footprint through increased use and sustainability with solar sheets.
- Evolutionary possibilities with initial applications based on incremental changes to existing vehicle designs to use current highway and railway infrastructure.
The wheels on GEFT vehicles provide two purposes: (a) suspension at lower velocities, and (b) enhanced control of lower-cavity fence clearances when in ground effect flight. The fences and flaps block and control undesirable dissipation of favorable lift forces while maintaining higher ground clearances for the majority of the vehicle’s lower surface. The use of fences in this application has been previously demonstrated by the racecar industry, albeit in racecar applications the fences reduce dissipation of lower pressures rather than higher pressures [,].
Within the transit sector, GEFT has applications that can displace most of contemporary trucking, busing, railways, and air transit while saving money, time, and environmental impact for these services. An additional application is with tow-assist trailers.
For contemporary trailers, solar panels would have little impact toward reducing the energy needed to tow the trailer. However, as the resistance decreases, the impact of solar panels on the trailer increases and the range of vehicles compatible with trailers increases.
Tow-assist trailers take trailer load reduction to a new level by transferring most of the thrust to electric motors on the trailer itself. The goal is to allow most cars to pull trailers over a range of sizes: the car provides guidance and the trailer provides its own propulsion assistance. A barrier to tow-assist trailers reaching their potential is the need for an independent power source for the trailer. GEFT designs with trailer-based solar reduce the pull load on trailers which leverages the ability of solar power to provide the needed power difference. In this approach, most car owners could have access to low-cost hauling options, and lower-cost trucking would include small pickup-size vehicles pulling heavier loads.
Significant reductions in energy consumption and related carbon emissions are summarized into broad applications as summarized by Table 6.
Table 6.
Summary of applications and targeted benefits for electric vehicles.
The range of applications summarized by Table 6 covers essentially all ground and surface water modes of transit except for vehicles which cannot easily conform to GEFT configurations, such as motorcycles. Compatible scheduling methods may provide non-stop service at high cruising speeds to substantially reduce transit times and remove common pain points of transit, such as airport security lines and wait times.
High-performance applications inherently achieve lower transit times for replacing short-haul flights. For much of the long-haul airliner market, advanced high-performance applications will provide lower transit times without the pain points of air transit.
Substantial carbon reductions are particularly difficult to achieve in transit covered by trucking and airliners. GEFT technology is able exceed or match key performance metrics for both trucking and air transit. Therefore, a path emerges where the carbon footprint for transit can be substantially eliminated as part of electrification with highly efficient vehicles.
Validation of the performance for the range of applications of Table 6 can be a daunting task. Validation is pursued by comparison to either the large number of alternatives or various levels of experimental validation—both have a range of operating conditions. However, for all the applications, validation at the fundamental level converges to a few metrics. On overcoming BLS, any aft surface having a surface pitch greater than about 30° will experience boundary layer separation at higher velocities (e.g., greater than 50 mph); GEFT technology is able to overcome BLS at these higher pitches consistent with common passenger and payload compartments []. For displacing rolling and drivetrain losses with aerodynamic suspension, no alternatives are on the market for highway and railway operation. Reducing the higher pressures of the leading-edge stagnation point is an extended benefit of a well-designed lower cavity for generating aerodynamic suspension and no alternative approaches to achieve this are on the horizon.
Preliminary studies on control technology indicate that wheels coupled to fences provide pitch control, with the wheels stopping nose-down pitch perturbations and increasing ground clearance at the forward section in nose-up pitch perturbations leading to passive adjustment. Likewise, the vertical movement of isolated fence sections can control yaw. An identified preferred method for braking control is the reduction of lift while engaging regenerative wheel-based braking. Yaw control (i.e., steering) can be provided by traditional steering wheels for the “Broadly Applicable” applications of Table 6 where wheels retain at least about 30% of suspension weight. Advanced yaw control will likely be in the form of rudders integrated into the fences. Unlike WIG ground-effect aircrafts, which have tail-based vertical and horizontal stabilizers, the goal of control and stability features for GEFT is low-profile actuators and servos built into the fences and flap of the lower cavity.
For railcars, including trains, catenary-system-based power lines are able to provide electric power, i.e., an electric transit option. GEFT technology reduces energy needs to allow batteries and vehicle-based solar to better service routes without catenary systems. Additional benefits for trains systems are single railcars at efficiencies on par with train units, rubber tires toward multimodal vehicles with reduced total transit times and improved accessibility, and reductions in railway tracks stresses through aerodynamic navigation.
GEFT technology enables multimodal transit to bridge the gap between trains, trucks, and buses with powerful synergies of railroad tracks providing corridors, scheduling, and isolation for travel exceeding 40 m/s. The highway component of multimodality expands routing options and can eliminate transition times from highway access to highspeed rail corridors.
Previously identified work used a minimum in turbulence from the CFD experiments to determine an optimal source setting based on the design and free stream velocity []. The assumption of those studies is that minimum over turbulence approximates a minimum in lost work and corresponds to a near-optimum source setting. The value in these studies is that a single optimal L/D can be assigned to a given wing section design for comparison to other wing sections.
Also, parallel studies are evaluating free stream velocities of 20 and 30 m/s as well as the 40 m/s of this work. Since 40 m/s is about 90 mph, the lower velocity studies are of interest to evaluate GEFT benefits within typical highway traffic conditions. At 20 and 30 m/s, a minimum in total turbulence still typically exists as the source power increases, which is considered a verification of GEFT benefits at typical highway cruising conditions. However, due to the impact of GEFT technology, GPS vehicle tracking, and advanced control techniques, it is a good and reasonable evolution of highway transit to include speeds in excess of 90 mph. Railway tracks commonly support cruising at speeds in excess of 90 mph.
Optimal flap setting is a complex, results-driven parameter rather than a fixed component. In theory, no flap is needed with lower-surface pitch and the trailing-edge stagnation regions providing a source of higher pressures in the cavity. However, replacement of continuously localized surface pitches within the cavity and a flap generating an overall “effective” lower-surface cavity pitch has advantages related to control and minimization of the impact of incidental contact with the ground.
5. Conclusions
The use of ground effect to provide lift on vehicles provides a high impact advantage by substantially eliminating mechanical and rolling losses of vehicles, which can reduce energy consumption by more than half. Even greater levels of reduction are possible when the vehicles’ leading-edge stagnation point is lowered to reduce pressure drag acting on the vehicle’s front and boundary layer separation is mitigated. These advances transform what is possible with electric vehicles, and parallel advances in photovoltaic cell sheets can transform what is possible with vehicle-based solar-power.
A cascade of synergies is enabled by this technology. On the GEFT vehicles, lower aerodynamic drags are possible alongside the substantial elimination of rolling losses. The ground effect flight also enables railcars to travel in ground effect flight without destructive interference. This mode of operation allows dynamically forming trains to be used on railways that can reduce travel times and costs by 50% to 80%. Coupling the efficiencies attained and flexibility of the vehicle, multimodal operations arise as ideal applications for vehicles of this design.
Viable combinations for applications range from automobiles to semi-trucks and high-speed railcars. The path of this technology evolution includes exhausting CFD studies to the point of diminishing returns before initiating prototype studies for rapid and efficient research, development, and production.
Supplementary Materials
The following supporting information can be downloaded at: https://www.mdpi.com/article/10.3390/wevj16110628/s1, Sample 2D simulation files are included in the supplement. Postprocessing data and processing are included for 2D and 3D results.
Author Contributions
Conceptualization, G.S. and A.B.S.; methodology, A.B.S. and G.S.; software, A.B.S.; validation, A.B.S. and G.S.; formal analysis, G.S.; investigation, A.B.S.; data curation, A.B.S.; writing—original draft preparation, G.S. and A.B.S.; writing—review and editing, A.B.S. and G.S.; supervision, G.S. All authors have read and agreed to the published version of the manuscript.
Funding
This research received no external funding.
Data Availability Statement
The original contributions presented in this study are included in the article/Supplementary Material. Further inquiries can be directed to the corresponding author.
Conflicts of Interest
Adam B. Suppes and Galen Suppes are affiliated with HS-Drone, LLC. The authors declare that the research was conducted in the absence of any commercial or financial relationships that could be construed as a potential conflicts of interest.
Abbreviations and Nomenclature
The following abbreviations are used in this manuscript:
| A | Planform Area |
| 2D | 2-Dimensional |
| 3D | 3-Dimensional |
| BLS | Boundary Layer Separation |
| CD,P | Pressure component of Coefficient of Drag |
| CD,V | Viscous component of Coefficient of Drag |
| GEFT | Ground Effect Flight Transit |
| k | Turbulent Kinetic Energy |
| L/D | Lift-to-Drag Ratio |
| Power | Power in units of Watts. |
| TR | Thickness Ratio |
| U | Velocity |
| wA | Area weight (m/s2 × kg/m2) |
| ρA | Area density (kg/m2) |
| MDPI | Multidisciplinary Digital Publishing Institute |
| DOAJ | Directory of open access journals |
The following nomenclature is used in this manuscript:
| Airfoil | A 2D cross-section of a flying vehicle |
| Aspect Ratio | The ratio of the vehicle or platform width to length |
| Area Density | The mass of the vehicle divided by its planform area |
| Area Weight | The weight divided by planform area. |
| Cavity | The space between the vehicle and ground bounded by a trailing flap, side fences, and the vehicle nose |
| Chord | The linear distance from the nose of the vehicle to the tail. |
| CD-Pressure | A planform area normalized sum of normal forces acting on the vehicle in direction of travel |
| CD-Viscous | A planform area normalized sum of tangential forces acting on the vehicle in direction of travel |
| CD-Frontal Projection | The drag forces normalized by the forward projection of the vehicle. |
| Clearance Ratio | The Distance between the ground and the lowest part of the vehicle (i.e., fence, flap, or undercarriage) divided by the height of the vehicle no including fences and flaps. |
| Digital Prototype | 3-Dimensional model which may be used in 3D simulations. |
| Drag | Forces acting on a vehicle in the opposite direction to travel |
| Ground Effect | Lift forces acting on a vehicle which are impacted by the vehicle’s proximity to the ground |
| Drive-train losses | The reduction in engine power as it travels through system components to wheels |
| Induced Thrust | Force in the direction of travel which results from increased pressures on the underside positive pitch surfaces or less than atmospheric pressure on the upper surface of low pitch surfaces. |
| Jet Wash | A stream of high speed air trailing the vehicle. |
| Lift | Forces acting on a vehicle in the opposite direction to gravity |
| Kinematic Pressure | Equal to static pressure divide by density. Pressures graphed in pressure contours are reported as Kinematic pressure (Ps/ρ) [m2/s2] |
| Lower Pressure, Higher Pressure | Typically identifies a pressure lower than or higher than surrounding ambient pressures. Actual values will depend on travel velocity. The maximum magnitude of pressure deviations from ambient pressure is about air’s relative dynamic pressure (high pressures, 1kPa for 40 m/s). |
| L/D | The ratio of forces acting on the vehicle in the vertical, or lift, direction divided by the forces acting on the vehicle in the direction of travel. |
| Planform Area | The area of the vehicle projected onto the ground. |
| Power | Energy requirements to sustain flight for a vehicle or trailing platform, units are in W. |
| Resistance | Sources of energy loss between thrust and propulsion. Examples may include drag and friction. |
| Slat | A flap-like control surface that extends forward and downward from a wing or lifting body. |
| Source | Simplified computational model of a propulsor which increases the velocity of the air traveling through the region as a function of [m4/s2] |
| Stagnation Point | The point at which streamlines diverge to either travel above or beneath the airfoil or converge at the trailing edge of the vehicle. |
| Thickness Ratio | A ratio of the height of the main body of the vehicle divided by its length. |
| Thrust | Forces acting on a vehicle in the direction of travel. |
| Trailing Flap | A flap at the exit of the lower surface cavity which moderates pressures within the cavity. |
| Turbulence | Loss of energy through non-laminar air flow |
| Upper-Surface-trailing-section Ducted Fan | A fan located on or just before the trailing-section of the GEFT vehicle. It draws air in from above the upper surface and expels the air over the trailing taper. |
| Vehicle-based Solar Power | Power attained from solar sheet or panels directly adhered to a vehicle. This power may provide direct energy for engines/motors or connect to an electric system to supplement battery power in a hybrid electric vehicle. |
References
- Suppes, A.; Suppes, G. Review and Evolution of Ground Effect Flight Transit Vehicles (GEFT). Camb. Open Engag. 2025. PrePrint. [Google Scholar] [CrossRef]
- Transportation Research Board and National Research Council. Reducing the Fuel Consumption and Greenhouse Gas Emissions of Medium- and Heavy-Duty Vehicles, Phase Two: First Report; The National Academies Press: Washington, DC, USA, 2014; pp. 67–72. [Google Scholar] [CrossRef]
- Farghaly, M.B.; Sarhan, H.H.; Abdelghany, E.S. Aerodynamic Performance Enhancement of a Heavy Trucks using Experimental and Computational Investigation. CFD Lett. 2023, 15, 73–94. [Google Scholar] [CrossRef]
- Deng, Y.; Lu, K.; Liu, T.; Wang, X.; Shen, H.; Gong, J. Numerical Simulation of Aerodynamic Characteristics of Electric Vehicles with Battery Packs Mounted on Chassis. World Electr. Veh. J. 2023, 14, 216. [Google Scholar] [CrossRef]
- Mruzek, M.; Gajdáč, I.; Kučera, Ľ.; Barta, D. Analysis of Parameters Influencing Electric Vehicle Range. Procedia Eng. 2016, 134, 165–174. [Google Scholar] [CrossRef]
- Gao, W.; Deng, Z.; He, Y. A comparative study of tail air-deflector designs on aerodynamic drag reduction of medium-duty trucks. Int. J. Veh. Perform. 2022, 8, 316–333. [Google Scholar] [CrossRef]
- Fázecas, L.; Avedissian, N.; Ghiro, R.; Sonoda, T. Improving Fuel Efficiency for Trucks Through CFD Simulation. SAE Int. 2021. [Google Scholar] [CrossRef]
- Paul, J.C.; Johnson, R.W.; Yates, R.G. Application of CFD to Rail Car and Locomotive Aerodynamics. In The Aerodynamics of Heavy Vehicles II: Trucks, Buses, and Trains; Browand, F., McCallen, R., Ross, J., Eds.; Springer: Berlin/Heidelberg, Germany, 2009; pp. 259–297. [Google Scholar]
- Liu, W.; Ji, Z.; Guo, D.; Yang, G.; Zhou, G.; Ren, K. Effects of bottom deflectors on aerodynamic drag reduction of a high-speed train. Acta Mech. Sin. 2022, 38, 321251. [Google Scholar] [CrossRef]
- Han, S.; Wang, Y.; Zhang, M.; Chen, J.; Zhang, J. An adaptive drag reduction method for high-speed trains across variable Reynolds numbers. Phys. Fluids 2025, 37, 085208. [Google Scholar] [CrossRef]
- Suppes, A.; Suppes, G.; Al-Moameri, H. Overcoming Boundary-Layer Separation with Distributed Propulsion. Sustain. Eng. Technol. Sci. 2025, 1, 71–89. [Google Scholar] [CrossRef]
- Abbas, Z.; Mansoor, M.; Habib, M.; Mehmood, Z. Review: MEMS sensors for flow separation detection. Microsyst. Technol. 2023, 29, 1253–1280. [Google Scholar] [CrossRef]
- Simpson, R.L. Turbulent Boundary-Layer Separation. Ann. Rev. Fluid Mech. 1989, 21, 205–232. [Google Scholar] [CrossRef]
- Rodriguez, I.; Lehmkuhl, O.; Borrell, R. Effects of the Actuation on the Boundary Layer of an Airfoil at Reynolds Number Re = 60,000. Flow Turbul. Combust. 2020, 105, 607–626. [Google Scholar] [CrossRef]
- Kumar, K.; Kumar, P.; Singh, S.K. Passive Control of Boundary Layer Separation Using Single and Multiple Slats on the airfoil. Int. J. Fluid Mech. Res. 2021, 48, 17–28. [Google Scholar] [CrossRef]
- Jarmon, C.M.; Lang, A.W.; Hubner, J. Wind Tunnel Investigations of Sharkskin Inspired Passive Flow Control Devices. In Proceedings of the AIAA SciTech 2024 Forum, Orlando, FL, USA, 8–12 January 2024; p. 1938. [Google Scholar] [CrossRef]
- Cross, A. Experimental Investigations into Shark Skin Inspired Active Flow Control Mechanisms. 2022. Available online: https://www.proquest.com/openview/9e436ff604c8239aed2a2df17af8ca27/1?pq-origsite=gscholar&cbl=18750&diss=y (accessed on 11 December 2024).
- Huang, W.; Wu, H.; Yang, Y.; Yan, L.; Li, S. Recent advances in the shock wave/boundary layer interaction and its control in internal and external flows. Acta Astronaut. 2020, 174, 103–122. [Google Scholar] [CrossRef]
- Atik, H.; Kim, C.-Y.; Dommelen, L.L.V.; Walker, J.D.A. Boundary-layer separation control on a thin airfoil using local suction. J. Fluid Mech. 2005, 535, 415–443. [Google Scholar] [CrossRef]
- Wang, A.; Lai, H. Control of separated flow at low Reynolds number around NACA0012 airfoil by boundary layer suction. J. Phys. Conf. Ser. 2024, 2707, 012122. [Google Scholar] [CrossRef]
- National Research Council. Review of Aerodynamic Drag Reduction Devices for Heavy Trucks and Buses. Transport Canada, Government of Canada Website. 2018. Available online: https://tc.canada.ca/en/programs/non-funding-programs/ecotechnology-vehicles-program/review-aerodynamic-drag-reduction-devices-heavy-trucks-buses (accessed on 3 December 2024).
- Van Greunen, R.; Oosthuizen, C. Data Driven Methods for Finding Coefficients of Aerodynamic Drag and Rolling Resistance of Electric Vehicles. World Electr. Veh. J. 2023, 14, 134. [Google Scholar] [CrossRef]
- Hassaan, M.; Dewivedi, S.; Khurshid, H. Computational Study on the Diffuser of Formula Racing Car; Springer Nature: Singapore, 2023; pp. 481–496. [Google Scholar] [CrossRef]
- Suppes, A.; Suppes, G.; Lubguban, A.; Al-Maomeri, H. An Airfoil Science Including Causality. Sustain. Eng. Technol. Sci. 2025, 1, 12–31. [Google Scholar] [CrossRef]
- Suppes, A.B.; Suppes, G.J. Aerodynamics: A Different Perspective with Profound Implications. Front. Mech. Eng. Fluid Mech. 2025, 11, 1616607. [Google Scholar] [CrossRef]
- Lee, T.; Lin, G. Review of experimental investigations of wings in ground effect at low Reynolds numbers. Front. Aerosp. Eng. 2022, 1, 975158. [Google Scholar] [CrossRef]
- Klose, B.; Spedding, G.; Jacobs, G. Flow separation, instability and transition to turbulence on a cambered airfoil at Reynolds number 20,000. J. Fluid Dyn. 2025, 1009, A9. [Google Scholar] [CrossRef]
- Michna, J.; Rogowski, K. Numerical Study of the Effect of the Reynolds Number and the Turbulence Intensity on the Performance of the NACA 0018 Airfoil at the Low Reynolds Number Regime. Processes 2022, 10, 1004. [Google Scholar] [CrossRef]
- Lee, D.; Nonomura, T.; Oyama, A.; Fujii, K. Comparison of Numerical Methods Evaluating Airfoil Aerodynamic Characteristics at Low Reynolds Number. J. Aircr. 2015, 52, 296–306. [Google Scholar] [CrossRef]
- Suppes, A.; Suppes, G. Optimizing Computational Efficiency with Preliminary 2D CFD for Ground-Effect Flight Transit Vehicle Design. Adv. Aerosp. Sci. Technol. 2025. submitted. [Google Scholar]
- Traub, L.; Coffman, C. Efficient Low-Reynolds-Number Airfoils. J. Aircr. 2019, 56, 1987–2003. [Google Scholar] [CrossRef]
- Winslow, J.; Otsuka, H.; Govindarajan, B.; Chopra, I. Basic Understanding of Airfoil Characteristics at Low Reynolds Numbers (104–105). J. Aircr. 2017, 55, 1050–1061. [Google Scholar] [CrossRef]
- Wu, R.; Soutis, C.; Zhong, S.; Filippone, A. A morphing aerofoil with highly controllable aerodynamic performance. Aeronaut. J. 2016, 121, 54–72. [Google Scholar] [CrossRef]
- Suppes, A.; Suppes, G. Ground Effect Machine System. 2024. Available online: https://patentscope.wipo.int/search/en/detail.jsf?docId=WO2025147444 (accessed on 31 January 2025).
- Hu, M.; Bauer, P. Energy Analysis of Highway Electric HDV Platooning Considering Adaptive Downhill Coasting Speed. World Electr. Veh. J. 2021, 12, 180. [Google Scholar] [CrossRef]
- Abdelhamid, M.; Rhodes, K.; Christen, E.; Kok, D. Solar Panels on Electrified Vehicles: Applications and Off-Cycle CO? Credit. SAE Int. J. Altern. Powertrains 2018, 7, 311–322. [Google Scholar] [CrossRef]
- MicroLink Devices, I. Photovoltaics. Available online: https://mldevices.com/photovoltaics-2/ (accessed on 12 September 2025).
- Smil, V. Power Density Primer: Understanding the Spatial Dimension of the Unfolding Transition to Renewable Electricity Generation (Part IV—New Renewables Electricity Generation). 2010. Available online: https://www.masterresource.org/smil-vaclav/smil-density-new-renewables-iv/ (accessed on 16 March 2023).
- Newport Corporation. Introduction to Solar Radiation. Available online: https://www.newport.com/t/introduction-to-solar-radiation (accessed on 12 September 2025).
- Cavus, M.; Allahham, A. Spatio-Temporal Attention-Based Deep Learning for Smart Grid Demand Prediction. Electronics 2025, 14, 2514. [Google Scholar] [CrossRef]
- Fard, M.T.; He, J.; Huang, H.; Cao, Y. Aircraft Distributed Electric Propulsion Technologies—A Review. IEEE Trans. Transp. Electrif. 2022, 8, 4067–4090. [Google Scholar] [CrossRef]
- Suppes, A.; Suppes, G. Low-Risk High-Reward Transition to Low Pressure Tunnel Transit. Eng. Technol. J. 2025, 10, 4994–5004. [Google Scholar] [CrossRef]
- Machaj, K.; Malecha, Z.; Wrzecioniarz, P. Numerical and Analytical Study of a Battery Powered Vehicle Moving in a Vacuum Tunnel. World Electr. Veh. J. 2020, 11, 26. [Google Scholar] [CrossRef]
- Shibani, W.M.; Zulkafli, M.F.; Basuno, B. Methods of Transport Technologies: A Review On Using Tube/Tunnel Systems. IOP Conf. Ser. Mater. Sci. Eng. 2016, 160, 012042. [Google Scholar] [CrossRef]
- Zhou, S. Dynamics of Rail Transit Tunnel Systems; Academic Press: Cambridge, MA, USA, 2019; pp. 15–40. ISBN 9780128183830. [Google Scholar] [CrossRef]
- Zhang, Z.; Wang, Q.; Song, S.; Zhang, C.; Ren, L.; Zhang, Y. Joint Research on Aerodynamic Characteristics and Handling Stability of Racing Car under Different Body Attitudes. Energies 2022, 15, 393. [Google Scholar] [CrossRef]
- Ma, X.; Li, J.; Zhao, J.; Chen, J. Aerodynamic characteristics of the race car in pitch and roll attitude. Int. J. Numer. Methods Heat Fluid Flow 2024, 35, 330–357. [Google Scholar] [CrossRef]
Disclaimer/Publisher’s Note: The statements, opinions and data contained in all publications are solely those of the individual author(s) and contributor(s) and not of MDPI and/or the editor(s). MDPI and/or the editor(s) disclaim responsibility for any injury to people or property resulting from any ideas, methods, instructions or products referred to in the content. |
© 2025 by the authors. Published by MDPI on behalf of the World Electric Vehicle Association. Licensee MDPI, Basel, Switzerland. This article is an open access article distributed under the terms and conditions of the Creative Commons Attribution (CC BY) license (https://creativecommons.org/licenses/by/4.0/).