Abstract
Uncontrolled charging of large electric bus fleets can strain constrained power grids, such as South Africa’s. This study develops and evaluates a demand-oriented charging strategy for Golden Arrow Bus Services using a Mixed-Integer Linear Programming (MILP) model calibrated with real operating data. The model schedules fleet charging over an off-peak window to minimise the highest total demand charge (Notified Maximum Demand, NMD) while respecting arrival state of charge (SOC), Time-of-Use (ToU) tariffs, and ensuring all vehicles are fully charged before dispatch. Compared to the unmanaged baseline, the optimised schedules reduce the peak demand charge by 17%, keeping total depot demand below 1 MW and ensuring full fleet readiness. The strategy also eliminates all energy consumption during expensive peak-tariff windows in both winter and summer. Further analysis shows that raising the minimum arrival SOC reduces the required optimum per-bus demand approximately linearly (≈1.5 kW per +5% SOC), whereas widening the SOC arrival range increases demand variability. This MILP framework demonstrates that exploiting SOC diversity and modest charge capacity capping can significantly lower peak demand and operational costs, offering a validated model for depots in other capacity-constrained power systems.
1. Introduction
In the global effort to reduce greenhouse gas emissions, the transportation sector is undergoing a transformative shift towards cleaner and more sustainable technologies. Electric bus fleets have emerged as a key component of this shift and are widely recognised as a promising alternative to traditional diesel-powered public transport [,]. Electric buses are three to four times more energy efficient than their diesel counterparts and produce no tailpipe emissions, making them a lower-emission alternative for public transport systems [,].
Public transportation plays a pivotal role in reducing global emissions by offering high passenger capacity with low per-capita carbon output []. Urban areas, which account for more than 60% of global energy use and 70% of carbon emissions, make the decarbonisation of urban regions critical []. In South Africa, public transportation is essential, with around 35% of the working population relying on buses, minibus taxis, or trains for their daily commute [].
Air quality is an equally pressing concern alongside carbon reduction. This is particularly true in African cities, where a combination of rapid urbanisation, high reliance on diesel vehicles, and weak emissions regulation creates hazardous levels of pollution. According to the World Health Organization, ambient (outdoor) air pollution caused approximately 4.2 million premature deaths globally in 2019. When combined with indoor air pollution the total rises to about 6.7 million annually []. In Africa specifically, the State of Global Air report estimates that around 1.1 million premature deaths in 2019 were attributable to air pollution-related diseases, with ambient PM2.5 alone accounting for nearly 400,000 of these deaths []. In cities such as Lagos, Nairobi, and Johannesburg, air pollution levels frequently exceed WHO guidelines by factors of two to five, exposing millions of residents to elevated risks of respiratory and cardiovascular disease. The electrification of public transport fleets, therefore, offers not only climate benefits but also the potential to deliver immediate public health gains by improving air quality and reducing the disease burden attributable to fossil fuel combustion.
From a sub-Saharan Africa perspective, the continent is particularly well positioned to benefit from the electric vehicle transition []. The region’s abundant sunshine means that, despite an existing dependence on fossil fuels for electricity generation, electricity is expected to become cleaner over time. Moreover, Africa holds approximately 30% of the world’s key minerals used in battery manufacturing, including cobalt, lithium, and manganese, offering both an environmental and economic opportunity if harnessed effectively [,].
At the same time, integrating large fleets of electric buses into the existing power grid infrastructure presents substantial operational challenges, particularly in developing countries with constrained electricity networks. South Africa’s electricity grid is both capacity-constrained and structurally fragile, posing significant risks for large-scale electrification of bus fleets. The national utility Eskom’s nominal installed generation capacity of around 48 GW is frequently reduced to about 24 GW due to unplanned breakdowns and routine maintenance, which has entrenched load shedding as a daily reality. Beyond generation shortfalls, the distribution infrastructure is ageing and increasingly prone to faults, with many substations and feeder lines operating near or beyond their design life. This dual challenge of insufficient generation and deteriorating transmission and distribution assets undermines confidence in the grid’s ability to accommodate new, high-intensity loads such as electric bus charging depots. Without targeted reinforcement and modernisation of both supply capacity and local grid infrastructure, attempts to electrify public transport risk exacerbating existing instability and further entrenching supply insecurity [].
While the technical and infrastructural challenges outlined above are particularly acute in South Africa, they resonate with broader concerns faced by cities worldwide. Bus depots are increasingly recognised as critical nodes in the transition to electrified public transport: they represent both a logistical bottleneck and a concentrated electrical load that can rival medium-sized industrial facilities. Insights from the South African context are therefore globally significant for two reasons. First, they provide a stress test scenario: if electrification strategies can be shown to work within a fragile, capacity-constrained grid, they can inform solutions in other emerging economies with similar vulnerabilities. Second, they add empirical evidence from a region that is underrepresented in the global literature on electric bus deployment, thereby complementing the more extensively studied cases in Europe, China, and North America. By situating depot-level charging challenges within this dual local and global frame, the study makes two contributions. It aids South Africa’s decarbonisation goals and also expands to the international knowledge base on how to scale electric bus fleets in diverse and resource-constrained contexts.
The challenge of integrating electric bus fleets is a global one, prompting a significant body of research into optimal fleet scheduling and depot charging, particularly in North America, Europe, and Asia. In Europe, for instance, exact mathematical models have been developed to tackle the electric bus scheduling problem, incorporating real-world constraints such as limited driving range and the availability of both depot and opportunity charging stations []. Research from advanced markets like South Korea has moved towards robust optimisation, using MILP to manage the uncertainties of energy consumption and grid-load requests, even incorporating Vehicle-to-Grid (V2G) capabilities to enhance depot profitability and grid stability []. While much of the literature focuses on buses in developed economies, related challenges are being studied across different vehicle classes in emerging contexts. For example, the grid impact of electrifying motorcycle taxis in Kenya highlights the critical trade-offs between environmental benefits and infrastructure requirements, showing how charging strategies like battery swapping can mitigate peak demand []. Despite this progress, most studies assume a relatively stable and reliable power supply. This leaves a critical gap in understanding depot optimisation within severely capacity-constrained and fragile grid environments, such as the one in South Africa, which this paper aims to address.
To ensure operational efficiency and sustainability, the development of effective charging strategies is not only beneficial but essential. This study focuses on the development of an optimised bus charging strategy in an electric energy-constrained and frugal environment. By leveraging off-peak grid electricity, the proposed approach aims to reduce peak demand and electricity cost while alleviating stress on the grid. A Mixed-Integer Linear Programming (MILP) model is developed to schedule the charging of buses to minimise demand charges while ensuring that all buses are fully charged and ready for deployment at the start of their daily operations.
Contribution
Amidst South Africa’s ongoing electricity crisis and the relatively slow uptake of electric vehicles, this study provides one of the first detailed assessments of the grid impact of an electric bus fleet in the country. Focusing on Cape Town’s pioneering deployment of electric buses and their associated charging infrastructure, the work develops and validates a dedicated simulator to capture the interaction between bus operations and the local power grid.
The simulation framework accounts for key determinants of charging demand, including the distributions of bus arrival times at depots and the states of charge of their batteries upon arrival. Using these inputs, the study evaluates the comparative impacts of unmanaged versus managed charging under different charging rates and within the constraints of a time-of-use tariff structure.
Finally, a Mixed-Integer Linear Programming (MILP) model is employed to determine the optimal charging schedules that flatten the load profile while ensuring that all buses are sufficiently charged for deployment. This integrated approach demonstrates how advanced optimisation can reduce grid stress, lower operational costs, and maintain reliable mobility. Beyond its immediate relevance to South Africa, the study offers a transferable framework for electric bus integration in other contexts. The framework applies both to resource-constrained grids in developing economies and to mature power systems that must manage new peak loads. In doing so, it expands the global evidence base on how depot-level charging strategies can be designed to support the dual objectives of operational efficiency and sustainable electrification of public transport.
Recent work on AI-based, grid-integrated PV operation shows that reinforcement learning and hybrid meta-heuristics can improve operational efficiency and sustainability by shaping plant output to grid conditions. These approaches mirror the depot problem: coordinating flexible electrical assets to reduce peak demands and align with ToU windows. Depot charging is therefore situated within a broader class of grid-aware optimisation problems, drawing on insights from AI-based PV scheduling to motivate the MILP control of depot demand []. In parallel, recent studies on depot charging optimisation report peak mitigation and tariff-aligned charging using MILP and related methods.
The specific novelty of this work lies in its methodological focus, which diverges from standard time-of-use (ToU) energy optimisation ([,]). Our MILP formulation is explicitly designed to minimise the peak depot load (kW) [], a primary objective that directly addresses the severe financial and grid-stability penalties of a Notified Maximum Demand (NMD) tariff. This model is one of the first to be empirically calibrated with operational data from a large-scale bus deployment in sub-Saharan Africa, contrasting with many simulation-based approaches []. Demonstrating a viable strategy within South Africa’s uniquely fragile power system provides a crucial “stress test” for electrification, offering a validated framework for other capacity-constrained regions.
2. Methodology
This section describes the methodology used to simulate, validate, and optimise electric bus charging at the Golden Arrow Bus Services (GABS) Arrow Gate depot in Cape Town. The approach integrates empirical operational data, statistical modelling, and a Mixed-Integer Linear Programming (MILP) optimisation framework.
Within the first eight months of 2025, GABS expanded its electric fleet from two to 60 buses, each a BYD B12 model fitted with a 230 kWh lithium iron phosphate (LFP) battery rated for up to 100 kW DC charging. At the depot, 30 chargers with two 60 kW dispensers each were installed. To mitigate the City of Cape Town’s high demand surcharges, an effective cap of 30 kW per bus was imposed once the fleet reached 30 buses. This constraint meant charging typically remained in the constant-current region, requiring just over six hours to reach full charge from 20% to 100% SOC, which aligns with the City of Cape Town’s off-peak tariff window (22:00–04:00) [].
Daily electricity usage at the depot increased sharply with the fleet’s growth, rising from 30 MWh per week with 20 buses to over 60 MWh per week with 50 buses, as shown in Figure 1. Over the same period, the distance travelled with the electric fleet increased to 44,000 km per week. These operational realities highlight both the opportunities of time-of-use optimisation and the risks of unmanaged charging, which can drive excessive peak demand penalties and exacerbate stress on South Africa’s already fragile grid.
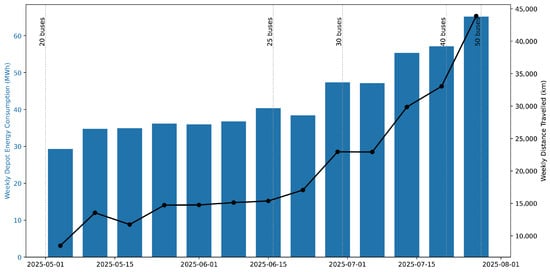
Figure 1.
Weekly bus depot energy consumption (bars, MWh) and fleet distance travelled (line, km). Vertical dotted lines indicate fleet size changes, highlighting the strong coupling between operational scale and depot electricity demand.
Fundamentally, the bus battery determines the grid load through three main factors: the timing of charging, the charging power (kW), and the energy required to recharge (SOC).
In this paper, the following charging scenarios are assessed:
- Unmanaged charging at the nominal 60 kW and reduced 30 kW;
- Managed charging at 30 kW, restricted to avoid peak tariff periods;
- Optimised charging using MILP, incorporating the impact of SOC on the optimal charging rate.
For the first two scenarios, charging power is fixed, leaving timing and SOC as the main determinants. In the unmanaged cases, buses begin charging as soon as they arrive. In the managed scenario, charging is delayed to avoid high-tariff periods.
Arrival times and SOC on arrival were monitored at the depot, and the resulting statistical distributions were used to parameterise a probabilistic model. This model, simulated using validated battery and charger representations, provided estimates of depot load profiles under different scenarios.
The unmanaged 60 kW case is compared to a more conservative unmanaged 30 kW case. The managed 30 kW scenario is then evaluated and benchmarked against observed depot load data, which validates the simulation framework. Finally, the MILP optimisation model is introduced to capture charging under realistic operational constraints.
The overall methodology, therefore, consists of three main features:
- An overview of the current charging strategy at the GABS depot;
- Formulation of the MILP optimisation model;
- A simulation framework to assess performance improvements.
2.1. Existing Charging Infrastructure and Operating Conditions
Each GABS electric bus is equipped with an onboard telematics unit that records real-time data on vehicle speed, braking, and driver behaviour. While primarily intended for fleet management, this system demonstrates the depot’s readiness for digital integration with advanced energy management in the future.
Operationally, buses typically return to the depot from 17:00 onwards and are connected to a charging dispenser upon arrival. Actual charging, however, is delayed until 22:00 to align with the City of Cape Town’s off-peak tariff window []. This delay is enforced through the dispenser’s time-of-use (ToU) logic. Each dispenser applies a maximum charging rate that keeps the bus in the constant-current stage until the battery reaches the constant-voltage phase, when power draw naturally tapers. In handling the input/output voltage, each charger uses an active front-end (PFC) to regulate the DC-link and track a constant-power command via an inner current loop. For voltage sags/swells within tolerance, the input/output current is adjusted to hold the scheduled power; the DC/DC stage maintains the CC–CV profile. If the AC voltage exceeds tolerance, the dispenser derates to a lower power setpoint.
The existing charging strategy reduces some cost by aligning with ToU windows, but it does not fully minimise demand charges. This creates an opportunity to optimise both demand charges and use of the full off-peak window while still ensuring all buses are ready for deployment the next morning.
To evaluate this opportunity, a simulation framework was developed. The evaluation consisted of two phases: (i) analysis of the current charging strategy and (ii) implementation of an improved model that incorporates a two-stage battery charging profile and optimises demand charge within the available window.
2.2. Modelling Bus Charging: Arrival Times and Depths of Discharge
The grid impact of bus charging was simulated and validated using measured depot data. Charging dispenser records were analysed to establish arrival times and initial SOC distributions. The maximum simultaneous charging reached ≈65% of the fleet (median 15%, IQR 7–26%). The derivation of parameters was a deterministic process using the entire measured depot grid load dataset and charging dispenser records from 20 June to 18 September 2025, when charging was capped at 30 kW. The depot grid load dataset, therefore, includes 90 days, with 15 min updates equating to approximately 8640 observations. The charging dispenser records include 7621 charging events over the 90-day period (approximately 85 per day).
Using the derived inputs, the simulation reproduced charging demand as buses arrived with specific SOCs and were connected to chargers, whilst capping the maximum simultaneous charging events in the system. The resulting grid load was driven primarily by the distributions of arrival times and SOC, as well as the charger power profile. Arrival times were split into daytime (08:00–16:00) and evening (16:00–24:00) categories. Figure 2 and Table 1 present the fitted distributions that parametrised the simulation model. The source code can be found on GitHub and the results from this research were generated using v1. [].
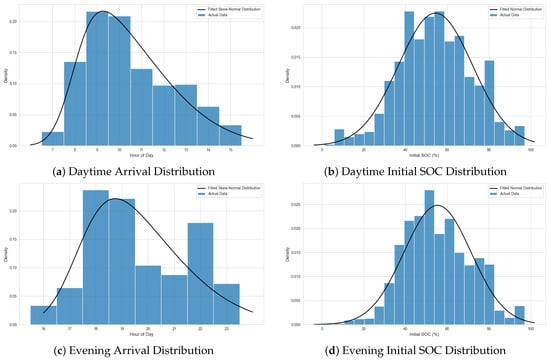
Figure 2.
Fitted probability distributions for bus arrivals and initial SOC in the daytime (08:00–16:00) and evening (16:00–24:00) windows. These distributions form the stochastic input parameters for the charging simulation.

Table 1.
Summary statistics of arrival times and SOC distributions (sample period: June–September 2025).
2.3. MILP Model Formulation
To minimise depot costs while ensuring full fleet readiness, a MILP optimisation model was developed. The objective is to reduce the maximum total demand (kW) during the off-peak charging window (22:00–04:00), thereby lowering demand charges, while ensuring all buses are fully charged by dispatch.
The MILP model incorporates the following inputs and constraints:
- Arrival State of Charge (SOC): Each bus arrives with SOC between 20% and 40%.
- Energy requirement: Based on battery capacity and SOC, the required energy to reach full charge is calculated.
- Charger assignment: Buses are assigned to charging dispensers to allow staggered load distribution.
- Maximum charging rate: Each bus is limited to a fixed upper charging rate.
- Time-of-use structure: Charging is restricted to the off-peak period under the City of Cape Town’s tariff framework.
The constraint set reflects both the City of Cape Town’s tariff structure and the physical limitations of the depot. In particular, the maximum rate corresponds to the 30 kW cap imposed at the depot to reduce demand charges while enabling overnight charging.
The optimisation problem is formulated as follows:
where (symbols and SI units):
- Binary charging decision for bus i in slot t (1 if charging, else 0).
- Charging rate assigned to the charger group of bus i [kW].
- Energy required for bus i to reach its target state of charge [kWh].
- Duration of each time slot (e.g., ) [h].
- Maximum allowable charging rate per bus [kW].
- Earliest slot at which group g is permitted to start charging.
- Bus index; B is the set of buses ().
- Time-slot index; T is the set of discrete slots.
- Charger-group index; G is the set of charger groups.
- Assumptions:
- Input-voltage robustness: Within the charger’s allowable AC-voltage tolerance, the commanded charging rate is maintained by the AFE/PFC and DC/DC control. If the input voltage leaves this band, the dispenser derates; in the model, this is represented as a reduced available setpoint for the affected slots, which the MILP reallocates under the NMD constraint.
- Standing/leakage losses: A small fixed overhead per active charger is included to capture auxiliary/idle and cable losses with a sensitivity of .
- Example (one bus):
With kWh and arrival SOC , the required energy is kWh. With kW and h, the minimum slots to full charge is .
- Note on model simplification:
This MILP formulation (binary , fixed ) is a deliberate simplification. As described in the Methodology section, the depot’s 30 kW cap is chosen to keep buses in the Constant Current (CC) phase for the vast majority of the 6-h off-peak window. The Constant Voltage (CV) taper is therefore negligible, making a fixed-rate a high-fidelity approximation for this operational context. The “optimum per-bus demand” reported in the Results section is not a direct variable, but rather the minimum feasible fixed rate () found by the solver that satisfies all energy constraints under the NMD limit.
Simulation Constraints and Setup
The simulation framework integrates realistic operational parameters and depot-level constraints derived directly from GABS operational data. This ensures that modelled behaviour closely reflects real-world operations.
All buses are assumed to arrive at the depot with SOCs between 20% and 40%, based on telematics records. Each bus has a fixed battery capacity of 230 kWh, which determines the individual charging requirement. The available charging period is 22:00–04:00, divided into twelve 30 min slots, consistent with the City of Cape Town’s off-peak tariff period. While the arrival data shows a small portion of the fleet arriving after 22:00, the current optimisation assumes all buses are available at the start of the window. Modelling the impact of these stochastic late arrivals on feasibility is noted as an area for future work. Completion of charging by 04:00 ensures that all buses are fully prepared for morning dispatch.
The simulation enforces the depot’s Notified Maximum Demand (NMD) [], which places a cap on allowable peak demand and therefore on associated demand charges. This directly shapes the distribution of charging across the fleet. In the GABS case study, the depot’s Notified Maximum Demand (NMD) is set to 1000 kW in line with the applicable tariff. The schedule enforces a hard cap so that the total depot demand charge never exceeds this value in any time slot.
Charging behaviour follows a two-stage lithium-ion profile []. Initially, charging is constant-current (CC) at the fixed limit, followed by a constant-voltage (CV) stage in which current tapers as the battery approaches full capacity. The simulation was implemented with both 30-min slot-based and 1-min resolution to capture detailed dynamics.
After each time slot, charging rates are recalculated based on updated SOC and remaining energy requirements, ensuring consistent compliance with demand limits while protecting battery health and readiness.
These assumptions are consistent with measured depot data, which showed daily electricity consumption rising from 2–3 MWh with two buses to more than 14 MWh with 60 buses, with weekly distances exceeding 40,000 km. Such proportionality between fleet size, kilometres driven, and depot energy demand confirms the need for an optimised charging strategy.
Although calibrated using South African depot data, the methodology is designed to be transferable. It can be adapted to different fleet sizes, battery chemistries, and tariff structures, making it relevant for both resource-constrained and advanced grid contexts.
3. Results
3.1. Grid Impact of Unmanaged and Managed Charging
Figure 3a shows simulated unmanaged charging at 60 kW and 30 kW for fleets of 30, 40 and 50 buses. Peaks are substantially higher for 60 kW than for 30 kW. The 60 kW case produces a pronounced morning peak near 11:00 and an evening peak near 20:00, while the 30 kW case shifts these to lower levels around 12:00 and 21:00.
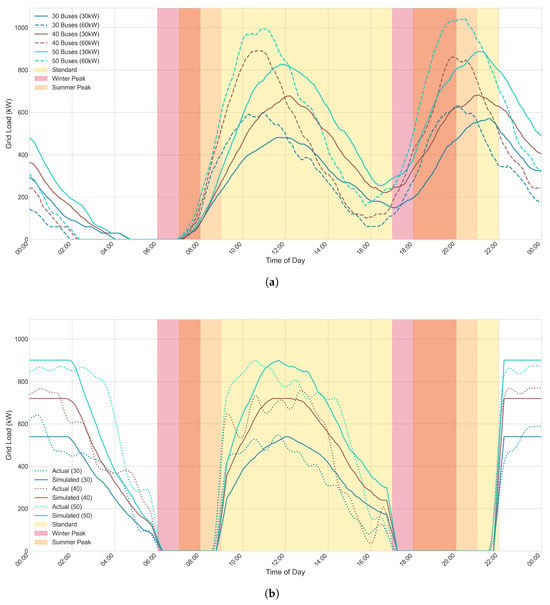
Figure 3.
Comparison of grid load for unmanaged and off-peak charging strategies across charger ratings and fleet sizes: (a) simulated unmanaged charging at 30 kW and 60 kW for fleets of 30, 40 and 50 buses; (b) managed off-peak charging at 30 kW: simulated profiles and measured depot data for different fleet sizes.
Table 2 reports daily energy delivered by strategy, fleet size and charger rating. As expected, total energy is similar across charge rates for the same fleet size. The timing differs: in unmanaged operation, winter peak usage rises from 14.2% to 15.7% at 30 kW, and to about 20.4–20.5% at 60 kW. Summer peak usage is 22.3–22.6% at 30 kW and 30.7–32.2% at 60 kW. Consequently, faster unmanaged charging increases both maximum demand and energy exposure in peak tariff windows.

Table 2.
Seasonal comparison of daily energy by strategy, fleet size and charger rating. Peak window energy is reported for winter and summer tariffs.
Figure 3b shows the managed off-peak scenario at 30 kW. The simulated profile closely matches the measured depot profile, confirming model fidelity. As summarised in Table 2, winter peak usage is eliminated under the actual manual strategy and under the simulated off-peak strategy. Summer peak usage is near zero in the measured case and exactly zero in the simulated off-peak case.
Table 3 statistically validates this fit, showing a high value (0.89), which indicates the model explains 89% of the variance in the actual data. Furthermore, the low percentage error (CV-RMSE ≈ 27–29%) and corresponding low absolute error (RMSE) confirm that the simulation adequately captures the load dynamics.

Table 3.
Error metrics: actual charging load vs. simulated off-peak 30 kW.
3.2. MILP Optimisation Results
The MILP scheduling model was evaluated under scenarios that varied the distribution of arrival SOC. For each scenario, we display scatter plots of the optimum per-bus demand and the corresponding box plots summarising the distributions.
3.2.1. Optimised Charging Schedule
To address the limitations of uncontrolled charging, the MILP model was used to schedule charging in a staged and coordinated manner. Instead of all buses charging simultaneously at their maximum power, the model selects an optimum charging rate for each bus and allocates charging across the 22:00–04:00 window, based on arrival SOC and depot demand limits.
Figure 4 shows that the controlled schedule flattens the load profile. The total demand remains below 1000 kW, avoiding demand charge penalties. Half-hour slots contain staggered bus assignments that share available capacity, which balances charger utilisation. By distributing charging in stages, the model reduces peak load and still provides sufficient energy to fully charge all buses before dispatch.
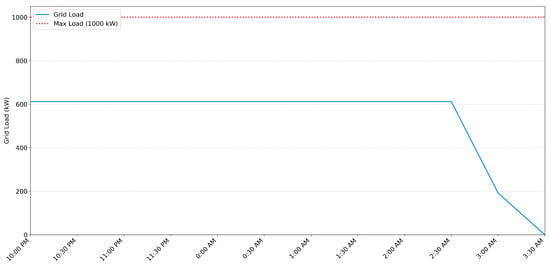
Figure 4.
Controlled charging strategy produced by the MILP model: staggered assignments across half-hour slots maintain total demand below the 1000 kW threshold while meeting readiness.
3.2.2. Widening the SOC Range and Lowering the Minimum Arrival SOC
In the first case study, the arrival SOC window widened from 30–40% to 15–55% by lowering the minimum and raising the maximum. With the narrow 30–40% window, the optimum demand per bus clustered tightly between approximately 24 and 26 kW, with a small interquartile range. With the wider 15–55% window, both the median and the spread increased: optimum values ranged from about 23 to almost 28 kW, and the interquartile range roughly doubled (Figure 5a,b). A wider and lower SOC window, therefore, increases required capacity and uncertainty. This is intuitive, since buses that arrive near the minimum SOC require more energy within the fixed charging window.
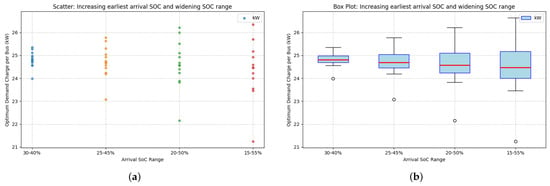
Figure 5.
Impact of widening the SOC range and lowering the minimum arrival SOC on optimum per-bus demand: (a) scatter plot showing individual optimum demand for two SOC ranges: a narrow (30–40%) and a wide (15–55%) window; (b) box plot summarizing the distributions from (a), illustrating the increased median and variance in required demand for the wider SOC window.
3.2.3. Raising the Minimum Arrival SOC at a Fixed SOC Range
In the second case, the SOC band width was fixed at 10 percentage points and shifted upward: 20–30%, 25–35%, 30–40%, and 35–45%. The optimum demand declined approximately linearly as the minimum SOC increased (Figure 6a,b). At 20–30%, the optimum was about 28.5 kW, and at 35–45% it fell to roughly 22.5 kW. Each 5 percentage point increase in minimum SOC produced about a 1.5 kW reduction in the median optimum demand. Interquartile ranges were narrow across cases, indicating predictable capacity needs when the SOC band is fixed and higher.
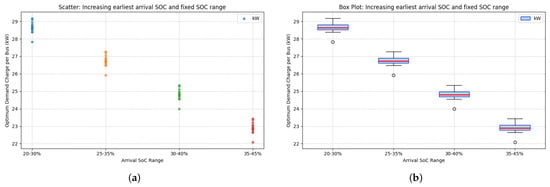
Figure 6.
Effect of raising the minimum arrival SOC, with a fixed SOC range, on optimum per-bus demand: (a) scatter plot of individual optimum demand for different 10-point SOC ranges, showing a downward trend as the minimum arrival SOC increases; (b) box plot summary of (a), quantifying the linear decrease in median optimum demand as the arrival SOC band is shifted higher.
3.2.4. Increasing the SOC Range While Fixing the Minimum Arrival SOC
In the third case, the minimum SOC was fixed at 20% and the upper bound increased from 25% to 45%. Contrary to a naive expectation of higher peaks, the average optimum demand decreased as the upper bound rose (Figure 7a,b). With arrivals at 20–25% SOC, the optimum was around 29 kW. Extending to 20–45% allowed some buses to arrive with small energy deficits, reducing the median optimum to about 24 kW. Variability increased, reflecting the diversity in arrival SOC. This suggests that diversity can be exploited to smooth peaks, since higher-SOC arrivals effectively free capacity for lower-SOC arrivals, although occasional low-SOC arrivals can still create short peaks.
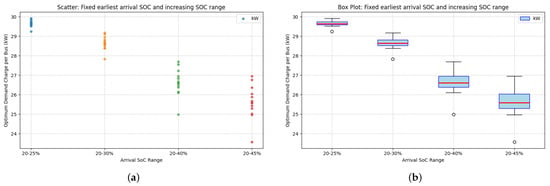
Figure 7.
Effect of increasing the SOC range while holding the minimum SOC at 20% on optimum per-bus demand: (a) scatter plot of individual optimum demand for SOC ranges with a fixed 20% minimum but increasing upper bound (from 25% to 45%); (b) box plot summary of (a), showing that a more diverse (wider) SOC range can lower the median optimum demand, though it increases variability.
3.3. Economic Analysis
The economic benefits of the optimised strategy are twofold, addressing both energy (kWh) and demand (kW) charges. First, by shifting all charging to the 22:00–04:00 window, the strategy avoids punitive peak-period energy tariffs. As shown in Table 2 for a 50-bus fleet, the unmanaged 30 kW strategy consumes 1608 kWh in the winter peak window. Based on Cape Town’s 2024/25 tariffs, moving this consumption from the peak rate (R7.7773/kWh) to the off-peak rate (R1.7365/kWh) reduces the cost of that specific energy block by approximately 77.7%, saving over R9,700 daily []. Second, and more central to the MILP optimisation, the strategy flattens the load within the off-peak window. This directly reduces the Notified Maximum Demand (NMD) charge, which is levied on the month’s highest peak power draw. As noted in Table 4, the controlled schedule achieves a 17% reduction in this peak demand charge compared to an unmanaged “charge-at-will” off-peak baseline, all while maintaining fleet readiness.

Table 4.
Comparison of Peak Demand per Actively-Charging Bus: Unmanaged 30 kW Baseline vs. MILP-Optimised Schedule.
3.4. Discussion and Practical Implications
Across the case studies, arrival SOC is a key determinant of optimum demand. Wider and lower SOC bands increase both required demand and uncertainty, while higher arrival SOCs reduce required capacity and make needs more predictable. This aligns with operational guidance: fast charging from low SOC increases demand and exposure to peak tariffs, while longer dwell times and higher starting SOCs lower required capacity. Operators should monitor arrival SOC distributions and manage extremes through scheduling and operational policies.
Battery longevity is an additional constraint. High average SOC, deep discharges, and large SOC swings accelerate lithium-ion (specifically LFP) ageing, as quantified by empirical degradation models that account for C-rate, temperature, and throughput [,]. Operating across the full 0–100% SOC window can shorten life significantly. For instance, while a full 100% depth-of-discharge (DoD) cycle might yield only 2500–3000 equivalent full cycles for an LFP battery, reducing the DoD to 50% (e.g., operating between 30 and 80%) can extend the cycle life non-linearly to 6000–8000 cycles or more, as review models of battery degradation confirm []. Best practice is to confine operation to moderate bands, for example, 20–80% or 30–80%, to preserve the state of health. This state of health can be actively monitored using tailored models applied to fleet-wide field data []. While our current MILP model prioritises short-term energy and demand costs, these ageing factors could be incorporated as a battery degradation cost term in the objective function, enabling a more holistic optimisation of the total cost of ownership.
4. Conclusions
This study applied a Mixed-Integer Linear Programming (MILP) model to optimise depot charging for an electric bus fleet. The baseline analysis showed that uncontrolled, simultaneous charging created excessive demand that risked exceeding the demand charge limit. In contrast, the optimised staged strategy distributed charging across the off-peak window, maintained demand charges within acceptable limits, and ensured full readiness before dispatch. The controlled strategy achieved a 17% reduction in demand charge relative to the unmanaged baseline.
The results highlight three key implications for operators and utilities. First, controlled charging reduces exposure to peak tariffs and aligns load with off-peak windows, thereby lowering operational costs. Second, arrival state-of-charge (SOC) policies strongly influence charging requirements. Avoiding very low arrival SOC and limiting SOC spread make capacity needs more predictable and reduce the optimum demand requirement. Third, depot planning must integrate charger sizing, assignment, and Notified Maximum Demand (NMD) constraints, since coordination at the depot level is essential for stable grid integration.
Although the analysis is calibrated to South African conditions, the lessons are globally relevant. Many regions face tariff-based demand charges, limited substation capacity, or rapid fleet growth. The proposed framework can be readily adapted to different battery chemistries, charger ratings, and tariff structures without loss of generality. The MILP framework is inherently scalable; for larger fleets, the model size increases linearly with the number of buses (B) and time slots (T), remaining computationally tractable for typical depot sizes. For multi-depot operations, the model can be extended to a coordinated system or applied independently at each site. It adapts to local grid constraints (e.g., different NMD limits) and regional ToU tariffs simply by updating the model’s constraint parameters.
Future work should extend the model in three directions: (i) integrating on-site solar photovoltaics and stationary battery storage to reduce grid imports during sensitive hours; (ii) incorporating uncertainty explicitly (e.g., stochastic arrivals and SOCs) to ensure schedules remain feasible under variability; (iii) including battery ageing modelling in the optimisation objective to balance short-term tariff savings with long-term asset health; (iv) performing a full out-of-sample predictive validation with additional error metrics (such as NMBE or MAPE) to assess its forecasting capabilities; and (v) Policy Implementation: these extensions would enhance operational resilience and provide scalable pathways for electrification of bus fleets in both constrained and mature power systems.
By showing feasibility under South Africa’s severe grid constraints, the study provides confidence that similar optimisation frameworks can be applied internationally.
Author Contributions
Conceptualization, P.G.-K., H.S. and M.J.B.; methodology, P.G.-K., H.S. and M.J.B.; software, P.G.-K. and H.S.; validation, P.G.-K., H.S. and M.J.B.; formal analysis, P.G.-K., H.S. and M.J.B.; investigation, P.G.-K., H.S. and M.J.B.; resources, M.J.B.; data curation, P.G.-K. and H.S.; writing–-original draft preparation, P.G.-K.; writing–-review and editing, H.S. and M.J.B.; visualization, P.G.-K., H.S. and M.J.B.; supervision, M.J.B.; project administration, M.J.B.; funding acquisition, M.J.B. All authors have read and agreed to the published version of the manuscript.
Funding
This research received funding from the Western Cape Government Motorised Transport Department.
Data Availability Statement
The raw data supporting the conclusions of this article will be made available by the authors on request.
Acknowledgments
The data used for this research were provided by Golden Arrow Bus Services. The authors take full responsibility for the content of this publication.
Conflicts of Interest
The authors declare no conflicts of interest.
Abbreviations & Nomenclature
| Symbol | Description | Unit |
| Abbreviations | ||
| GABS | Golden Arrow Bus Services | - |
| BYD | Build Your Dreams | - |
| LFP | Lithium Iron Phosphate | - |
| DC | Direct Current | - |
| CC | Constant Current | - |
| CV | Constant Voltage | - |
| SOC | State of Charge | - |
| ToU | Time-of-Use | - |
| NMD | Notified Maximum Demand | - |
| MILP | Mixed-Integer Linear Programming | - |
| Sets and indices | ||
| B | Set of buses (index i) | – |
| T | Set of discrete time slots (index t) | – |
| G | Set of charger groups/banks (index g) | – |
| Group assignment of bus i | – | |
| n | Number of buses | – |
| Parameters | ||
| Energy required for bus i to reach target SOC | kWh | |
| Maximum charging rate per bus | kW | |
| Charging rate of group g () | kW | |
| Slot duration (e.g., 0.5) | h | |
| Earliest slot for group g to start | – | |
| Decision variable | ||
| 1 if bus i charges in slot t, else 0 | – | |
| Objective variable | ||
| Peak aggregate charging power (objective) | kW | |
References
- Martinez, S.S.; Miller, J.; Li, X.; Brown, T. Electrification of Transit Buses in the United States Reduces Greenhouse Gas Emissions. Environ. Sci. Technol. 2024, 58, 1234–1246. [Google Scholar] [CrossRef] [PubMed]
- Islam, A.; Lownes, N. When to go electric? A parallel bus fleet replacement study. Transp. Res. Part D Transp. Environ. 2019, 72, 299–311. [Google Scholar] [CrossRef]
- Heide, L.; Guo, S.; Göhlich, D. From Simulation to Implementation: A Systems Model for Electric Bus Fleet Deployment in Metropolitan Areas. World Electr. Veh. J. 2025, 16, 378. [Google Scholar] [CrossRef]
- International Energy Agency. Share of Renewable Electricity Generation by Technology, 2000–2030. 2024. Available online: https://www.iea.org/data-and-statistics/charts/share-of-renewable-electricity-generation-by-technology-2000-2030 (accessed on 12 July 2025).
- United Nations Environment Programme. Cities and Climate Change. Available online: https://www.unep.org/explore-topics/resource-efficiency/what-we-do/cities-and-climate-change (accessed on 12 July 2025).
- Statistics South Africa. The National Household Travel Survey in South Africa (NHTS): South Africans Take 45 Million Trips, Mostly by Foot. 2021. Available online: https://www.statssa.gov.za/?p=14063 (accessed on 12 July 2025).
- World Health Organization. Ambient (Outdoor) Air Quality and Health. 2021. Available online: https://www.who.int/news-room/fact-sheets/detail/ambient-(outdoor)-air-quality-and-health (accessed on 23 September 2025).
- Health Effects Institute. State of Global Air: A Special Report on Air Quality and Health in Africa; Technical Report; Health Effects Institute: Boston, MA, USA, 2022. [Google Scholar]
- Ayetor, G.; Mbonigaba, I.; Sunnu, A.K.; Nyantekyi-Kwakye, B. Impact of replacing ICE bus fleet with electric bus fleet in Africa: A lifetime assessment. Energy 2021, 221, 119852. [Google Scholar] [CrossRef]
- Ecofin Agency. Electric Vehicles: Africa Poised to Benefit from Projected Growth in Sales Over Next Decade. Available online: https://www.ecofinagency.com/mining/3101-46388-electric-vehicles-africa-poised-to-benefit-from-projected-growth-in-sales-over-next-decade (accessed on 12 July 2025).
- Boafo, J. The race for critical minerals in Africa: A blessing or another resource curse? Resour. Policy 2024, 93, 105046. [Google Scholar] [CrossRef]
- Booysen, M.J.; Abraham, C.J.; Rix, A.J.; Giliomee, J.H. Electrification of minibus taxis in the shadow of load shedding and energy scarcity. S. Afr. J. Sci. 2022, 118, 1–5. [Google Scholar] [CrossRef] [PubMed]
- Janovec, M.; Koháni, M. Exact approach to the electric bus fleet scheduling. Transp. Res. Procedia 2019, 40, 1365–1370. [Google Scholar] [CrossRef]
- Kang, M.; Lee, B.; Lee, Y. A Robust Optimization Approach for E-Bus Charging and Discharging Scheduling with Vehicle-to-Grid Integration. Mathematics 2025, 13, 1380. [Google Scholar] [CrossRef]
- Stratford, H.; Booysen, M.J. The Environmental and Grid Impact of Boda Boda Electrification in Nairobi, Kenya. World Electr. Veh. J. 2025, 16, 427. [Google Scholar] [CrossRef]
- Zayed, M.E.; Rehman, S.; Al Garni, H.Z.; AlOmari, F.; Irshad, K.; Mohandes, M.A.; Alzahrani, A.S.; Kotb, K.M. Artificial Intelligence-Based Optimization of a Giga-Scale Bifacial Photovoltaic Power Plant Using Partitioned Random Vector Reinforcement Learning and Eurasian-Lynx Optimization. Process Saf. Environ. Prot. 2025, 203, 107972. [Google Scholar] [CrossRef]
- He, J.; Yan, N.; Zhang, J.; Yu, Y.; Wang, T. Battery Electric Buses Charging Schedule Optimization Considering Time-of-Use Electricity Price. J. Intell. Connect. Veh. 2022, 5, 138–145. [Google Scholar] [CrossRef]
- Dabčević, Z.; Deur, J. Interactive Optimization of Electric Bus Scheduling and Overnight Charging. Energies 2025, 18, 4440. [Google Scholar] [CrossRef]
- Jahic, A.; Eskander, M.; Schulz, D. Charging Schedule for Load Peak Minimization on Large-Scale Electric Bus Depots. Appl. Sci. 2019, 9, 1748. [Google Scholar] [CrossRef]
- City of Cape Town. Electricity Consumptive Tariffs 2024/25; Technical Report; City of Cape Town: Cape Town, South Africa, 2024. [Google Scholar]
- Stratford, H. bus_simulations: Simulation Code for Electric Bus Depot Charging. 2025. Available online: https://github.com/HallyStrats/bus_simulations (accessed on 26 October 2025).
- Kristiansen, T.E.; Nordgård-Hansen, E.; Hoff, K.A. Electric Vehicles: Battery Capacity, Charger Power, Access to Charging and the Impacts on Distribution Networks. Available online: https://www.researchgate.net/publication/341262399_Electric_vehicles_Battery_capacity_charger_power_access_to_charging_and_the_impacts_on_distribution_networks (accessed on 26 October 2025).
- Wang, J.; Liu, P.; Hicks-Garner, J.; Sherman, E.; Soukiazian, S.; Verbrugge, M.; Tataria, H.; Musser, J.; Finamore, P. Cycle-life model for graphite-LiFePO4 cells. J. Power Sources 2011, 196, 3942–3948. [Google Scholar] [CrossRef]
- Pelletier, S.; Jabali, O.; Laporte, G.; Veneroni, M. Battery degradation and behaviour for electric vehicles: Review and numerical analyses of several models. Transp. Res. Part B Methodol. 2017, 103, 158–187. [Google Scholar] [CrossRef]
- Lehmann, T.; Weiß, F. Lithium-Ion Battery Aging Analysis of an Electric Vehicle Fleet Using a Tailored Neural Network Structure. Appl. Sci. 2023, 13, 4448. [Google Scholar] [CrossRef]
Disclaimer/Publisher’s Note: The statements, opinions and data contained in all publications are solely those of the individual author(s) and contributor(s) and not of MDPI and/or the editor(s). MDPI and/or the editor(s) disclaim responsibility for any injury to people or property resulting from any ideas, methods, instructions or products referred to in the content. |
© 2025 by the authors. Published by MDPI on behalf of the World Electric Vehicle Association. Licensee MDPI, Basel, Switzerland. This article is an open access article distributed under the terms and conditions of the Creative Commons Attribution (CC BY) license (https://creativecommons.org/licenses/by/4.0/).