Abstract
With the rapid growth of new energy vehicles (NEVs), the number of NEV-related traffic accidents has risen sharply. To address the challenge of low accuracy in real-time risk assessment caused by the coupling of multi-source heterogeneous data, this paper proposes a real-time risk prediction method for NEV operations based on multi-source feature fusion. First, considering issues such as signal loss and bias in NEV operation data and accident records, a fused accident operation dataset is constructed through data matching, imputation, and Kalman smoothing. Then, this study analyzes the influence of external factors (e.g., weather, road type, and lighting) and internal factors (e.g., speed, acceleration, and driving duration) on accident risk and develops a normalized representation method for NEV accident risk features. Based on the coupling of internal and external parameters, a real-time accident risk prediction model is established based on the XGBoost algorithm, enabling accurate prediction of NEV accidents. Vehicle data tests show that the proposed method achieves an average accident risk prediction accuracy of 69.60%, outperforming the traditional Analytic Hierarchy Process and Support Vector Machine models. Finally, application effect demonstrates that the method reduces the NEV accident rate to 0.83%, effectively assisting traffic management departments in identifying and warning high-risk vehicles, thereby improving road traffic safety.
1. Introduction
New energy vehicles (NEVs) are increasingly adopted worldwide due to their advantages in energy efficiency, environmental sustainability, and economic feasibility. However, with NEVs’ rapid diffusion, accidents involving NEVs also show a clear increasing trend []. Notably, although drivers of NEVs generally exhibit milder driving behavior, their rate of full-responsibility accidents remains about 4% higher than that of conventional fuel vehicles []. This is mainly because NEVs differ fundamentally from traditional vehicles in system architecture and energy sources. Analytical frameworks and conclusions on operational risk factors established for conventional vehicles [,] are not fully applicable to NEVs. For example, unique battery layout and weight distribution significantly alter crash dynamics, while NEV-specific factors such as battery thermal runaway risk, battery performance degradation, and electronic control system stability introduce new operational risks. Therefore, there is an urgent need for accident risk prediction methods for NEVs []. At present, researchers worldwide conduct valuable studies on traffic accident risk prediction, mainly focusing on accident influencing factor analysis and accident risk forecasting.
The analysis of accident influencing factors mainly relies on vehicle accident data to extract variables strongly associated with accident risk, such as driver characteristics [,] and environmental features [,]. Mantouka et al. [] collects vehicle acceleration and distracted driving data with mobile phone sensors to identify distracted driving behaviors affecting safety through a two-level K-means clustering method. Eboli et al. [] and Theofilatos et al. [] apply a Logit model and find that vehicle type, speeding, and traffic flow influence crash severity. Alhaek et al. [] proposes a deep learning-based method for traffic accident prediction, which extracts spatial features and patterns from high-dimensional data using convolutional neural networks (CNN), and captures temporal dependencies among multiple factors using bidirectional long short-term memory networks (BiLSTM). Azhar et al. [] identifies collision type, driver error, number of vehicles involved, driver age, lighting conditions, and heavy vehicle type as key predictors of accident severity in heavy vehicle crashes. However, these studies mainly focus on the coupling relationship between accident factors and accident risk, while they do not establish quantitative methods to characterize the risk features of each factor.
Accident risk prediction uses algorithms such as machine learning [] and neural networks [,] to model the coupling between accident influencing factors and accident risk. Hossain et al. [] applies random forest and classification regression trees to predict highway accidents and finds significant differences in risk factors across segments. Li et al. [] develops an end-to-end LSTM model for urban roads and highways that accurately identifies high-risk driving at highway sections and intersections. Arciniegas et al. [] incorporates driver data, vehicle information, environmental conditions, and accident uncertainty to build an artificial neural network (ANN) that improves prediction performance. Huang et al. [] proposes a fuzzy XGBoost method for predicting accident severity in new energy vehicles, addressing uncertainty in accident features and enhancing severity prediction accuracy. Zhang et al. [] introduces an LSTM-based method that accounts for both static and dynamic accident factors, improving NEV accident risk prediction accuracy. However, these studies mainly focus on overall accident risk across vehicle groups in specific areas, without fully addressing the operational risk of individual NEVs.
To address the above challenge, this paper proposes a real-time operational risk prediction method for new energy vehicles based on multi-source feature parameter fusion. First, multi-source accident datasets are constructed through preprocessing methods such as data matching, data imputation, and Kalman smoothing. Then, the effects of external factors (e.g., weather, road type, lighting conditions) and internal factors (e.g., speed, acceleration, driving duration) on accident risk are analyzed to establish a normalized representation method for NEV accident risk feature parameters. Moreover, considering the coupling of internal and external features, an XGBoost-based risk prediction model is developed to achieve accurate accident prediction for NEVs. The main contributions of this study are as follows:
- A normalized representation method for NEV accident risk feature parameters is proposed, which innovatively parameterizes the core influencing factors of NEV accidents through theoretical analysis.
- A real-time risk prediction method for NEVs based on multi-source feature parameter fusion is developed. This method combines vehicle operation data with accident statistics to achieve accurate prediction of individual vehicle accident risk.
- The proposed algorithm is tested through field deployment on a highway management platform. The results show that vehicles responding to alert calls had a lower accident rate compared to those that either did not respond or did not receive alert calls, validating the effectiveness of the proposed algorithm in real-world deployment.
2. Accident Risk Factor Analysis Methods
2.1. Experimental Dataset
To analyze the factors influencing accident risk of new energy vehicles, this study first extracts over three million NEV highway driving records from Province A, China, in 2023, based on the NEV monitoring platform. The data mainly include vehicle ID, timestamps of uploaded driving information, geographic coordinates, and sensor measurements. To improve data usability, preprocessing of NEV driving data is required. Statistical analysis of the GPS data shows that, excluding occasional transmission failures causing interruptions, each NEV records data at 1 s intervals with an upload interval of 10 s. Each upload transmits all previously unsuccessfully transmitted data, with no retransmission after three failed attempts. Therefore, GPS data are aggregated by ordering all records of a single NEV by time and grouping them into individual trips. If no new data appears within 5 s after a record, the trip is considered ended. Considering the time required for vehicle start, acceleration, operation, deceleration, and stop, trips with a duration of no more than 60 s are removed. Since some GPS data are missing due to transmission failures, the Lagrange interpolation method is used to fill the gaps, ensuring that the GPS data have a fixed sampling interval of 1 s.
Then, NEV accident records from Province A’s highways in 2023 are extracted, covering direct accident-related information (such as time, location, involved vehicles, and identified causes), as well as indirect information (such as road type and weather conditions). Finally, different data sources are matched through vehicle IDs and related attributes, yielding 30,374 NEV accident operation records.
2.2. Accident External Risk Factor Analysis
The external risk factors affecting the safe operation of new energy vehicles mainly arise from the driving environment, including weather, road type, and lighting conditions. By examining the impact mechanisms of these external factors on NEV operational risk, this study proposes a normalized representation method for external risk feature parameters.
2.2.1. Weather
The characteristics of accident weather can be obtained by correlating the time and location of the accident with the local weather information (e.g., sunny, cloudy, rainy, snowy, foggy). Rain and fog significantly reduce visibility, greatly impairing the driver’s perception of surrounding vehicles and the road environment, leading to traffic accidents due to the inability to respond appropriately in a timely manner. In addition, Rain and snow create slippery or icy road conditions, increasing braking distance and making vehicles more prone to skidding or rear-end collisions. According to the Regulations on the Implementation of the Road Traffic Safety Law of the People’s Republic of China [], when highway visibility is less than 200 m, speed limits and other emergency measures must be applied, which affect the safe operation of NEVs. When visibility is below 50 m, highway driving is prohibited, and vehicles must exit at the nearest point. Therefore, the influence of visibility is normalized as Equation (1), which is shown in Figure 1.
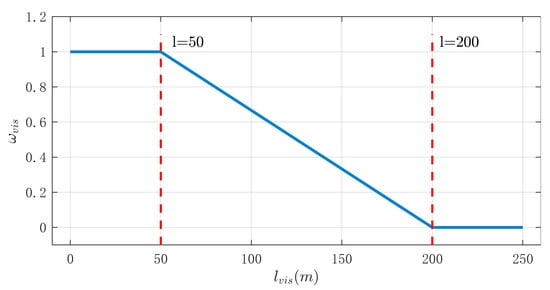
Figure 1.
Influence factors of visibility.
The degree of road surface slipperiness mainly depends on air temperature (°C), precipitation intensity (mm/h), and precipitation duration (min). According to studies on Ref. [], when the temperature is below 0 °C with rainfall or snowfall, road icing is highly likely, representing the most dangerous condition. In addition, based on historical accident data from the traffic police platform and the experience of law enforcement, it has been found that when the temperature is above 0 °C and precipitation lasts less than 10 min, the hydroplaning effect caused by the mixture of rainwater and road impurities (such as dust and mud) makes the surface extremely slippery. When the precipitation duration exceeds 10 min, impurities are washed away, and the slipperiness of the road surface decreases slightly. Therefore, the influence of road surface slipperiness is normalized as
2.2.2. Road Type
The road types on highways include mainline sections, service areas, sharp curves, bridges, interchanges, tunnels, ramps, and long downhill segments. At sharp curves, the driver’s effective line of sight is obstructed, and centrifugal force increases the risk of rollover. At tunnel entrances and exits, rapid changes in lighting can cause temporary blindness, hindering the driver’s ability to react to sudden situations. Frequent lane changes at on-ramps increase the likelihood of collisions such as sideswipes and rear-ends. Long downhill can cause brake overheating, leading to brake failure and accidents. The number of accidents occurring on each road type in 2023 is counted to calculate the number of accidents per kilometer based on the actual length of each road type, as shown in Table 1.

Table 1.
Number of accidents occurring on different road attributes in 2023.
The normalization of accident numbers per kilometer across different road types is given as Equation (3), which is shown in Figure 2.
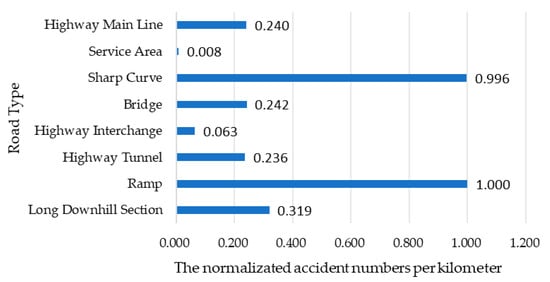
Figure 2.
Influence factors of various road types.
2.2.3. Lighting Conditions
According to the commonly used classification in traffic management, a day is divided into four periods: early morning (05:00–06:00), daytime (07:00–17:00), evening (18:00–21:00), and late night (22:00–04:00). By counting the number of accidents and the total traffic volume in each period, the accident rates per ten thousand vehicles are obtained as 0.210, 0.175, 0.181 and 0.219, respectively. These results show that daytime and evening have the highest accident rates, while early morning and late night have relatively lower rates.
According to the research in Refs. [,], early morning and evening usually have illumination levels of 10–1000 lx, where visibility is poor and risk is relatively high; daytime illumination typically ranges from 1000–50,000 lx, providing good visibility with no light-related risk; late night illumination does not exceed 10 lx, where visibility is severely limited and driving heavily depends on headlights, making the highest-risk period. Moreover, during vehicle encounters, headlight glare often exceeds 10,000 lx, causing temporary visual impairment and further risk []. Therefore, the influence of illumination intensity can be normalized as Equation (4), which is shown in Figure 3.
where (lx) denotes the illumination intensity collected by the environmental light sensor of the NEV.
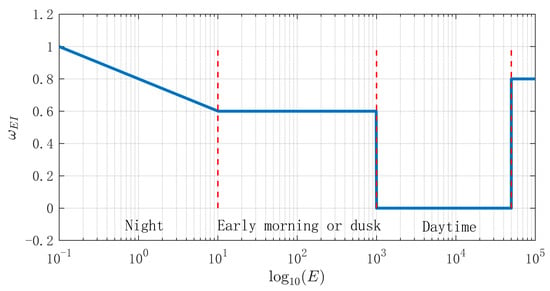
Figure 3.
Influence factors of light intensity.
In addition, rapid changes in illumination intensity also sharply increase accident risk. For example, when entering or exiting tunnels, sudden darkening or brightening may cause temporary “blindness” for drivers, making it difficult to respond accurately in emergencies []. Therefore, the influence of illumination intensity variation is normalized as Equation (5), which is also shown in Figure 4.
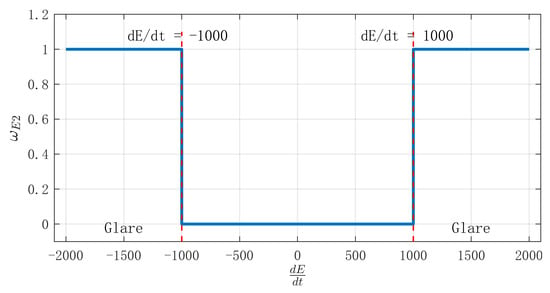
Figure 4.
Influence factors of light intensity change rate.
2.3. Accident Internal Risk Factor Analysis
In addition to external risk factors, accident risks also include internal factors arising from the driver’s habits, such as speeding, rapid acceleration and deceleration, and fatigue. Speeding increases braking distance, rapid acceleration raises the risk of skidding and loss of control, sudden deceleration increases the likelihood of rear-end collisions, and fatigue reduces attention and slows reaction times. These internal factors all contribute to higher accident risk.
2.3.1. Kalman Smoothing
Since the GPS modules equipped in NEVs usually only support positioning functions, the positioning accuracy is difficult to guarantee. Meanwhile, signals required for driving behavior analysis, such as vehicle speed, acceleration, and angular velocity, must be calculated from GPS data. Therefore, Kalman smoothing is applied to trajectories with positioning errors, using position, speed, acceleration, and acceleration variation rate as the state vector. This process estimates the vehicle’s position, speed, and acceleration at each time step, yielding a trajectory that better reflects actual vehicle operation.
The NEV is analyzed using an East–North–Up (ENU) reference frame. Considering the quantities to be estimated, the eastward motion is taken as an example, and the eastward state vector is defined as , where is the position, is the velocity, is the acceleration, and is the acceleration rate of change in the eastward direction. The corresponding motion state equations are expressed as follows:
Therefore, the motion state equations of the NEV in the eastward direction can be expressed as follows:
Here, is a 4 × 4 state transition matrix, represents the process noise of the NEV motion system, and is the corresponding noise covariance matrix with a constant . The time step equals the GPS data sampling interval, i.e., .
The observation equation of the NEV in the eastward direction is as follows:
Here, is the observation matrix, is the observation noise, and the corresponding noise covariance matrix is .
By referencing the motion state and observation equations in the eastward direction, the motion state and observation equations for the northward and upward directions are similarly defined. This allows real-time GPS data to be smoothed using the Kalman filtering method. The basic Kalman filter equations are:
Following Equation (8), the GPS observations are smoothed to continuously estimate the motion state vectors , and , thereby obtaining the real-time position, velocity, acceleration, and acceleration rate of change of the NEV during operation.
2.3.2. Velocity
There are maximum and minimum speed limits on highways. Nilsson [] shows that when vehicle speeds violate these limits, especially during illegal parking or exceeding the maximum speed by more than 50% on highways, traffic accidents are highly likely, leading to injuries, fatalities, and severe consequences. Therefore, this section compares the current speed with the maximum and minimum limits to obtain the normalized impact of speed on NEV operational risk.
The NEV speed during a single trip is calculated as , where represents the -th time step of the trip.
Based on the velocity vector , the speed of NEVs at each moment of a single trip is calculated as
the speed limit at moment is obtained by combining the real-time position vector . Based on the difference between the real-time speed and the maximum limit and minimum limit , the effect of the speed factor is normalized as Equation (13), which is shown in Figure 5.
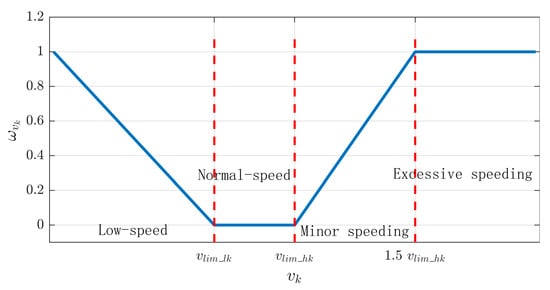
Figure 5.
Influence factors of speed.
2.3.3. Rapid Acceleration and Deceleration Characteristics
According to Ref. [], the acceleration during normal and stable driving on highways usually does not exceed 0.5 m/s2. An acceleration greater than 1 m/s2 causes discomfort and panic for passengers, while an acceleration above 2.5 m/s2 corresponds to emergency braking or acceleration under extreme conditions, which easily triggers chain reactions between vehicles and leads to traffic accidents. Therefore, the acceleration value at each moment of a single trip is calculated as:
The influence of the acceleration factor is normalized as Equation (15), which is also shown in Figure 6.
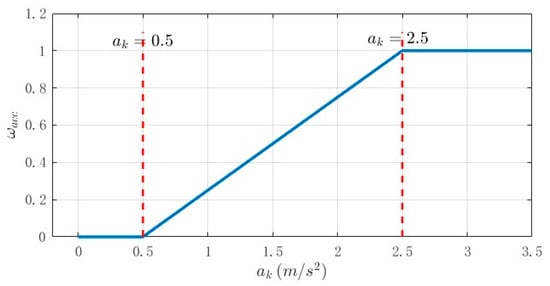
Figure 6.
Influence factors of acceleration.
2.3.4. Continuous Driving Duration
According to studies on the hazards of fatigue driving [], fatigue directly reduces the driver’s core abilities such as reaction speed, judgment, and attention. As a result, the vehicle may deviate from the lane, fail to maintain a safe distance, or show unstable speed. Therefore, it is necessary for a single driver to strictly limit the continuous driving duration. According to Article 62 of the Regulations on the Implementation of the Road Traffic Safety Law, continuous driving vehicles for more than 4 h without rest, or resting for less than 20 min, constitutes fatigue driving []. In addition, research on fatigue driving time shows that the risk begins to increase slowly from the second hour, rises rapidly after the third hour, and reaches a very high level in the fourth hour [].
Considering that mild fatigue occurs much earlier than 4 h, most drivers usually begin to show mild fatigue symptoms after 2 to 3 h of continuous driving. The influence of the continuous driving duration factor is normalized as Equation (16), which is also shown in Figure 7.
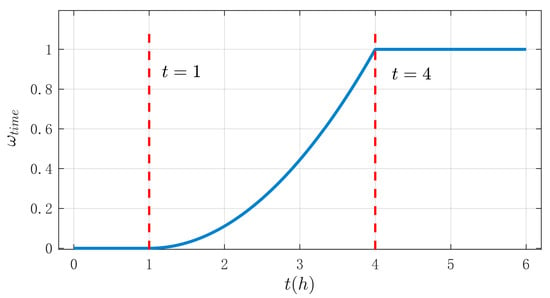
Figure 7.
Influence factors of continuous driving duration.
Here, is the continuous driving duration, and this normalization factor can effectively capture the increasing trend of driving risk with time.
3. Real-Time Accident Risk Prediction of NEVs Based on the XGBoost Algorithm
To address the challenge of low accuracy in real-time risk prediction of NEVs caused by multi-source heterogeneous data coupling, this paper proposes a real-time accident risk prediction method based on multi-source feature parameter fusion. To address the issues of signal loss and deviation in multi-source accident data, including NEV operation data and vehicle accident records, data preprocessing is performed through data matching, data imputation, and Kalman smoothing. Subsequently, external factors (such as weather, road type, and lighting conditions) and internal factors (such as speed, acceleration, and driving duration) are analyzed to reveal their impact mechanisms on accident risk. A normalization method for representing NEV accident risk feature parameters is then established. Moreover, considering the coupling characteristics of internal and external feature parameters, a real-time accident risk prediction method for NEVs is developed based on the XGBoost algorithm, enabling accurate prediction of NEV accidents. The overall framework is shown in Figure 8.
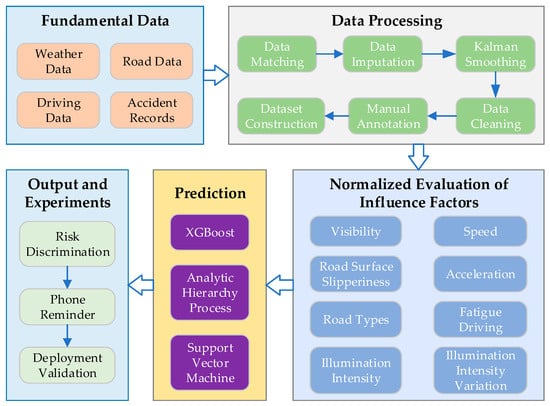
Figure 8.
Framework Diagram of the Real-time Operating Risk Prediction Method for NEVs Based on the XGBoost Algorithm.
3.1. Construction of the XGBoost Model
The XGBoost (eXtreme Gradient Boosting) model is an optimized gradient boosting decision tree (GBDT) model that constructs a strong ensemble model by integrating multiple weak learners, usually decision trees. The XGBoost model significantly reduce model complexity and enhance generalization ability through several enhancements, including second-order Taylor expansion of the loss function, adding regularization terms, enabling parallel computation, handling missing values, and preventing overfitting.
The XGBoost model takes the previously processed 3,375,000 NEV trips as the raw data. These NEV trips are manually labeled to identify dangerous driving events based on the risk factors above. Sixty percent of the positive and negative samples are used as the training set, 10% as the validation set, and the remaining 30% as the test set, forming the dataset , is the feature vector composed of the eight normalized factors and is the corresponding accident label.
The final prediction of the XGBoost model is obtained by summing the outputs of all K trees:
Here, is the prediction output of the -th tree for the -th sample, and is the total number of trees.
Considering the training loss and the added regularization term, the loss function is constructed as follows:
Here, is the loss function between the predicted value and the true label, is the regularization term of the -th tree, is the number of leaf nodes in the tree, is the weight of the -th leaf node, and and are regularization coefficients.
The XGBoost model uses a greedy iterative approach for optimization, where each round learns a new tree to correct the prediction errors of the existing model. In the -th iteration, the prediction is updated as follows:
The core of each iteration is to find the optimal tree , so that, after adding this tree, the model’s regularized loss function is minimized. The loss function in the -th iteration is:
Here, is the regularization term of the trees constructed in the first rounds, which is not optimized in this round and is therefore treated as a constant.
To solve , the loss function is expanded using a second-order Taylor approximation, yielding:
Equation (22) is transformed into a quadratic function aggregated by leaf nodes to obtain the optimal weight for each leaf node. Then, the obtained leaf weights are substituted into the loss function to compute the minimum loss corresponding to the current tree structure, which is defined as the tree structure score. Next, the optimal tree structure is determined using a greedy split algorithm. After obtaining the -th tree
, the predictions are updated, and the next iteration begins. This process continues until early stopping on the validation set is triggered or the loss function converges, at which point the iteration stops and training is complete. The parameter settings selected for the XGBoost model are shown in Table 2

Table 2.
Parameter settings of the XGBoost model.
To effectively validate the performance of the proposed algorithm, Analytic Hierarchy Process (AHP) [] and Support Vector Machine (SVM) [] are used as comparative algorithms for comparison.
AHP is a systematic method for solving multi-criteria decision-making problems. Its core strategy is to decompose a complex problem into multiple levels, such as the goal level, the criteria level, and the alternative level. By calculating the weights of elements at each level, it achieves a comprehensive evaluation of the research object. AHP effectively integrates subjective preferences with objective factors in decision-making and is widely applied in scheme evaluation and index weight determination.
The core principle of SVM is to find the optimal hyperplane in the feature space to improve model generalization. For nonlinear classification problems, SVM uses kernel functions to map data into a higher-dimensional space, transforming them into linearly separable problems. SVM performs well in high-dimensional data scenarios, effectively balancing model complexity and classification accuracy, and is widely applied in pattern recognition, regression analysis, and feature selection.
To provide a more comprehensive evaluation of the algorithm’s performance, this study selects accuracy, recall, precision, F1 score, and AUC as evaluation metrics. The definition of the confusion matrix is provided in Table 3. Positive samples refer to driving data segments that match accident records, as well as manually labeled abnormal driving data segments (e.g., fatigue driving,). Negative samples refer to driving data where no accidents or abnormal driving behaviors occurred.

Table 3.
Confusion Matrix Diagram.
- (1)
- Accuracy: The proportion of correctly identified positive and negative samples, as shown in Equation (23).
- (2)
- Recall: The proportion of true positive samples correctly predicted as positive, as shown in Equation (24).
- (3)
- Precision: The proportion of true positive samples among the predicted positive samples, as shown in Equation (25).
- (4)
- F1-score: A comprehensive evaluation metric that combines Recall and Precision, with a range from 0 to 1, where a higher value indicates better model classification performance, as shown in Equation (26).
- (5)
- AUC (Area Under Curve): The area under the ROC (Receiver Operating Characteristic) curve, with FPR (False Positive Rate) on the x-axis and TPR (True Positive Rate) on the y-axis. The value ranges from 0.5 to 1, with a higher value indicating better model classification performance.
The prediction results of the real-time vehicle operating risk model on the test set and those of the Analytic Hierarchy Process (AHP)-based and Support Vector Machine (SVM)-based risk prediction model are shown in Table 4.

Table 4.
Risk Prediction Results of New Energy Vehicle Operation for Test Set.
Compared with the AHP model, the XGBoost model shows a 31.29% decrease in precision, but a 39.56% increase in recall and a 0.87% increase in accuracy. In addition, the XGBoost model achieves a significant improvement in F1-score, with an increase of 0.3684 over the AHP model. Compared with the SVM model, the XGBoost model increases precision by 15.33%, Recall by 22.57%, Accuracy by 2.63%, and F1-score by 0.1889. Therefore, the XGBoost model is selected as the risk warning model for new energy vehicle operations.
Since the performance of the XGBoost model is affected by the randomness of dataset splitting, the training set, validation set, and test set are randomly partitioned multiple times. The test results from multiple random splits are then used to verify the robustness of the XGBoost model. Under 10 different random splits, the XGBoost model achieves an average precision of 69.60%, with a standard deviation of 2.21, a maximum of 72.87%, and a minimum of 66.31%. These results indicate that the XGBoost model indeed demonstrates good robustness.
3.2. Application Effect
In January 2025, the proposed model is deployed on the highway traffic management platform of Province B in China. The vehicles identified as having operational risks will receive phone reminders, requiring drivers to correct risky behaviors by immediately entering a service area for rest or by adopting regulated driving behaviors. After one month of official operation, the actual application results are summarized in Table 5. The accident rate refers to the percentage of vehicles with recorded cases in the traffic police platform that are assigned joint, primary, or full responsibility for the accident.

Table 5.
Application Effect of NEV Operation Risk Prediction Model.
As shown in Table 5, data are collected from 3,084,806 NEVs, among which 275,015 vehicles are identified as having operational risks, accounting for 8.92% of the total. Among them, 186,752 vehicles answer the reminder calls, with an accident rate of 0.83%, which reduces 64.83% compared to these with unanswered reminder calls. This result indicates that the proposed algorithm accurately identifies NEV operational risks. In addition, a comparison shows that the accident rate of vehicles answering reminder calls is close to that of vehicles without reminder calls (0.77%). Therefore, in the practical deployment test, the observed accident rate of vehicles marked by the model and responding to alert calls is comparable to that of unmarked vehicles.
4. Conclusions
To address the challenge of low accuracy in real-time risk assessment of NEVs caused by multi-source heterogeneous data coupling, this paper proposes a real-time risk prediction method based on multi-source feature parameter fusion. To address the issues of signal loss and deviation in multi-source accident data, including NEV operation data and vehicle accident records, data preprocessing is performed through data matching, data imputation, and Kalman smoothing. Then, the influencing mechanisms of external factors (e.g., weather, road type, lighting conditions) and internal factors (e.g., speed, acceleration, driving duration) on accident risk are analyzed, and a normalization method for NEV accident risk feature parameters is established. Moreover, considering the coupling characteristics of internal and external parameters, a real-time accident risk prediction method for NEVs is developed based on the XGBoost algorithm. Experimental validation with real vehicle data shows that the proposed method achieves an average accident risk prediction accuracy of 69.60%, outperforming traditional Analytic Hierarchy Process and Support Vector Machine methods. Finally, application effect demonstrates that the platform is capable of real-time identification of high-risk vehicles and establishing contact with drivers.
This study’s data collection has certain limitations, primarily due to subjective biases in data sources. The accident-related data used in the research, such as recorded traffic infrastructure information and accident responsibility determination results, may be influenced by the subjectivity of the operators. The impact of these subjective factors may ultimately cause inaccuracies in the risk factor identification of some data samples, which could affect the model’s stability. To address these limitations, future research will focus on improving traffic infrastructure information and optimizing data quality. On one hand, traffic infrastructure information will be refined (for example, including deceleration lanes and merging lanes before and after interchanges within the interchange records). On the other hand, methods such as semi-supervised learning or transfer learning will be introduced to reduce reliance on manually labeled data or accident responsibility determinations, thereby enhancing the model’s stability and reliability.
Author Contributions
Conceptualization, Y.S. and C.W.; methodology, S.H.; software, B.Z.; validation, L.P.; formal analysis, S.H.; investigation, L.P.; data curation, S.H.; writing—original draft preparation, B.Z., and Y.S.; writing—review and editing, B.Z., and Y.S.; visualization, L.P.; supervision, C.W. All authors have read and agreed to the published version of the manuscript.
Funding
This research was funded by National Key R&D Program of China, grant number 2022YFE0207800.
Data Availability Statement
The original contributions presented in this study are included in the article. Further inquiries can be directed to the corresponding author.
Conflicts of Interest
The authors declare no conflicts of interest.
References
- Zhao, S.; Cheng, P.; Schwebel, D.C.; Zhao, M.; Yang, L.; Xiao, W.; Hu, G. Characteristics of media-reported road traffic crashes related to new energy vehicles in China. J. Saf. Res. 2025, 92, 48–54. [Google Scholar] [CrossRef]
- Zhao, T.; Yurtsever, E.; Paulson, J.A.; Rizzoni, G. Formal certification methods for automated vehicle safety assessment. IEEE Trans. Intell. Veh. 2022, 8, 232–249. [Google Scholar] [CrossRef]
- Katrakazas, C.; Quddus, M.; Chen, W.H. A new integrated collision risk assessment methodology for autonomous vehicles. Accid. Anal. Prev. 2019, 127, 61–79. [Google Scholar] [CrossRef]
- Yang, K.; Wang, X.; Yu, R. A Bayesian dynamic updating approach for urban expressway real-time crash risk evaluation. Transp. Res. Part C Emerg. Technol. 2018, 96, 192–207. [Google Scholar] [CrossRef]
- Fugiglando, U.; Massaro, E.; Santi, P.; Milardo, S.; Abida, K.; Stahlmann, R.; Ratti, C. Driving behavior analysis through CAN bus data in an uncontrolled environment. IEEE Trans. Intell. Transp. Syst. 2018, 20, 737–748. [Google Scholar] [CrossRef]
- Ren, C.; Yang, M. Risk assessment of hazmat road transportation accidents before, during, and after the accident using Bayesian network. Process Saf. Environ. Prot. 2024, 190, 760–779. [Google Scholar] [CrossRef]
- Elvik, R. Risk factors as causes of accidents: Criterion of causality, logical structure of relationship to accidents and completeness of explanations. Accid. Anal. Prev. 2024, 197, 107469. [Google Scholar] [CrossRef] [PubMed]
- Medvediev, I.; Muzylyov, D.; Ivanov, V.; Montewka, J.; Trojanowska, J. Risk assessment at unsignalized intersections based on human-road-environment-vehicle system applying fuzzy logic. In Design, Simulation, Manufacturing: The Innovation Exchange; Springer Nature: Cham, Switzerland, 2024; pp. 437–448. [Google Scholar]
- Wang, X.; Su, Y.; Zheng, Z.; Xu, L. Prediction and interpretive of motor vehicle traffic crashes severity based on random forest optimized by meta-heuristic algorithm. Heliyon 2024, 10, e35595. [Google Scholar] [CrossRef] [PubMed]
- Mantouka, E.G.; Barmpounakis, E.N.; Vlahogianni, E.I. Identification of driving safety profiles from smartphone data using machine learning techniques. Saf. Sci. 2019, 119, 84–90. [Google Scholar] [CrossRef]
- Eboli, L.; Forciniti, C. The severity of traffic crashes in Italy: An explorative analysis among different driving circumstances. Sustainability 2020, 12, 856. [Google Scholar] [CrossRef]
- Theofilatos, A.; Yannis, G. Exploring crash injury severity on urban motorways by applying finite mixture models. Transp. Res. Procedia 2019, 41, 480–487. [Google Scholar] [CrossRef]
- Alhaek, F.; Liang, W.; Rajeh, T.M.; Javed, M.H.; Li, T. Learning spatial patterns and temporal dependencies for traffic accident severity prediction: A deep learning approach. Knowl.-Based Syst. 2024, 286, 111406. [Google Scholar] [CrossRef]
- Azhar, A.; Ariff, N.M.; Bakar, M.A.A.; Roslan, A. Classification of driver injury severity for accidents involving heavy vehicles with decision tree and random forest. Sustainability 2022, 14, 4101. [Google Scholar] [CrossRef]
- Praveen, R.V.S.; Raju, A.; Anjana, P.; Shibi, B. IoT and ML for Real-Time Vehicle Accident Detection Using Adaptive Random Forest. In Proceedings of the 2024 Global Conference on Communications and Information Technologies (GCCIT), Bengaluru, India, 25–26 October 2024; pp. 1–5. [Google Scholar]
- Hema, D.D.; Jaison, T.R. Efficient collision risk prediction model for autonomous vehicle using novel optimized LSTM based deep learning framework. Int. J. Intell. Transp. Syst. Res. 2024, 22, 352–362. [Google Scholar] [CrossRef]
- Xie, Z.; Ma, Y.; Zhang, Z.; Chen, S. Real-time driving risk prediction using a self-attention-based bidirectional long short-term memory network based on multi-source data. Accid. Anal. Prev. 2024, 204, 107647. [Google Scholar] [CrossRef] [PubMed]
- Hossain, M.; Muromachi, Y. Understanding crash mechanisms and selecting interventions to mitigate real-time hazards on urban expressways. Transp. Res. Rec. 2011, 2213, 53–62. [Google Scholar] [CrossRef]
- Li, H.; Yu, L. Prediction of traffic accident risk based on vehicle trajectory data. Traffic Inj. Prev. 2025, 26, 164–171. [Google Scholar] [CrossRef]
- Arciniegas-Ayala, C.; Marcillo, P.; Valdivieso Caraguay, Á.L.; Hernández-Álvarez, M. Prediction of accident risk levels in traffic accidents using deep learning and radial basis function neural networks applied to a dataset with information on driving events. Appl. Sci. 2024, 14, 6248. [Google Scholar] [CrossRef]
- Huang, S.; Yin, X.; Wang, C.; Wang, K. Research on Accident Severity Prediction of New Energy Vehicles Based on Cost-Sensitive Fuzzy XGBoost. Sustainability 2025, 17, 5408. [Google Scholar] [CrossRef]
- Zhang, X.; Huang, S.; Zhang, G.; Yin, X.; Wang, C. Risk Prediction of New Energy Vehicle Based on Dynamic-Static Feature Fusion. Front. Sustain. Cities 2025, 7, 1649853. [Google Scholar] [CrossRef]
- State Council of the People’s Republic of China. Regulations on the Implementation of the Road Traffic Safety Law of the People’s Republic of China, revised ed.; Decree No. 405; The State Council: Beijing, China, 2017. [Google Scholar]
- Mohrig, D.; Ellis, C.; Parker, G. Hydroplaning of subaqueous debris flows. Geol. Soc. Am. Bull. 1998, 110, 387–394. [Google Scholar] [CrossRef]
- Burns, A.C.; Windred, D.P.; Rutter, M.K. Day and night light exposure are associated with psychiatric disorders: An objective light study in >85,000 people. Nat. Ment. Health 2023, 1, 853–862. [Google Scholar] [CrossRef]
- Wu, S. Application and calibration method of light intensity sensor in automobile. Auto Electr. Parts 2024, 10, 36–38. [Google Scholar]
- Xu, M.; Liu, Y.; Hou, Z.; Liu, G.; Yang, S. Research on influence of glare from different road monitoring supplementary lights on driving safety. J. Saf. Sci. Technol. 2024, 20, 183–189. [Google Scholar]
- Hu, Y.; Chen, Z.; Zhang, Q.; Wen, J.; Huang, K. Drivers’ adaptation luminance changing rule when driving into tunnels. J. Chongqing Univ. 2016, 39, 98–104. [Google Scholar]
- Navon, D. The paradox of driving speed: Two adverse effects on highway accident rate. Accid. Anal. Prev. 2003, 35, 361–367. [Google Scholar] [CrossRef]
- Rafał, S.J.; Stańczyk, T.L. A Methodology for Evaluating Driving Styles in Various Road Conditions. Energies 2021, 14, 3570. [Google Scholar] [CrossRef]
- Li, D.; Liu, Q.; Yuan, W.; Liu, H. Relationship between fatigue driving and traffic accident. J. Traffic Transp. Eng. 2010, 10, 104–109. [Google Scholar]
- Williamson, A. Moderate sleep deprivation produces impairments in cognitive and motor performance equivalent to legally prescribed levels of alcohol intoxication. Occup. Environ. Med. 2000, 57, 649–655. [Google Scholar] [CrossRef]
- Zhang, Y.; Sun, G.; Zhang, W.; Pan, Z.; Zhou, W.; Du, C. Fuzzy comprehensive evalua-tion of safe operation of automobile on expressway based on the triangle membership method. Automot. Dig. 2019, 9, 51–56. [Google Scholar]
- Cicek, Z.I.E.; Ozturk, Z.K. Prediction of fatal traffic accidents using one-class SVMs: A case study in Eskisehir, Turkey. Int. J. Crashworthiness 2022, 27, 1433–1443. [Google Scholar] [CrossRef]
Disclaimer/Publisher’s Note: The statements, opinions and data contained in all publications are solely those of the individual author(s) and contributor(s) and not of MDPI and/or the editor(s). MDPI and/or the editor(s) disclaim responsibility for any injury to people or property resulting from any ideas, methods, instructions or products referred to in the content. |
© 2025 by the authors. Published by MDPI on behalf of the World Electric Vehicle Association. Licensee MDPI, Basel, Switzerland. This article is an open access article distributed under the terms and conditions of the Creative Commons Attribution (CC BY) license (https://creativecommons.org/licenses/by/4.0/).