Article

Vesicular Stomatitis Virus Elicits Early Transcriptome Response in Culicoides sonorensis Cells

1
Arthropod-Borne Animal Disease Research Unit, Agricultural Research Service, United States Department of Agriculture, Manhattan, KS 66502, USA
2
Department of Entomology, Kansas State University, Manhattan, KS 66502, USA
*
Author to whom correspondence should be addressed.
Viruses 2023, 15(10), 2108; https://doi.org/10.3390/v15102108
Submission received: 19 September 2023 / Revised: 12 October 2023 / Accepted: 13 October 2023 / Published: 18 October 2023
(This article belongs to the Special Issue Culicoides-Borne Viruses 2023)

Abstract

:
Viruses that are transmitted by arthropods, or arboviruses, have evolved to successfully navigate both the invertebrate and vertebrate hosts, including their immune systems. Biting midges transmit several arboviruses including vesicular stomatitis virus (VSV). To study the interaction between VSV and midges, we characterized the transcriptomic responses of VSV-infected and mock-infected Culicoides sonorensis cells at 1, 8, 24, and 96 h post inoculation (HPI). The transcriptomic response of VSV-infected cells at 1 HPI was significant, but by 8 HPI there were no detectable differences between the transcriptome profiles of VSV-infected and mock-infected cells. Several genes involved in immunity were upregulated (ATG2B and TRAF4) or downregulated (SMAD6 and TOLL7) in VSV-treated cells at 1 HPI. These results indicate that VSV infection in midge cells produces an early immune response that quickly wanes, giving insight into in vivo C. sonorensis VSV tolerance that may underlie their permissiveness as vectors for this virus.

1. Introduction

Vesicular stomatitis (VS) is a zoonotic disease caused by vesicular stomatitis virus (VSV, Rhabdoviridae, vesiculovirus), a single-stranded, negative-sense RNA virus that is transmitted by hematophagous insects like biting midges, black flies, and sand flies [1,2]. There are two serotypes of VSV, New Jersey (VSNJV) and Indiana (VSIV) [3,4]. VS primarily affects horses, but other livestock such as cattle, swine, sheep, goats, llamas, and alpacas can also become infected [3,4]. Clinical symptoms of VS include vesicular lesions on the mouth, naso-oral mucosa, teats, or coronary bands, loss of appetite, weight loss, and lameness [3,4,5]. These symptoms can be mistaken for those of foot-and-mouth disease (FMD). Once detected, VSV-positive premises can be placed under quarantine, which can have a major economic impact [6,7,8].
In the United States, Culicoides sonorensis biting midges (Diptera, Ceratopogonidae) are a known vector of VSV, showing non-lytic infection in all tissue types following ingestion of an infectious blood meal [9], and are able to transmit the virus efficiently to animals [10,11] and to other midges [12]. Female midges require bloodmeals for oviposition and are capable of three to four feeding/gonotrophic cycles during their lifetime [13]. Midges and other hematophagous vectors possess an innate immune system that responds to some arboviral infections. The primary immune signaling pathways in insects are the Janus kinase signal transducer and activator of transcription (JAK/STAT), Toll, immune deficiency (IMD), and RNA interference (RNAi) pathways [14,15,16,17]. Unlike other disease-transmitting arthropods, such as mosquitoes [18] and ticks [19], the molecular relationships between the C. sonorensis immune system and the pathogens it vectors are largely unknown. However, one prior study of epizootic hemorrhagic disease virus (EHDV) infection in midges demonstrated that antimicrobial peptide genes were upregulated at 36 h post ingestion of the virus in a blood meal, although it was not determined whether these effectors were aimed at the virus [20].
This study characterized the transcriptomes of VSV-infected C. sonorensis W8 cells in culture at multiple time points and hypothesized that VSV infection would suppress the midge innate immune response. Transcriptomes of VSNJV-infected and mock-infected C. sonorensis cells were deeply sequenced and differentially expressed unigenes (DEGs) were identified early in infection only, at 1 h post inoculation (HPI), while, interestingly, no DEGs were identified at or after 8 HPI. Several immune-related unigenes were downregulated (SMAD6 and TOLL7) or upregulated (ATG2B and TRAF4) with VSNJV infection. These data indicate that VSNJV infection in midge cells elicits an immune response early in infection that quickly wanes even with continued robust viral replication.

2. Materials and Methods

2.1. Cells and Virus

Culicoides sonorensis W8 cells, generated from 1-day-old embryonated eggs (USDA, ARS, Arthropod-Borne Disease Research Unit, Manhattan, KS, USA) [21], were grown at 27 °C in Schneider’s insect media (MilliporeSigma, St. Louis, MO, USA) supplemented with 0.4 g/L of sodium bicarbonate, 0.0585 g/L of L-glutamine, 0.006 g/L of reduced glutathione, 0.03 g/L of L-asparagine, 18 μL of 10 mg/L bovine insulin, and 5% fetal bovine serum (FBS) [21,22], hereafter referred to as complete media. Vero MARU cells (Middle America Research Unit, Panama) were grown at 37 °C with 5% CO2 in 199E media supplemented with 2% FBS, 100U of penicillin/streptomycin sulfate, and 0.25 μg/mL of amphotericin B. The New Jersey serotype of VSV (bovine field isolate from 1982, USDA-APHIS, Ames, IA, USA) was grown at 37 °C with 5% CO2 in porcine epithelial cells (AG08113, Coriell Institute, Camden, NJ, USA) with Eagles MEM with Earle’s salts media (Sigma, St. Louis, MO, USA) supplemented with 2% FBS and 100U of penicillin/streptomycin sulfate.

2.2. Time Course Infection of W8 Cells with VSNJV

W8 cells were seeded onto 6-well plates at 2 × 10⁷ cells per well, two plates per time point (1, 8, 24, 48, 72, 96, and 120 HPI). The broad time points were selected to capture the full breadth of viral replication kinetics. For each time point, one plate was infected with VSNJV diluted in complete media for a multiplicity of infection (MOI) of 5 while the other plate was mock-infected with complete media alone. A total of six replicates were included per time point. Once the inoculum was added, the cells were incubated at 27 °C for 1 h with a gently rocking motion every 15 min. After which the inoculum was removed and the cells were washed twice with 2 mL of complete media before 2 mL of complete media were added to the wells. At each time point, the supernatant was collected, clarified by centrifugation (1500× g, 10 min, 4 °C), and stored at −80 °C. For the initial time point, the second wash was collected at 1 HPI and frozen at −80 °C.

2.3. VSNJV Quantification

Infectious VSV was quantified via plaque assay. Vero cells were seeded in 12-well plates at 2 × 10⁶ cells per well one day prior to infection. Clarified supernatants were serially diluted 1:10 in 199E media before inoculation onto the Vero cells. After incubation at 37 °C for 1 h with occasional rocking motion, the inoculum was aspirated and replaced with an overlay of 0.6% methylcellulose in 199E media. The plates were incubated for 3 days at 37 °C then fixed with a formaldehyde and crystal violet stain. After 1 h of incubation at room temperature, the stain was removed, wells were washed with water, and the plaques were counted. Viral titer was calculated as the number of plaque-forming units (PFU) per mL.

2.4. W8 RNA Extraction, Sequencing, and QC

After the supernatants were removed, the cells were lysed with Xml Trizol and RNA was collected per the manufacturer’s instructions (Direct-zol RNA Miniprep Plus Kit; R2070). RNA was stored at −20 °C. RNA quantity and quality were assessed via QubitFlex™ (Thermo Scientific, Waltham, MA, USA) and NanoDrop 8000™ (Thermo Scientific). Messenger RNA from the extracted RNA of samples for 1, 8, 24, and 96 HPI was purified using poly-T oligo attached magnetic beads. Purified mRNA was fragmented, and first-strand cDNA was synthesized via a random hexamer and completed using second-strand synthesis. A one-step end-repair and dA-tailing method was used to create 5′-phosphorylated and 3′-dAtailed cDNA fragments enabling direct ligation of Illumina sequencing adapters. cDNA was then size-selected and amplified by polymerase chain reaction (PCR). Multiplex libraries were sequenced on the Illumina Hiseq2500 platform with at least 40 million paired-end 150BP reads per sample. Low-quality sequences were removed by trimming with fastp v0.23.2 [23] (Q = 25) and sequence quality was validated with FastQC v0.11.9 (https://www.bioinformatics.babraham.ac.uk/projects/fastqc/ (accessed on 2 May 2023).

2.5. De Novo Assembly, Reduction, and Annotation from W8 Cells

Trimmed reads from each sample were concatenated and normalized to 50× k-mer (k = 25) coverage using Trinity’s in silico read normalization. Normalized reads were then assembled using the default Trinity pipeline v2.14.0 [24]. The resulting transcriptome was reduced using the default EvidentialGene tr2aacds v2018.06.18 [25] pipeline to filter out biologically irrelevant or redundant transcripts. Kraken2 v2.1.3 [26] was used with the NCBI nucleotide database (2 May 2023) to filter out human transcripts and separate out candidate VSV transcripts using Kraken Tools v1.2 [27]. This final transcriptome assembly was annotated using the default Trinotate pipeline v3.2.2 [28], combining evidence from Pfam-a HMM [29], Swiss-Prot [30], and UniProt [31] (Accessed June 2023). Gene Ontology (GO) terms and Kyoto Encyclopedia of Genes and Genomes (KEGG) terms were extracted from the best Swiss-Prot and Pfam hits.

2.6. Differential Expression from W8 Cells

Trimmed reads were pseudo-aligned to the final reference transcriptome coding domains of the VSNJV genome (NCBI accession MK613994) using Salmon v 1.10.1 [32] and then unigene counts were generated for each sample. Unigene-level abundance, counts, and length were imported to R 4.1.3 [33] using the tximport [34] package. Samples were grouped into a single factor based on the combination of treatment and time, represented in metadata. A negative binomial model (~Trt_Time) was fit and dispersion was visualized using Deseq2 [35] (Figure S1). Wald hypothesis testing contrasted infected vs. uninfected at each time point, with a test of adjusted p-value > 0.05 [36] and Log2(Fold-Change) > 0.58.

2.7. Statistical Analysis

Differences in log-transformed viral titers over time were detected using repeated measures ANOVAs with Tukey’s multiple comparisons tests. Differences in viral unigenes per million by gene were detected with two-way ANOVAs with Fisher’s multiple comparisons tests. Correlations between viral gene order and unigenes per million were detected with Pearson correlation coefficients. Statistics were conducted using GraphPad Prism v 10.0.2 (GraphPad Software, Boston, MA, USA). The principal component analysis, heatmap, model dispersion plot, and volcano plots were all produced in R [33] with packages GGplot, pheatmap, DESeq2, DEGreport, and Enhanced Volcano.

3. Results

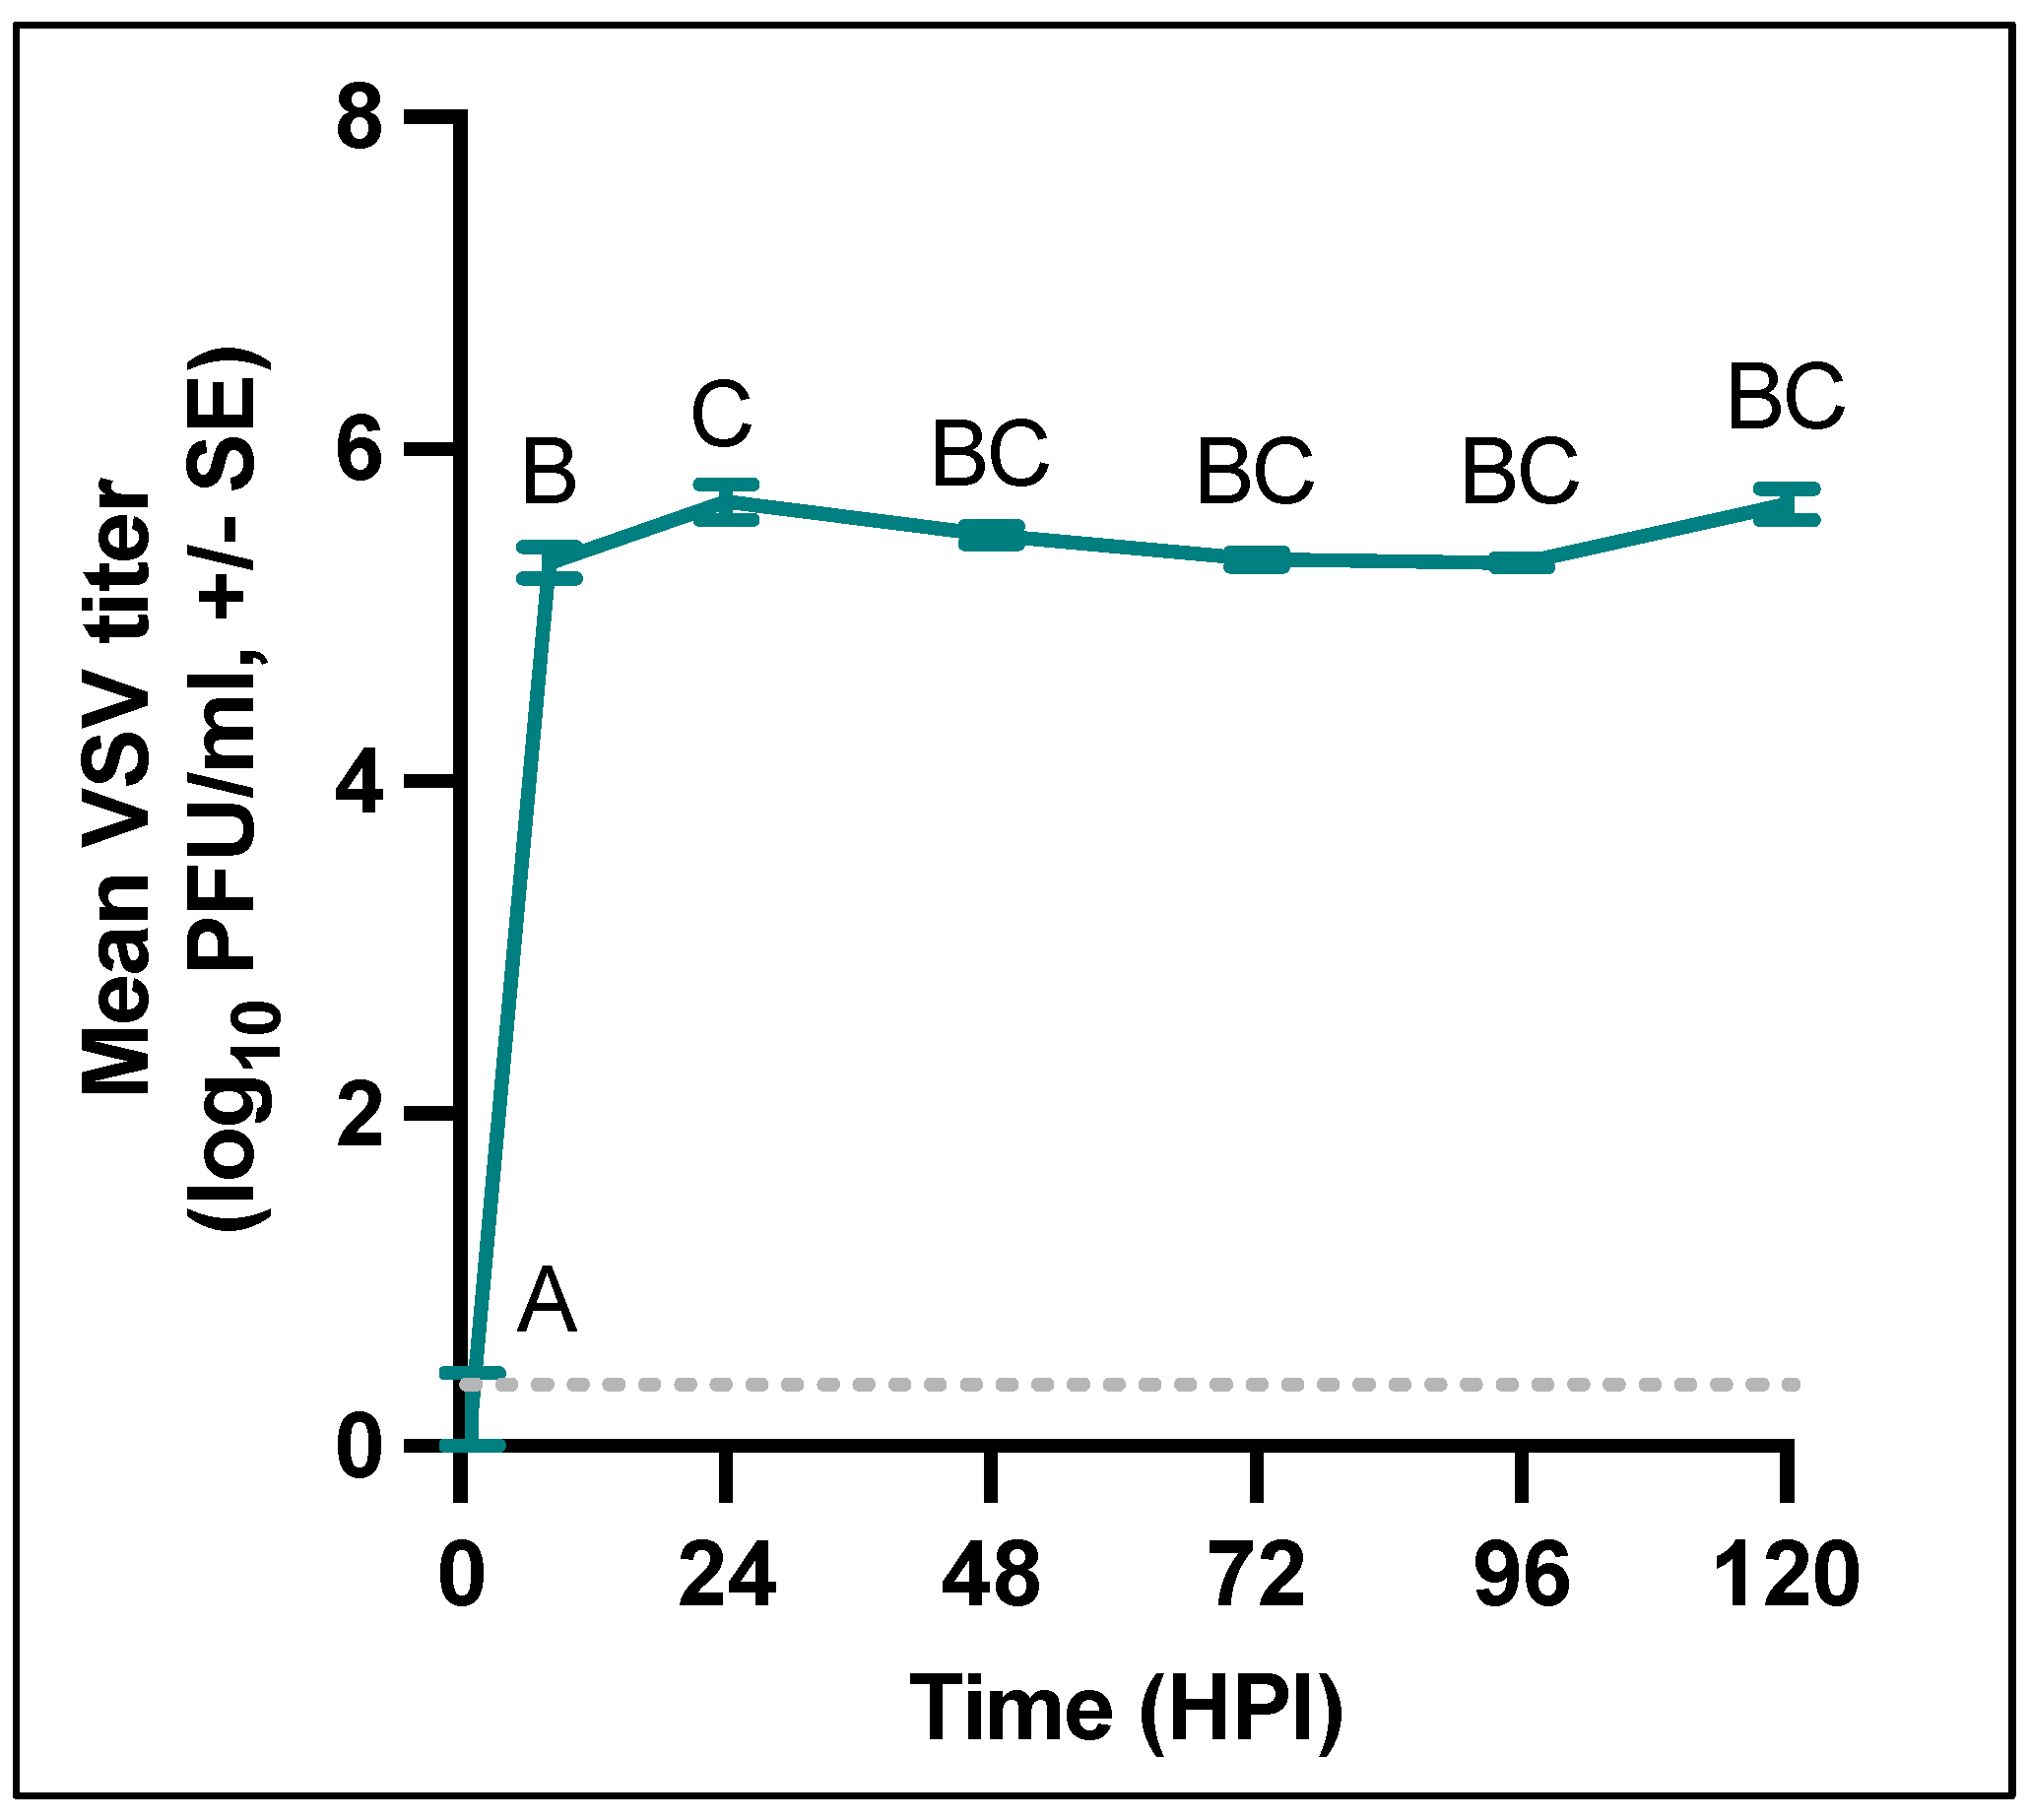
3.1. VSNJV Rapidly Produces Infectious Virus W8 Cells

To evaluate the transcriptional response of W8 C. sonorensis cells to VSNJV infection at multiple time points, we infected or mock-infected six replicates each of W8 cells and collected cell supernatant and cell lysates at 1, 8, 24, 48, 72, 96, and 120 HPI. As seen in Figure 1, the infectious virus rapidly increased and peaked between 8 and 24 HPI (5.32 Log10 PFU/mL (0.22 SE) and 5.68 Log10 PFU/mL (0.11 SE), respectively) and then remained high until the conclusion of the experiment at 120 HPI (5.67 Log10 PFU/mL, 0.09 SE). As expected, the average viral titer at 1 HPI was significantly lower than that of all other time points (Tukey’s multiple comparisons adjusted p-value < 0.0001).

3.2. W8 Transcriptome Response to VSNJV Infection

Transcriptome analyses were conducted on RNA extracted from W8 cells infected with VSNJV or mock-infected at 1, 8, 24, and 96 HPI (six replicates per condition per time point). Gene ontology (GO) annotation analyses for all unigenes and time points identified the most numerous unigenes as components of the cytoplasm (18%), nucleus (16%), cytosol (13%), plasma membrane (11%), and membrane (10%) (Figure S2A). The primary molecular functions were ATP binding (17%), metal ion binding (15%), and protein binding (10%) (Figure S2B), while the primary biological processes were proteolysis (12%) and regulation of transcription by RNA polymerase II (9%) (Figure S2C).
Unigene expression profiles from 8, 24, and 96 HPI showed no differences in clustering between VSNJV-infected and mock-infected cells (Figure 2). However, differences in unigene expression at 1 HPI between VSNJV-infected and mock-infected cells were detected by principal component analyses (PCA) (Figure 2 and Figure S3). PCA1 and PCA2 (Figure 2A) demonstrate that the samples cluster primarily by time post inoculation meaning the majority of the variance is explained by time. But two distinct clusters form with PCA1 and PCA3 (Figure 2B) by infection status at 1 HPI indicating that the unigene profiles differ by infection status only at 1 HPI. The pattern was also found using a correlation matrix (Figure 3) that demonstrates that the mock-infected and VSNJV-infected profiles from 8, 24, and 96 HPI were highly correlated by time point. The correlation of mock-infected and VSNJV-infected profiles at 1 HPI was present, but weaker compared with the later time points.
Using a cutoff of Log2FC = 0.58, or about a 1.5-fold change, 102 differentially expressed unigenes (DEGs) were identified at 1 HPI with 54 upregulated and 48 downregulated unigenes (Table S1). No DEGs were identified at 8, 24, or 96 HPI. Half (51.0%) of the downregulated unigenes were suppressed between −1.0 and −2.0 log2FC in the VSNJV-infected cells. Of the remaining unigenes, 40.8% were downregulated between −0.58 and −1.0 log2FC and only 8.2% had log2FC values less than −2. The majority of the downregulated unigenes (73.5%) were able to be assigned putative annotations via homology to entries in the Swiss-Prot database. Similar to the downregulated unigenes, half (49.1%) of the upregulated unigenes were upregulated between −1.0 and −2.0 log2FC in the VSNJV-infected cells. The remaining upregulated unigenes were 2.0 log2FC or more upregulated in 35.8% of the unigenes and between 0.58 and 1.0 log2FC in 15.1%. Half (49.1%) of the upregulated unigenes had homologous hits in the Swiss-Prot database.
At 1 HPI, several unigenes with documented or putative immune functions were differentially expressed with VSNJV infection (Table 1, Figure 4). Specifically, SMAD6, TOLL7, SAM11, and KEN1 were all downregulated −2.3 and −0.8 Log2FC or −4.8 to −1.8-fold change with VSNJV infection. Proviral unigene KI26L was also downregulated an average of −0.84 Log2FC between two unigenes. Several non-immune unigenes were downregulated with VSNJV infection, such as the circadian rhythm regulator REG5 (−2.4 LogFC) [37,38] and age regulator LIPT (average −1.35 Log2FC) [39]. Multiple immune unigenes were upregulated in response to VSNJV infection at 1 HPI, including TRAF4, PPAF3, CHIT1, FAT, and ABCA3 with Log2FC values ranging from 0.8 to 2.4 (Table 1). ATG2B, which has possible immune functions and proviral functions, was upregulated 0.83 Log2FC.

3.3. VSNJV Transcriptome from W8 Cells

Transcription of VSV proteins occurs sequentially starting with the N gene [57,58]. Furthermore, transcription is discontinuous and pauses at the regions between genes (Figure 5A), possibly as the RNA polymerase complex stutters or falls off [59]. At 1 HPI, the number of unigenes by viral gene followed the expected linear decrease across the genome with N being the most numerous unigene and L the least numerous (Figure 5B, Table S2). Indeed, gene order was negatively correlated with unigenes per million at 1 HPI (r (28) = −0.93, p = 0.02) but not at any time point after. Across all time points, the number of P unigenes per million remained steady, while after 1 HPI N decreased and G, M, and L all increased (Figure 5B). Overall, the least frequent viral unigene was L, the last and largest gene. The biggest difference in unigene amount, for all genes except P, occurred between 1 and 8 HPI.

4. Discussion

The transcriptomic profiles of C. sonorensis W8 cells in response to VSNJV infection at multiple time points indicated that unigenes in the W8 cells only were differentially expressed at 1 HPI but not at 8, 24, or 96 HPI. The activity of the VSNJV matrix protein could contribute to the time-dependent differences in C. sonorensis transcriptomic response. The matrix protein is integral for VSV replication, virion packaging, virus budding, and evasion of the host antiviral response [60]. The latter is accomplished when the matrix suppresses the transcription of host innate immune genes and blocks host mRNA transport out of the nucleus [60,61,62,63,64,65,66,67,68]. In the current study, the number of matrix unigenes is lowest at 1 HPI compared with the later time points, suggesting that transcription of the matrix specifically may suppress host transcriptomic response. In such a scenario, the lack of response to the virus during robust replication may reveal our first insights into mechanisms of viral tolerance, and therefore permissiveness and competence in C. sonorensis that warrant further exploration via in vivo studies. Additionally, the lack of differential expression at the later time points in Culicoides cells could be related to VSV’s lysogenic replication strategy in Culicoides cells that does not cause apoptosis [9].
Several of the differentially expressed W8 unigenes have known immune functions or are thought to be components of immune system pathways. The upregulation and downregulation of immune genes during viral infection have been documented with other arthropod-borne viruses, such as dengue virus [15], Zika virus [69], and epizootic hemorrhagic disease virus (EHDV) [20], illustrating how complex the relationship is between vector and virus. In the current study, TOLL-7, a receptor involved with VSV binding and transduction of antiviral immune signaling and autophagy in Drosophila [41], was downregulated almost two-fold with VSNJV infection. While VSNJV infection appears to possibly suppress autophagy via the downregulation of TOLL-7, the virus also upregulated ATG2B, a protein required for autophagy [70], at almost the same levels that TOLL-7 was suppressed. Simultaneous up- and downregulation of autophagy in arbovirus-infected insect cells has been previously reported [48]. Interestingly, SMAD6 and KEN1, negative regulators of the transforming growth factors (TGF)-β [71] and the JAK/STAT pathway [46], respectively, were both suppressed following VSNJV infection in W8 cells. By suppressing these genes during infection, W8 cells appear to be increasing their inflammatory pathways 1 HPI, but not after. TRAF4 inhibits activation of both Toll-like receptor-mediated NK-κβ and interferon, making TRAF4 the only member of the TRAF family to negatively regulate immune signaling [72,73,74]. The current data suggest that in W8 cells, VSNJV infection upregulates TRAF4 1.7-fold, which would further suppress the immune response in the infected cells. Kinesin-1 is a motor protein that viruses utilize for intracellular movement and disruption of the viral capsid during entry [43,44,75]. Das et al. [76] postulated that the VSV nucleocapsid interacts with kinesin-1 to move along microtubule tracks within the cell. The data imply that W8 cells suppress kinesein-1-mediated viral movement as the expression of KI26L decreased 1.8-fold compared with the control cells.
ABCA3 is a member of the ABC transporter gene family, which could be involved in the mosquito immune response to viral infection [55]. However, while many of the ABC genes were found to be differentially expressed in mosquitoes following dengue, yellow fever, and West Nile virus infection, ABCA3 specifically was not identified so its potential antiviral role is unknown. Expression of ABCA3 in VSNJV-infected W8 cells ranged from 2.7- to 5.4-fold higher than control cells, suggesting that unigene plays a role in VSNJV infection. Future studies on the ABC transporter gene in the context of VSV infection are warranted. In Drosophila, FAT is a receptor of the Hippo tumor-suppressor pathway that controls cellular growth, migration, and survival [53]. In the current study, VSNJV infection increased the expression of FAT 3.4-fold higher than the uninfected cells. The Hippo pathways are also known to have antibacterial functions [53], but to the best of our knowledge have not been studied in the context of viral infection. Two other unigenes, PPAF3 and GGT, were upregulated with VSNJV infection in W8 cells, and both are thought to play a role in the activation of the innate immune response [50,56]. Additionally, we identified several unigenes that have no known immune or antiviral functions that require further study for their putative role in midge–virus interactions.
The midge transcriptomic response to arboviral infection has been tested previously in vivo in female C. sonorensis who were fed EHDV and examined 36 h post ingestion [20]. There are clear caveats to be considered when comparing the results of that study to the one presented here due to the differences in the viruses and the hosts within which responses were analyzed (here, in vitro embryonic cells vs. in vivo whole midges). Nonetheless, such comparisons could provide insight into the molecular underpinnings of vector–virus interactions in the midge. Of the 49 unigenes that were downregulated 1 h after infection with VSV in this study, 36 (~74%) were also downregulated in whole midges at 36 h post ingestion/infection with EHDV. One unigene, REG5, an ortholog to dreg-5 (Drosophila rhythmically expressed gene 5) in D. melanogaster [38] was downregulated about four-fold after virus infection in both studies. This gene is controlled by, and in phase with, the circadian timekeeper gene period, and is putatively involved with a yet-defined circadian process in insects [37,38]. Interestingly, the major response to EHDV infection in whole midges at 36 h was downregulation of >1400 unigenes (~60% of total differentially expressed unigenes) and 122 were associated with neuro-sensory behaviors, including not only REG5 but also the circadian rhythm regulators clock, cycle, and numerous target genes [20]. Another intriguing finding from the current study was a lack of any detectable upregulation of antiviral defense pathways or effectors in midge cells after VSV infection. In EHDV-infected female midges, unigenes coding for antiviral defense signaling, such as two dome and four toll paralogs, were all downregulated [20]. Interestingly, in both studies, unigenes for TOLL-7 were downregulated with virus infection. In the current study, of the 53 unigenes upregulated during VSV infection at 1 h, 24 had no corresponding unigene in the EHDV reference transcriptome. Of the remaining 29 upregulated unigenes, 5 were significantly upregulated and 5 significantly downregulated in the EHDV study. We can infer that these results indicate that the positive transcriptional response to the two viruses (VSV vs. EHDV) in the two systems tested (cell line vs. whole midge) is where biological variability exists. Reciprocal studies of the transcriptome response of midge cell lines to EHDV and of whole midges to VSV certainly warrant further investigation in the future.
This study provides the first insights into the molecular–genetic interactions between VSV and cells of one of its arthropod vectors, C. sonorensis. On a transcriptional level, midge cells only showed a response to virus infection at 1 h post infection. Extrapolating these findings to understand what may occur between midges and VSV in vivo is challenging. However, this study is a first step toward understanding the Culicoides transcriptomic response to VSV infection, or potential lack thereof, that may underlie their permissiveness as vectors for this important zoonotic virus. A further understanding of the molecular interactions between VSV and midges, including protein-level expression, should be incorporated into future studies to fully elucidate the complex relationship between VSV and Culicoides biting midges.

Supplementary Materials

The following supporting information can be downloaded at: https://www.mdpi.com/article/10.3390/v15102108/s1, Figure S1: Dispersion plot of variance versus mean expression; Figure S2: Gene ontology annotations (A) cellular components, (B) Molecular function, (C) Biological processes; Figure S3: Full PCA of transcriptomic data, Table S1: Differentially expressed unigenes at 1 HPI; Table S2: VSV unigenes by viral gene at 1, 8, 24, and 96 HPI; Table S3: Full pairwise comparisons from two-way ANOVA.

Author Contributions

Conceptualization, S.L.P.S., E.J.B. and D.N.; methodology, S.L.P.S., E.J.B. and D.N.; software, E.J.B. and D.C.M.; validation, S.L.P.S., E.J.B. and D.C.M.; formal analysis, S.L.P.S. and E.J.B.; investigation, S.L.P.S., E.J.B. and D.N.; data curation, S.L.P.S., E.J.B. and D.C.M.; writing—original draft preparation, S.L.P.S., E.J.B. and D.N.; writing—review and editing, S.L.P.S., E.J.B., D.C.M. and D.N.; visualization, S.L.P.S., E.J.B. and D.C.M.; supervision, S.L.P.S.; project administration, S.L.P.S. and D.N. All authors have read and agreed to the published version of the manuscript.

Funding

This study was funded by the U.S. Department of Agriculture, Agricultural Research Service, NP-103 Animal Health National Program Project 3020-32000-019-00D and NP-104 Veterinary, Medical and Urban Entomology National Program Project 3020-32000-018-00D. E.B. is supported by USDA-ARS cooperative agreement number 3022-32000-013-005S, which also funded RNA sequencing.

Data Availability Statement

Transcriptome sequencing data are available at NCBI study accession SRP461227, within Bioproject accession: PRJNA101813. Analysis scripts are available at doi.org/10.5281/zenodo.8342149.

Acknowledgments

We would like to thank Dane Jasperson (USDA/ARS) for providing the cell lines and media. This work used resources provided by the SCINet project of the USDA ARS, ARS project number 0500-00093-001-00-D. Mention of trade names or commercial products in this publication is solely for the purpose of providing specific information and does not imply recommendation or endorsement by the U.S. Department of Agriculture. The conclusions in this report are those of the authors and do not necessarily represent the views of the USDA. USDA is an equal opportunity provider and employer.

Conflicts of Interest

The authors declare no conflict of interest.

References

  1. McCombs, R.M.; Benyesh-Melnick, M.; Brunschwig, J.P. Biophysical studies of vesicular stomatitis virus. J. Bacteriol. 1966, 91, 803–812. [Google Scholar] [CrossRef] [PubMed]
  2. Rozo-Lopez, P.; Drolet, B.S.; Londoño-Renteria, B. Vesicular stomatitis virus transmission: A comparison of incriminated vectors. Insects 2018, 9, 190. [Google Scholar] [CrossRef] [PubMed]
  3. Letchworth, G.; Rodriguez, L.; Del Cbarrera, J. Vesicular stomatitis. Vet. J. 1999, 157, 239–260. [Google Scholar] [CrossRef] [PubMed]
  4. Rodríguez, L.L. Emergence and re-emergence of vesicular stomatitis in the United States. Virus Res. 2002, 85, 211–219. [Google Scholar] [CrossRef] [PubMed]
  5. Pelzel-McClusky, A.M. Vesicular stomatitis in large animals. In Merck Veterinary Manual, Online Edition; Merck & Co., Inc.: Kenilworth, NJ, USA, 2022. [Google Scholar]
  6. Alderink, F.J. Vesicular stomatitis epidemic in Colorado: Clinical observations and financial losses reported by dairymen. Prev. Vet. Med. 1984, 3, 29–44. [Google Scholar] [CrossRef]
  7. Goodger, W.; Thurmond, M.; Nehay, J.; Mitchell, J.; Smith, P. Economic impact of an epizootic of bovine vesicular stomatitis in California. J. Am. Vet. Med. Assoc. 1985, 186, 370–373. [Google Scholar]
  8. Hayek, A.; McCluskey, B.; Chavez, G.; Salman, M. Financial impact of the 1995 outbreak of vesicular stomatitis on 16 beef ranches in Colorado. J. Am. Vet. Med. Assoc. 1998, 212, 820–823. [Google Scholar]
  9. Drolet, B.S.; Campbell, C.L.; Stuart, M.A.; Wilson, W.C. Vector competence of Culicoides sonorensis (Diptera: Ceratopogonidae) for vesicular stomatitis virus. J. Med. Entomol. 2005, 42, 409–418. [Google Scholar] [CrossRef]
  10. De León, A.A.P.; O’Toole, D.; Tabachnick, W.J. Infection of guinea pigs with vesicular stomatitis New Jersey virus transmitted by Culicoides sonorensis (Diptera: Ceratopogonidae). J. Med. Entomol. 2006, 43, 568–573. [Google Scholar] [CrossRef]
  11. De Leon, A.A.P.; Tabachnick, W.J. Transmission of vesicular stomatitis New Jersey virus to cattle by the biting midge Culicoides sonorensis (Diptera: Ceratopogonidae). J. Med. Entomol. 2006, 43, 323–329. [Google Scholar] [CrossRef]
  12. Rozo-Lopez, P.; Londono-Renteria, B.; Drolet, B.S. Venereal transmission of vesicular stomatitis virus by Culicoides sonorensis midges. Pathogens 2020, 9, 316. [Google Scholar] [CrossRef]
  13. Mullens, B.A.; Schmidtmann, E.T. The gonotrophic cycle of Culicoides variipennis (Diptera: Ceratopogonidae) and its implications in age-grading field populations in New York State, USA. J. Med. Entomol. 1982, 19, 340–349. [Google Scholar] [CrossRef]
  14. Nayduch, D.; Lee, M.B.; Saski, C.A. Gene discovery and differential expression analysis of humoral immune response elements in female Culicoides sonorensis (Diptera: Ceratopogonidae). Parasites Vectors 2014, 7, 388. [Google Scholar] [CrossRef]
  15. Sim, S.; Dimopoulos, G. Dengue virus inhibits immune responses in Aedes aegypti cells. PLoS ONE 2010, 5, e10678. [Google Scholar] [CrossRef]
  16. Schnettler, E.; Ratinier, M.; Watson, M.; Shaw, A.E.; McFarlane, M.; Varela, M.; Elliott, R.M.; Palmarini, M.; Kohl, A. RNA interference targets arbovirus replication in Culicoides cells. J. Virol. 2013, 87, 2441–2454. [Google Scholar] [CrossRef]
  17. Mills, M.K.; Nayduch, D.; Michel, K. Inducing RNA interference in the arbovirus vector, Culicoides sonorensis. Insect Mol. Biol. 2015, 24, 105–114. [Google Scholar] [CrossRef]
  18. Cheng, G.; Liu, Y.; Wang, P.; Xiao, X. Mosquito defense strategies against viral infection. Trends Parasitol. 2016, 32, 177–186. [Google Scholar] [CrossRef]
  19. Hajdušek, O.; Šíma, R.; Ayllón, N.; Jalovecká, M.; Perner, J.; De La Fuente, J.; Kopáček, P. Interaction of the tick immune system with transmitted pathogens. Front. Cell. Infect. Microbiol. 2013, 3, 26. [Google Scholar] [CrossRef] [PubMed]
  20. Nayduch, D.; Shankar, V.; Mills, M.K.; Robl, T.; Drolet, B.S.; Ruder, M.G.; Scully, E.D.; Saski, C.A. Transcriptome response of female Culicoides sonorensis biting midges (Diptera: Ceratopogonidae) to early infection with epizootic hemorrhagic disease virus (EHDV-2). Viruses 2019, 11, 473. [Google Scholar] [CrossRef] [PubMed]
  21. McHolland, L.E.; Mecham, J.O. Characterization of cell lines developed from field populations of culicoides sonorensis (Diptera: Ceratopogonidae). J. Med. Entomol. 2003, 40, 348–351. [Google Scholar] [CrossRef] [PubMed]
  22. Ghosh, A.; Jasperson, D.; Cohnstaedt, L.W.; Brelsfoard, C.L. Transfection of Culicoides sonorensis biting midge cell lines with Wolbachia pipientis. Parasites Vectors 2019, 12, 483. [Google Scholar] [CrossRef] [PubMed]
  23. Chen, S. Ultrafast one-pass FASTQ data preprocessing, quality control, and deduplication using fastp. iMeta 2023, 2, e107. [Google Scholar] [CrossRef]
  24. Grabherr, M.G.; Haas, B.J.; Yassour, M.; Levin, J.Z.; Thompson, D.A.; Amit, I.; Adiconis, X.; Fan, L.; Raychowdhury, R.; Zeng, Q. Full-length transcriptome assembly from RNA-Seq data without a reference genome. Nat. Biotechnol. 2011, 29, 644–652. [Google Scholar] [CrossRef] [PubMed]
  25. Gilbert, D. Gene-omes built from mRNA seq not genome DNA. In Proceedings of the 7th Annual Arthropod Genomics Symposium, Notre Dame, IN, USA, 12 June 2023. [Google Scholar]
  26. Wood, D.E.; Lu, J.; Langmead, B. Improved metagenomic analysis with Kraken 2. Genome Biol. 2019, 20, 257. [Google Scholar] [CrossRef] [PubMed]
  27. Lu, J.; Rincon, N.; Wood, D.E.; Breitwieser, F.P.; Pockrandt, C.; Langmead, B.; Salzberg, S.L.; Steinegger, M. Metagenome analysis using the Kraken software suite. Nat. Protoc. 2022, 17, 2815–2839. [Google Scholar] [CrossRef]
  28. Bryant, D.M.; Johnson, K.; DiTommaso, T.; Tickle, T.; Couger, M.B.; Payzin-Dogru, D.; Lee, T.J.; Leigh, N.D.; Kuo, T.-H.; Davis, F.G. A tissue-mapped axolotl de novo transcriptome enables identification of limb regeneration factors. Cell Rep. 2017, 18, 762–776. [Google Scholar] [CrossRef]
  29. Mistry, J.; Chuguransky, S.; Williams, L.; Qureshi, M.; Salazar, G.A.; Sonnhammer, E.L.; Tosatto, S.C.; Paladin, L.; Raj, S.; Richardson, L.J. Pfam: The protein families database in 2021. Nucleic Acids Res. 2021, 49, D412–D419. [Google Scholar] [CrossRef]
  30. Boutet, E.; Lieberherr, D.; Tognolli, M.; Schneider, M.; Bairoch, A. UniProtKB/Swiss-Prot: The manually annotated section of the UniProt KnowledgeBase. In Plant Bioinformatics: Methods and Protocols; Springer: Berlin, Germany, 2007; pp. 89–112. [Google Scholar]
  31. UniProtConsortium. UniProt: A worldwide hub of protein knowledge. Nucleic Acids Res. 2019, 47, D506–D515. [Google Scholar] [CrossRef]
  32. Patro, R.; Duggal, G.; Love, M.I.; Irizarry, R.A.; Kingsford, C. Salmon provides fast and bias-aware quantification of transcript expression. Nat. Methods 2017, 14, 417–419. [Google Scholar] [CrossRef]
  33. RCoreTeam. R: A Language and Environment for Statistical Computing; R Foundation for Statistical Computing: Vienna, Austria, 2022. [Google Scholar]
  34. Soneson, C.; Love, M.I.; Robinson, M.D. Differential analyses for RNA-seq: Transcript-level estimates improve gene-level inferences. F1000Research 2015, 4, 1521. [Google Scholar] [CrossRef]
  35. Love, M.I.; Huber, W.; Anders, S. Moderated estimation of fold change and dispersion for RNA-seq data with DESeq2. Genome Biol. 2014, 15, 550. [Google Scholar] [CrossRef] [PubMed]
  36. Benjamini, Y.; Hochberg, Y. Controlling the false discovery rate: A practical and powerful approach to multiple testing. J. R. Stat. Soc. B Stat. Methodol. 1995, 57, 289–300. [Google Scholar] [CrossRef]
  37. Van Gelder, R.N.; Bae, H.; Palazzolo, M.J.; Krasnow, M.A. Extent and character of circadian gene expression in Drosophila melanogaster: Identification of twenty oscillating mRNAs in the fly head. Curr. Biol. 1995, 5, 1424–1436. [Google Scholar] [CrossRef] [PubMed]
  38. Van Gelder, R.N.; Krasnow, M.A. A novel circadianly expressed Drosophila melanogaster gene dependent on the period gene for its rhythmic expression. EMBO J. 1996, 15, 1625–1631. [Google Scholar] [CrossRef]
  39. Guo, S.; Yang, P.; Liang, B.; Zhou, F.; Hou, L.; Kang, L.; Wang, X. Aging features of the migratory locust at physiological and transcriptional levels. BMC Genom. 2021, 22, 257. [Google Scholar] [CrossRef]
  40. Choi, K.C.; Lee, Y.S.; Lim, S.; Choi, H.K.; Lee, C.H.; Lee, E.K.; Hong, S.; Kim, I.H.; Kim, S.J.; Park, S.H. Smad6 negatively regulates interleukin 1-receptor-Toll-like receptor signaling through direct interaction with the adaptor Pellino-1. Nat. Immunol. 2006, 7, 1057–1065. [Google Scholar] [CrossRef]
  41. Nakamoto, M.; Moy, R.H.; Xu, J.; Bambina, S.; Yasunaga, A.; Shelly, S.S.; Gold, B.; Cherry, S. Virus recognition by Toll-7 activates antiviral autophagy in Drosophila. Immunity 2012, 36, 658–667. [Google Scholar] [CrossRef]
  42. Wang, J.; Dupuis, C.; Tyring, S.K.; Underbrink, M.P. Sterile alpha Motif Domain Containing 9 Is a Novel Cellular Interacting Partner to Low-Risk Type Human Papillomavirus E6 Proteins. PLoS ONE 2016, 11, e0149859. [Google Scholar]
  43. Jouvenet, N.; Monaghan, P.; Way, M.; Wileman, T. Transport of African swine fever virus from assembly sites to the plasma membrane is dependent on microtubules and conventional kinesin. J. Virol. 2004, 78, 7990–8001. [Google Scholar] [CrossRef]
  44. Strunze, S.; Engelke, M.F.; Wang, I.H.; Puntener, D.; Boucke, K.; Schleich, S.; Way, M.; Schoenenberger, P.; Burckhardt, C.J.; Greber, U.F. Kinesin-1-mediated capsid disassembly and disruption of the nuclear pore complex promote virus infection. Cell Host Microbe 2011, 10, 210–223. [Google Scholar] [CrossRef]
  45. Hombria, J.C.; Sotillos, S. JAK/STAT signalling: STAT cannot play with Ken and Barbie. Curr. Biol. 2006, 16, R98–R100. [Google Scholar] [CrossRef] [PubMed]
  46. Arbouzova, N.I.; Bach, E.A.; Zeidler, M.P. Ken & barbie selectively regulates the expression of a subset of Jak/STAT pathway target genes. Curr. Biol. 2006, 16, 80–88. [Google Scholar] [PubMed]
  47. Orvedahl, A.; MacPherson, S.; Sumpter, R.; Tallóczy, Z.; Zou, Z.; Levine, B. Autophagy protects against Sindbis virus infection of the central nervous system. Cell Host Microbe 2010, 7, 115–127. [Google Scholar] [CrossRef] [PubMed]
  48. Brackney, D.E.; Correa, M.A.; Cozens, D.W. The impact of autophagy on arbovirus infection of mosquito cells. PLoS Negl. Trop. Dis. 2020, 14, e0007754. [Google Scholar] [CrossRef]
  49. Ruan, X.; Zhang, R.; Li, R.; Zhu, H.; Wang, Z.; Wang, C.; Cheng, Z.; Peng, H. The research progress in physiological and pathological functions of TRAF4. Front. Oncol. 2022, 12, 842072. [Google Scholar] [CrossRef]
  50. Ma, T.H.; Benzie, J.A.; He, J.-G.; Sun, C.-B.; Chan, S.F. PmPPAF is a pro-phenoloxidase activating factor involved in innate immunity response of the shrimp Penaeus monodon. Dev. Comp. Immunol. 2014, 44, 163–172. [Google Scholar] [CrossRef]
  51. Sanfilippo, C.; Nunnari, G.; Calcagno, A.; Malaguarnera, L.; Blennow, K.; Zetterberg, H.; Di Rosa, M. The chitinases expression is related to Simian Immunodeficiency Virus Encephalitis (SIVE) and in HIV encephalitis (HIVE). Virus Res. 2017, 227, 220–230. [Google Scholar] [CrossRef]
  52. Lee, C.G.; Da Silva, C.A.; Dela Cruz, C.S.; Ahangari, F.; Ma, B.; Kang, M.J.; He, C.H.; Takyar, S.; Elias, J.A. Role of chitin and chitinase/chitinase-like proteins in inflammation, tissue remodeling, and injury. Annu. Rev. Physiol. 2011, 73, 479–501. [Google Scholar] [CrossRef]
  53. Willecke, M.; Hamaratoglu, F.; Kango-Singh, M.; Udan, R.; Chen, C.-L.; Tao, C.; Zhang, X.; Halder, G. The fat cadherin acts through the hippo tumor-suppressor pathway to regulate tissue size. Curr. Biol. 2006, 16, 2090–2100. [Google Scholar] [CrossRef]
  54. Zhang, Q.; Zhou, R.; Xu, P. The Hippo pathway in innate anti-microbial immunity and anti-tumor immunity. Front. Immunol. 2020, 11, 1473. [Google Scholar] [CrossRef]
  55. Kumar, V.; Garg, S.; Gupta, L.; Gupta, K.; Diagne, C.T.; Misse, D.; Pompon, J.; Kumar, S.; Saxena, V. Delineating the role of Aedes aegypti ABC transporter gene family during mosquito development and arboviral infection via transcriptome analyses. Pathogens 2021, 10, 1127. [Google Scholar] [CrossRef] [PubMed]
  56. Accaoui, M.J.; Enoiu, M.; Mergny, M.; Masson, C.; Dominici, S.; Wellman, M.; Visvikis, A. Gamma-glutamyltranspeptidase-dependent glutathione catabolism results in activation of NF-kB. Biochem. Biophys. Res. Commun. 2000, 276, 1062–1067. [Google Scholar] [CrossRef] [PubMed]
  57. Ball, L.A.; White, C.N. Order of transcription of genes of vesicular stomatitis virus. Proc. Natl. Acad. Sci. USA 1976, 73, 442–446. [Google Scholar] [CrossRef] [PubMed]
  58. Abraham, G.; Banerjee, A.K. Sequential transcription of the genes of vesicular stomatitis virus. Proc. Natl. Acad. Sci. USA 1976, 73, 1504–1508. [Google Scholar] [CrossRef]
  59. Iverson, L.E.; Rose, J.K. Localized attenuation and discontinuous synthesis during vesicular stomatitis virus transcription. Cell 1981, 23, 477–484. [Google Scholar] [CrossRef]
  60. Lichty, B.D.; Power, A.T.; Stojdl, D.F.; Bell, J.C. Vesicular stomatitis virus: Re-inventing the bullet. Trends Mol. Med. 2004, 10, 210–216. [Google Scholar] [CrossRef]
  61. Stojdl, D.F.; Lichty, B.D.; Paterson, J.M.; Power, A.T.; Knowles, S.; Marius, R.; Reynard, J.; Poliquin, L.; Atkins, H.; Brown, E.G. VSV strains with defects in their ability to shutdown innate immunity are potent systemic anti-cancer agents. Cancer Cell 2003, 4, 263–275. [Google Scholar] [CrossRef]
  62. Von Kobbe, C.; Van Deursen, J.M.; Rodrigues, J.P.; Sitterlin, D.; Bachi, A.; Wu, X.; Wilm, M.; Carmo-Fonseca, M.; Izaurralde, E. Vesicular stomatitis virus matrix protein inhibits host cell gene expression by targeting the nucleoporin Nup98. Mol. Cell 2000, 6, 1243–1252. [Google Scholar] [CrossRef]
  63. Petersen, J.M.; Her, L.-S.; Varvel, V.; Lund, E.; Dahlberg, J.E. The matrix protein of vesicular stomatitis virus inhibits nucleocytoplasmic transport when it is in the nucleus and associated with nuclear pore complexes. Mol. Cell. Biol. 2000, 20, 8590–8601. [Google Scholar] [CrossRef]
  64. Petersen, J.M.; Her, L.-S.; Dahlberg, J.E. Multiple vesiculoviral matrix proteins inhibit both nuclear export and import. Proc. Natl. Acad. Sci. USA 2001, 98, 8590–8595. [Google Scholar] [CrossRef]
  65. Black, B.L.; Lyles, D.S. Vesicular stomatitis virus matrix protein inhibits host cell-directed transcription of target genes in vivo. J. Virol. 1992, 66, 4058–4064. [Google Scholar] [CrossRef] [PubMed]
  66. Black, B.L.; Rhodes, R.; McKenzie, M.; Lyles, D. The role of vesicular stomatitis virus matrix protein in inhibition of host-directed gene expression is genetically separable from its function in virus assembly. J. Virol. 1993, 67, 4814–4821. [Google Scholar] [CrossRef] [PubMed]
  67. Ahmed, M.; Lyles, D.S. Effect of vesicular stomatitis virus matrix protein on transcription directed by host RNA polymerases I, II, and III. J. Virol. 1998, 72, 8413–8419. [Google Scholar] [CrossRef] [PubMed]
  68. Neidermyer, W.J., Jr.; Whelan, S.P. Global analysis of polysome-associated mRNA in vesicular stomatitis virus infected cells. PLoS Pathog. 2019, 15, e1007875. [Google Scholar] [CrossRef] [PubMed]
  69. Etebari, K.; Hegde, S.; Saldaña, M.A.; Widen, S.G.; Wood, T.G.; Asgari, S.; Hughes, G.L. Global transcriptome analysis of Aedes aegypti mosquitoes in response to Zika virus infection. MSphere 2017, 2, e00456-17. [Google Scholar] [CrossRef] [PubMed]
  70. Velikkakath, A.K.G.; Nishimura, T.; Oita, E.; Ishihara, N.; Mizushima, N. Mammalian Atg2 proteins are essential for autophagosome formation and important for regulation of size and distribution of lipid droplets. Mol. Biol. Cell. 2012, 23, 896–909. [Google Scholar] [CrossRef]
  71. Imamura, T.; Takase, M.; Nishihara, A.; Oeda, E.; Hanai, J.-i.; Kawabata, M.; Miyazono, K. Smad6 inhibits signalling by the TGF-β superfamily. Nature 1997, 389, 622–626. [Google Scholar] [CrossRef]
  72. Takeshita, F.; Ishii, K.J.; Kobiyama, K.; Kojima, Y.; Coban, C.; Sasaki, S.; Ishii, N.; Klinman, D.M.; Okuda, K.; Akira, S. TRAF4 acts as a silencer in TLR-mediated signaling through the association with TRAF6 and TRIF. Eur. J. Immunol. 2005, 35, 2477–2485. [Google Scholar] [CrossRef]
  73. Marinis, J.M.; Homer, C.R.; McDonald, C.; Abbott, D.W. A novel motif in the Crohn’s disease susceptibility protein, NOD2, allows TRAF4 to down-regulate innate immune responses. J. Biol. Chem. 2011, 286, 1938–1950. [Google Scholar] [CrossRef]
  74. Marinis, J.M.; Hutti, J.E.; Homer, C.R.; Cobb, B.A.; Cantley, L.C.; McDonald, C.; Abbott, D.W. IκB kinase α phosphorylation of TRAF4 downregulates innate immune signaling. Mol. Cell. Biol. 2012, 32, 2479–2489. [Google Scholar] [CrossRef]
  75. DuRaine, G.; Wisner, T.W.; Howard, P.; Johnson, D.C. Kinesin-1 proteins KIF5A, -5B, and -5C promote anterograde transport of herpes simplex virus enveloped virions in axons. J. Virol. 2018, 92, 10–1128. [Google Scholar] [CrossRef] [PubMed]
  76. Das, S.C.; Nayak, D.; Zhou, Y.; Pattnaik, A.K. Visualization of intracellular transport of vesicular stomatitis virus nucleocapsids in living cells. J. Virol. 2006, 80, 6368–6377. [Google Scholar] [CrossRef] [PubMed]
Figure 1. (A) One-step growth curve of VSNJV in W8 cells (n = 6 replicates per time point, repeated measures ANOVA F (6,41) = 361.7, p < 0.0001). The dotted line indicates the limit of detection. Groups that do not share a letter are significantly different via Tukey pairwise comparison (p < 0.05).
Viruses 15 02108 g001
Figure 2. Principal component analysis (PCA) of transcriptomic data. (A) Score plot of PC1 vs. PC2. (B) Score plot of PC1 vs. PC3. Shapes indicate infection status and color indicates the time point.
Viruses 15 02108 g002
Figure 3. Heatmap of sample correlation based on regularized log (rlog)-transformed gene expression data clustered by correlation distance. Color intensity indicates the strength of pairwise Pearson correlation coefficients between all samples, with red indicating a higher positive correlation and blue indicating a lower correlation. Samples are labeled with V for VSNJV-infected cells or C for mock-infected controls followed by the collection time point (HPI) and letter (A–F) to indicate the replicate (n = 6 replicates per time point and condition).
Viruses 15 02108 g003
Figure 4. Enhanced volcano plot of differential unigene expression between VSNJV-infected and mock-infected C. sonorensis W8 cells 1 HPI. The volcano plot shows the relationship between fold change (x-axis) and statistical significance (y-axis) in determining differentially expressed genes between virus-treated and control cells at time point 1 HPI. Each dot represents a unigene, with pink dots indicating unigenes meeting the significance threshold of adjusted p-value < 0.05 and biological relevance cutoff of log2 (fold change) > 0.58 (1.5-fold change). Differential expression analysis was performed using DESeq2 on RNA sequencing data, with statistical testing adjusted for a single factor using the Wald hypothesis test.
Viruses 15 02108 g004
Figure 5. VSNJV unigenes from W8 infection. (A) Diagram of VSNJV genome. (B) Mean Log10 VSNJV unigenes per million at each sequenced time point (n = 6 replicates per time point, two-way ANOVA F (12,75) = 903.6, p < 0.0001). Colors indicate viral genes (black: N, pink: P, teal: M, dark purple: G, and light purple: L). Within each gene, time points that do not share a letter are significantly different via Tukey pairwise comparisons (p < 0.05). Full pairwise comparisons can be found in Table S3.
Viruses 15 02108 g005
Table 1. Select differentially expressed unigenes with Log2 FC > 0.8 or −0.8.
Functional AnnotationNameLog2 FCFDR p-ValuePossible Immune or Proviral
Function
REG5Rhythmically expressed gene 5−2.414.72 × 10−65Unknown
SMAD6Mothers against decapentaplegic homolog 6−2.275.23 × 10−266Immune [40]
DSXProtein doublesex−1.774.88 × 10−8Unknown
CUD2Endocuticle structural glycoprotein−1.551.23 × 10−48Unknown
LIPTLipoyltransferae 1 *−1.35,
−1.36,
−1.35
1.15 × 10⁻¹⁵, 0.007,
8.35 × 10⁻²⁴
Unknown
TOLL7Toll-like receptor 7 *−1.02,
−0.95
1.64 × 10⁻¹⁷,
5.17 × 10⁻⁷
Immune [41]
SAM11Sterile alpha motif domain-containing
protein 11
−0.932.54 × 10−4Immune [42]
KI26LKinesin-like protein *−0.82,
−0.85
3.00 × 10⁻¹³,
5.10 × 10⁻⁵
Proviral [43,44]
KEN1Transcription factor Ken1−0.810.02Immune [45,46]
ATG2BAutophagy-related protein 2 homolog B0.837.75 × 10−13Immune, proviral [47,48]
TRAF4TNF receptor-associated factor 40.846.59 × 10−4Immune [49]
NAAT1Sodium-dependent nutrient amino acid transporter 11.032.53 × 10−20Unknown
PPAF3Phenoloxidase-activating factor 31.301.73 × 10−7Immune [50]
CHIT1Chitotriosidase 11.553.03 × 10−8Immune [51,52]
FATCadherin-related tumor suppressor/FAT
tumor suppressor homolog 1
1.786.51 × 10−6Immune [53,54]
CP4CUCytochrome P450 4c211.930.005Unknown
SCXBasic helix-loop-helix transcription factor scleraxis1.970.009Unknown
ABCA3Phospholipid-transporting ATPase ABCA32.44,
1.43
0.02,
3.72 × 10⁻⁶
Immune [55]
GGTGamma-glutamytranspeptidase 12.470.02Immune [56]
* Multiple unigenes.
Disclaimer/Publisher’s Note: The statements, opinions and data contained in all publications are solely those of the individual author(s) and contributor(s) and not of MDPI and/or the editor(s). MDPI and/or the editor(s) disclaim responsibility for any injury to people or property resulting from any ideas, methods, instructions or products referred to in the content.

