


Abstract
In this study, the effects of log loading on the lateral overturning of an unmanned, remote-controlled forestry crawler tractor were analyzed through simulation-based analysis. A 3D model was constructed and validated in terms of actual dimensions, static sidelong falling angle, and turning area radius. The errors in both actual dimensions and turning area radius were below 5%, and the static sidelong falling angle was consistent with test results, thereby confirming the model’s reproducibility. Simulations combined three loading levels (0, 50, and 100%), 11 ground slope angles (0 to 50° at 5° intervals), four obstacle heights (0 to 300 mm at 100 mm intervals), and two driving speeds (3.6 and 5.8 km/h). The maximum roll angular velocity within the obstacle contact zone, taken as a safety indicator, was derived for each loading condition. The results showed that lateral overturning occurred before reaching the obstacle, at lower ground slope angles under log loading than without loading. This shows that loading conditions affect lateral discharge safety. Roll angular velocity increased rapidly at high ground slope angles regardless of loading condition, confirming that ground slope angle is key for lateral overturning. Four-way ANOVA results showed that ground slope angle and obstacle height had the greatest impact on roll angular velocity. Although the main effect of loading was relatively small compared to environmental factors, its interaction with ground slope angle was significant, redefining the tractor’s stability limits. Thus, while loading is not a primary factor causing lateral overturning, it influences the sensitivity of roll angular velocity to ground slope angle. These results can be interpreted within a quasi-static framework under low-speed operating conditions, and by using roll angular velocity as an indicator of transient response during obstacle interaction, they provide foundational data for establishing load-dependent safety standards and determining optimal loading limits to prevent lateral overturning in forestry operations.
1. Introduction
Forestry is classified as one of the most hazardous industries in the world due to steep slopes, irregular topographic conditions, and poor working environments [1]. According to statistics from the Ministry of Employment and Labor, the forestry accident rate in South Korea in 2017 was 1.36%, the second highest among all industries. In addition, the fatality rate per 10,000 workers (i.e., 10,000 times the number of deaths divided by the total number of workers) in forestry was 1.93%, also the second highest among all industries [2]. A total of 470 accidents occurred at five Australian forestry companies from 2004 to 2014, of which 176 (37.4%) occurred during logging, transportation, and forest road work stages [3]. Since the risk of accidents is very high at work sites, driving safety must be ensured while considering various topographic characteristics and machine operating conditions [4]. Accordingly, large machines such as tractors have been widely used in forestry and agriculture [5]. Crawler tractors exhibit superior driving performance compared to wheeled tractors, particularly in obstacle climbing and crossing [6,7]. They can also operate efficiently in forestry environments with dense trees and narrow forest roads [8]. Although all ground vehicles experience changes in center-of-gravity position under loading conditions, crawler tractors generally exhibit higher baseline stability due to their quadrilateral support base and rigid structure. However, under combined conditions such as slope operation and log loading, the shift in center of gravity can still reduce the restoring moment and adversely affect lateral stability [9]. Because forestry work is performed under conditions involving combinations of slopes, obstacles, and irregular road surfaces [10], safety analysis considering the risk of lateral overturning is essential. Accordingly, many studies have investigated the driving stability of forestry crawlers and other working machines under such conditions.
Gibson and Biller [11] mathematically analyzed a safety model to examine the lateral overturning characteristics of an articulated forestry forwarder traveling on a slope. They found that ground slope angle and chassis turning angle had the greatest impact on lateral overturning safety, and that safety decreased as the load increased due to a rise in the center of gravity of the rear frame. Franceschetti et al. [12] improved existing mathematical models to analyze the dynamic characteristics of an articulated narrow-track tractor with rubber tracks. They reported that the total vehicle weight increased with the application of rubber tracks and quantitatively analyzed structural changes, including the downward and rearward shift in the center of gravity. Franceschetti et al. [13] developed a kinematic model to assess the lateral overturning safety of an articulated crawler tractor traveling on a slope. They found that safety decreased as the roll angle increased, whereas changes in yaw angle had no significant effect. Chajkin et al. [14] presented a mathematical model to evaluate the lateral overturning safety of an articulated tracked vehicle. They showed that safety decreased as the center of gravity rose or shifted laterally, and that the risk of overturning increased with driving speed due to a reduction in critical speed. Park et al. [15] analyzed the lateral overturning safety of a forestry forwarder using dynamic simulation, considering log loading conditions and ground slope angles. They suggested reducing driving speed when the forwarder is loaded due to the elevated center of gravity and reduced stability. Shim et al. [16] developed a simulation model to analyze the lateral overturning characteristics of a small forestry vehicle loaded with logs on a slope. Their results indicated that lateral overturning safety was significantly reduced when logs were loaded sideways due to shifts in the center of gravity. Manzone and Calvo [17] analyzed the lateral overturning risk of forestry tractors using trailers during timber transport on slopes and assessed driving safety according to loading methods and tractor configurations through field experiments. They found that crawler tractors exhibited more stable behavior than wheeled tractors and that the severity of lateral overturning accidents increased when loads were secured during driving. Shadmanovich and Abdunabiyevich [18] evaluated the lateral overturning safety of crawler tractors based on the geometric relationship between the center of gravity and the track support surface. They reported that the risk of overturning increased as the center of gravity rose or shifted laterally due to a reduction in the stability angle.
Previous studies have primarily focused on wheeled or articulated tractors, while studies on crawler tractors have mainly addressed static stability or analyses under simplified assumptions. In recent years, unmanned and automated technologies have been actively developed in agriculture and forestry to address labor shortages and improve work safety [19]. The unmanned remote-controlled crawler tractor considered in this study has its engine and major components concentrated near the driver’s seat at the front of the chassis, resulting in a forward-shifted center of gravity. This weight distribution may lead to lateral overturning behavior different from that of conventional crawler tractors and should therefore be considered in safety analyses. In particular, studies that quantitatively analyze roll angular velocity under different loading conditions are limited [20]. Most previous studies have evaluated lateral overturning risk using static stability angles or quasi-static geometric relationships. While these approaches are useful for identifying geometric safety margins, they cannot fully capture the transient lateral overturning process caused by vehicle inertia, obstacle-induced impact, and rapid load transfer during motion. Lateral overturning is governed not only by the instantaneous roll position but also by the rate of rotational motion once lateral stability is disturbed. Therefore, roll angular velocity was selected as an indicator of transient response to capture both the onset and severity of lateral instability under realistic operating conditions. In this study, lateral overturning simulations were performed for an unmanned remote-controlled crawler tractor under varying ground slope angles, obstacle heights, and driving speeds in a forestry environment. The effects of loading conditions on roll angular velocity were quantitatively analyzed to provide foundational data for the design and safe operation of forestry crawler tractors.
2. Materials and Methods
2.1. Analysis of the Lateral Overturning Safety of a Crawler Tractor
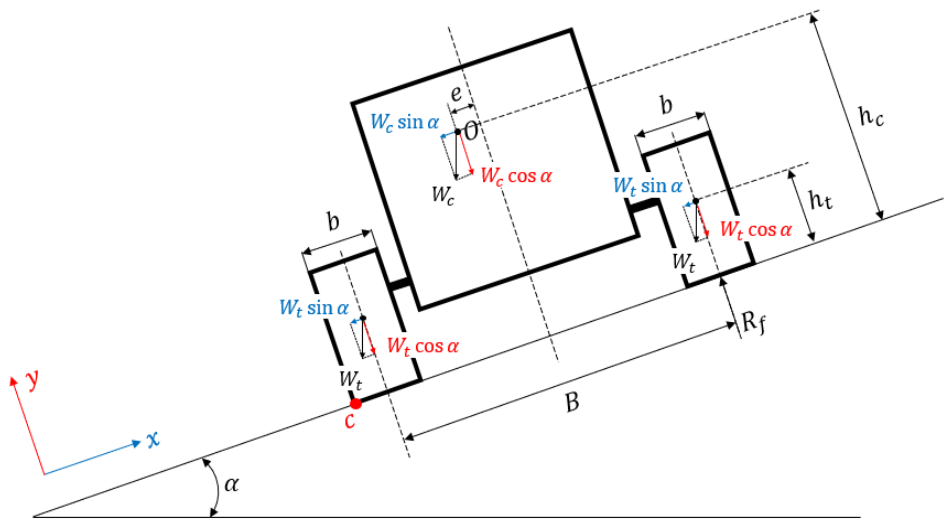
Sun et al. [21] defined lateral overturning as the condition in which the ground reaction force of the track located on the upper side of the slope, , becomes zero and identified the corresponding ground slope angle as the critical angle for lateral overturning. Figure 1 shows a schematic diagram of a stationary crawler tractor on a slope used to analyze lateral overturning safety. For the theoretical analysis, several simplifying assumptions were adopted to facilitate the formulation of the model.
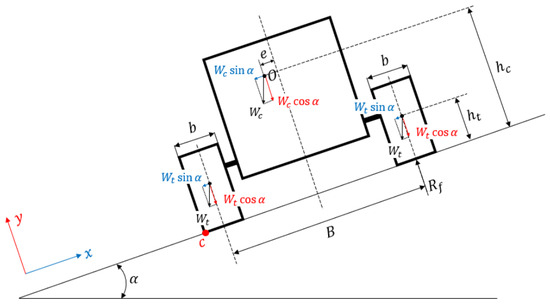
Figure 1.
Schematic diagram of the lateral overturning of a crawler tractor.
- -
- The ground supporting the tractor is assumed to be rigid, planar, and non-deformable.
- -
- Aerodynamic resistance generated during motion is neglected.
- -
- The tractor is assumed to undergo two-dimensional planar motion.
- -
- All components except the tracks are assumed to behave as rigid bodies.
- -
- Slip between the ground and the track is not considered.
As the lateral stability of the crawler tractor decreases on a slope, the ground reaction force of the track located on the upper side is reduced and eventually lost. The tractor then rotates about the contact point of the lower track, C, resulting in lateral overturning. The overturning condition in the stationary state can be determined using the moment equilibrium about point C, which represents the balance between the overturning moment due to gravity and the restoring moment due to the ground reaction force. A non-uniform distribution of moments reduces the stability of the crawler tractor [22]. The moment equilibrium equation at point C is given by Equation (1):
where
- = Moment at point ;
- = Support reaction force acting on the track located on the upper side of the slope (N);
- = Crawler tractor gauge (m);
- = Crawler tractor track width (m);
- = Slope angle (°);
- = Crawler tractor body weight (N);
- = Track weight (N);
- = Height of the crawler tractor center of gravity (m);
- = Height of the track center of gravity (m);
- = Lateral offset of the crawler tractor center of gravity (m).
Assuming that the moment equilibrium equals zero under lateral overturning conditions, the ground reaction force, , can be expressed as Equation (2):
According to Equation (2), lateral overturning is influenced by geometric variables such as the center of gravity height, , and the lateral offset, . These variables vary with loading position and geometry as the log load increases, which reduces the ground reaction force on the upper track and lowers the critical angle for lateral overturning. However, this analysis is based on a quasi-static model that assumes a stationary slope, and therefore cannot fully capture the nonlinear lateral overturning behavior that occurs under the combined effects of inertia, ground contact, and obstacle interactions during motion. In this context, the static model is not intended to predict the full lateral overturning process, but rather to provide a geometric baseline for interpreting the simulation-based analysis results. To address this limitation, the present study employed simulation-based analysis considering various external factors to evaluate the progression of lateral overturning-related motion. In particular, the effects of loading-dependent variables identified through theoretical analysis were quantitatively assessed in terms of roll angular velocity under realistic operating conditions.
2.2. Target Crawler Tractor
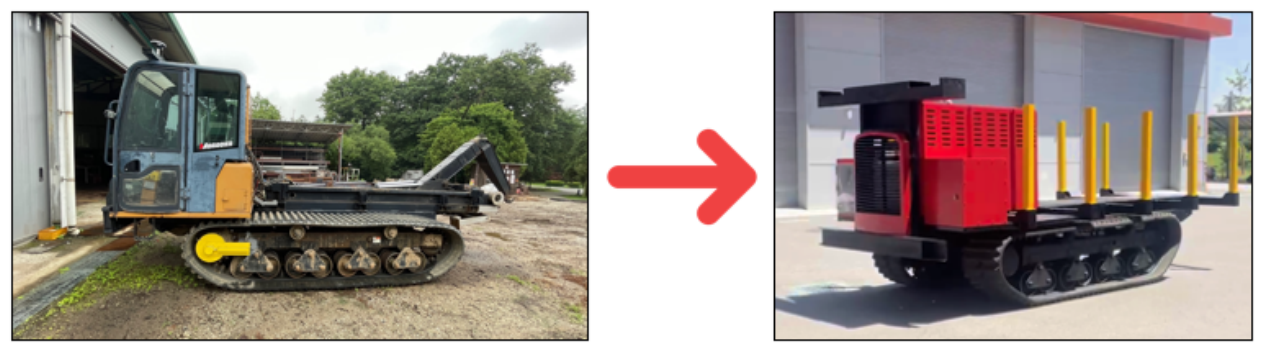
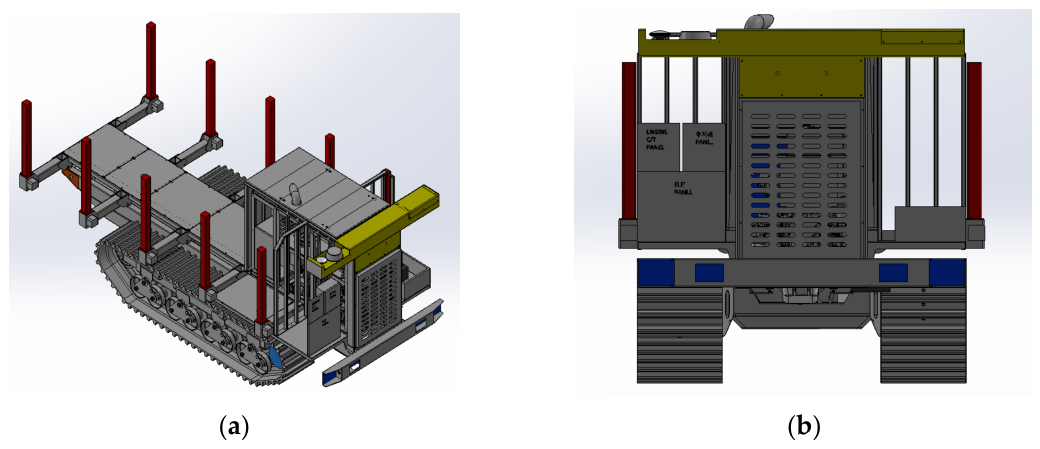
The configuration and specifications of the crawler tractor used in this study are shown in Figure 2 and Table 1 and Table 2. The crawler tractor is a modified version of a commercial model designed for unmanned remote control. It is equipped with a motor, battery, and fuel system, with the engine compartment located at the former driver’s seat position. The length of the rear loading area was set to 3.6 m, considering that the typical length of lumber produced in Korea is 3.6 m or less [23]. The maximum driving speed of the crawler tractor was set to 5.8 km/h, taking into account the uneven and steep conditions of forest roads in Korea. The chassis frame is made of structural carbon steel, while components such as idlers and rollers are made of alloy steel. Rubber tracks were applied (Table 2).
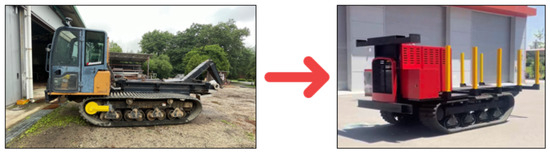
Figure 2.
Configuration of the base crawler tractor and the unmanned remote-controlled crawler tractor.

Table 1.
Specifications of the base crawler tractor and the unmanned remote-controlled crawler tractor.
Table 2.
Material properties of the unmanned remote-controlled crawler tractor.
2.3. Development of 3D and Simulation Models
2.3.1. Three-Dimensional Model
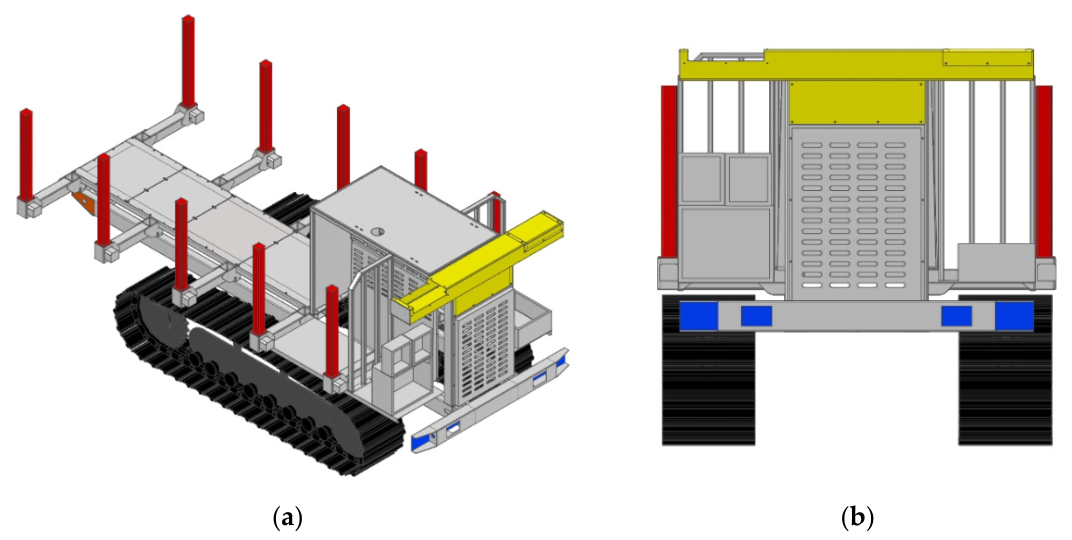
Based on the lateral overturning-related variables derived from the theoretical analysis, a 3D model was constructed using SolidWorks 2023 (Dassault Systèmes, Vélizy-Villacoublay, France) (Figure 3). The geometric shape of the actual crawler tractor was incorporated into the model by measuring its external dimensions. The physical properties of each component (e.g., density, elastic modulus, and Poisson’s ratio) were applied to the 3D model. The overall dimensions (length, width, and height), tractor gauge, track width, total weight, and center of gravity of the final 3D model were compared with those of the actual crawler tractor to verify the model’s validity.
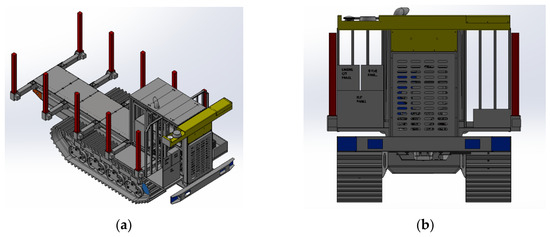
Figure 3.
Three-Dimensional model of the unmanned remote-controlled crawler tractor. (a) Isometric view. (b) Front view.
2.3.2. Simulation Model
Based on the validated 3D model, a simulation model was developed using RecurDyn 2025 (FunctionBay, Seongnam, Republic of Korea), a commercial simulation software. The final simulation model is shown in Figure 4. Because simulation involves repeated analyses, the model must be optimized and simplified [24]. Accordingly, detailed components inside the engine compartment (e.g., motor, battery, and fuel system) were replaced with simplified spherical blocks [25]. The positions of these substituted mass blocks were adjusted so that the center of gravity matched that of the actual crawler tractor. Accordingly, detailed components inside the engine bay were replaced with simplified spherical mass blocks. The positions of these substituted mass blocks were adjusted so that the center of gravity matched that of the actual crawler tractor. While the tractor could be simplified as a single rigid body with equivalent overall inertial properties, the adopted approach using distributed simplified mass elements was intended to preserve the spatial mass distribution of major components. This becomes particularly relevant under loading conditions, where the position of the center of gravity changes and influences the overturning behavior. In addition, the use of simplified mass elements improves numerical stability and convergence during nonlinear simulations involving repeated track–ground contact and obstacle interaction. Therefore, this approach was adopted as a compromise between computational efficiency and physical representativeness.
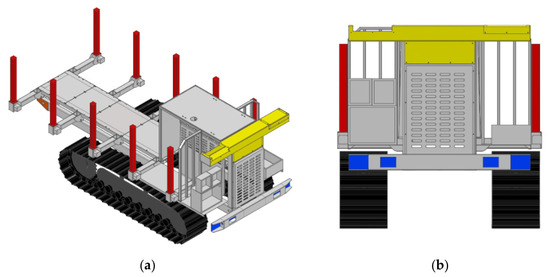
Figure 4.
Simulation model of the unmanned remote-controlled crawler tractor. (a) Isometric view. (b) Front view.
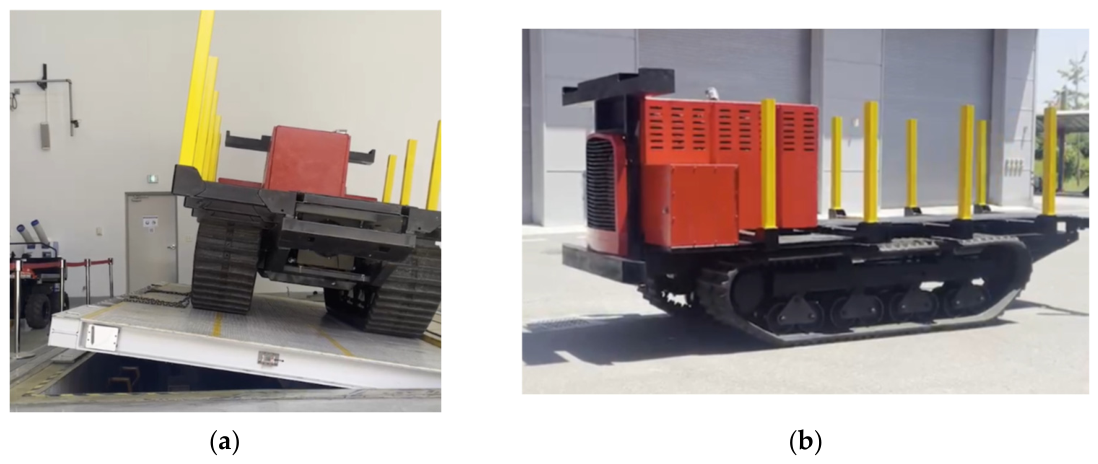
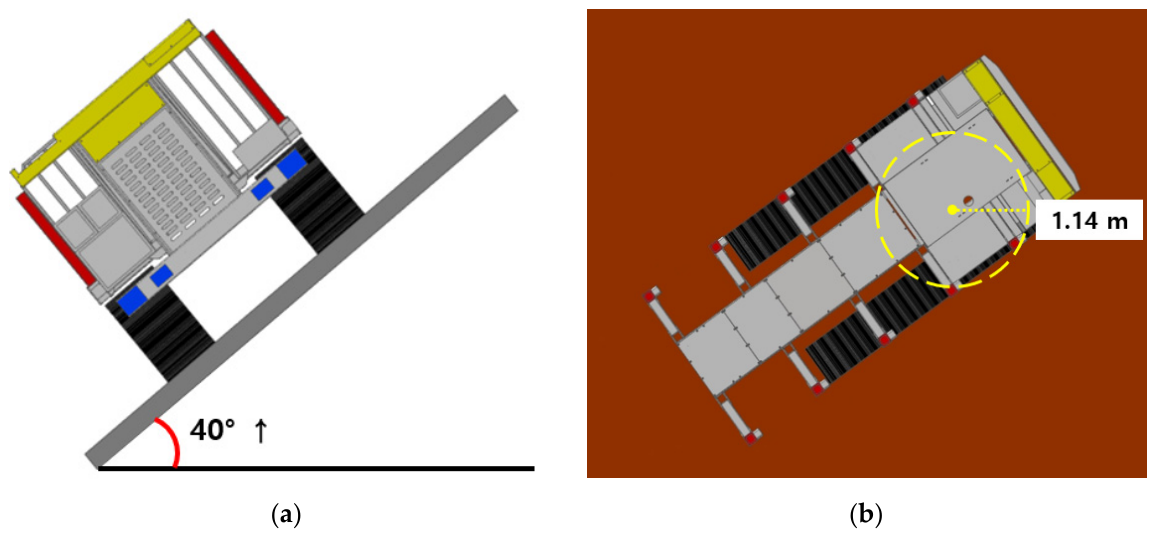
To verify the reproducibility of the characteristics of the simulation model, a turning area radius test and a static sidelong falling angle test were conducted using the actual crawler tractor, and the results were compared with the simulation results. For the turning area radius test, the steering brake was not used, and the driving speed was set to 2 km/h or less in accordance with the procedures specified in OECD Tractor Code 2 [26], considering the crawler tractor’s ability to rotate in place. The turning area radius was defined as the radius of the trajectory formed by the center of the idler located at the front of the outer track, referenced to the center of gravity of the tractor. The static sidelong falling angle was defined as the slope angle at which the track on the upper side of the slope loses contact with the ground as the slope beneath the crawler tractor is quasi-statically increased from 0° to 90°. Although direct experimental measurement of the principal moments of inertia was not conducted, the validation tests were designed to indirectly assess whether the mass distribution and associated inertial characteristics of the model were reasonably represented. The turning radius test reflects the vehicle’s rotational response, which is influenced by the moment of inertia about the vertical axis, while the static sidelong falling angle test reflects the lateral stability characteristics associated with the mass distribution. Agreement between the simulation and experimental results in these tests indicates that the modeled mass distribution and its resulting inertial properties are within a physically reasonable range. Figure 5 shows the configurations of the turning area radius test and the static sidelong falling angle test conducted using the actual crawler tractor.
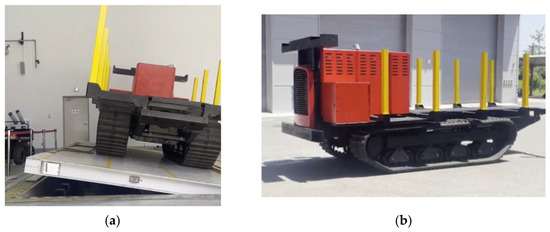
Figure 5.
Configuration of certified tests using the actual crawler tractor. (a) Static sidelong falling angle test. (b) Turning area radius test.
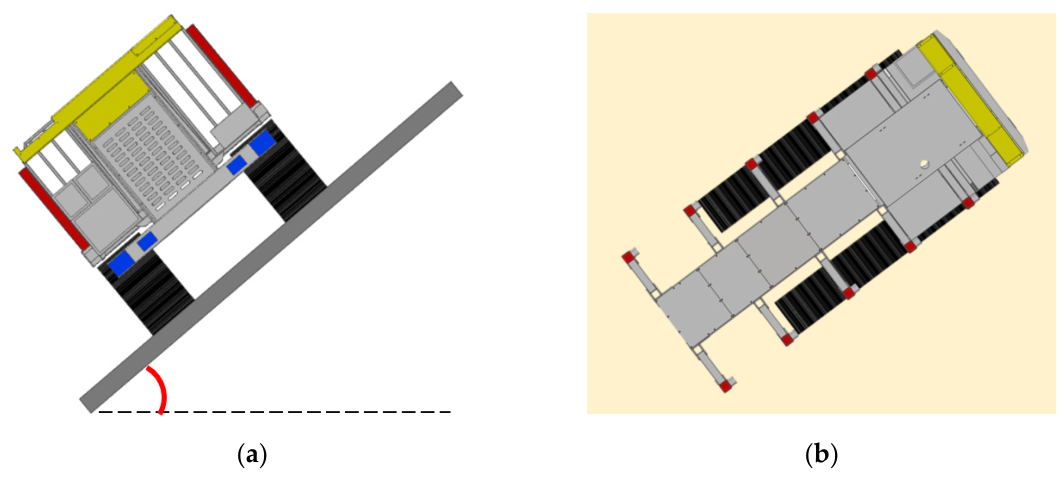
In the simulation, the turning area radius test was conducted under the same driving conditions as the actual test. In the static sidelong falling angle simulation, conditions were required that prevent track slip to accurately measure the sidelong falling limit. In the actual test, lateral track slip was mechanically constrained using non-slip bars and restraining chains installed on the ground. In the simulation, slip was eliminated by artificially increasing the friction characteristics of the ground–track contact as a numerical equivalent to the physical restraints. The friction parameters in Table 3 were specifically selected through iterative testing to ensure zero slip during the slope. Figure 6 shows the simulation configurations for the turning area radius test and the static sidelong falling angle test.
Table 3.
Friction parameters used to suppress slip.
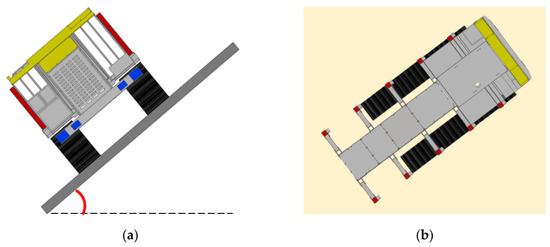
Figure 6.
Configuration of certified tests using the simulation model. (a) Static sidelong falling angle simulation. (b) Turning area radius simulation.
2.4. Simulation Scenario Configuration for Lateral Overturning Safety Analysis
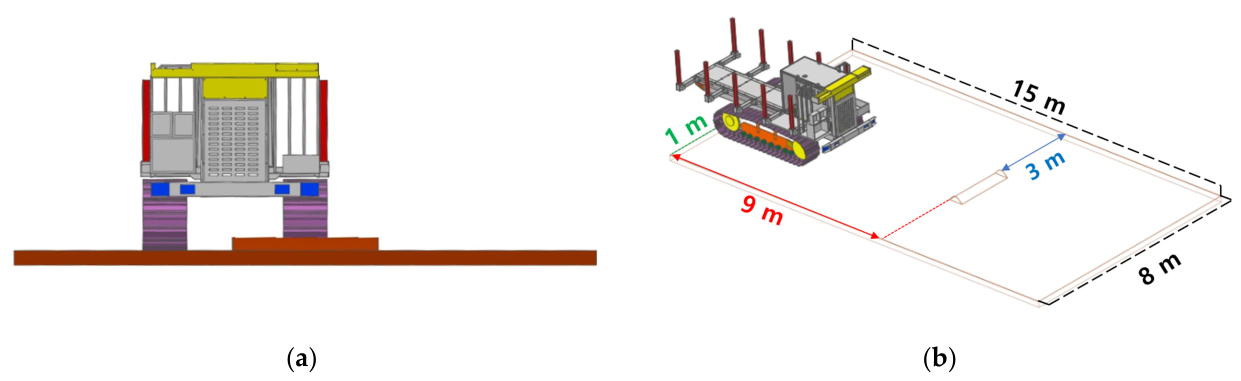
For the lateral overturning simulation of the target crawler tractor, a flat ground model with a length of 15 m and a width of 8 m was constructed. If ground deformation and subsidence are considered, interactions between the ground and tracks may introduce additional effects, making it difficult to clearly compare trends in lateral overturning behavior under the conditions set in this study. Therefore, the ground was assumed to be a rigid body. Although forest terrain is typically more irregular, this simplification was adopted to isolate and clearly evaluate the effects of the selected variables (loading condition, driving speed, and obstacle height) on stability. Contact properties, including the stiffness coefficient between the track shoe and the ground, as well as the dynamic and static friction coefficients, were defined based on a previous study [27] (Table 4). The patch-based surface contact method provided by the simulation software was applied to model the contact between the track and the ground, allowing calculation of reaction and friction forces. Initial conditions were defined such that motion began only after stable contact between the tracks and the ground was maintained for 10 s. In lateral overturning analysis, the moment at which the track on the upper side of the slope separates from the ground is considered the onset of primary lateral overturning [28]. To reproduce this condition, the tractor was positioned near the side of the ground so that the upper track could come into contact with an obstacle, following previous studies. The obstacle was placed 9 m from the starting point. In this study, the simulations were conducted under relatively low-speed conditions, and therefore, the results can be reasonably interpreted within a quasi-static framework. Also, the simulation environment was used to capture transient responses arising from obstacle interaction rather than to fully represent inertial dynamic behavior. The overall configuration of the simulation is shown in Figure 7.
Table 4.
Contact properties of the ground and track shoe.
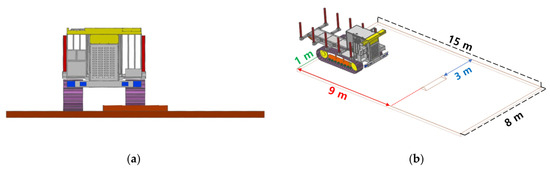
Figure 7.
Geometry of the track system for lateral overturning simulation. (a) Front view. (b) Isometric view.
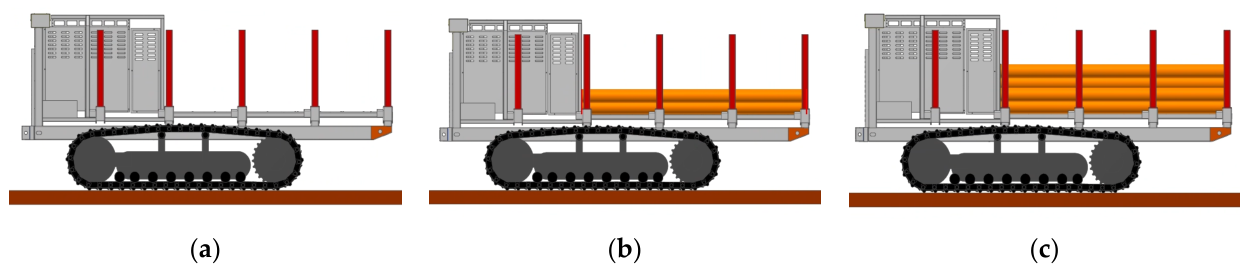
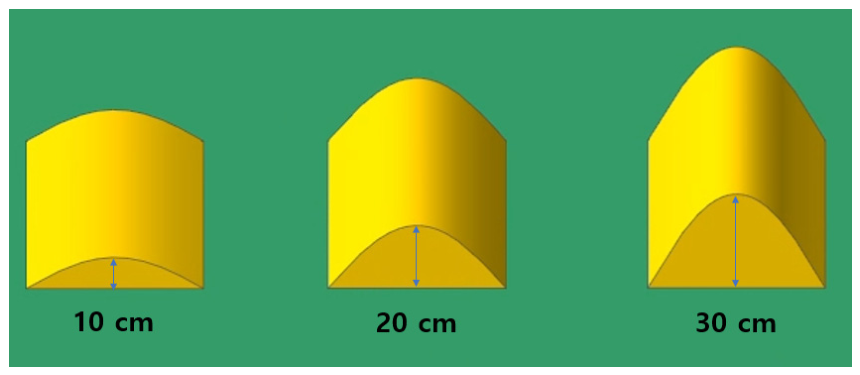
Analysis conditions, including ground slope angle, obstacle shape and height, and driving speed, were defined to evaluate lateral overturning under various loading conditions. Three loading levels were considered: 0% (0 kg), 50% (3500 kg), and 100% (7000 kg), based on the maximum load capacity of 7000 kg (Figure 8). Eleven ground slope angles, ranging from 0° to 50° at 5° intervals, were selected to represent conditions from flat terrain to steep slopes. Obstacles are a key factor influencing lateral overturning, as they generate impact forces during track contact. Common obstacle shapes include triangular, rectangular, and sinusoidal forms. In this study, a sinusoidal shape, considered to better represent actual ground conditions, was adopted [29,30]. The obstacle length was set to 200 cm to ensure sufficient contact with the upper track, and the width was set to 50 cm. The obstacle height was defined at four levels from 0 to 30 cm, at 10 cm intervals, reflecting typical ridge heights in domestic farmland [31,32,33] (Figure 9). These heights were chosen to cover a progressively increasing disturbance level from negligible excitation to severe upper-track input, thereby allowing identification of both stable and overturning-prone conditions within the simulation matrix. Driving speed was set at two levels: low speed (3.6 km/h) and high speed (5.8 km/h), based on the actual operating speeds of the crawler tractor. The selected driving speeds represent the practical low-speed operating range of the target unmanned tractor in steep forest-road conditions, with 5.8 km/h corresponding to the machine’s maximum forward speed. A total of 264 simulation scenarios were generated by combining all factors using a full factorial design.
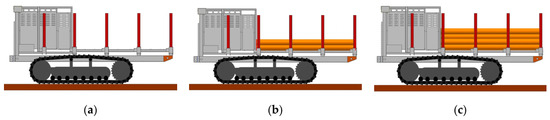
Figure 8.
Loading conditions of the unmanned remote-controlled crawler tractor. (a) 0% (0 kg). (b) 50% (3500 kg). (c) 100% (7000 kg).
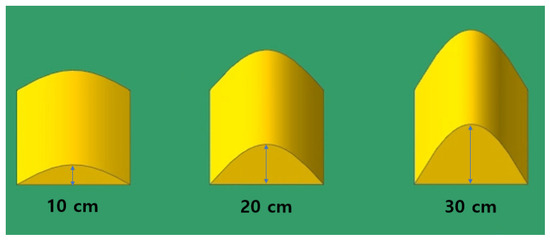
Figure 9.
Obstacle height and shape used in the simulation.
2.5. Analysis of the Lateral Overturning Characteristics of the Target Crawler Tractor
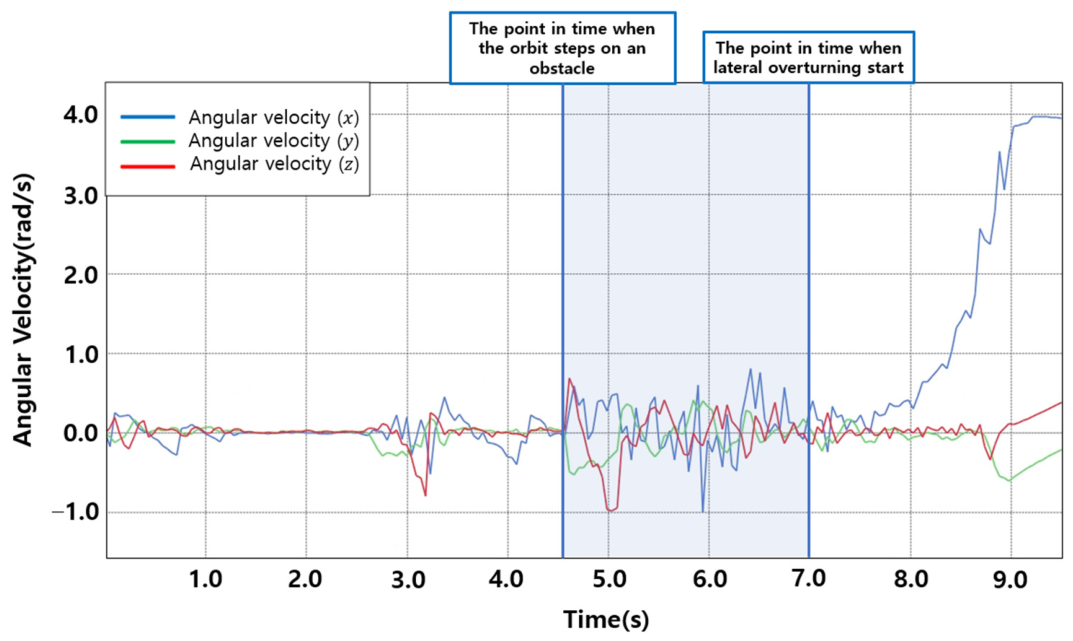
Simulations were performed under the defined combinations of ground slope angle, obstacle height, driving speed, and loading condition. Lateral overturning characteristics were analyzed based on the roll angular velocity of the crawler tractor’s center of gravity, which was selected as a transient response indicator because it captures both the onset of instability and the rate of roll motion during transient conditions. In a previous study, the driving process was divided into phases to analyze nonlinear behavior during obstacle traversal [34]. In this study, the interval from the moment the upper track first contacted the obstacle to the moment contact ended was defined as the obstacle traversal section (Figure 10). The endpoint of this section differed depending on whether lateral overturning occurred. If overturning occurred, the endpoint was defined as the moment when the upper track separated from the ground. If overturning did not occur, the endpoint was defined as the moment when the vehicle returned to normal driving conditions. Within the obstacle traversal section, the interval from the onset of rapid change in roll angular velocity to the occurrence of lateral overturning was defined as the lateral overturning occurrence section. The maximum roll angular velocity within this section was selected as the representative value. The maximum roll angular velocity within the obstacle-contact section was used as the representative index because it reflects the intensity of transient roll development after the tractor enters a reduced-stability state. A higher peak roll angular velocity indicates a more rapid conversion of lateral disturbance into lateral overturning motion, and therefore a higher lateral overturning risk. Subsequently, changes in roll angular velocity under different loading conditions were compared and analyzed to determine the roll angular velocity associated with lateral overturning during crawler tractor operation.
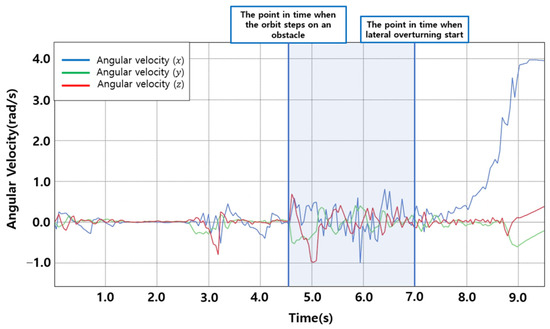
Figure 10.
Definition of the obstacle traversal section for lateral overturning analysis.
3. Results and Discussion
3.1. Verification of the 3D and Simulation Models of the Crawler Tractor
3.1.1. Three-Dimensional Model
To verify the fidelity of the constructed 3D model of the target crawler tractor, key specifications—including tractor gauge, wheelbase, total mass, and weight distribution—were compared with those of the actual crawler tractor. The difference ratios for all dimensional parameters, including tractor gauge and track width, were 0%. The difference ratio of total mass was also 0%. The difference ratios for the weight distribution of the left and right tracks were 0.11% and 2.69%, respectively (Table 5). In general, if the difference ratio between a full-scale system and its 3D model is less than 5%, the model is considered to accurately represent the real system [35]. Therefore, the 3D model developed in this study is considered to accurately reflect the geometric specifications and mass characteristics of the actual crawler tractor and to provide a high-fidelity basis for simulation model development.
Table 5.
Difference ratio check of geometry and mass-property implementation.
3.1.2. Simulation Model
The static sidelong falling angle and turning area radius, which are key safety assessment metrics, were measured for the target crawler tractor. These results were compared with simulation outputs to evaluate the reproducibility of behavior (Figure 11). The static sidelong falling angle test using the actual crawler tractor was conducted up to a slope angle of 40°, considering safety concerns related to lateral overturning. The results indicated that the static sidelong falling angle of the actual crawler tractor was 40° or greater. The simulation model produced a similar result, also exceeding 40°. The turning area radius of the actual crawler tractor was measured as 1.10 m, while the simulation result was 1.14 m, corresponding to an error rate of 3.64%. This discrepancy is likely due to simplifications in the ground–track interaction model and minor differences in weight distribution. Since the simulation results showed error rates of less than 5% for both the static sidelong falling angle and the turning area radius, the developed simulation model is considered to reliably reproduce the behavior of the actual crawler tractor. However, this validation is primarily limited to geometric fidelity, mass distribution, low-speed turning behavior, and quasi-static overturning onset. Direct experimental validation of the full lateral overturning process under obstacle-crossing and slope-travel conditions was not conducted in this study and should be addressed in future work.
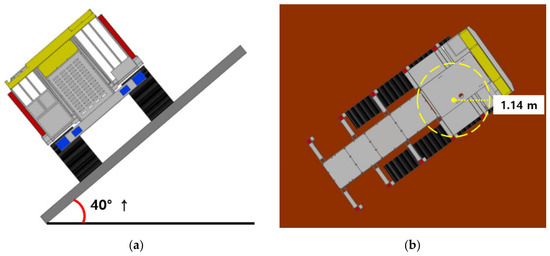
Figure 11.
Simulation results for safety evaluation. (a) Static sidelong falling angle. (b) Turning area radius.
3.2. Analysis of Roll Angular Velocity According to Loading Conditions
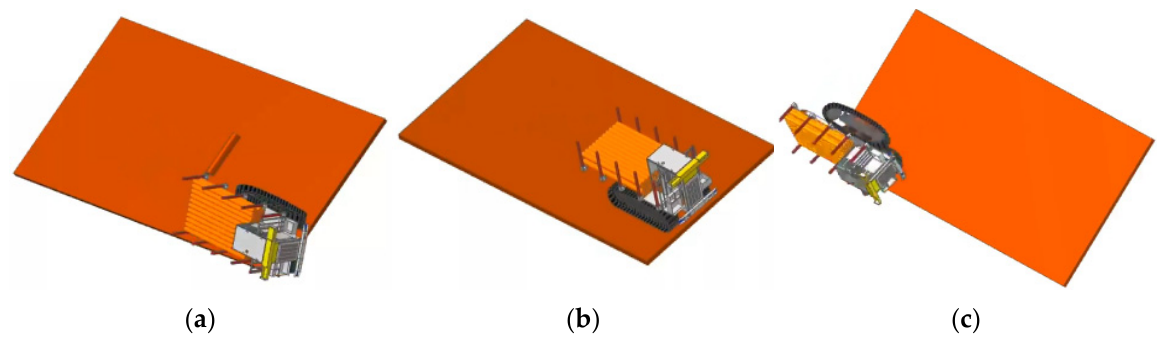
The peak roll angular velocity was compared across loading and terrain conditions as an indicator of lateral overturning severity. Driving simulations were performed to derive the roll angular velocity under conditions leading to lateral overturning of the target crawler tractor (Figure 12). Under extreme driving conditions, lateral overturning occurred before the crawler tractor contacted the obstacle, resulting in a non-drivable state. This phenomenon appears to be caused by a combination of ground slope angle, changes in the center of gravity due to loading, and inertial forces [36]. Instability likely increased during the transition from static to driving conditions. Because this study aims to analyze roll angular velocity under obstacle contact conditions, cases in which overturning occurred before obstacle contact were excluded from analysis, as they are not suitable for comparing roll angular velocity trends.
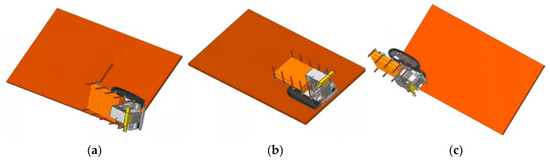
Figure 12.
Behavioral characteristics of the tractor under varying conditions. (a) Lateral overturning. (b) No lateral overturning. (c) Non-drivable condition.
3.2.1. Change in Center of Gravity According to Loading Conditions
The position of the center of gravity is a key variable affecting lateral overturning safety [37,38]. The center of gravity positions under different loading conditions are shown in Figure 13, and the corresponding coordinate changes are summarized in Table 6. The results indicate that the center of gravity moves upward and rearward as the loading level increases, while changes in the lateral coordinate are relatively small. This is likely because the load mass is concentrated near the upper central region of the rear section, causing the center of gravity to shift in that direction.

Figure 13.
Change in the center of gravity according to loading conditions. (a) 0% (0 kg). (b) 50% (3500 kg). (c) 100% (7000 kg).
Table 6.
Coordinates of crawler tractor center of gravity according to loading condition (units: mm).
3.2.2. Ground Slope Angle
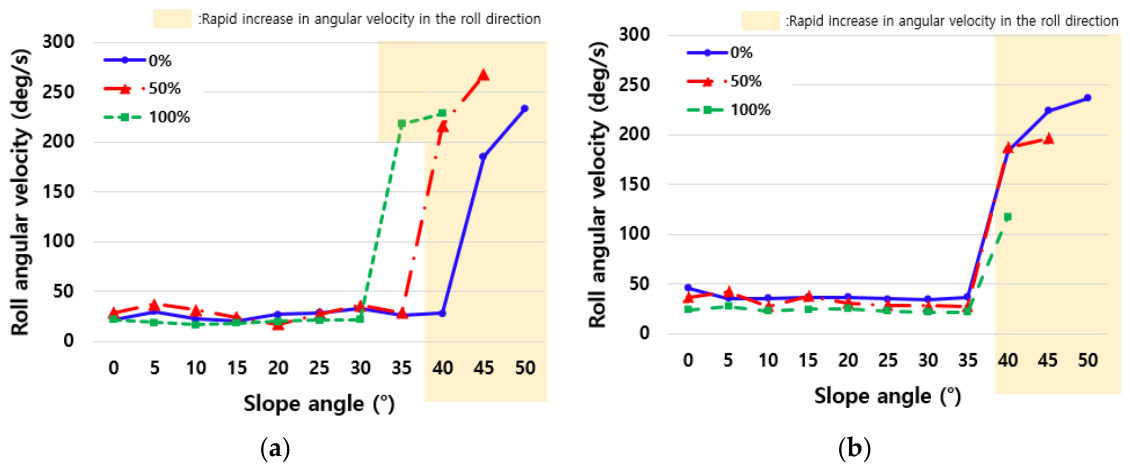
The effects of ground slope angle and loading conditions on roll angular velocity were analyzed (Figure 14), with obstacle height fixed at 300 mm. At relatively low slope angles, no significant differences in roll angular velocity were observed among loading conditions at both driving speeds (3.6 and 5.8 km/h). However, roll angular velocity increased sharply at higher slope angles. This sharp increase can be interpreted as a consequence of the reduced restoring moment as the gravitational line of action approaches the lateral support boundary, leading to a rapid development of roll motion. When comparing behavior across loading conditions, the non-drivable state occurred at lower slope angles under the 100% loading condition than under other conditions. Under the 50% loading condition, roll angular velocity also increased sharply at slope angles of 40° or higher. Under loaded conditions, the elevated and rearward-shifted center of gravity further decreases the restoring moment, causing lateral overturning-related motion to develop at lower slope angles than in the unloaded condition. Under the 0% loading condition, roll angular velocity increased sharply at high slope angles, possibly because the lower total mass made the system more sensitive to disturbances during obstacle traversal. This trend is consistent with previous findings [39] and indicates that the log loading condition is a key factor affecting rollover behavior by shifting the slope angle at which rapid increases in roll angular velocity and non-drivable states occur.
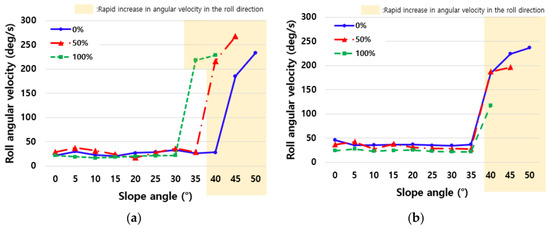
Figure 14.
Roll angular velocity of the crawler tractor according to ground slope angle under an obstacle height of 300 mm. (a) Driving velocity 3.6 km/h. (b) Driving velocity 5.8 km/h.
3.2.3. Obstacle Height
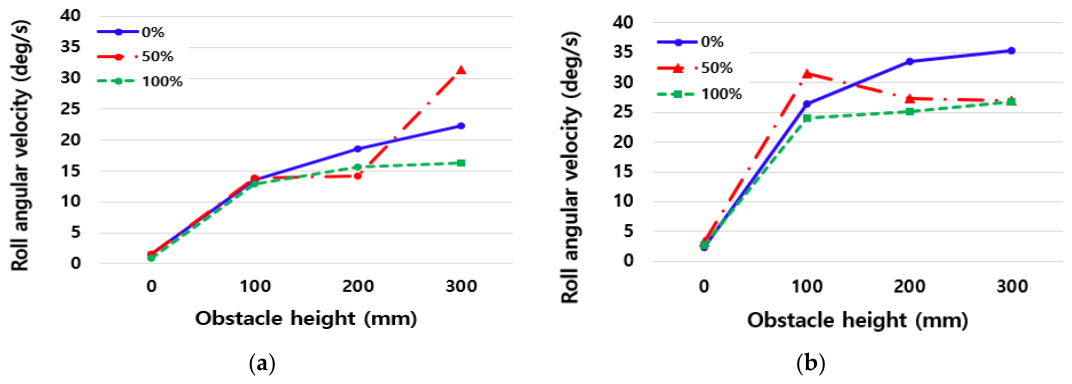
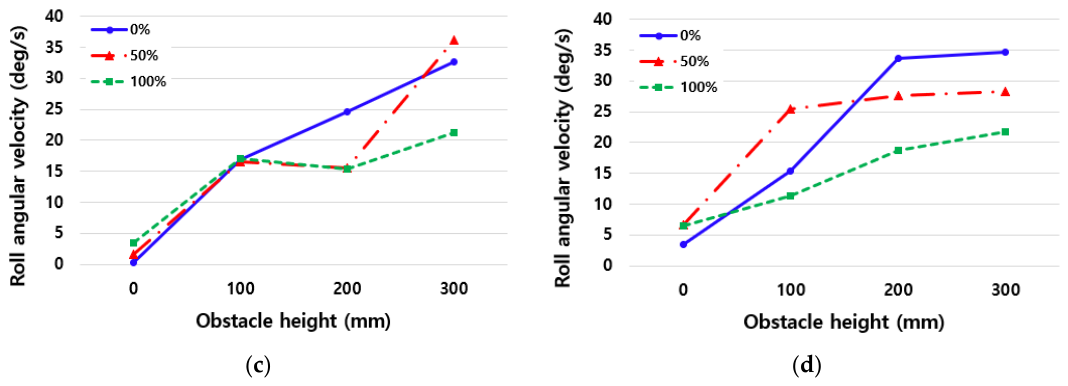
Figure 15 presents the results of the analysis of roll angular velocity according to obstacle height and loading conditions. The analysis covered all simulation cases, with representative conditions shown for clarity. In these examples, slope angles of 10° and 30°, and driving speeds of 3.6 and 5.8 km/h were considered. The results show that roll angular velocity increases as obstacle height increases under both slope conditions. As obstacle height increases, the upper track experiences a larger disturbance and more pronounced transient load transfer, which amplifies roll motion. This is attributed to the increased roll moment generated by impact forces during obstacle contact. Notably, roll angular velocity increased under all conditions as obstacle height increased from 0 to 100 mm, with a more gradual increase beyond this range. The overall magnitude of roll angular velocity was higher at a slope angle of 30° than at 10°, reflecting the increased gravity-induced lateral moment at steeper slopes. In addition, the rate of increase in roll angular velocity varied depending on loading condition, even under identical obstacle conditions. This phenomenon is more pronounced under loaded conditions, as it generates a larger roll moment as the center of gravity shifts upward and backward, even under the same obstacle conditions. These results indicate that obstacle height acts not only as a terrain variable but also as a trigger that converts reduced static stability into lateral overturning-related motion. Consequently, the log loading condition plays a critical role in determining how strongly this disturbance is translated into roll motion, thereby amplifying the sensitivity and overturning risk even under identical obstacle heights.
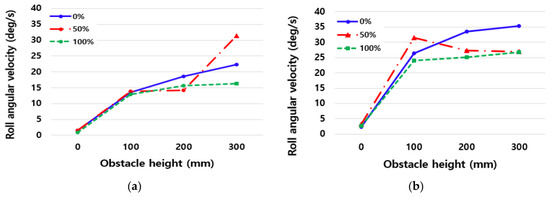
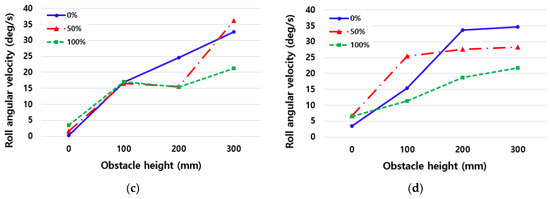
Figure 15.
Roll the angular velocity of the crawler tractor according to the obstacle height. (a) Driving speed: 3.6 km/h, ground slope: 10°. (b) Driving speed: 5.8 km/h, ground slope: 10°. (c) Driving speed: 3.6 km/h, ground slope: 30°. (d) Driving speed: 5.8 km/h, ground slope: 30°.
3.2.4. Driving Speed
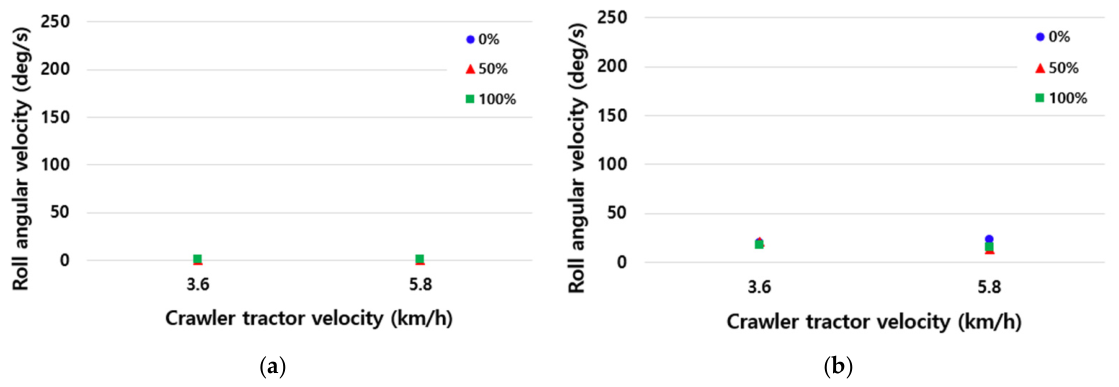
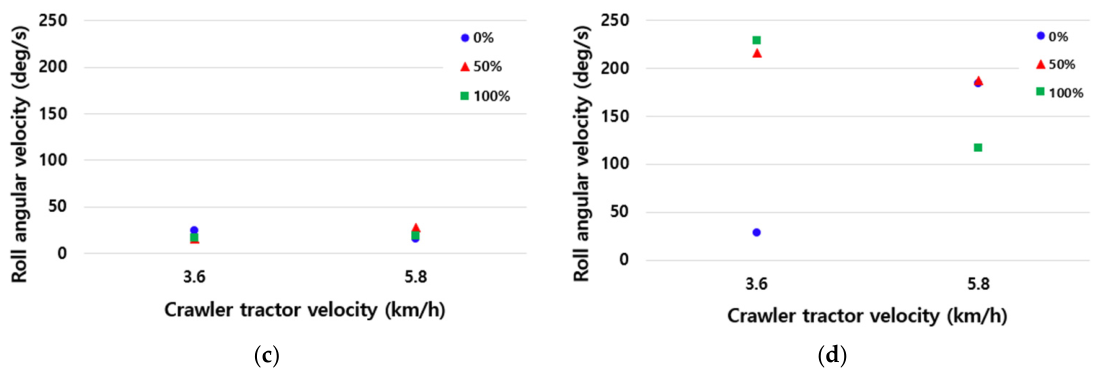
Figure 16 shows the analysis results of roll angular velocity according to driving speed. Under relatively mild conditions (Figure 16a,b), no significant differences were observed between driving speeds. In the low-speed range used in the test, driving speed itself does not act as a major factor, and its influence appears to be limited unless combined with harsher operating conditions. However, as slope angle and obstacle height increased (Figure 16c,d), differences in roll angular velocity became more pronounced. At a slope angle of 30° and an obstacle height of 200 mm, different trends were observed depending on loading conditions. Under the no-load condition, roll angular velocity tended to decrease as driving speed increased, whereas under the 50% and 100% loading conditions, it tended to increase. Under more severe conditions (slope angle: 40°, obstacle height: 300 mm), opposite trends were observed. Specifically, roll angular velocity increased with speed under the no-load condition but decreased under the 50% and 100% loading conditions. This non-monotonic behavior suggests that driving speed influences roll motion through complex interaction effects, rather than acting as an independent variable. Its role becomes more significant when the tractor operates near a reduced-stability state, where small changes in transient input can alter or even reverse the lateral overturning response. In particular, the loading condition can fundamentally alter or reverse the tractor’s response to speed, highlighting its critical role in determining lateral stability under high-risk operating conditions.
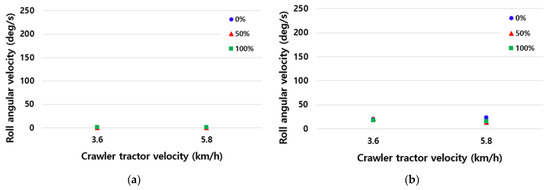
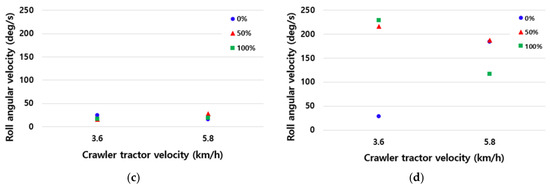
Figure 16.
Roll the angular velocity of the crawler tractor according to driving speed. (a) Slope angle: 0°, obstacle height: 0 mm. (b) Slope angle: 15°, obstacle height: 100 mm. (c) Slope angle: 30°, obstacle height: 200 mm. (d) Slope angle: 40°, obstacle height: 300 mm.
3.3. Statistical Analysis of Contributions to Roll Angular Velocity
To quantitatively analyze the factors affecting the lateral overturning safety of the crawler tractor, a four-way ANOVA was conducted, with slope angle, obstacle height, loading condition, and driving speed defined as independent variables (Table 7). Simulation-based analysis was performed for a total of 264 combinations. Under some conditions, normal driving was not possible because lateral overturning occurred before contact with the obstacle. Since roll angular velocity was evaluated under obstacle contact and traversal conditions, 24 non-drivable cases were excluded, and data from the remaining 240 combinations were used for statistical analysis. In the analysis, roll angular velocity was treated as the dependent variable, and both the main effects of each factor and the interaction effects between pairs of factors were examined. The influence of each factor was evaluated using partial η2, which represents the proportion of total variation explained by a given factor [40]. Because the analysis was based on deterministic simulation data without repeatability error, the results were interpreted primarily in terms of effect size rather than statistical significance. The ANOVA results yielded a modified coefficient of determination of 0.755, indicating that the selected variables provide sufficient explanatory power for variations in roll angular velocity.
Table 7.
Results of the four-way ANOVA for roll angular velocity.
The four-way ANOVA results showed that slope angle had the greatest influence on roll angular velocity, with obstacle height also exhibiting a significant effect. The interaction between slope angle and obstacle height was substantial, indicating that the effect of obstacle height varies depending on slope conditions. Therefore, the impact of obstacles should be evaluated in combination with slope angle rather than as an independent factor. The interaction between slope angle and loading condition was also notable, suggesting that loading condition modifies the sensitivity of roll angular velocity to changes in slope angle. In contrast, both the main and interaction effects of driving speed were relatively limited. Overall, these findings indicate that roll angular velocity is primarily governed by ground geometry factors, particularly slope angle and obstacle height, while loading condition acts as a secondary factor that influences sensitivity under these conditions.
3.4. Ground Slope Angle Inducing Lateral Overturning of a Tractor Due to External Factors
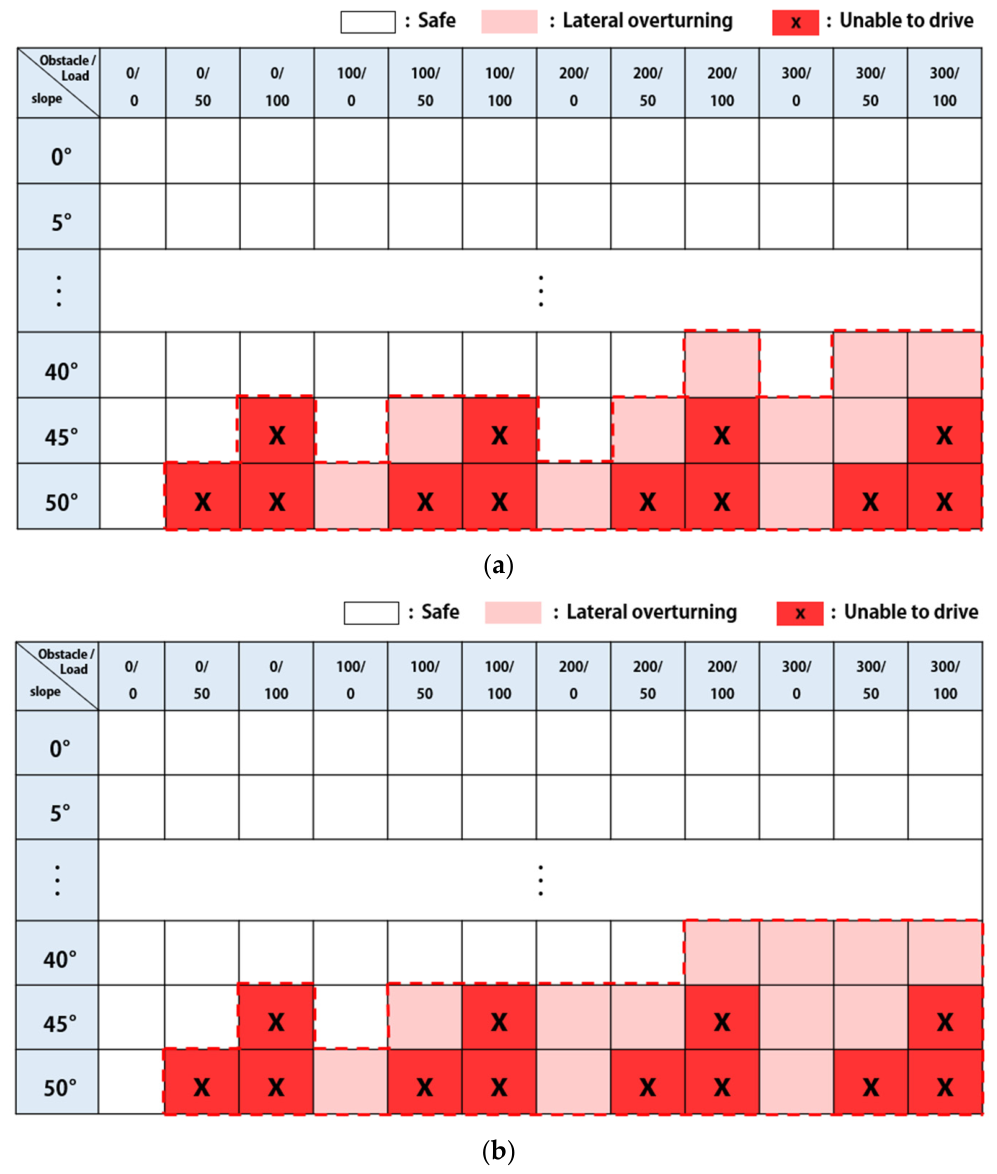
Stability matrices were constructed to more clearly distinguish between transient response and actual instability (Figure 17). In these stability matrices, operating conditions are classified into three states: safe, lateral overturning, and unable to drive. This classification effectively resolves the ambiguity of roll angular velocity by defining the maximum operating limits of the tractor. The research results show that as loading capacity and obstacle height increase, the critical slope angle decreases, expanding the lateral overturning risk zone and the mobility loss zone. At a driving speed of 3.6 km/h, the transition from a stable state to an unstable state occurs gradually with increasing slope angle. In contrast, at 5.8 km/h, unstable zones appear at lower slope angles, and the frequency of incidents where the tractor is unable to drive increases, indicating that instability intensifies at higher speeds. Overall, these matrices clearly visualize stability limits and allow for a direct distinction between transient phenomena and actual overturn thresholds. This representation method integrates real-time sensor data (e.g., IMU-based angular velocity) and terrain information to serve as a practical basis for decision-making in autonomous tractor systems.
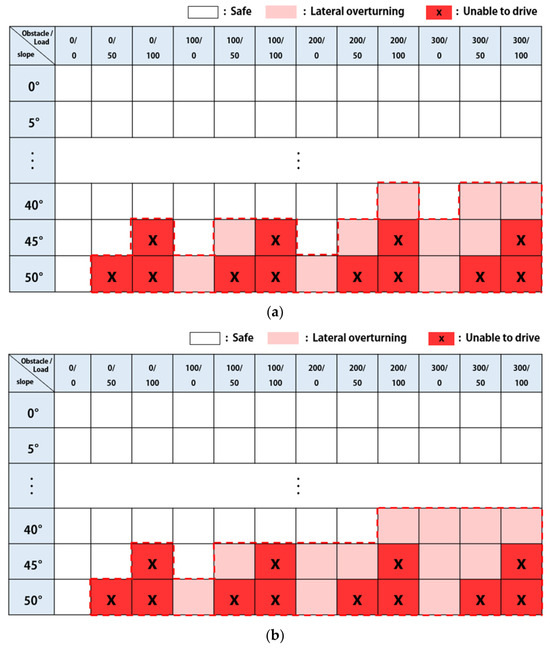
Figure 17.
Stability matrices of critical slope angle as functions of operating parameters. (a) Driving speed of 3.6 km/h. (b) Driving speed of 5.8 km/h.
4. Limitations and Future Work
Given the relatively low-speed operating conditions considered in this study, the results should be interpreted within a quasi-static framework, and the simulation was primarily used to capture transient responses during obstacle interaction rather than to fully represent inertial dynamic behavior. The static model correctly predicts the loading-dependent reduction in geometric stability margin, whereas the simulation shows that obstacle-induced disturbances can trigger earlier and faster overturning development than would be inferred from static considerations alone. This difference indicates that static analysis is suitable for identifying baseline stability limits, while simulation is necessary to evaluate the severity and timing of lateral overturning development during actual travel. Within the relatively low speed range tested, driving speed showed a limited main effect, but its influence became condition-dependent under steeper slopes and higher obstacle inputs. Because the lateral overturning process was not directly validated through field measurements or full-scale experiments, caution is required when extrapolating the numerical results to complex forest environments involving irregular terrain, deformable ground, and additional operational disturbances. This study has some limitations. First, the ground was modeled as a rigid body, and therefore soil deformation, sinkage, and terrain compliance were not considered. Second, the simulations did not include active control strategies or possible operator intervention, which may affect lateral overturning response in actual operations. Future work should focus on extending the present framework toward more realistic forest-operating conditions. In particular, field-based measurements during obstacle crossing and slope travel are needed to further verify the predictive capability of the model. In addition, incorporating deformable terrain models, load movement behavior, and control or stabilization strategies would improve the realism of the analysis. Also, the study will focus on expanding the dataset to include more lateral overturning events under diverse operating conditions to improve the statistical robustness of the model. These efforts would enable the simulation framework to be developed into a more comprehensive and practical tool for predicting and preventing lateral overturning in forestry operations.
5. Conclusions
In this study, a simulation-based analysis was conducted to evaluate the effects of loading conditions on the lateral overturning behavior of an unmanned remote-controlled forestry crawler tractor. A 3D model was constructed based on the actual machine and validated by comparison with measured dimensions, weight distribution, static sidelong falling angle, and turning area radius test results. The error rates for dimensions and weight distribution were less than 5%, and the turning area radius also showed an error of less than 5%. The trend that the static sidelong falling angle exceeded 40° was consistent with the experimental results, confirming the validity of the model. Simulations were performed for a total of 264 conditions, combining three loading levels (0, 50, and 100%), 11 ground slope angles (0° to 50° at 5° intervals), four obstacle heights (0 to 300 mm at 100 mm intervals), and two driving speeds (3.6 and 5.8 km/h). For each condition, the contact zone between the upper track and the obstacle was defined, and the maximum roll angular velocity within this zone was used as a representative safety indicator. The results showed that roll angular velocity increased with slope angle and increased sharply at high slope angles regardless of loading condition. When the crawler tractor was loaded with logs, non-drivable conditions occurred at lower slope angles compared to the no-load condition. These findings indicate that slope angle is the dominant factor influencing roll angular velocity, while loading condition acts as a secondary factor. A four-way ANOVA was conducted to quantitatively examine the effects of the factors. After excluding cases in which lateral overturning occurred before obstacle contact, 240 valid conditions were analyzed. The results showed that slope angle had the greatest influence on roll angular velocity, with obstacle height also being a significant factor. Although the main effect of loading condition was relatively small, its interaction with slope angle was significant, indicating that loading condition affects the sensitivity of lateral overturning to increases in slope angle. In contrast, driving speed had a relatively limited effect. Overall, the lateral overturning of an unmanned remote-controlled crawler tractor is primarily governed by ground geometry conditions, while the loading conditions reduce the threshold for overturning. Although the proposed simulation framework provides useful comparative insight into the effects of loading condition, slope angle, obstacle height, and driving speed on lateral overturning-related motion, further experimental validation of lateral overturning behavior is required before the model can be used as a fully predictive tool for real forest operations. The findings of this study provide foundational data for establishing safety standards and determining appropriate loading limits under various slope conditions in forestry operations.
Author Contributions
Conceptualization, M.-K.J.; Investigation, M.-K.J.; data curation, M.-K.J. and C.-Y.L.; Writing, original draft preparation, M.-K.J.; writing, review and editing, J.-S.N.; visualization, M.-K.J. and C.-Y.L.; supervision, J.-S.N.; project administration, J.-S.N. All authors have read and agreed to the published version of the manuscript.
Funding
This study was carried out with the support of the R&D Program for Forest Science Technology (Project No. RS-2026-2552326) provided by the Korea Forest Service (Korea Forestry Promotion Institute). Also, this study was carried out with the support of ‘R&D Program for Forest Science Technology (2023475A00-2325-BB01)’ provided by Korea Forest Service(Korea Forestry Promotion Institute).
Data Availability Statement
Data is contained within the article.
Conflicts of Interest
The authors declare no conflicts of interest.
References
- Klun, J.; Medved, M. Fatal accidents in forestry in some European countries. Croat. J. For. Eng. J. Theory Appl. For. Eng. 2007, 28, 55–62. [Google Scholar]
- Nam, K.H.; Park, Y.S.; Kim, K.I.; Cho, K.H.; Lee, E.J.; Baek, S.A. A Study on Improvement of Emergency Medical System for forestry accident. J. Korean Soc. Ind. Converg. 2019, 22, 665–671. [Google Scholar] [CrossRef]
- Ghaffariyan, M.R. Analysis of forestry work accidents in five Australian forest companies for the period 2004 to 2014. J. For. Sci. 2016, 62, 545–552. [Google Scholar] [CrossRef]
- Kiraga, S.; Reza, M.N.; Lee, K.H.; Gulandaz, M.A.; Karim, M.R.; Habineza, E.; Kabir, M.S.; Lee, D.H.; Chung, S.O. Vibration and slope harvesting conditions affect real-time vision-based radish volume measurements: Experimental study using a laboratory test bench. J. Biosyst. Eng. 2025, 50, 193–209. [Google Scholar] [CrossRef]
- Mushtaq, S.A.; Gul, A.; Dixit, J. Occupational Health Impacts of Tractor Noise and its Attenuation Through Ergonomic Interventions. J. Biosyst. Eng. 2025, 50, 225–239. [Google Scholar] [CrossRef]
- Uberti, S.; Beltrami, D.; Ferrari, M.; Iora, P. Agricultural tractor bogie axle adoption: Market opportunities and traction and ground pressure improvements through mobility metrics and simulations. J. Terramechanics 2025, 117, 101013. [Google Scholar] [CrossRef]
- Esch, J.H.; Bashford, L.L.; Von Bargen, K.V.; Ekstrom, R.E. Tractive performance comparisons between a rubber belt track and a four-wheel-drive tractor. Trans. ASAE 1990, 33, 1109–1115. [Google Scholar] [CrossRef]
- Duan, L.; Zhang, L.; Kang, K.; Ji, Y.; Mu, X.; Wang, H.; Yang, F. Performance Analysis and Experimental Validation of Small-Radius Slope Steering for Mountainous Crawler Tractors. Agronomy 2025, 15, 1956. [Google Scholar] [CrossRef]
- Chou, T.; Chu, T.W. An improvement in rollover detection of articulated vehicles using the grey system theory. Veh. Syst. Dyn. 2014, 52, 679–703. [Google Scholar] [CrossRef]
- Martell, D.L.; Gunn, E.A.; Weintraub, A. Forest management challenges for operational researchers. Eur. J. Oper. Res. 1998, 104, 1–17. [Google Scholar] [CrossRef]
- Gibson, H.G.; Biller, C.J. Side-slope stability of logging tractors and forwarders. Trans. ASAE 1974, 17, 245–0250. [Google Scholar] [CrossRef]
- Franceschetti, B.; Capacci, E.; Rondelli, V. Effects of rubber tracks on narrow-track tractors on the non-continuous rolling prediction model. J. Agric. Saf. Health 2016, 22, 262–273. [Google Scholar] [CrossRef][Green Version]
- Franceschetti, B.; Rondelli, V.; Capacci, E. Lateral stability performance of articulated narrow-track tractors. Agronomy 2021, 11, 2512. [Google Scholar] [CrossRef]
- Chajkin, A.P.; Yu Dobretsov, R.; Sokolova, V.A.; Teterina, I.A.; Kamenchukov, A.V.; Tikhonov, E.A.; Bazykin, V.I. Mathematical model for assessing lateral stability of articulated tracked vehicles. J. Phys. Conf. Ser. 2021, 2094, 042005. [Google Scholar] [CrossRef]
- Park, H.K.; Kim, K.U.; Kim, J.W.; Song, T.Y.; Park, M.S.; Cho, K.H. Sideways overturning analysis of forwarder using a multibody dynamics analysis program. J. Biosyst. Eng. 2002, 27, 185–194. [Google Scholar] [CrossRef]
- Shim, S.B.; Park, Y.J.; Kim, K.U.; Kim, J.W.; Park, M.S.; Song, T.Y. Computer Simulation of Sideways Overturning of Side-Loaded Mini-Forwarder. J. Biosyst. Eng. 2007, 32, 69–76. [Google Scholar] [CrossRef]
- Manzone, M.; Calvo, A. Incidence of Trailer Frame Structure on Driver’s Safety during Log Transportation. Forests 2017, 8, 456. [Google Scholar] [CrossRef]
- Shadmanovich, I.H.; Abdunabiyevich, S.A. Tractor and vehicle stability. Web Agric. 2025, 3, 25–28. [Google Scholar]
- Jeon, D.; Jung, H.J.; Lee, K.D.; Han, J.; Park, C.; Han, S.; Kim, H. A study of spray volume prediction techniques for variable rate pesticide application using unmanned aerial vehicles. J. Biosyst. Eng. 2025, 50, 21–32. [Google Scholar] [CrossRef]
- Yin, C.; Gao, J.; Xu, G.; Song, J.; Xie, F.; Wu, X.; Wang, K. Key technologies on the rollover protection and anti-rollover control for agricultural tractors. Trans. Chin. Soc. Agric. Eng. 2024, 40, 1–11. [Google Scholar]
- Sun, J.; Meng, C.; Zhang, Y.; Chu, G.; Zhang, Y.; Yang, F.; Liu, Z. Design and physical model experiment of an attitude adjustment device for a crawler tractor in hilly and mountainous regions. Inf. Process. Agric. 2020, 7, 466–478. [Google Scholar] [CrossRef]
- Shafaei, S.M.; Mousazadeh, H. Measuring Strategies Subjected to Three-Point hitch Forces and Moments of Supervised and Robotized Tractor-Implement Systems: Retrospective Review and Analysis of Issues, and Prospective Research Directions. J. Biosyst. Eng. 2026, 51, 7. [Google Scholar] [CrossRef]
- Park, J.H.; Kim, K.M.; Eom, C.D.; Jung, D.J. A study on log diameter classes of Korean softwood log. J. Korean Wood Sci. Technol. 2013, 41, 337–345. [Google Scholar] [CrossRef]
- van der Zee, D.J. Model simplification in manufacturing simulation—Review and framework. Comput. Ind. Eng. 2019, 127, 1056–1067. [Google Scholar] [CrossRef]
- Lysych, M.N. A study of the static lateral stability of a tillage machine-tractor unit on a virtual stand. J. Phys. Conf. Ser. 2020, 1515, 042033. [Google Scholar] [CrossRef]
- OECD. OECD Standard Code for the Official Testing of Agricultural and Forestry Tractor Performance: Code 2; OECD: Paris, France, 2026. [Google Scholar]
- Hu, H.; Song, C.; Feng, F.; Zhu, J. Modeling and simulation analysis of a certain type of tracked vehicle based on RecurDyn. In Third International Conference on Electronic Information Engineering, Big Data, and Computer Technology (EIBDCT 2024); SPIE: Bellingham, WA, USA, 2024; Volume 13181, pp. 954–964. [Google Scholar] [CrossRef]
- Guzzomi, A.L. A revised kineto-static model for Phase I tractor rollover. Biosyst. Eng. 2012, 113, 65–75. [Google Scholar] [CrossRef]
- Li, Z.; Mitsuoka, M.; Inoue, E.; Okayasu, T.; Hirai, Y.; Zhu, Z. Prediction of tractor sideslipping behavior using a quasi–static model. J. Fac. Agric. Kyushu Univ. 2015, 60, 215–218. [Google Scholar] [CrossRef]
- Black, S.H.; Taylor, D.L. Simulation of Off-Road Motorcycle Ride Dynamics; No. 790261; SAE Technical Paper; SAE: Warrendale, PA, USA, 1979. [Google Scholar]
- Jang, S.; Kim, J.; Choi, H.; Kim, Y.; Oh, S.; Lim, H.; Kim, T. Development of Parasol Device at Convenience Harvest Product for Chilli and Bare Ground Vegetable. In Proceedings of the Korean Society for Agricultural Machinery Conference; Korean Society for Agricultural Machinery: Suwon, Republic of Korea, 2017; p. 64. Available online: https://kiss.kstudy.com/Detail/Ar?key=3480969 (accessed on 16 January 2024).
- Lee, C.S. Mechanization technology for coherent garlic production. Korean J. Bio-Environ. Control 2002, 15, 43–49. [Google Scholar]
- Chang, S.W.; Kim, H.D.; Yi, E.S.; Rho, Y.T. Incidence of Phytophthora rot caused by Phytophthora capsici Leon. in squash field and cultivar resistance. Korean J. Hortic. Sci. Technol. 2008, 26, 484–489. [Google Scholar]
- Li, Z.; Mitsuoka, M.; Inoue, E.; Okayasu, T.; Hirai, Y. Dynamic analysis of agricultural wheel tractor driving on uneven surface under the influences of speed and slope angle. J. Fac. Agric. 2014, 59, 339–343. [Google Scholar] [CrossRef]
- Nazim, A.; Kondrát, M.; Zidek, K.; Pitel, J. Methodology of Object Reconstruction by Photogrammetry and Structured-Light Scanning for Industrial 3D Visualisation. Sensors 2025, 25, 7177. [Google Scholar] [CrossRef] [PubMed]
- Jang, M.K.; Hwang, S.J.; Kim, J.H.; Nam, J.S. Overturning and rollover characteristics of a tractor through dynamic simulations: Effect of slope angle and obstacles on a hard surface. Biosyst. Eng. 2022, 219, 11–24. [Google Scholar] [CrossRef]
- Karaca, M.; Carabin, G.; Mazzetto, F. Evaluating implement-induced CoG shifts on tractor rollover stability: A multibody dynamics and experimental study across different machine orientations. Comput. Electron. Agric. 2026, 240, 111174. [Google Scholar] [CrossRef]
- Lee, J.; Kang, S.; Han, Y.; Son, J.; Ha, Y. Comparative Analysis of Static Rollover Stability Between Conventional and Electric Tractor. Agriculture 2025, 15, 2099. [Google Scholar] [CrossRef]
- Yang, Y.J.; Jang, M.K.; Nam, J.S. Roll Angular Velocity and Lateral Overturning Tendency of a Small-Tracked Forestry Tractor Under No-Sideslip Dynamic Driving Conditions. Forests 2025, 16, 1568. [Google Scholar] [CrossRef]
- Lakens, D. Calculating and reporting effect sizes to facilitate cumulative science: A practical primer for t-tests and ANOVAs. Front. Psychol. 2013, 4, 62627. [Google Scholar] [CrossRef] [PubMed]

Disclaimer/Publisher’s Note: The statements, opinions and data contained in all publications are solely those of the individual author(s) and contributor(s) and not of MDPI and/or the editor(s). MDPI and/or the editor(s) disclaim responsibility for any injury to people or property resulting from any ideas, methods, instructions or products referred to in the content. |
© 2026 by the authors. Licensee MDPI, Basel, Switzerland. This article is an open access article distributed under the terms and conditions of the Creative Commons Attribution (CC BY) license.