


Abstract
(1) Background: The recent decade appears to be the hottest since the beginning of modern measurements. Changes in climate patterns related to extreme events and disturbances in forest ecosystems are well documented. Six prominent protected areas (PAs), mountainous forest ecosystems in Serbia, were assessed from the perspective of species potential distribution and vulnerability. (2) Methods: Seven different machine learning models were employed, evaluated using AUC, the maximum F-measure, and TSS and joined into an ensemble model for each of the eight tree species/groups taken from the National Forest Inventory. Representatives from four groups of environmental variables were included: 1. climate (Ellenberg’s Climate Quotient), 2. soil (soil organic carbon), 3. topography (elevation), and 4. remotely sensed indices (NDVI). Future climate was derived from four scenarios (SSP1-2.6, SSP2-4.5, SSP3-7.0, and SSP5-8.5). Stable/gain/loss areas and species vulnerability were calculated with a focus on the end of the 21st century. (3) Results: By the 2090s, generally, contraction of Silver fir, Norway spruce, and European beech is expected, together with the promotion of Downy oak and Sessile oak, in all climate scenarios at all PAs. Two high-mountain PAs expect to see promotions in average forest suitability, one PA both a promotion and a reduction in two scenarios, and three PAs reductions in forest ecosystems in general. (4) Conclusions: National parks “Kopaonik” and “Tara” appear to be the least endangered, followed by “Golija”, while “Stara planina”, “Djerdap”, and “Fruska gora” are expected to experience overall reductions in forest habitats.
Keywords:
thermophilous oaks; mesophilous broadleaves; conifers; Random Forest; Naive Bayes; XGBoost 1. Introduction
A decade-long period of consistently record-high annual temperatures globally, as well as in Serbia, coupled with events of more occurrent forest decline and dieback have put great pressure on forest ecosystems, forestry, and society. The temperature in summer of 2025 in Serbia was about 2 degrees above the average for 1991–2020 [1]. These changes further intensify climate-related pressures on forest ecosystems, ecosystem services, and forestry practice. Alterations in temperature and precipitation regimes related to climate change are key drivers of forest disturbance, including drought stress, pest and disease outbreaks, windthrows, ice damage, and wildfire occurrence [2,3].
Southeast Europe occupies a transitional biogeographical position at the interface with the Mediterranean Basin, a region internationally recognized as a major biodiversity hotspot. At the same time, the Mediterranean has been identified as one of the world’s prominent climate change hotspots, where projected warming and drying trends exceed global averages [3,4,5]. These characteristics (high biodiversity value combined with high vulnerability to climate change) make forest ecosystems in Southeast Europe particularly sensitive to ongoing and future climate change, especially along the southern and lower-elevation distribution limits of many temperate and boreal tree species [6,7].
In Europe, these impacts on forest ecosystems are projected to intensify during the 21st century, particularly in southern and southeastern regions, where warming and drying trends are expected to be most pronounced [3,8]. Recent regional analyses further highlight increasing hydroclimatic variability in Serbia, with changes in precipitation extremes and seasonal water availability that are highly important for forest stability and long-term ecosystem functioning [9].
In Serbia, these processes are increasingly supported by empirical evidence. Recent research has shown forest decline linked to prolonged droughts and rising temperatures, particularly affecting lowland oaks and coniferous species such as Norway spruce, which is highly sensitive to water stress outside its optimal climatic range [10].
Protected areas are crucial in biodiversity conservation as they reduce the direct anthropogenic influence on ecosystems. However, they do not prevent exposure to climate change, and their effectiveness in maintaining current species compositions under projected warming scenarios is questionable [11]. In Serbia, protected forest areas are governed by a national legal framework defined by the Law on Nature Protection and the Law on National Parks, which regulate protection regimes, management responsibilities, and conservation objectives [12,13]. The protected forest ecosystems chosen for this study (four national parks: Kopaonik, Tara, Djerdap, and Fruška gora; two nature parks: Golija and Stara Planina), to be designated national parks later, represent some of the most ecologically valuable and climate-diverse mountain forest landscapes in the country. In addition, the Golija–Studenica area holds international recognition as a UNESCO Man and the Biosphere Reserve, emphasizing its conservation relevance beyond the national context (UNESCO, 2024) [14].
Despite their protected status, increasing evidence suggests that protected areas are not resistant to the impacts of climate change. Across Europe, climate exposure within protected areas is projected to increase substantially, potentially undermining their effectiveness in conserving current species compositions and ecosystem functions [11]. In forest ecosystems, climate-driven shifts in habitat suitability are expected to promote thermophilous species while constraining cold-adapted and mesophilous taxa, particularly at the southern distribution margins [15]. Such patterns are in line with recent observations in Serbian forests, where drought-sensitive species show increasing signs of decline, while more drought-tolerant taxa are expected to gain a competitive advantage under future climates [10].
Species distribution modeling (SDM) has become a widely applied approach for assessing climate change impacts on species ranges, habitat suitability, and ecosystem vulnerability. Advances in machine learning and ensemble modeling techniques have improved predictive performance and enabled the integration of multiple algorithms, environmental predictors, and climate scenarios [16,17]. In the context of protected areas, SDMs can provide valuable insights into potential species and ecosystem-level responses to climate change, which can support adaptive conservation planning and forest management under uncertain future conditions [11]. The aims of this study were
- To quantify the baseline and future habitat suitability, and spatial distribution patterns of eight ecologically and economically important forest tree species (or species groups) within six protected forest ecosystems in Serbia using an ensemble species distribution modeling framework based on multiple machine learning algorithms and National Forest Inventory data;
- To evaluate the vulnerability of eight tree species by quantifying projected spatial patterns of habitat stability, gain, and loss under four Shared Socioeconomic Pathway (SSP) climate scenarios towards the end of the 21st century, in order to identify protected areas and species most at risk and to support adaptive forest conservation and management strategies.
2. Materials and Methods
2.1. Protected Areas
Six prominent forest ecosystems protected by the Nature Conservation Law in Serbia (national parks “Kopaonik”, “Tara”, “Djerdap”, “Fruska gora”, and “Stara planina” (in the process of designation) and nature park “Golija”) (Table 1, and Figure 1 and Figure 2) were assessed from the perspective of species habitat suitability and potential alterations in species composition in the context of optimal habitats within these ecosystems across scenarios and future periods.
Table 1.
Main characteristics of the six protected forest areas included in this study.
Figure 1.
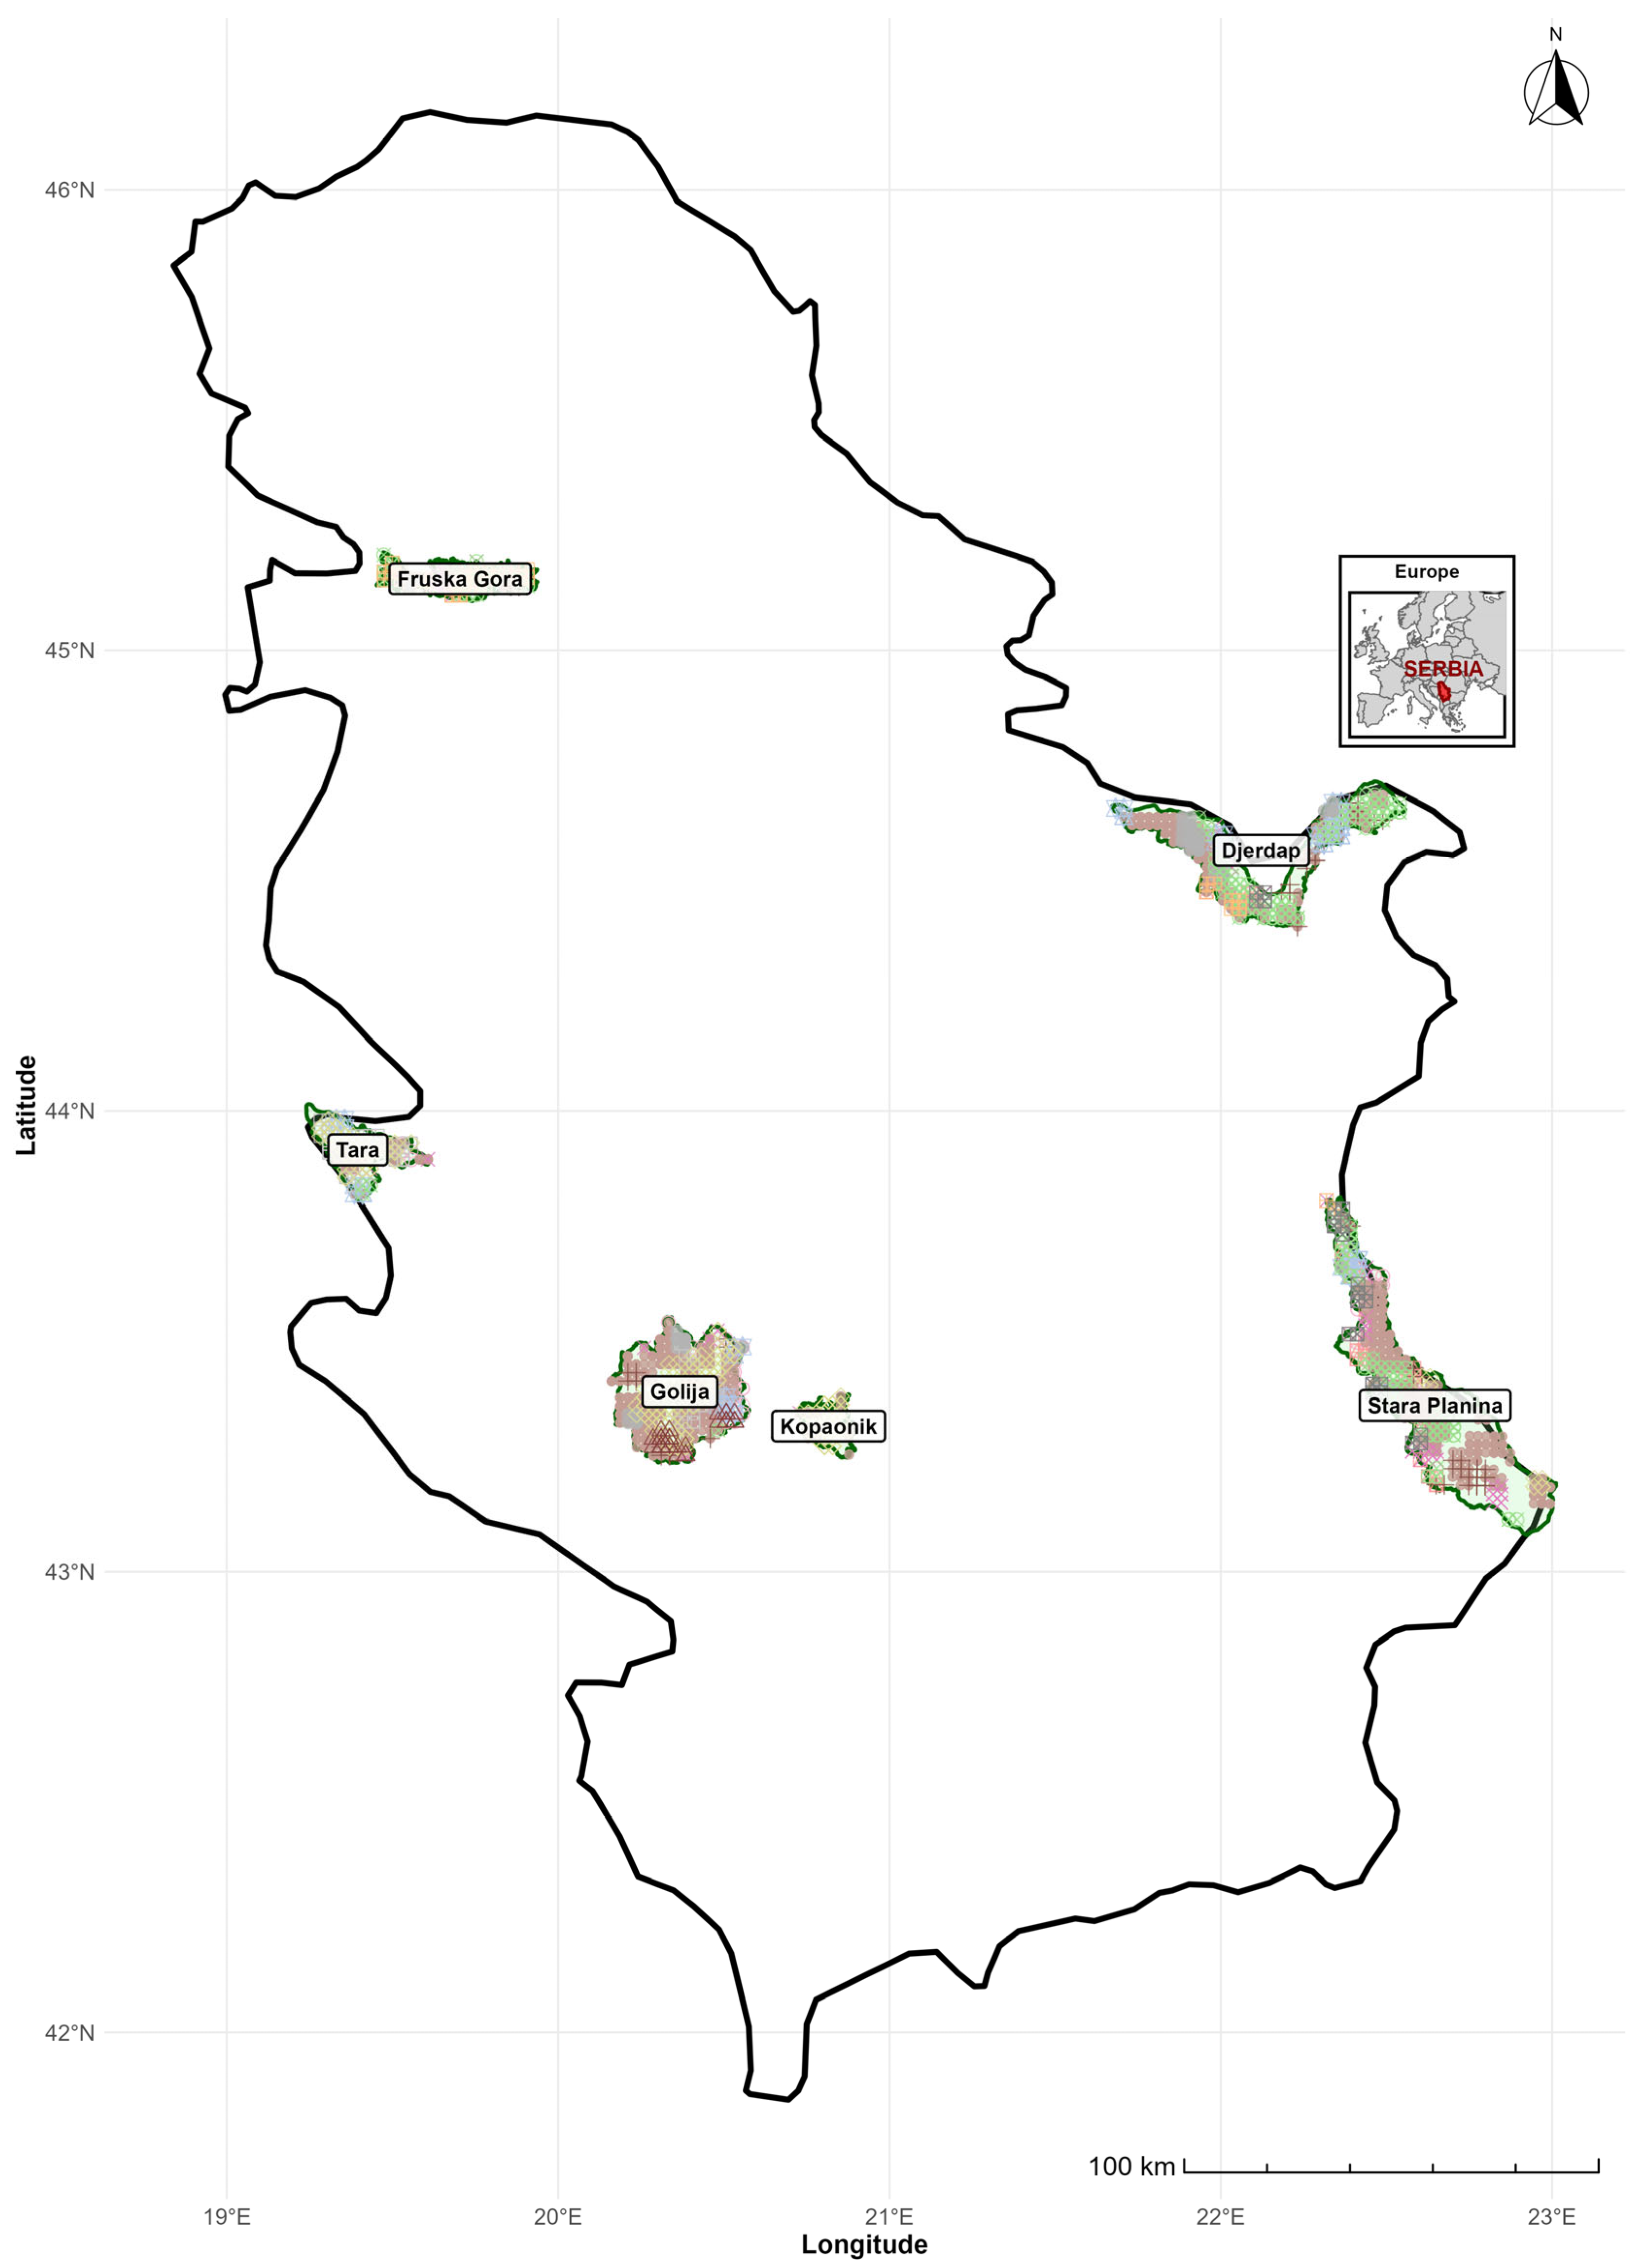
Geographical location of six prominent forest ecosystems in the Republic of Serbia protected by the Nature Conservation Law (national parks “Kopaonik”, “Tara”, “Djerdap”, “Fruska gora”, and “Stara planina” (in the process of designation) and nature park “Golija”).
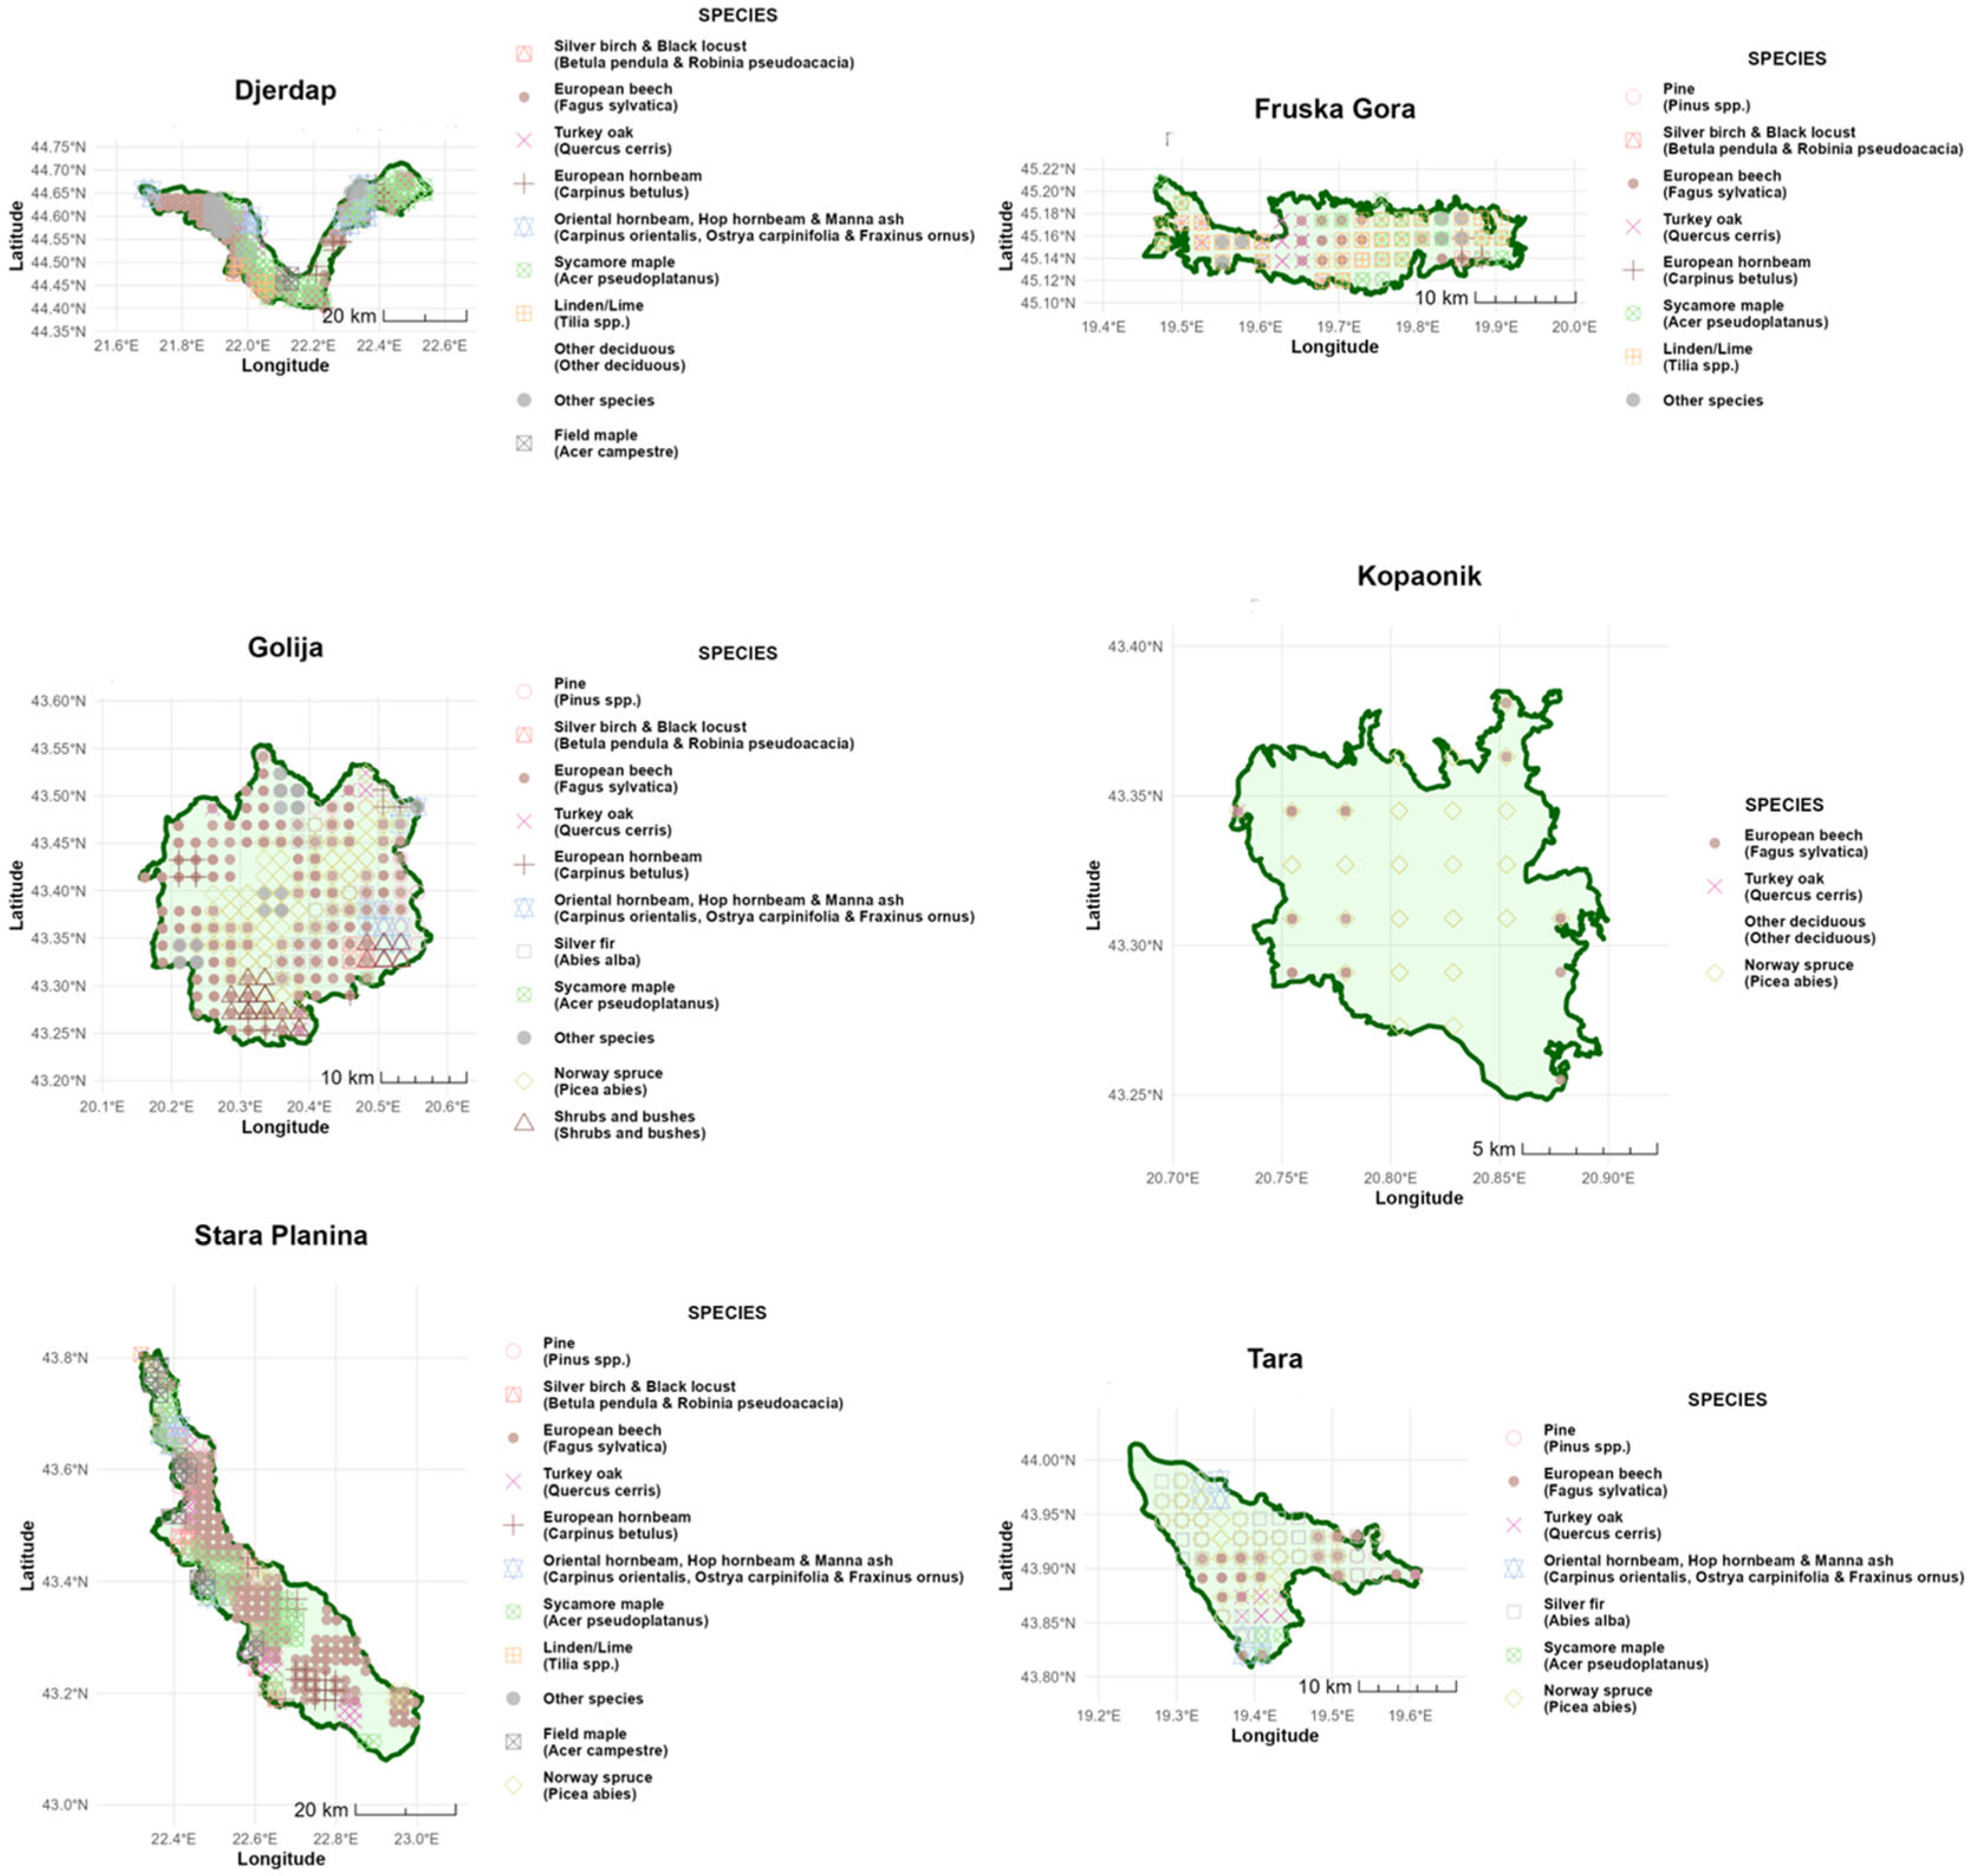
Figure 2.
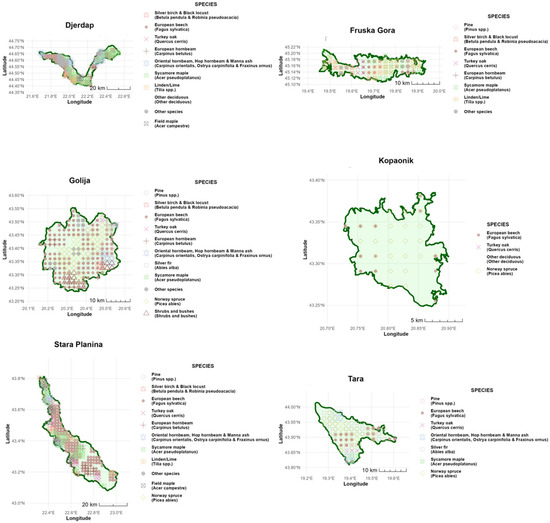
Species distribution according to the National Forest Inventory (2 × 2 km resolution) of six prominent forest ecosystems protected by the Nature Conservation Law in Serbia (national parks “Kopaonik”, “Tara”, “Djerdap”, “Fruska gora”, and “Stara planina” (in the process of designation) and nature park “Golija”).
2.2. Tree Species
The eight species/tree groups European beech (Fagus sylvatica), Norway spruce (Picea abies), Silver fir (Abies alba), Sessile oak (Quercus petrea), European hornebeam (Carpinus betulus), Downy oak (Quercus pubescens), Lime (Tilia spp.), and Ash and Maple (Fraxinus spp. and Acer spp.) selected from the Serbian National Forest Inventory (NFI) were analyzed as the most abundant or important constituents of forest ecosystems [18]. Importantly, the NFI covers the full national territory of Serbia within a systematic 2 × 2 km grid. Presence data are therefore not limited to the six protected areas but represent the species distribution across the entire country. Within NFI, real plots are nested at nodes of the grid, so for the presence data, exact coordinates were taken for the appearance of each species (not gridded interpolation). No true absences were available from the NFI. Accordingly, background points (pseudo-absences) were generated by random sampling across Serbia’s forested land mask, excluding water bodies, at a 1:1 ratio. After taking exact coordinate from the NFI points and overlapping them with climate data grid (30 arc-sec, effectively ~650–700 m east–west and ~920 m north–south for Serbia), final presence point grids were defined for the eight species. The species with the lowest presence was Downy oak, and the species with the highest was European beech (Table 2).
Table 2.
Presence, background, and events per variable (EPVs) of eight tree species/tree groups within the WorldClim grid (30 arc-sec) according to the Serbian National Forest Inventory used for species model creation.
Importantly, the NFI data cover the full national territory of Serbia on a systematic 2 × 2 km grid; the six protected areas were used exclusively as spatial units for extracting and interpreting model projections, not as the training extent.
2.3. Variable Selection
Six groups of predictors were formed, (i) climate variables (19 WorldClim bioclimatic variables), (ii) topography (23 derivatives), (iii) soil (12 layers from SoilGrids v2.0), (iv) remote sensing spectral indices, (v) remote sensing phenological metrics, and (vi) hydrological indices, totaling 140 candidate variables. Variable selection followed a sequential screening procedure applied exclusively to training data, with the held-out test set never involved at any stage: (1) ecological pre-screening variables with known ecological redundancy (e.g., BIO2–BIO11 subsets that are algebraic combinations of temperature) were grouped and one ecologically meaningful representative was retained per group; (2) correlation filtering, with a Pearson |r| > 0.7 pairwise threshold, was applied to all remaining variable pairs; (3) variables with Variance Inflation Factor (VIF) > 10 were removed; (4) LASSO screening, glmnet (alpha = 1), was applied to candidate subsets; and (5) cross-validated performance was compared, where EQ was identified as consistently superior to any bioclimatic variable combination in terms of cross-validated AUC across species, operationally defining ‘consistency’, which led to its selection as the sole climate predictor. The final four variables (EQ, elevation, SOC, and NDVI) represent ecologically distinct axes (climate aridity, topographic position, soil fertility, and vegetation productivity) with minimal redundancy (Table 3). The EPV criterion was satisfied for all species: minimum EPV = 93/4 ≈ 23 (Downy oak), well above the recommended threshold of 10 [28]. Framework testing confirmed that five or more variables consistently reduced model performance and increased overfitting indicators, justifying the parsimonious four-variable design.
Table 3.
Selected variables for species distribution modeling (SDM) resampled to the WorldClim grid (30 arc-sec).
2.4. Climate Data
Climate data (past and future scenarios) were taken from the WorldClim database (https://www.worldclim.org/ 2.1 dataset). Soil data were taken from the SoilGrids database (https://soilgrids.org/ 250 m, v2.0) for the four socioeconomic pathway (SSP) scenarios (Table 4) and four time periods (2021–2040, 2041–2060, 2061–2080, and 2081–2100).
Table 4.
Characteristics of the four socioeconomic pathway (SSP) scenarios used in this modeling study [29].
Ellenberg’s Climate Quotient (EQ) was calculated according to the formula for baseline climate and future scenarios:
where T_July = the mean temperature of the warmest month (°C), July, for the Northern Hemisphere and P_annual = the annual precipitation sum (mm). The rationale for using EQ was its confirmed capability to extrapolate in novel climates [6], its ability to capture aridity, and its wide use in European forest ecology [30].
EQ = (T_July/P_annual) × 1000
2.5. Topography, Soil, and Remotely Sensed Index
Using an “expert knowledge approach” besides EQ, we selected elevation from the topography group, which is, in a way, a proxy for temperature, moisture, and growing season and which is unaltered by climate change. From the soil group, we selected soil organic carbon (SOC) as an integrator of fertility and capacity to hold water. Although SOC may change under climate change, SOC dynamics in established forest soils operate on decadal-to-centennial timescales broadly comparable to our projection horizon; we therefore treat it as a time-invariant edaphic predictor and acknowledge this as a limitation (see Section 4.5). The fourth variable taken from the remote sensing spectral indices group was Normalized Difference Vegetation Index (NDVI), an annual composite (growing-season maximum, year 2020) derived from Sentinel-2, used as a proxy for site productivity and as an integrated expression of climate, soil, and topographic conditions. NDVI was treated as a time-invariant site-productivity proxy in future projections, a recognized approach.
2.6. Statistical Methods
Seven machine learning (ML) algorithms were used: (i) Random Forest (RF) [31], (ii) Extreme Gradient Boosting (XGBoost) [32], (iii) Generalized Linear Model with LASSO (GLMNET) [33], (iv) Ridge Regression (RIDGE) [34], (v) Naive Bayes (NAIVE_BAYES) [35], (vi) Support Vector Machine (SVM) [36], and (vii) Classification Tree (RPART) [37]. The packages that were implemented for modeling through R statistical framework (version 4.5.2) were mlr3, mlr3learners, terra, data.table, ggplot2, and viridis. The ensemble approach was used to create the final probability (average of predictions from all models). Threshold selections were acquired by taking the mean of seven individual ML model thresholds, where each model’s threshold came from its maximized F-measure on test data (as suggested by Leroy et al. [17], who argued that the F-measure is more robust than traditional discrimination metrics like TSS when models are trained on presence-biased data).
During the projections to future climate scenarios, predictor values (EQ, elevation, SOC, and NDVI) were clamped [38] to the extent of the calibration data to avoid extrapolation into a novel climate space beyond the environmental conditions represented in the training set.
An Area Under ROC Curve (AUC) was used as a threshold-independent discrimination metric, while classification performance was evaluated using the maximum F-measure (MaxF, obtained by optimizing the probability threshold) (2)–(4) and True Skill Statistic (TSS) computed at a fixed threshold of 0.5.
where F1 score is the F-measure, P is precision, R is recall, TP is true positive, FP is false positive, and FN is false negative.
F1 = 2 × P × R/(P + R)
P = TP/(TP + FP)
R = TP/(TP + FN)
Model fitting followed a two-stage procedure. First, a global 70/30 stratified random split separated a held-out test set (30%) from the training set (70%). Second, the training set was used for 5-fold spatial block cross-validation (mlr3spatiotempcv package), with blocks defined by k-means clustering on geographic coordinates, ensuring spatial independence between folds to tune the algorithm hyperparameters via Bayesian optimization, implemented for RF and XGBoost on three focal species (European beech, Norway spruce, and Sessile oak). Optimal parameters were then propagated to the remaining six species. Final performance metrics (AUC, MaxF, and TSS@0.5) and thresholds were derived exclusively on the held-out 30% test set, which was never used during model selection or hyperparameter tuning. An F-measure threshold ≥0.40 for model selection was applied based on training-fold performance only.
Background (pseudo-absence) points were sampled randomly across Serbia’s forested land mask (water bodies excluded via a water exclusion raster) at a 1:1 ratio with species presences. Binary maps for all species were created. Loss, gain, stable, and unsuitable values for each species and each PA were calculated.
GenAI (Claude.ai 4.5) was used to create the R code used in the modeling methodology and for figure preparation, especially for solving numerous errors while testing.
3. Results
3.1. Climate Change Across PAs
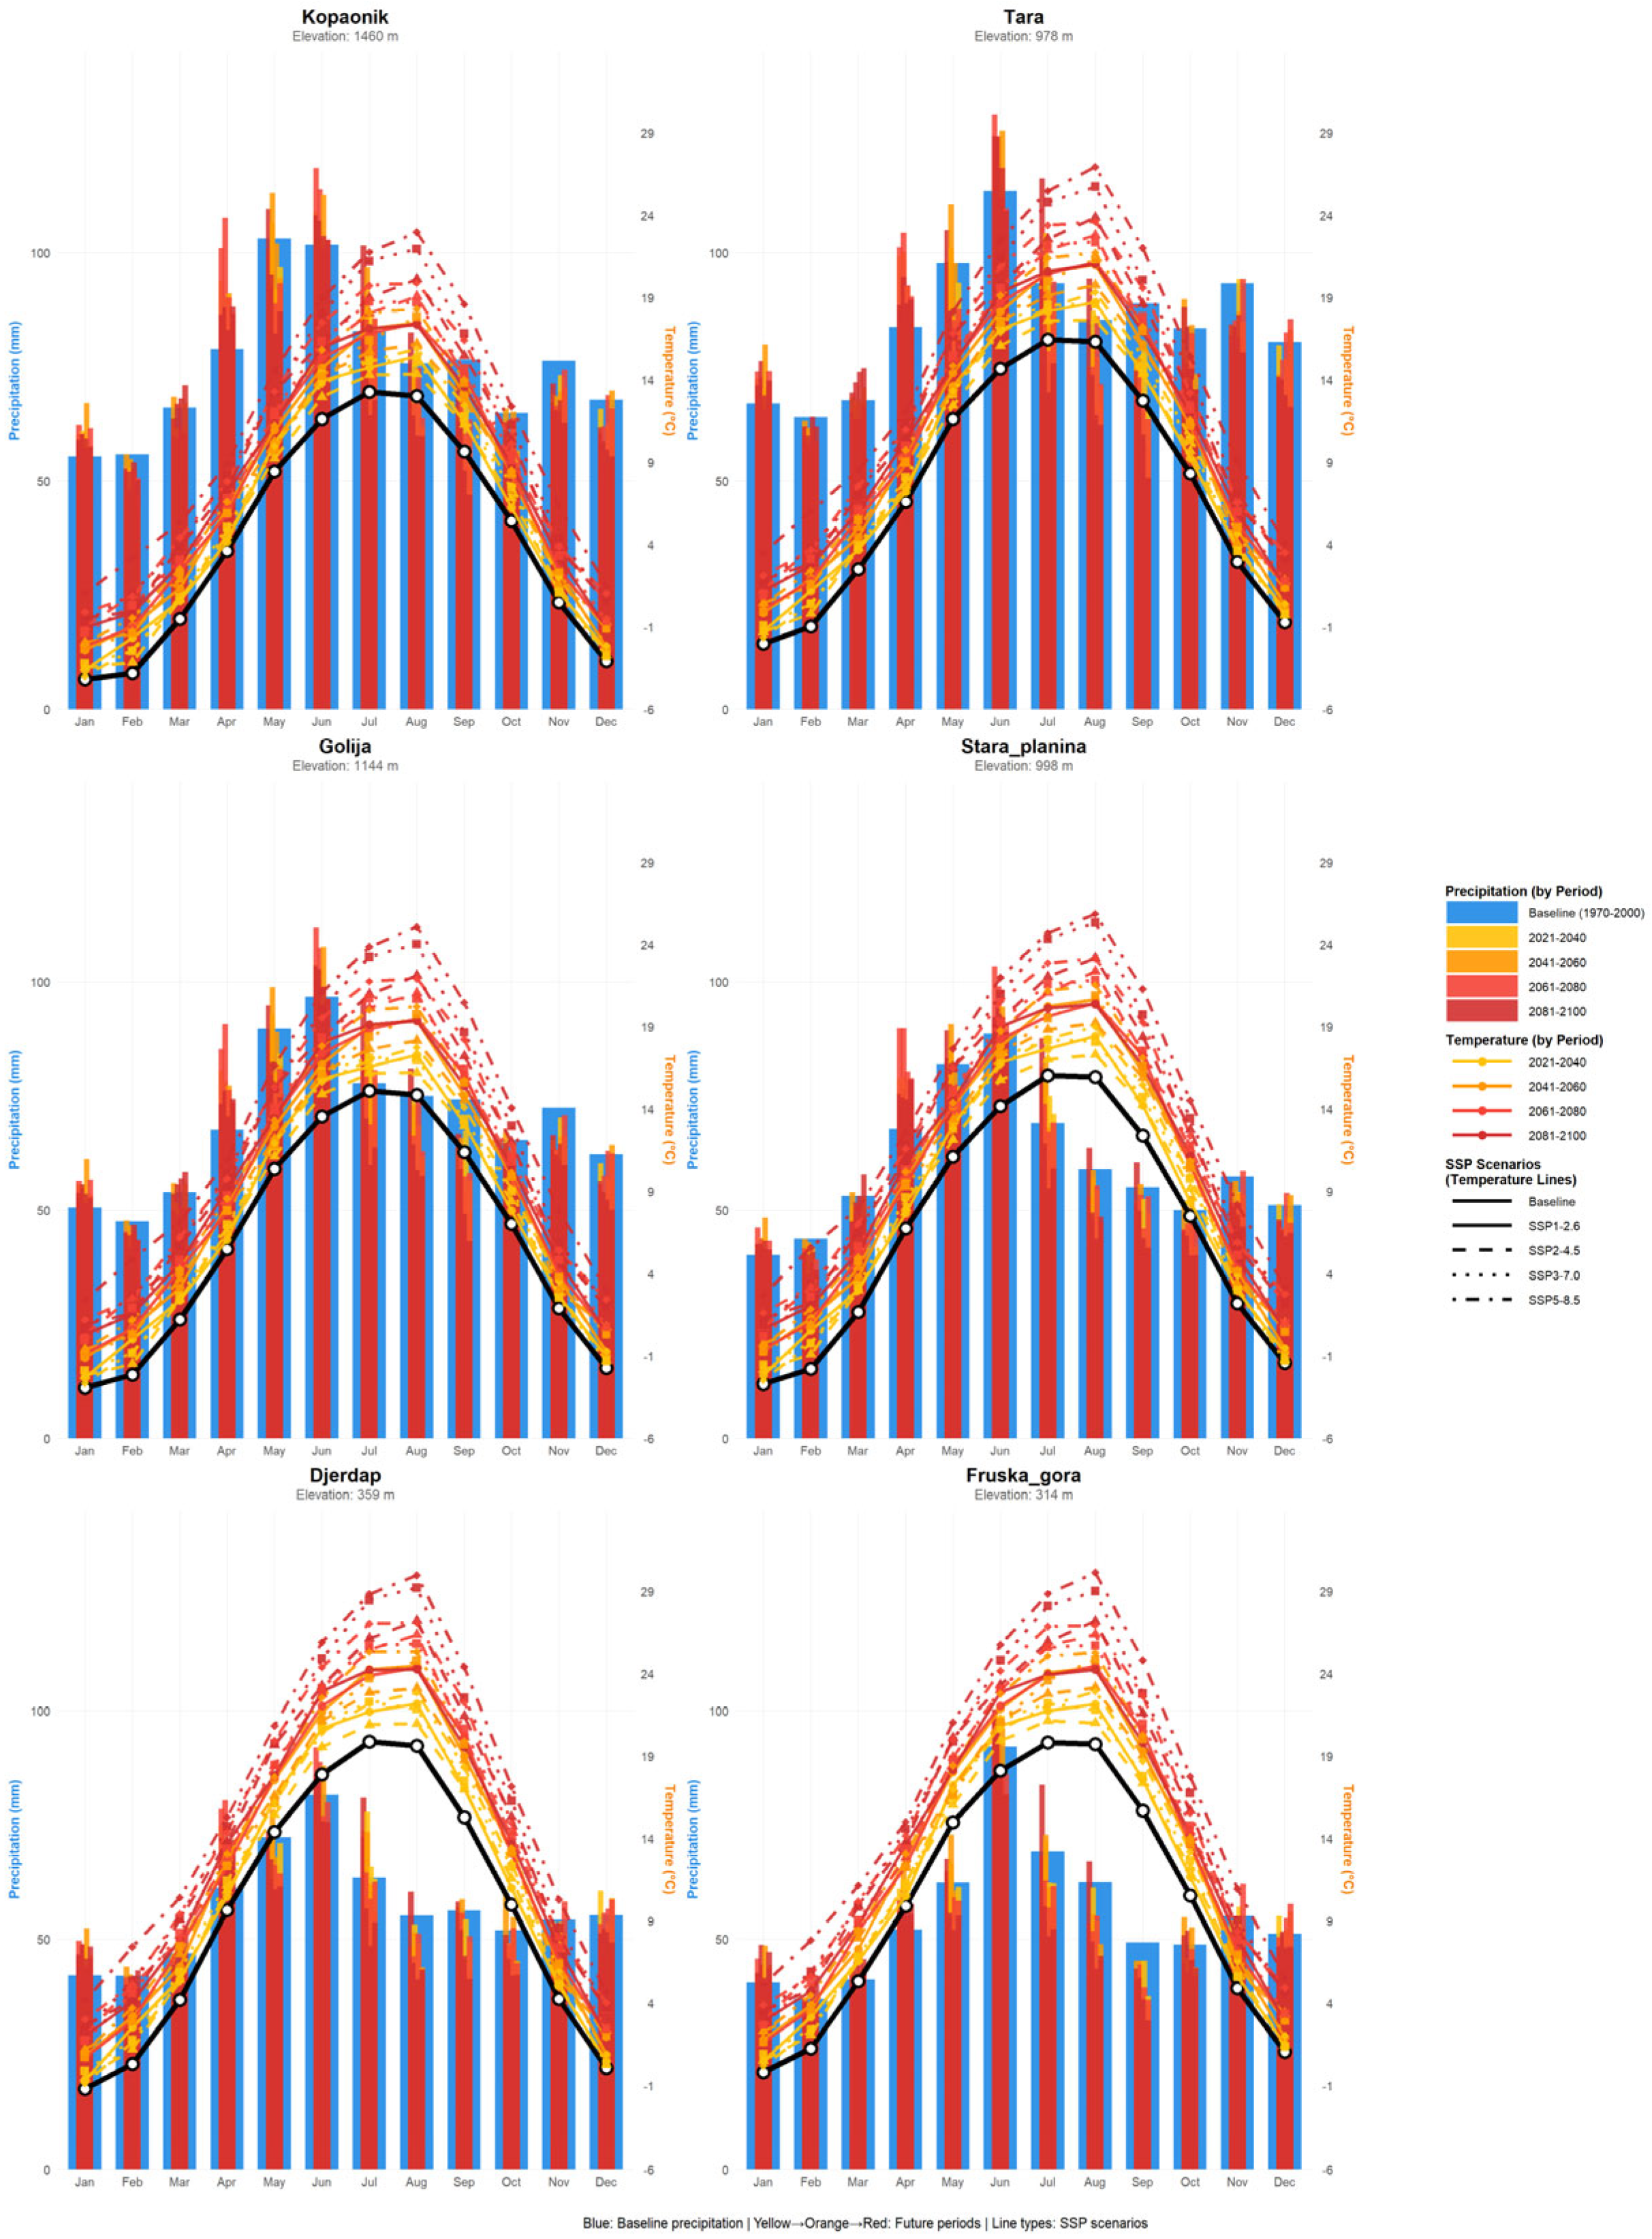
All protected areas exhibit consistent and progressive warming across scenarios (Table 5 and Figure 3). Increases are already visible in the near future (2021–2040), with increase of about +1.0 to +1.9 °C. That pattern continues toward the end of the century. By 2081–2100, temperature increases reach approximately +3.4 to +3.8 °C under SSP1-2.6, about +4.6 to +5.0 °C under SSP2-4.5, around +5.5 to +5.9 °C under SSP3-7.0, and up to about +6.8 to +7.1 °C under SSP5-8.5. Responses were uniform among protected areas within the same scenario. On the other hand, precipitation shows predominantly negative changes (Table 6 and Figure 3), with moderate decline in the mid-term and larger decreases toward the end of the century. Only limited and site-specific increases are projected in some mid-century periods under the low-emission scenario, whereas late-century projections under SSP3-7.0 and SSP5-8.5 are followed by strong decreases in precipitation, from about −8% to −12%. Overall, the combined signal points to a future climate characterized by substantially warmer and generally drier conditions across all protected areas.
Table 5.
Annual mean temperature and annual temperature change relative to baseline (in brackets) (°C) for six Serbian protected areas across four periods and four scenarios.
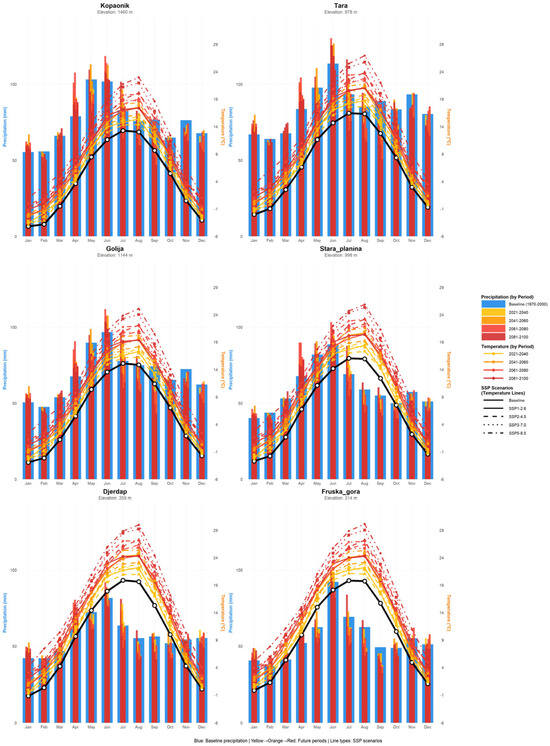
Figure 3.
Climate diagrams for six Serbian protected areas showing baseline (1970-2000) and future projections (2021–2100) under four SSP scenarios. The blue bars represent baseline precipitation, the colored bars future precipitation by time period, the black line baseline temperature, and the colored lines future temperature projections. The color indicates the time period (yellow: 2021–2040; orange: 2041–2060; red: 2061–2080; and dark red: 2081–2100), while the line type indicates the SSP scenario (data from the CMCC-ESM2 model and the WorldClim database).
Table 6.
Annual total precipitation and precipitation change relative to baseline (in brackets) (mm) for six Serbian protected areas across four periods and four scenarios.
3.2. Model Evaluation
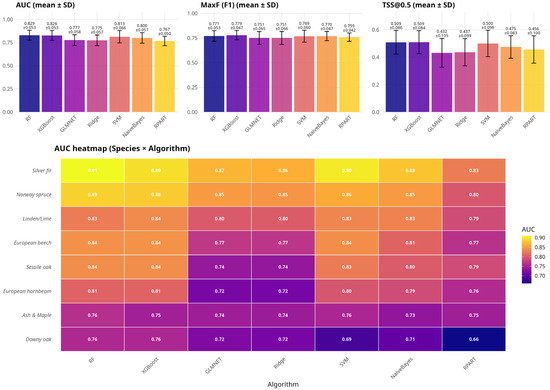
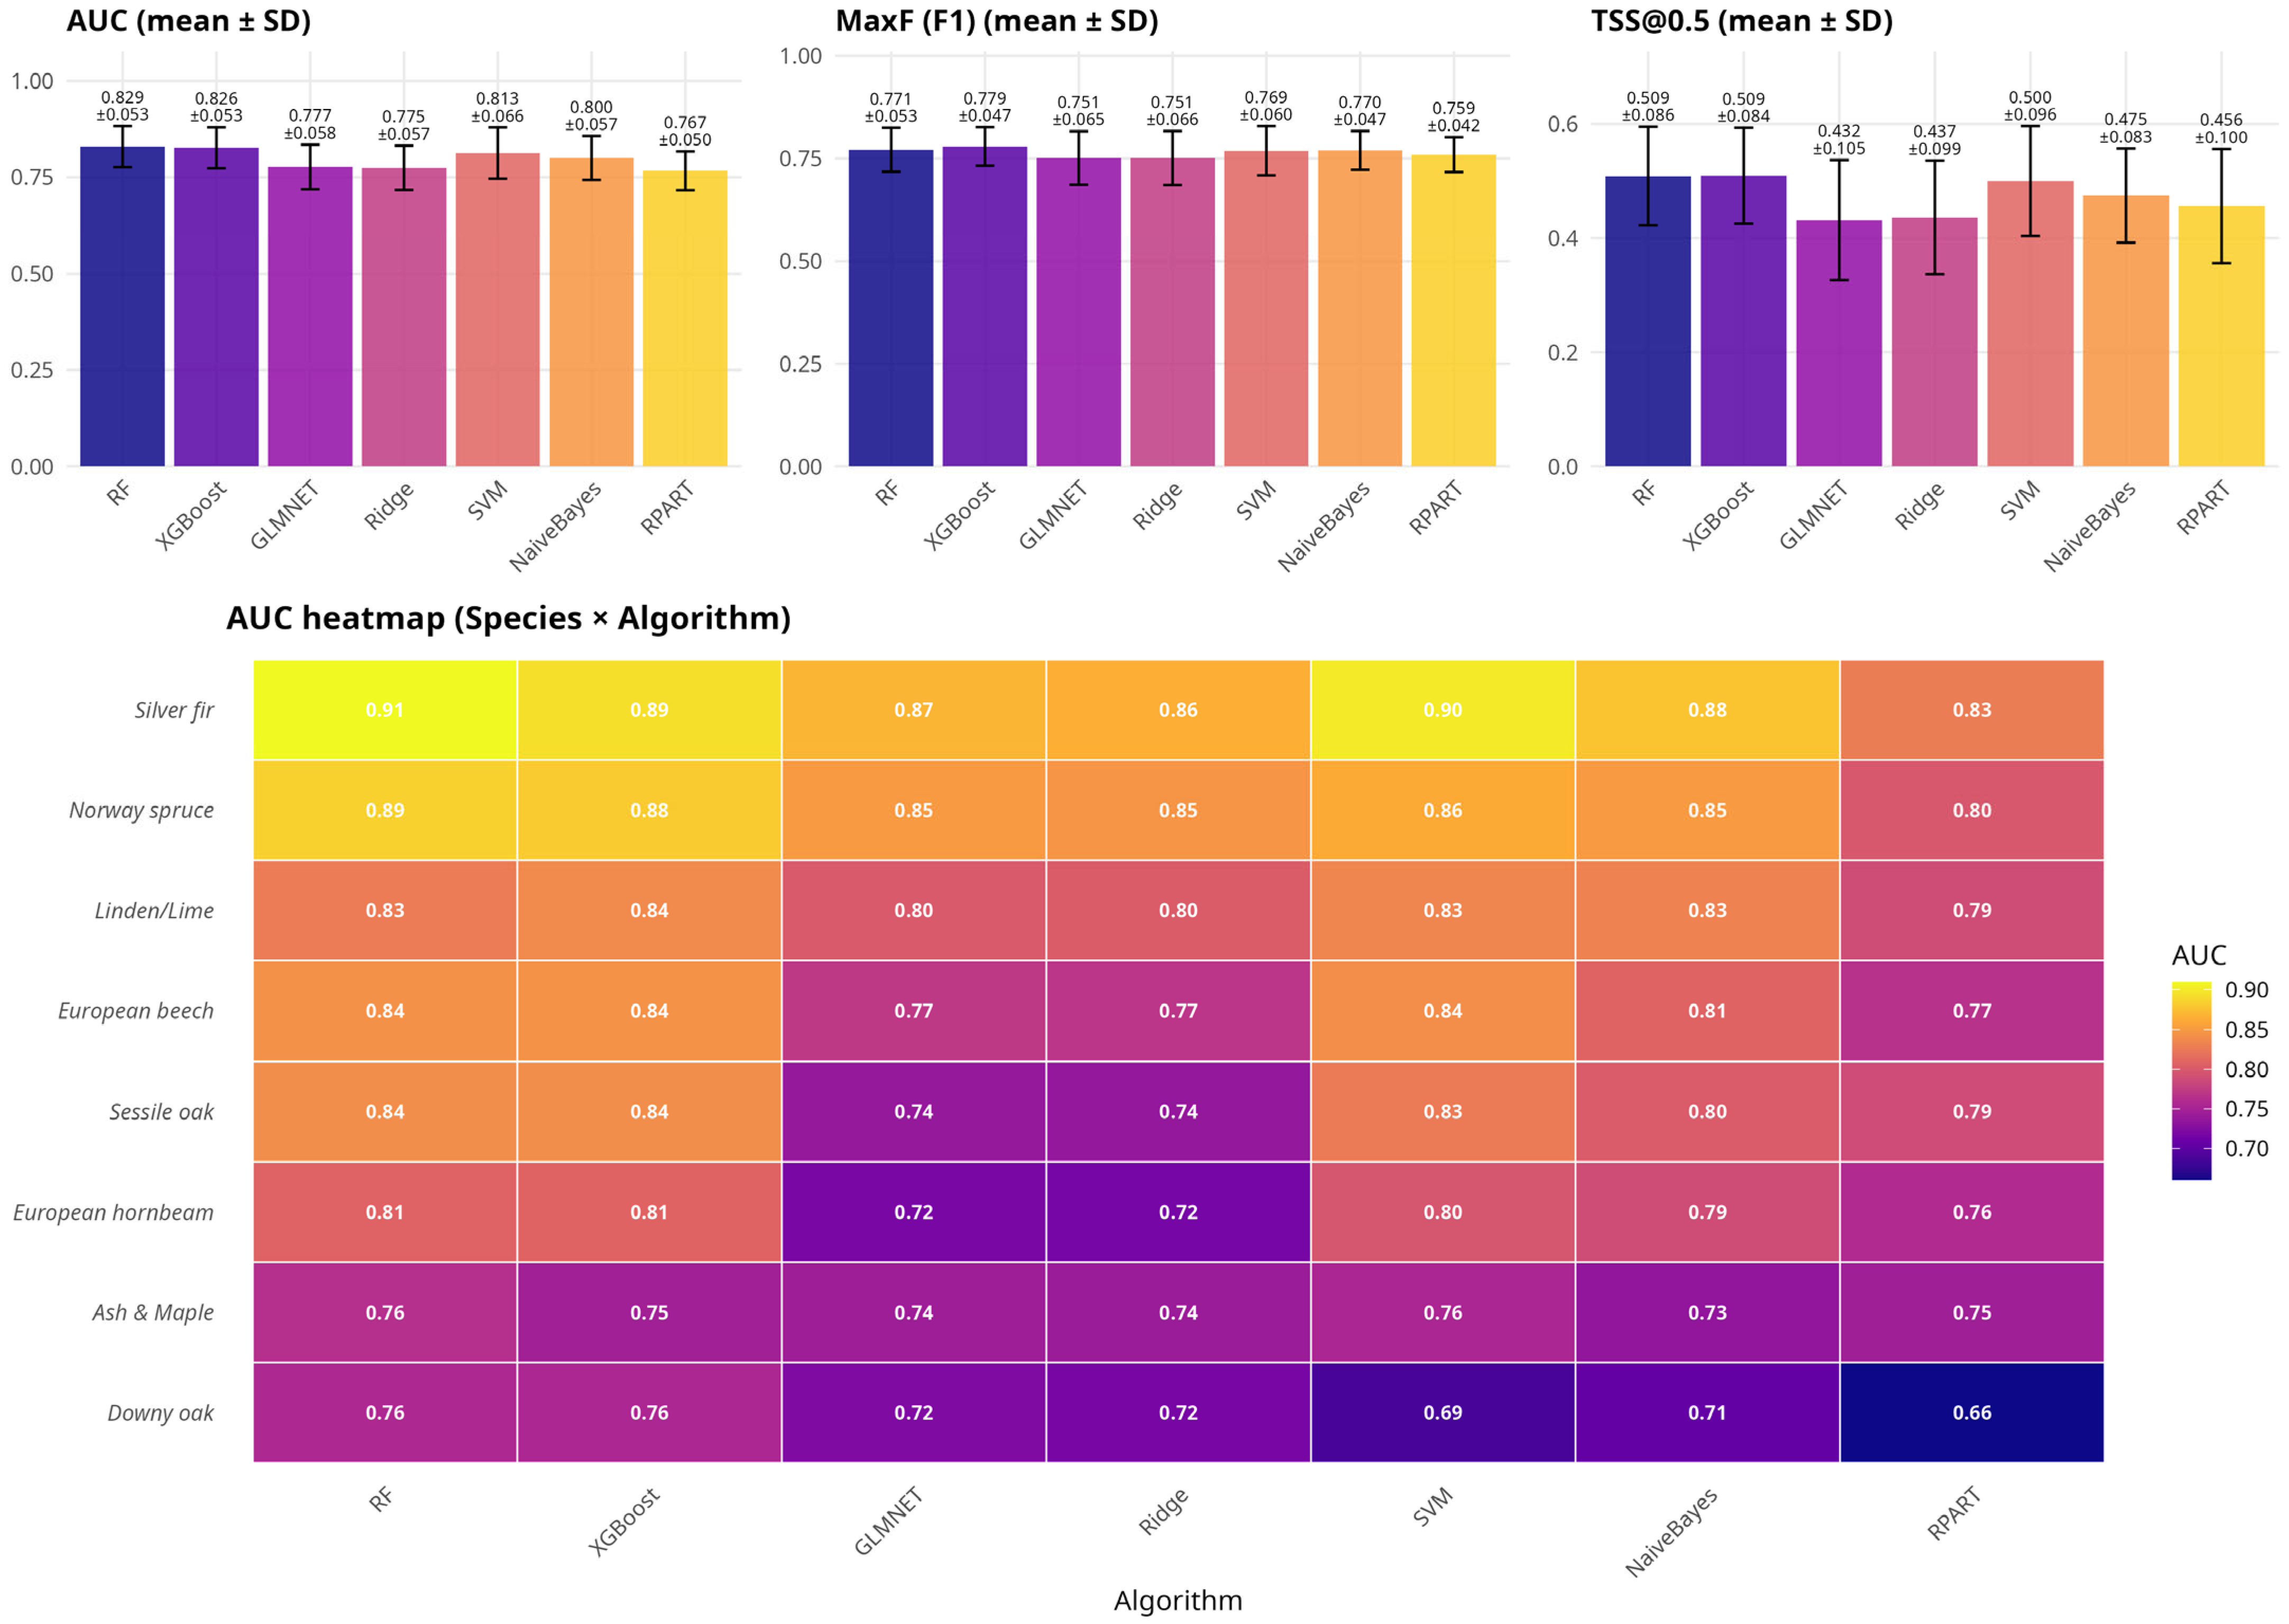
We analyzed the predictive performance of multiple machine learning algorithms used for species distribution modeling (SDM) of key tree species in Serbia. In the evaluation, three performance metrics averaged across species (mean ± standard deviation) were measured on the created species models. RF was consistent in the top ranks across metrics (AUC ~0.825, MaxF(F1) ~0.765, and TSS@0.5 ~0.493). SVM provided decent performance after RF on average (AUC ~0.810, MaxF ~0.758, and TSS ~0.500), although it was not very consistent (e.g., for Downy oak). GLMNET and Ridge regression provided intermediate results, while XGBoost with Naïve Bayes performed less well (Figure 4).
Figure 4.
Seven machine learning models’ performance summaries with AUC heatmaps. Top panels show algorithm-level performance (mean AUC ± SD across species), MaxF (F1) evaluated at the species- and algorithm-specific MaxF threshold, and TSS@0.5 calculated for the fixed-threshold reference (threshold = 0.5). The bottom panel is an AUC heatmap (species × algorithm) indicating the AUC for each fitted model and tree species. Higher values indicate better discrimination.
3.3. Forest Habitat Change
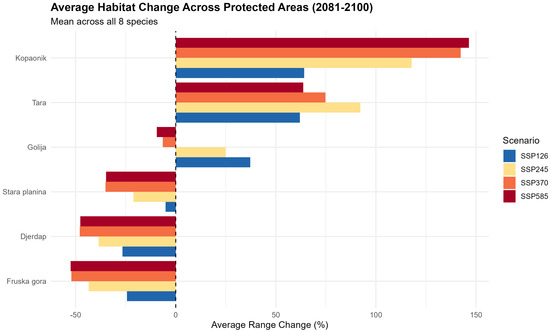
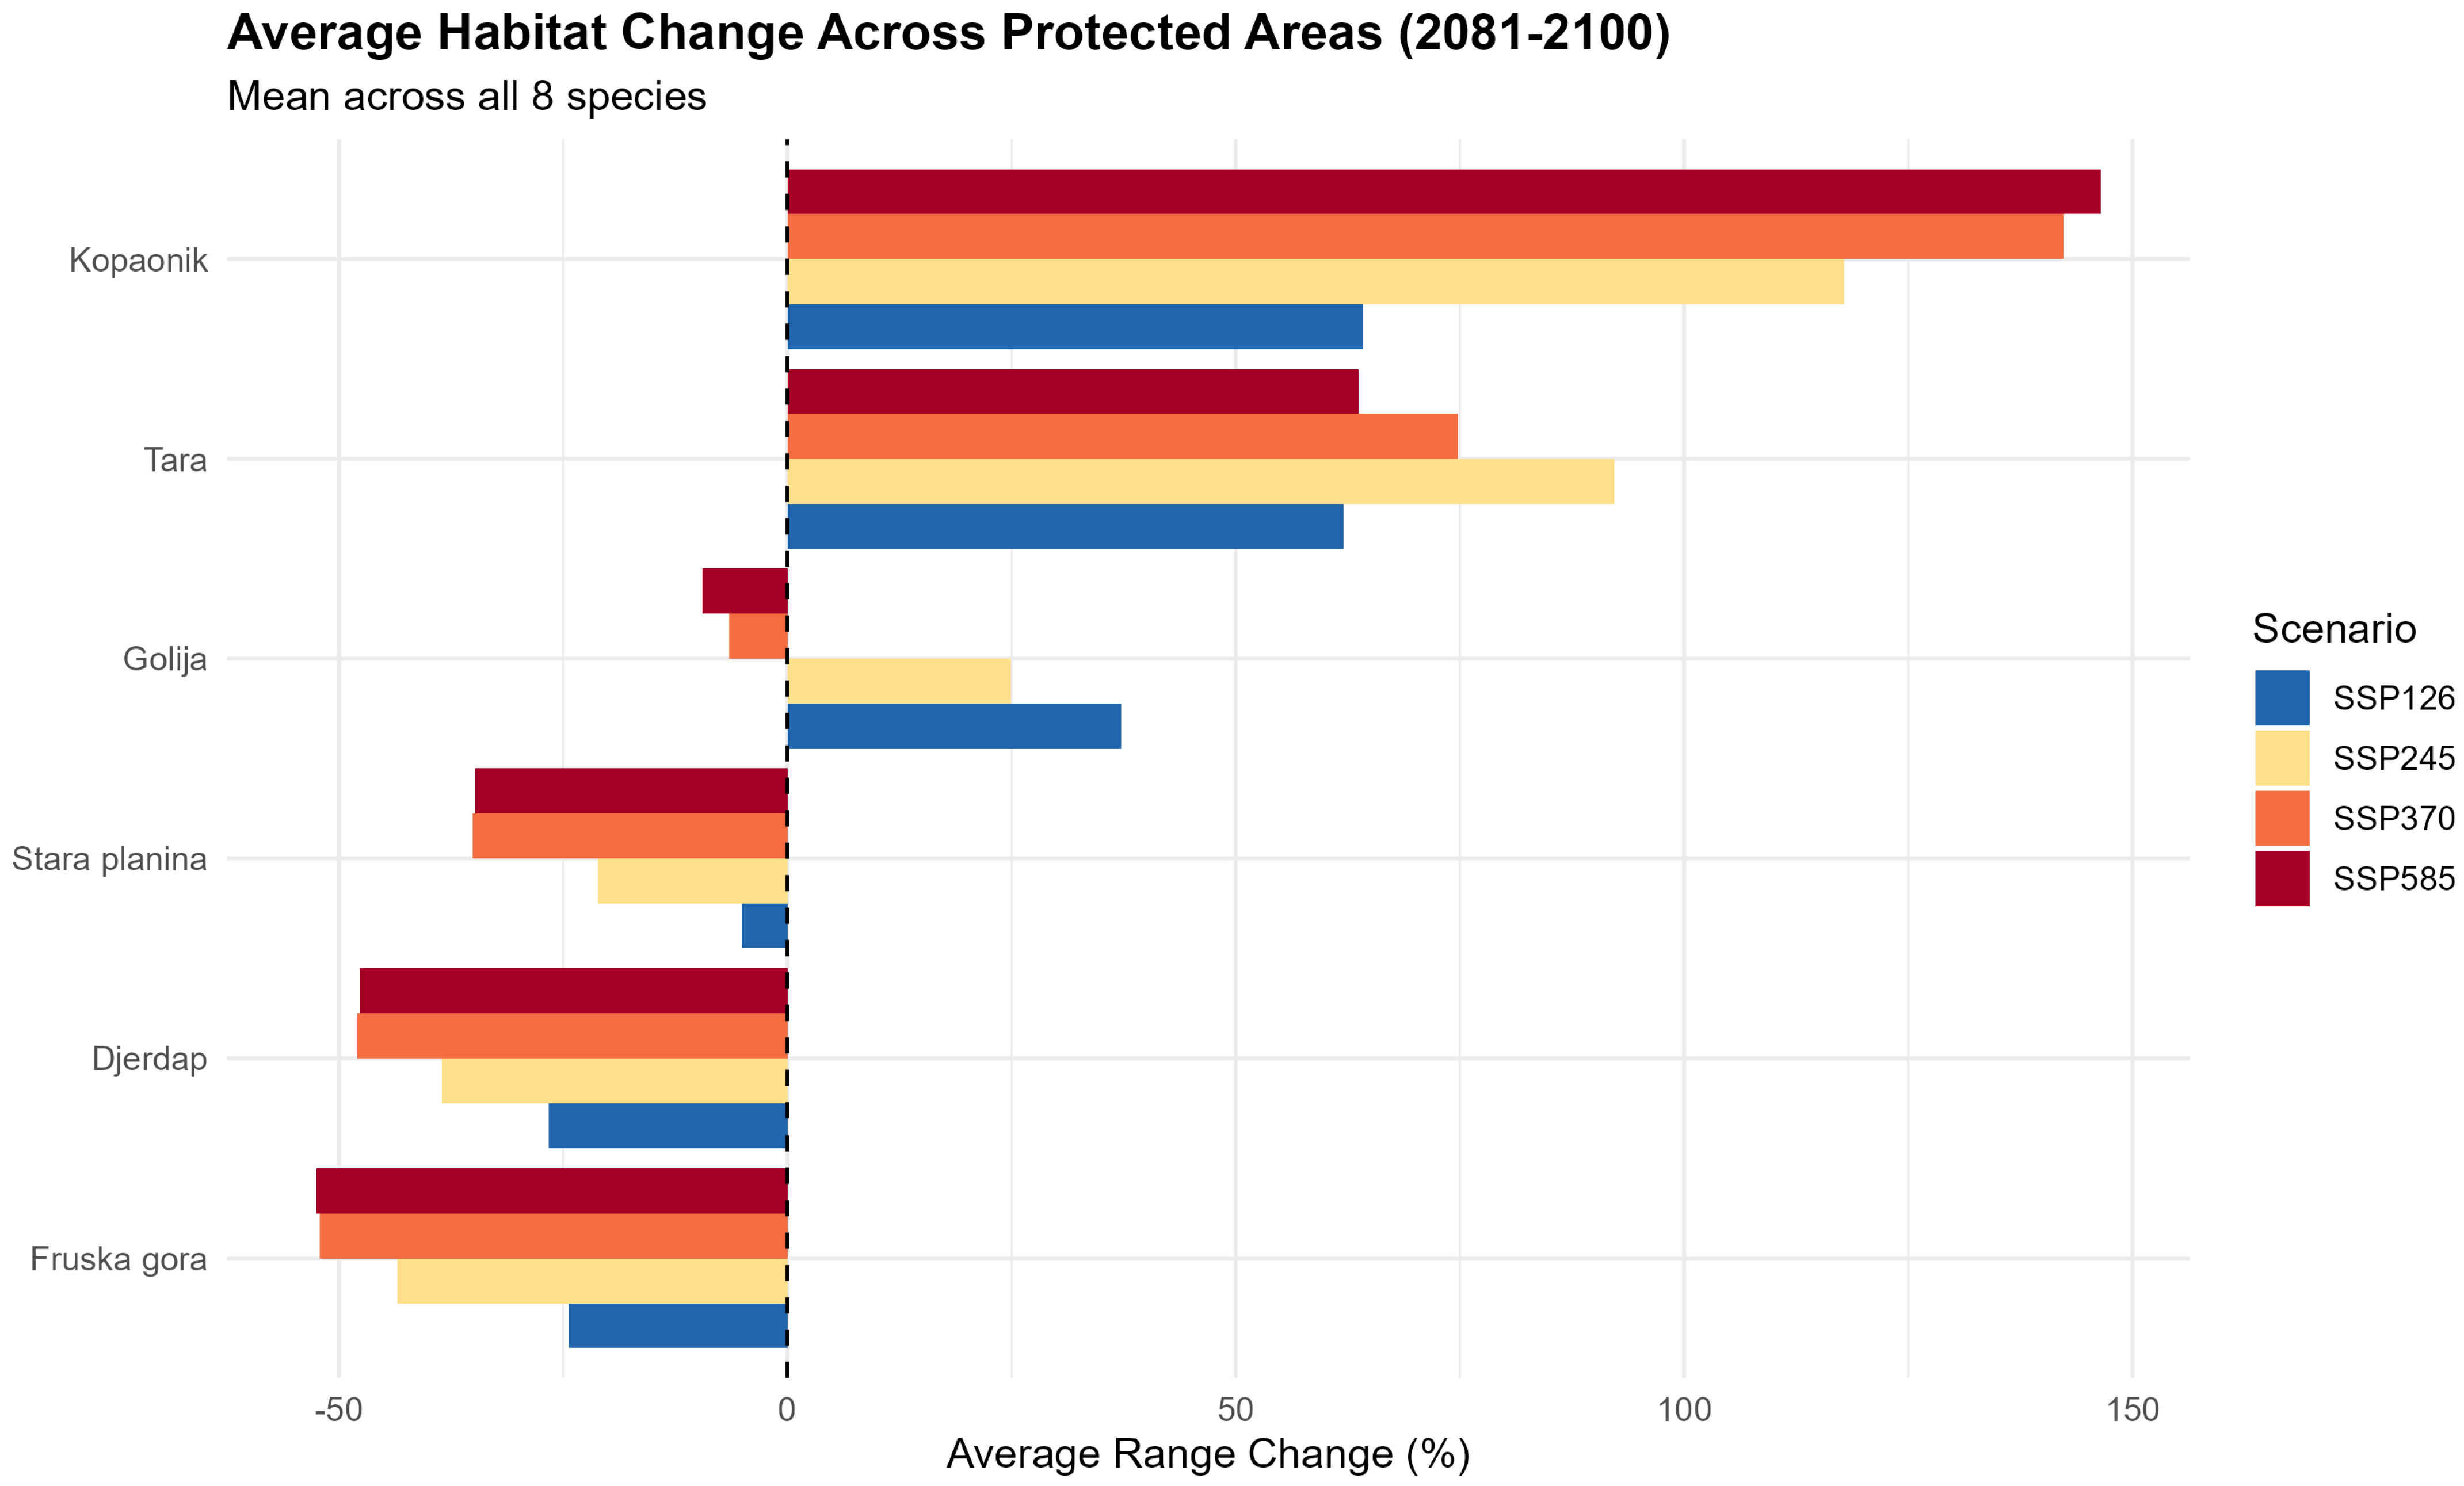
Two high-mountain PAs (Kopaonik and Tara) expect increases in average forest habitat suitability, one PA both a promotion in two lower-emission scenarios and a reduction in two higher-emission scenarios (Golija), and three PAs reductions in forest ecosystems in general (Djerdap, Fruska gora, and Stara planina) (Figure 5).
Figure 5.
Average habitat change across protected areas under different climate scenarios (2081–2100). Mean range change (%) for eight forest tree species (Silver fir, Norway spruce, Linden/Lime, European beech, Sessile oak, European hornbeam, Ash and Maple, and Downy oak) across six protected areas in Serbia (Kopaonik, Tara, Golija, Djerdap, Fruska gora, and Stara planina) under four Shared Socioeconomic Pathways (SSP1-2.6, SSP2-4.5, SSP3-7.0, and SSP5-8.5) for the 2081–2100 period. Values represent the average percentage change in suitable habitat area relative to current conditions, calculated from species distribution models using seven ML algorithms (RandomForest, XGBoost, GLMNET, Ridge, SVM, Naive Bayes, and RPART). Negative values indicate habitat loss, while positive values indicate habitat expansion. Protected areas are ordered by overall vulnerability (mean across all scenarios). Stara planina shows the highest vulnerability, while Kopaonik the highest potential for the development of forest ecosystems and not necessarily the preservation of current ones.
The eight species from this study can be divided into three vulnerability groups based on the projected range change at 2081–2100 under SSP5-8.5. Group I is highly vulnerable (≥40% loss): Silver fir (−72%), Norway spruce (−40%), Linden/Lime (−59%), and European beech (−47%). Group II is moderately vulnerable (10–40% loss), with Ash and Maple (−34%), and European hornbeam (−24%). Group III is resilient/warm-adapted (≤10% change): Sessile oak (−0.2%) and Downy oak (+9%).
Our modeling emphasized the vulnerability of Silver fir and Norway spruce from the one side and an increase in habitat suitability for Downy and Sessile oak across the six mountainous PAs. In some cases, more significant increases in habitat suitability appear for Lime/Linden, and Ash and Maple. Predictive performance could be further improved for some species (Figure 4) (e.g., Downy oak) by utilizing more refined ecological requirements in the future or by differentiating within-species groups (Ash and Maple, and Lime).
3.4. Species Vulnerability Across Six Protected Areas
3.4.1. Kopaonik
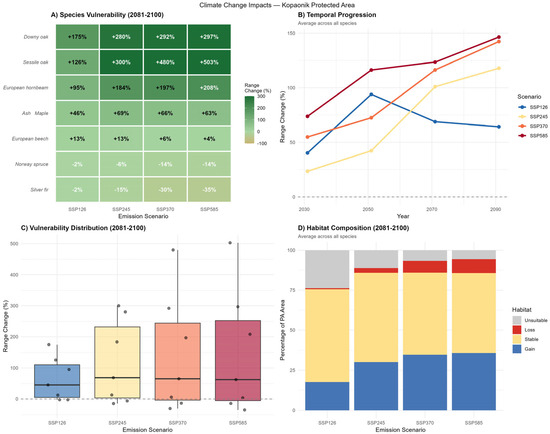
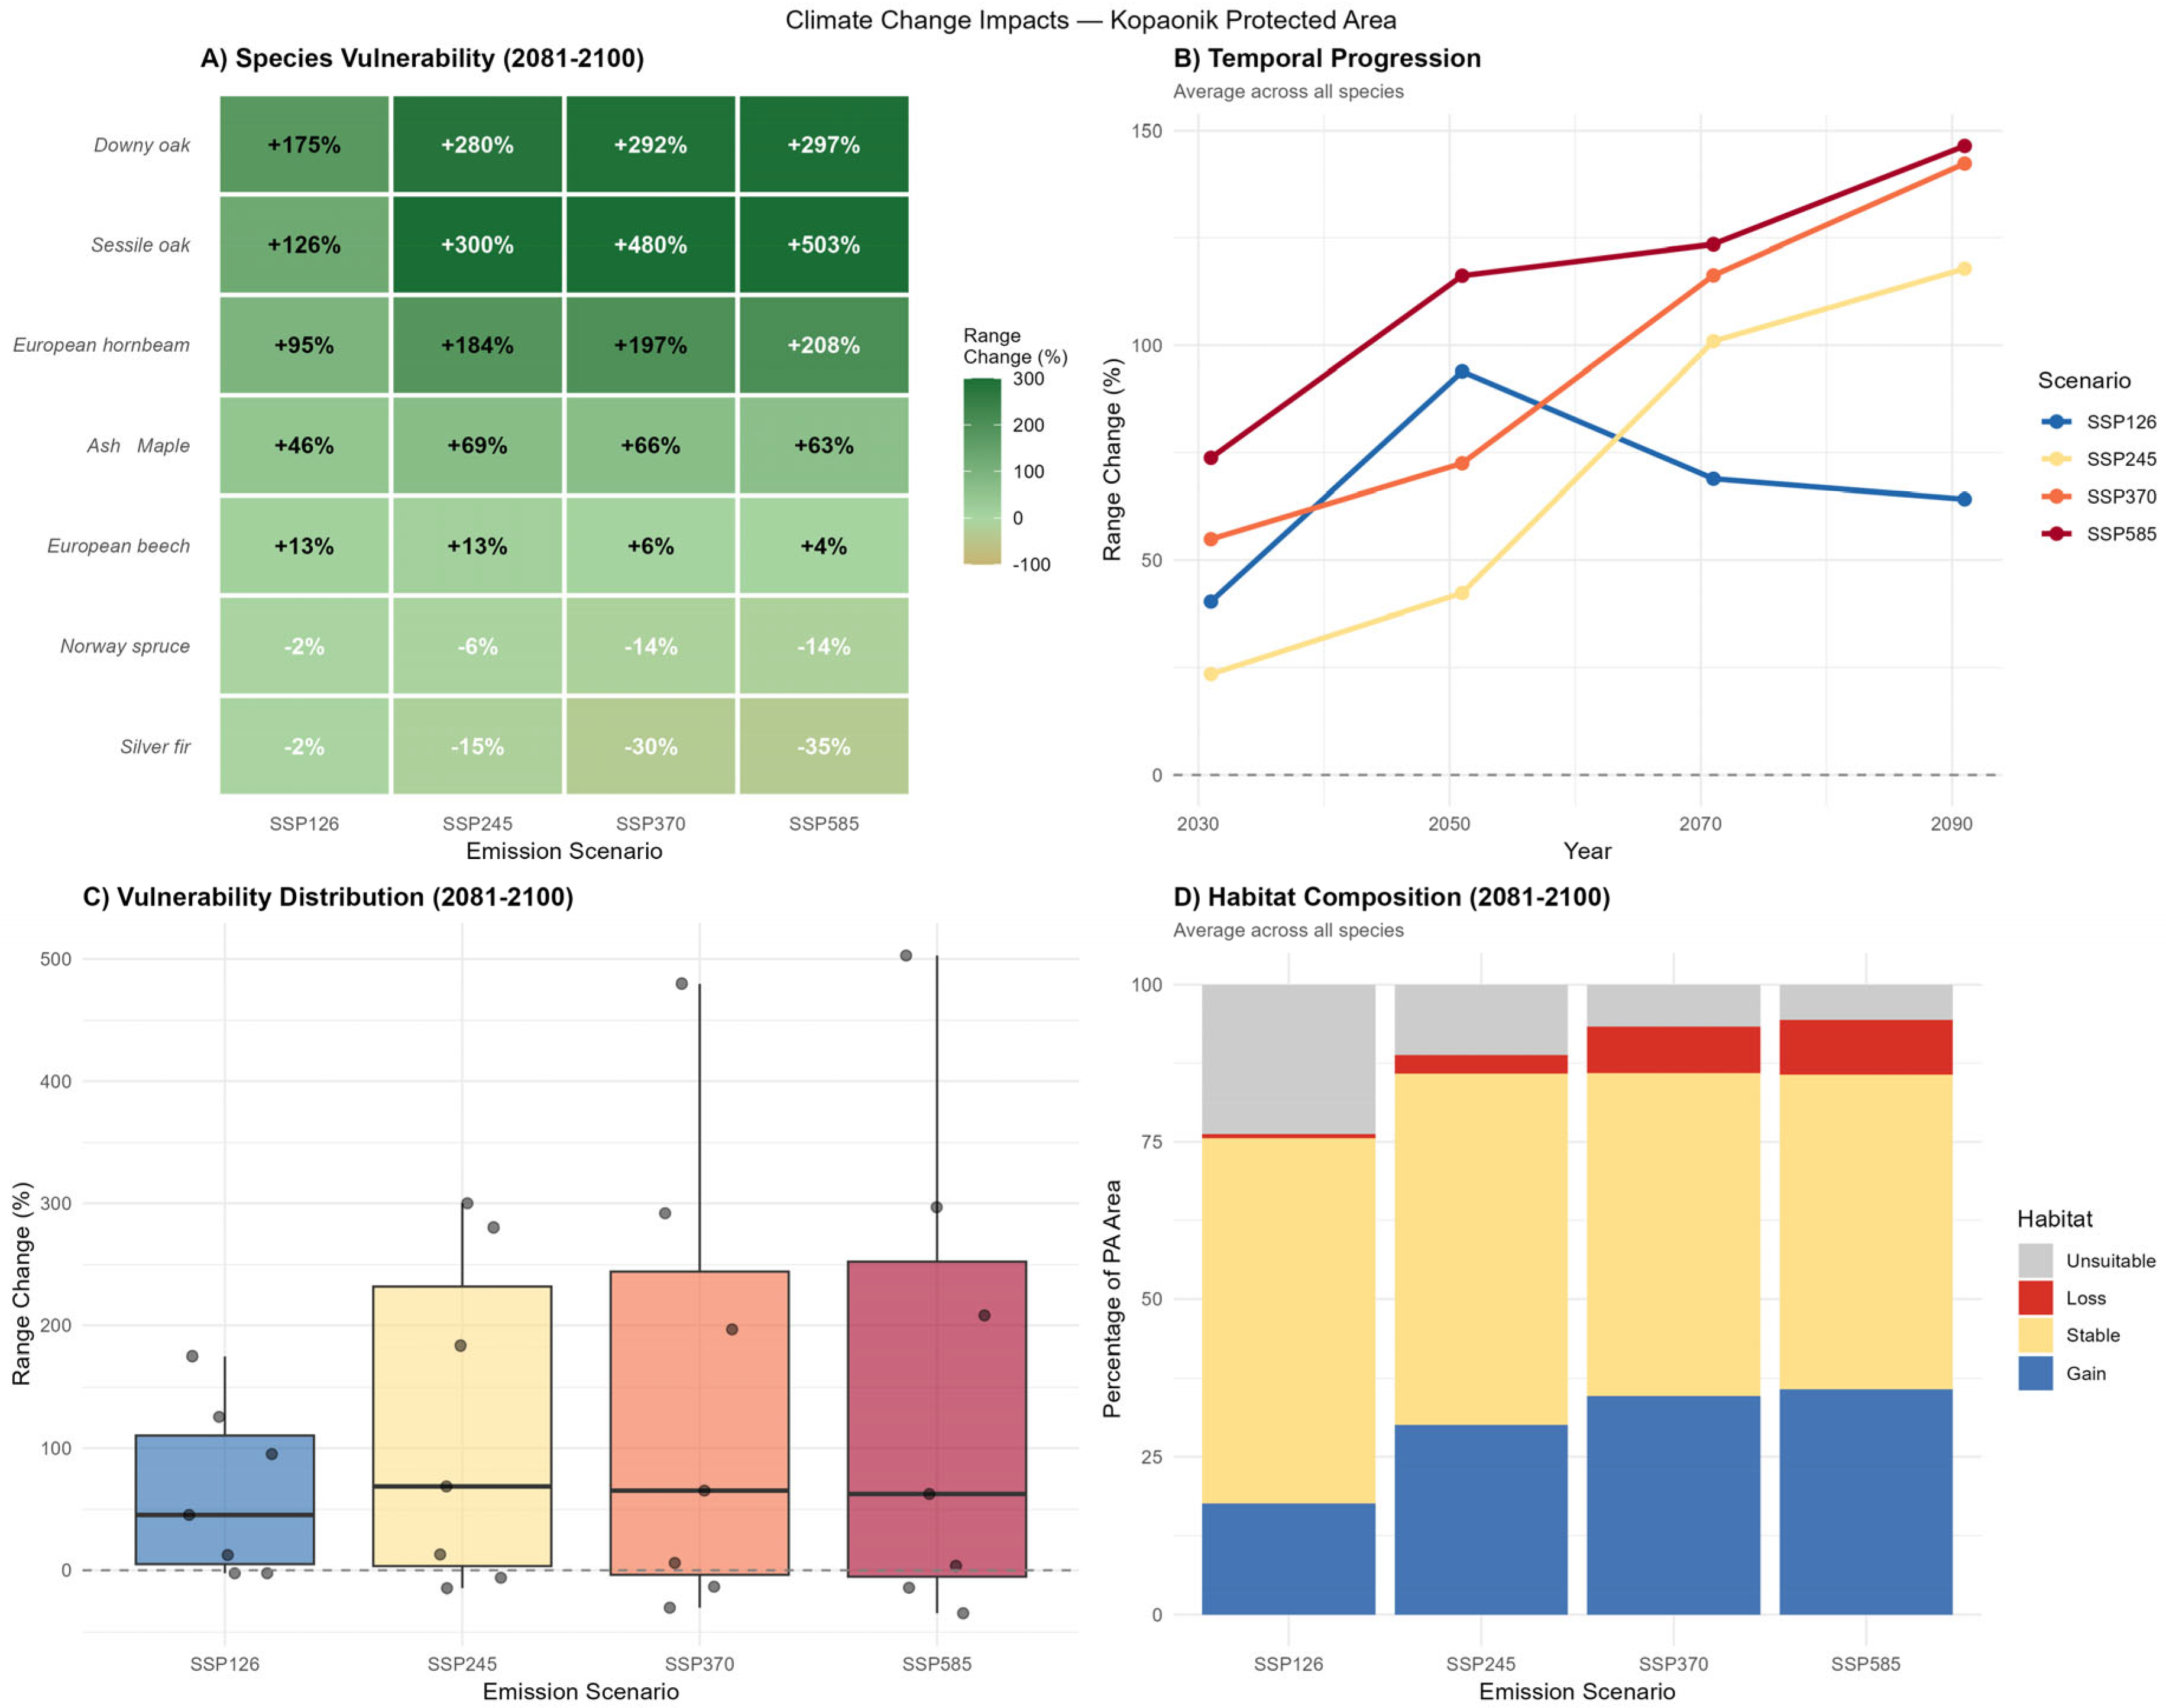
Warm-adapted oaks show substantial range gains (Sessile oak from +126% to +503% and Downy oak from +176% to +297%), as do European hornbeam (+95% to +208%), and Ash and Maple (+46% to +69%). On the other hand, European beech shows minimal change to slight gain (+4% to +13%), while conifers like Norway spruce (−2% to −14%) and especially Silver fir (−2% to −35%) face range contractions (Figure 6A).
Figure 6.
Projected impacts of climate change on key tree species habitat suitability at the national park “Kopaonik”, focusing on potential range shifts within the protected area, primarily in the late 21st century (2081–2100). Panel (A) shows potential changes in the range for individual tree species across four SSP scenarios (SSP1-2.6: very low emissions; SSP2-4.5: intermediate emissions; SSP3-7.0: high emissions; and SSP5-8.5: very high CO2 emissions). Panel (B) shows the temporal progression of average range change (%) for all species from the ~2030s to 2090s. Panel (C) shows boxplots of the vulnerability distribution (range change in %) for 2081–2100 across scenarios. Panel (D) displays stacked bar charts of the average habitat composition (%) in the protected area for 2081–2100.
Under low-emission SSP1-2.6 (blue), changes remain moderate and stabilize by the middle of the century. Intermediate SSP2-4.5 (yellow) and high SSP3-7.0 (orange) show stronger initial gains, having a peak in the middle of the second half of the century. Very high SSP5-8.5 (red) exhibits the highest early gains but an eventual reduction by the end of the century (Figure 6B).
By the end of the century, the proportion of gain (blue) and stable (yellow) habitats increases relative to current baselines, while loss (red) areas may rise, particularly under SSP2-4.5–SSP5-8.5. The results suggest that climate change may favor upslope or northward expansion of thermophilous deciduous species (e.g., oaks) into the Kopaonik area, while montane and boreal conifers (e.g., Silver fir and Norway spruce) experience significant habitat loss (Figure 6D and Figure A3).
3.4.2. Tara
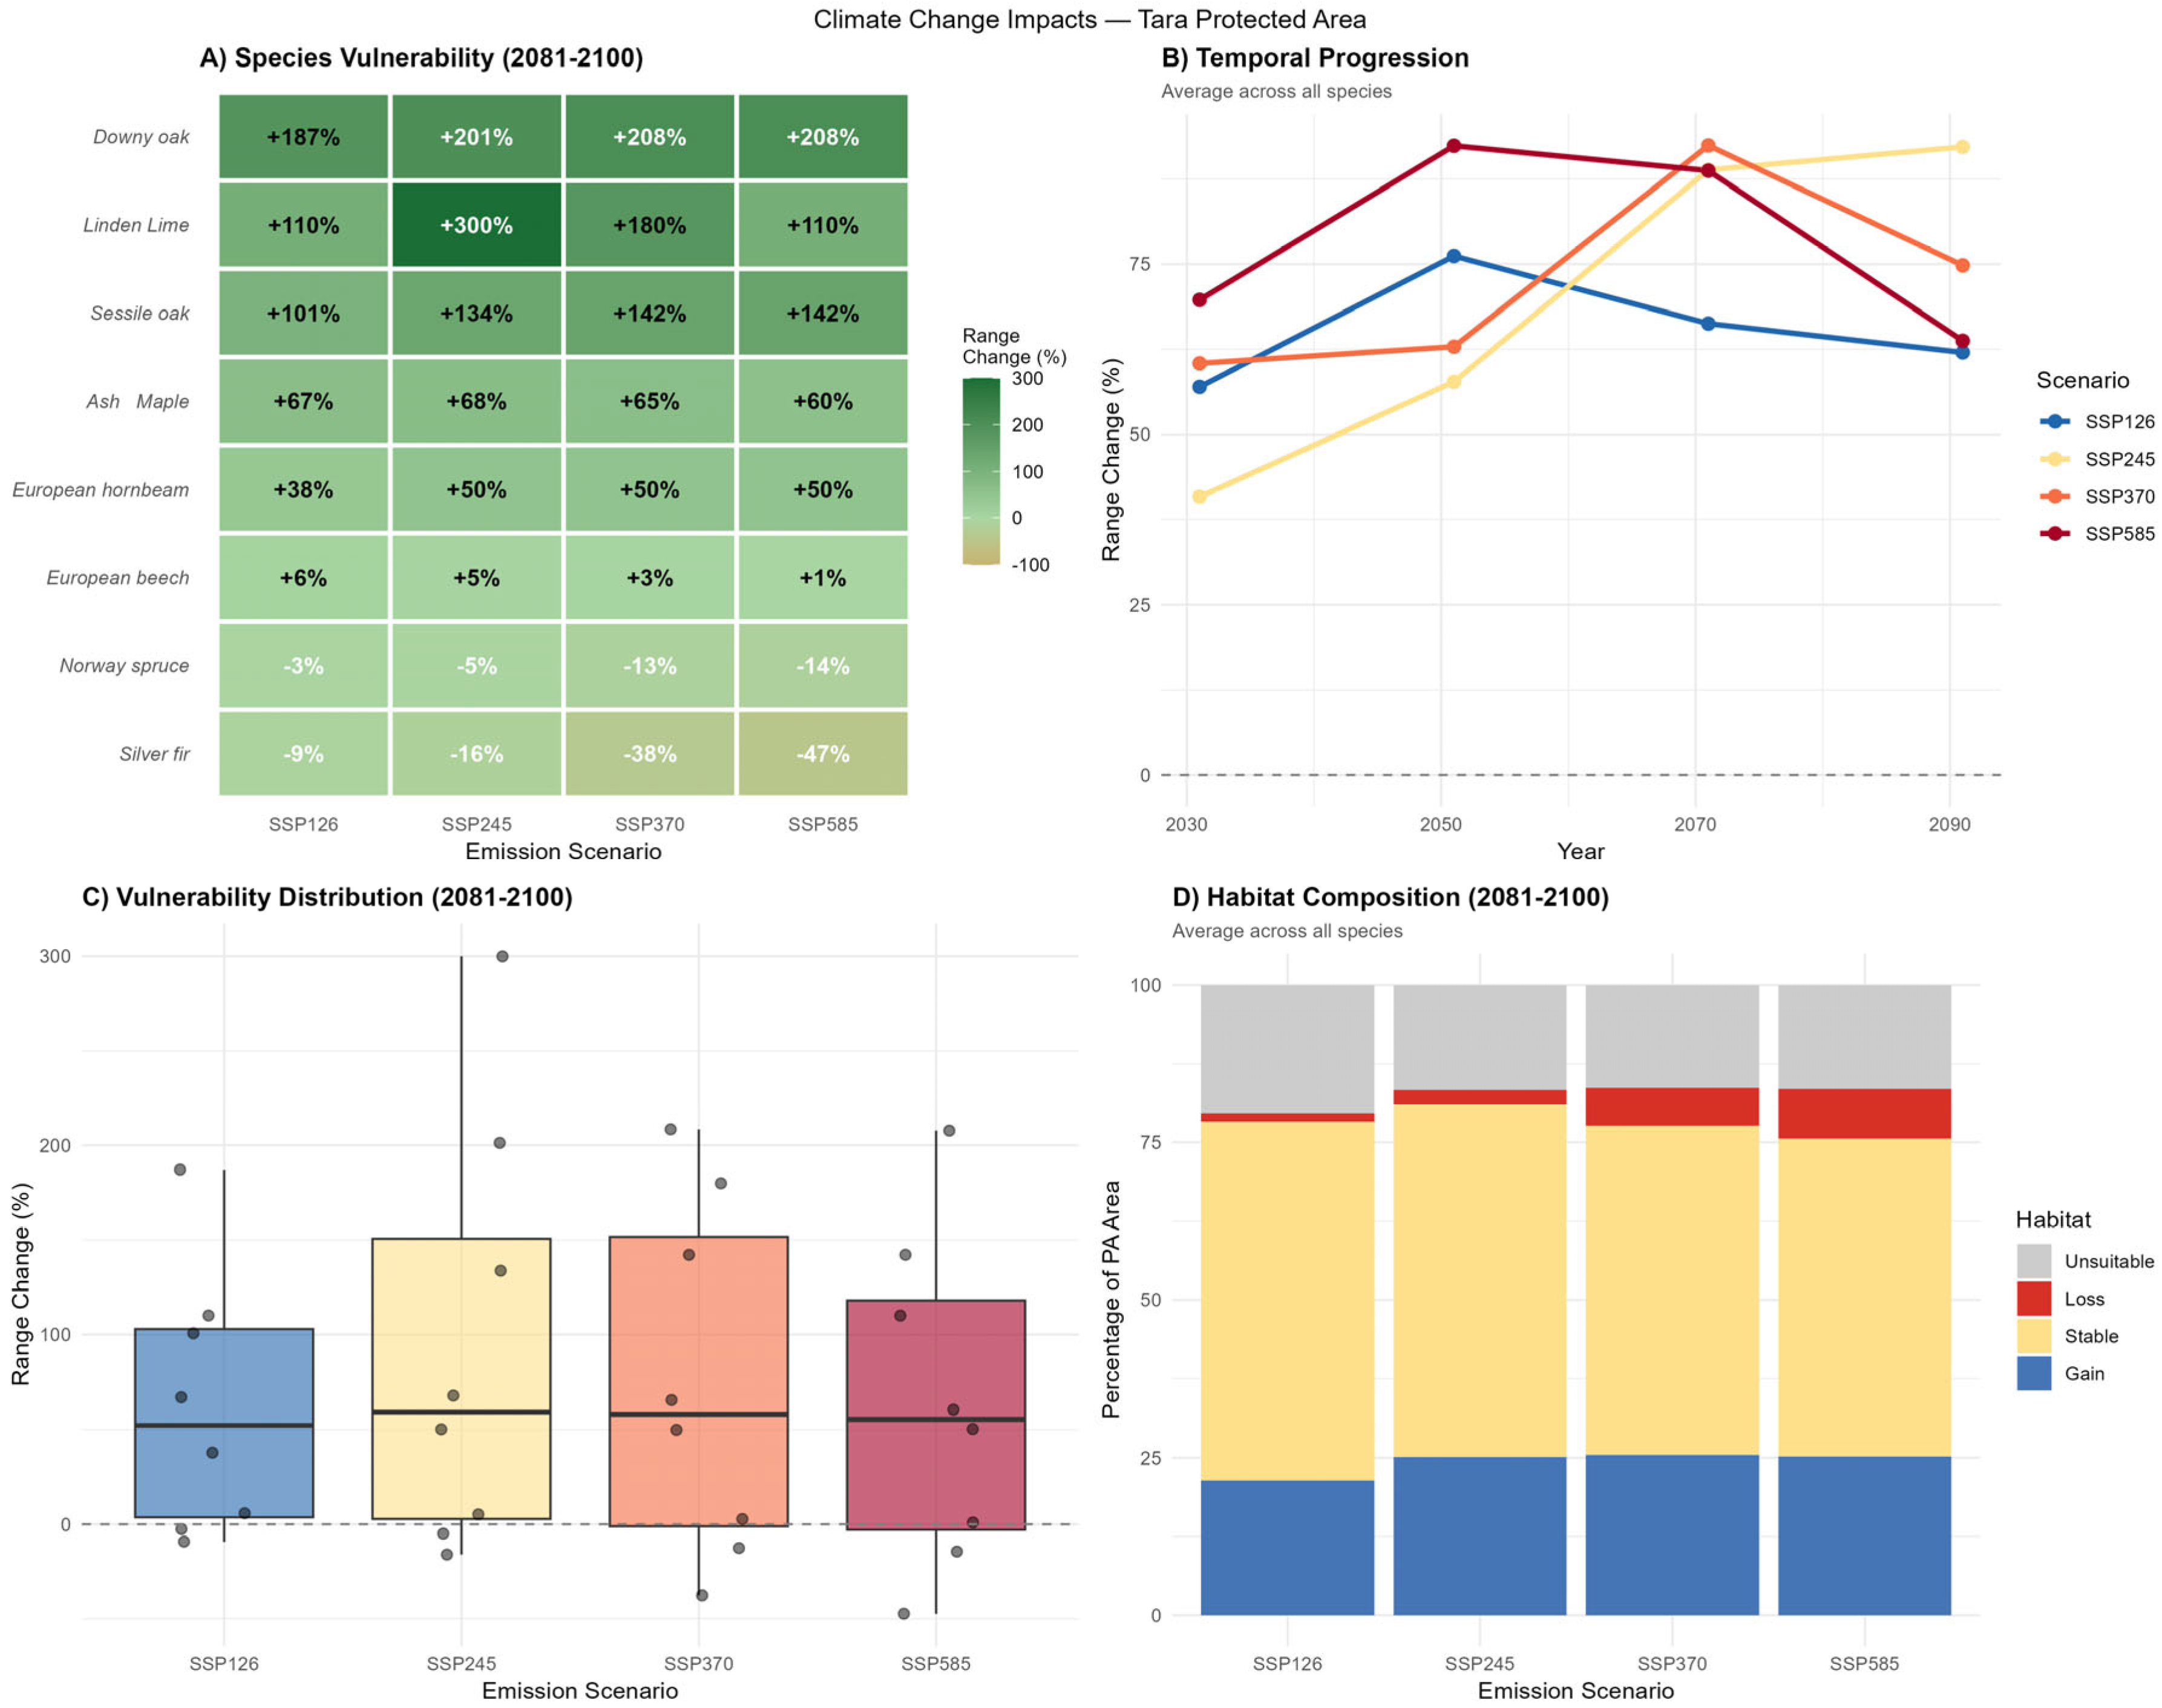
Thermophilous and lower-elevation species exhibit substantial range gains, led by Downy oak (+185% to +206%), Lime (+92% to +250%), Sessile oak (+100% to +141%), European hornbeam (+37% to +50%), and Ash and Maple (+60% to +67%). European beech shows minimal positive change (+1% to +6%). Conifers face contractions, with Norway spruce experiencing near-neutral to slight loss (−3% to −14%) and Silver fir experiencing moderate to severe declines (−9% to −47%), especially under higher-emission scenarios (Figure 7A).
Figure 7.
Projected impacts of climate change on key tree species habitat suitability at the national park “Tara”, focusing on potential range shifts within the protected area, primarily in the late 21st century (2081–2100). Panel (A) shows potential change in the range for individual tree species across four SSP scenarios (SSP1-2.6: very low emissions; SSP2-4.5: intermediate emissions; SSP3-7.0: high emissions; and SSP5-8.5: very high CO2 emissions). Panel (B) shows the temporal progression of average range change (%) for all species from the ~2030s to 2090s. Panel (C) shows boxplots of the vulnerability distribution (range change in %) for 2081–2100 across scenarios. Panel (D) displays stacked bar charts of the average habitat composition (%) in the protected area for 2081–2100.
Under low-emission SSP1-2.6 (blue), changes are modest and stabilize around moderate gains. Intermediate SSP2-4.5 (yellow) and high SSP3-7.0 (orange) show stronger increases, peaking mid-to-late century; very high SSP5-8.5 (red) exhibits the highest early-to-mid-century gains but some moderation or decline toward 2090 (Figure 7B).
3.4.3. Golija
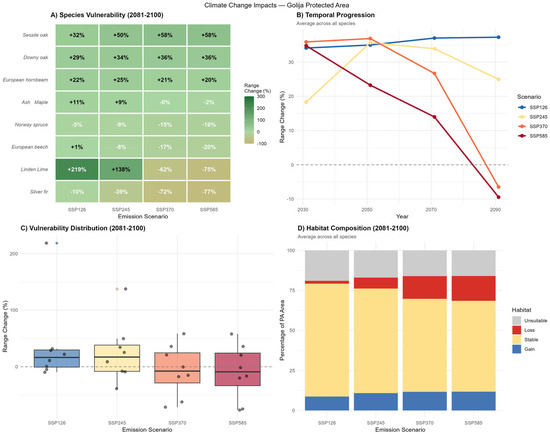
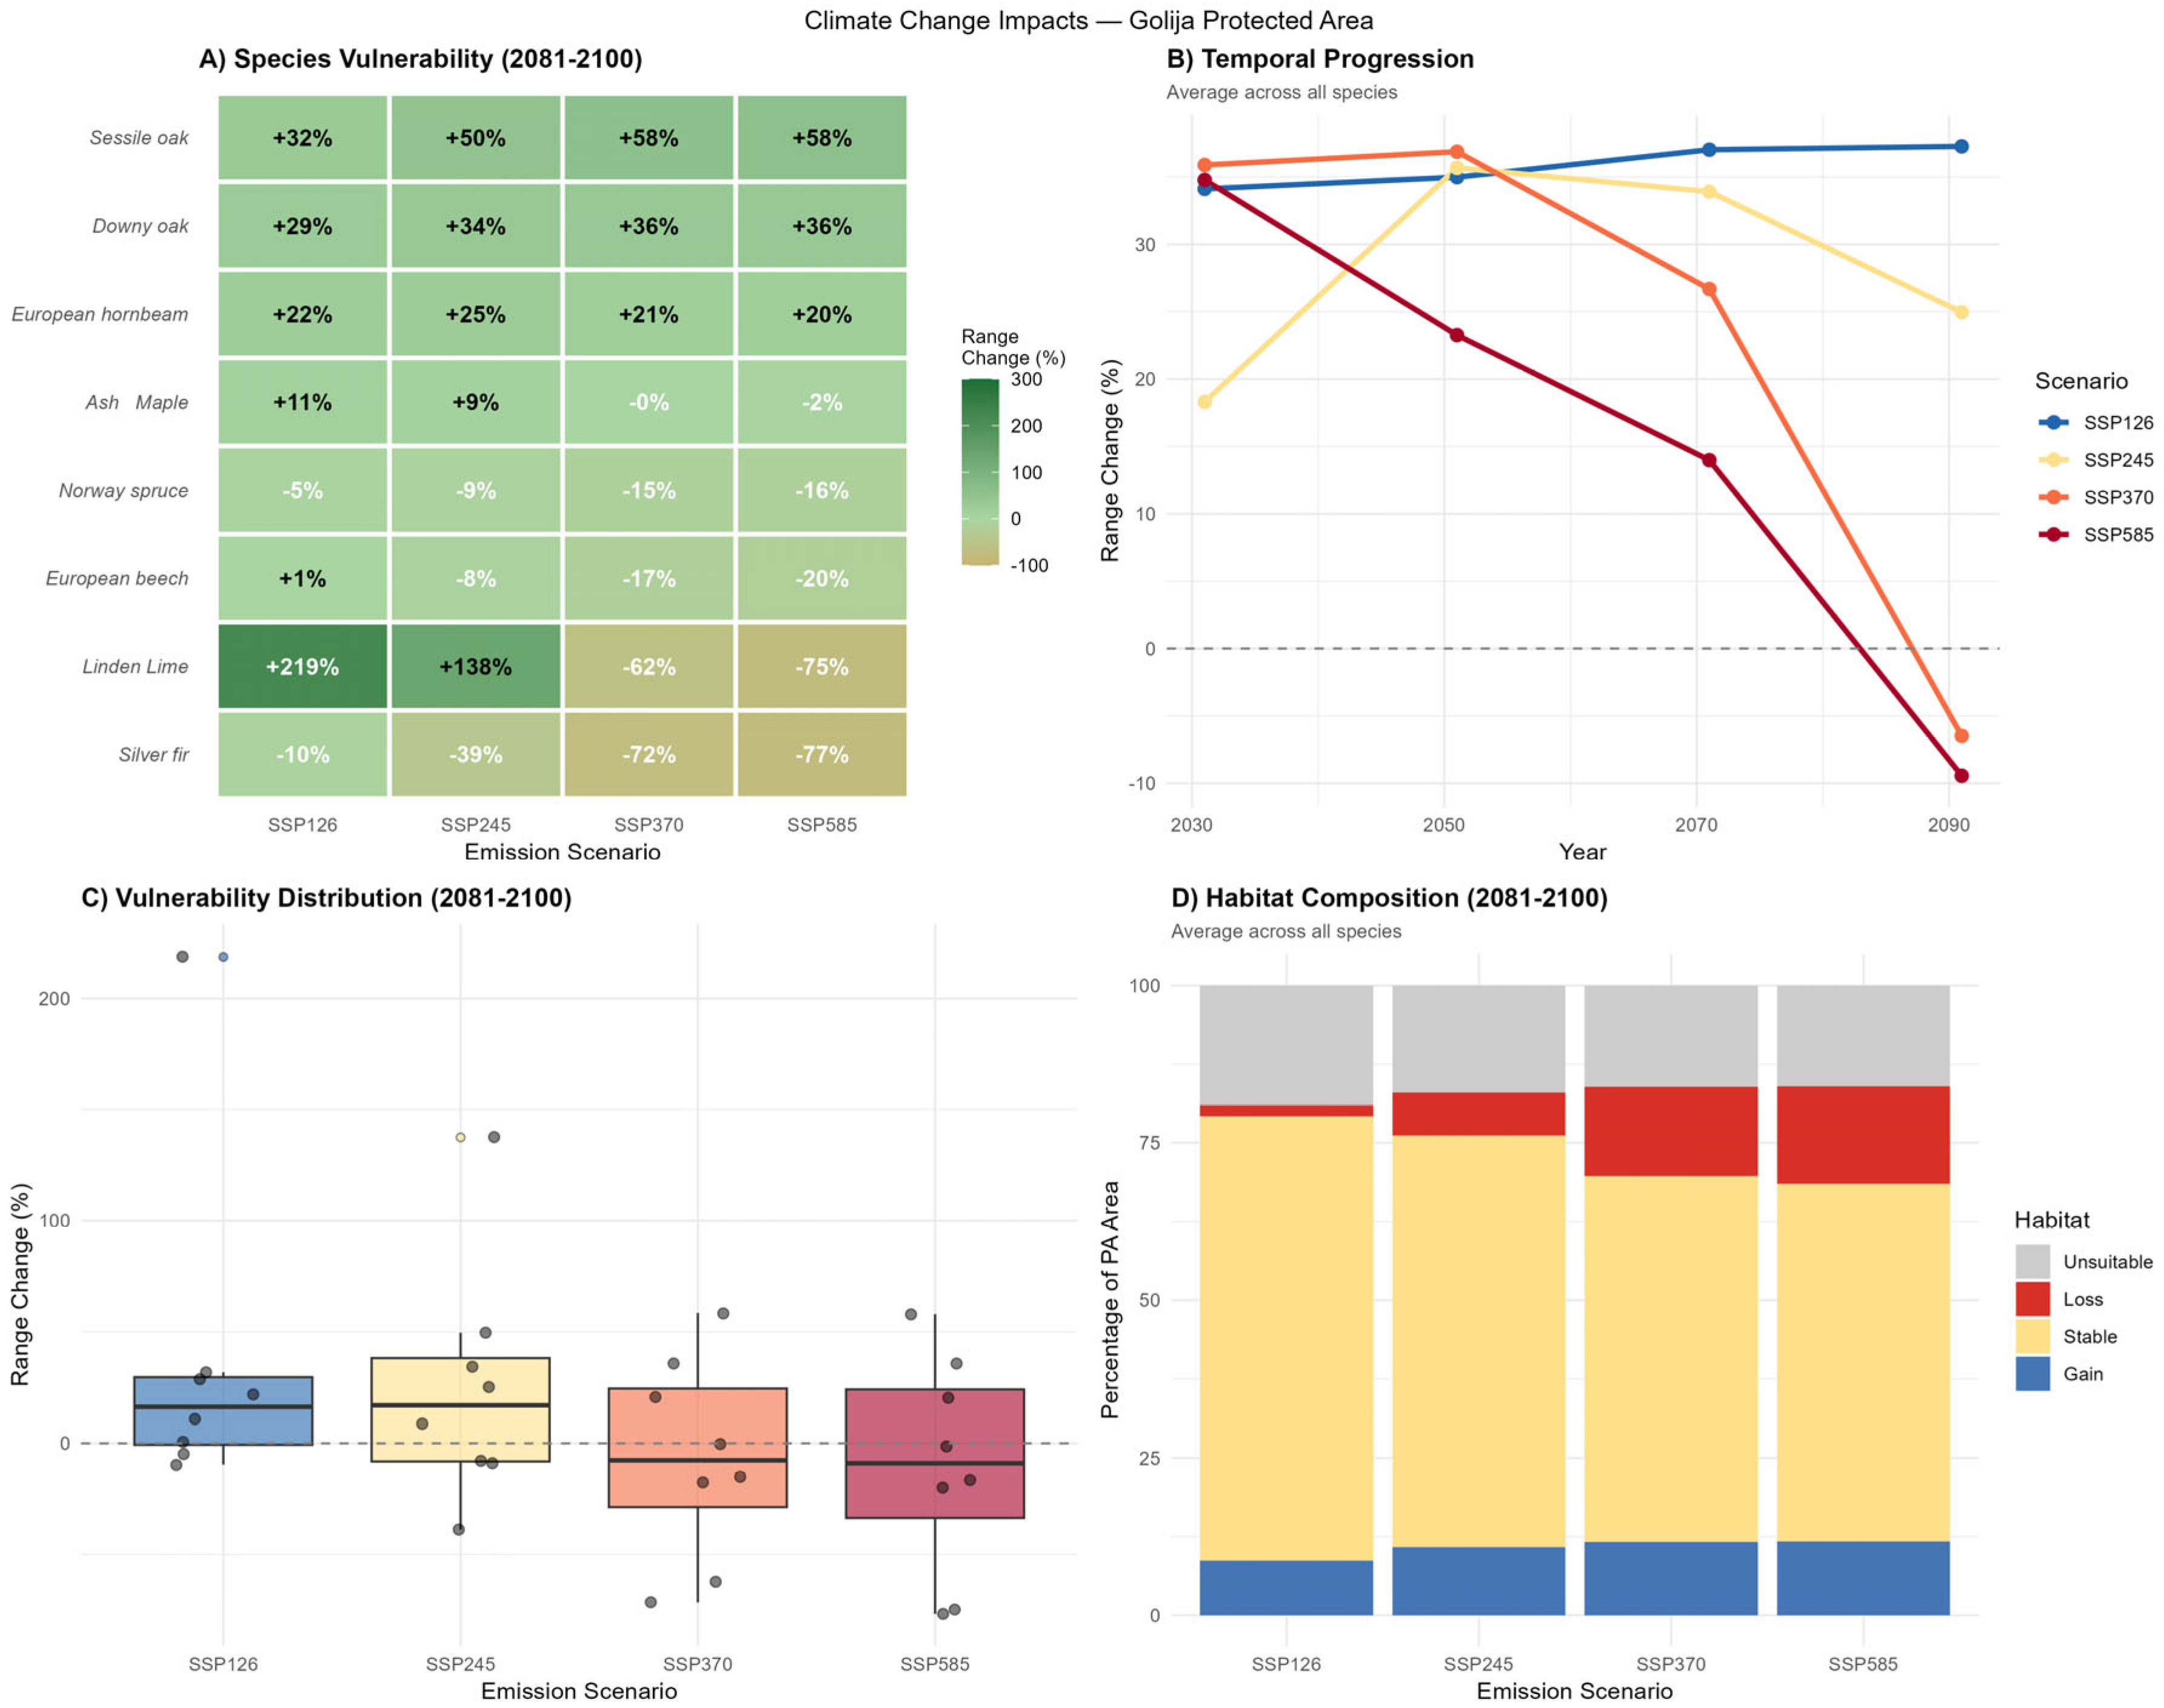
Lower-elevation or thermophilous species show gains or stability. Downy oak (+29% to +36%), Sessile oak (+32% to +59%), and European hornbeam (+20% to +25%) remain consistently positive across all scenarios. Ash and Maple show near-neutral changes (+11% under SSP1-2.6 to −2% under SSP5-8.5). European beech shifts from near-neutral under SSP1-2.6 (+1%) to moderate losses under higher scenarios (−20% under SSP5-8.5). Linden/Lime exhibits a strongly non-monotonic response, gaining substantially under low emissions (+219% under SSP1-2.6) but collapsing to −75% under SSP5-8.5. Habitats of conifers face pronounced contractions: Norway spruce (−5% to −16%) and Silver fir (−10% to −77%, with the steepest losses under SSP5-8.5) (Figure 8A and Figure A5).
Figure 8.
Projected impacts of climate change on key tree species habitat suitability at the nature park “Golija”, focusing on potential range shifts within the protected area, primarily in the late 21st century (2081–2100). Panel (A) shows potential changes in the range for individual tree species across four SSP scenarios (SSP1-2.6: very low emissions; SSP2-4.5: intermediate emissions; SSP3-7.0: high emissions; and SSP5-8.5: very high CO2 emissions). Panel (B) shows the temporal progression of average range change (%) for all species from the ~2030s to 2090s. Panel (C) shows boxplots of the vulnerability distribution (range change in %) for 2081–2100 across scenarios. Panel (D) displays stacked bar charts of the average habitat composition (%) in the protected area for 2081–2100.
Under low-emission SSP1-2.6 (blue), changes remain near-neutral to slightly positive and stable. Intermediate SSP2-4.5 (yellow) shows minor early gains, followed by gradual decline. High SSP3-7.0 (orange) and very high SSP5-8.5 (red) exhibit initial modest changes, turning very sharply negative after mid-century (around 2050–2070), with SSP5-8.5 reaching the most severe average losses (~−30%) by 2090, indicating accelerating habitat unsuitability under intensive warming (Figure 8B).
Across scenarios, stable (yellow) habitat decreases markedly from ~75–80% under SSP1-2.6 to ~50–60% under higher pathways, while loss (red) areas rise substantially (especially under SSP3-7.0/SSP5-8.5, where combined loss + unsuitable exceeds 40–50%). Gain (blue) remains limited (~10–15%), reflecting limited opportunities for upslope colonization by warmth-adapted species within the area’s elevational constraints (Figure 8D and Figure A5).
3.4.4. Djerdap
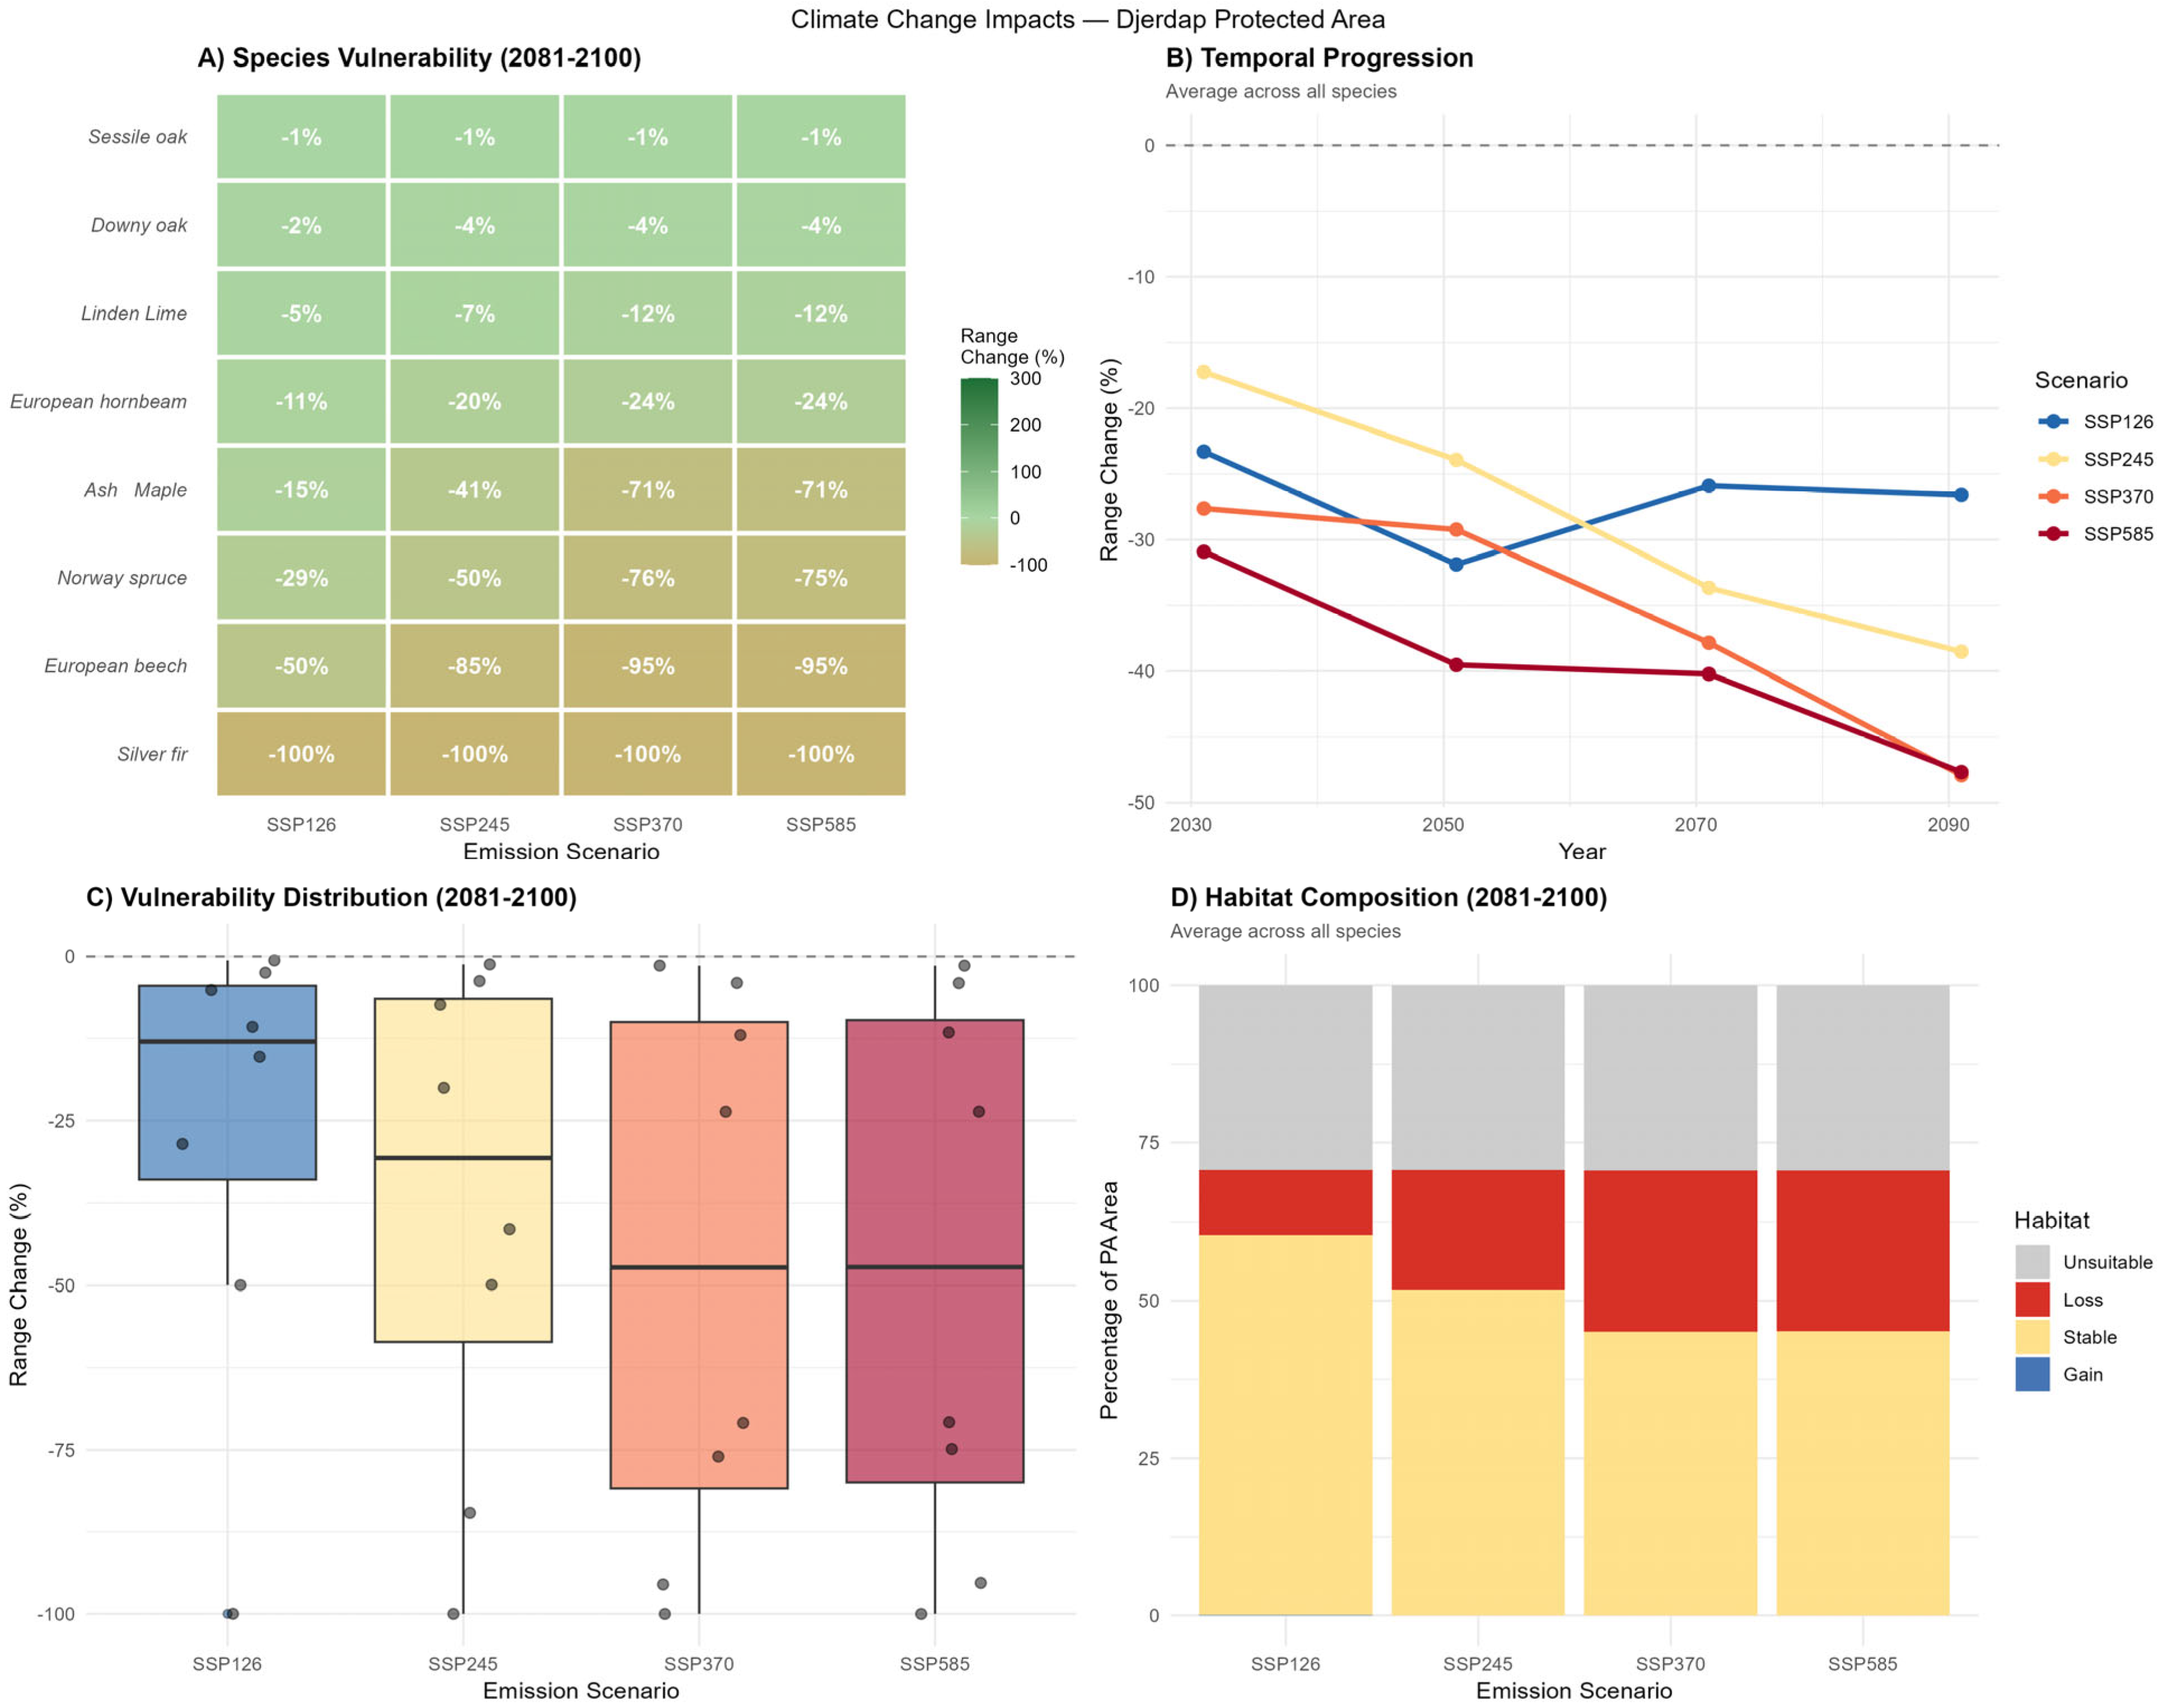
Thermophilous or lower-elevation species like Downy oak and Sessile oak show modest losses across all scenarios (Downy oak −2% to −4% and Sessile oak −1%). Ash and Maple face substantial losses, ranging from −14% under SSP1-2.6 to −66% under SSP3-7.0/SSP5-8.5. Lime and European hornbeam show moderate losses (Lime −5% to −11%; hornbeam −10% to −22%). European beech faces severe contractions (−46% under SSP1-2.6 escalating to −88% under SSP3-7.0/SSP5-8.5). Conifers habitat are the most vulnerable, with Norway spruce experiencing dramatic declines (−25% to −66% across scenarios), which in reality is not so important an issue, since broadleaves dominates (Figure 9A).
Figure 9.
Projected impacts of climate change on key tree species habitat suitability at the national park “Djerdap”, focusing on potential range shifts within the protected area, primarily in the late 21st century (2081–2100). Panel (A) shows potential changes in the range for individual tree species across four SSP scenarios (SSP1-2.6: very low emissions; SSP2-4.5: intermediate emissions; SSP3-7.0: high emissions; and SSP5-8.5: very high CO2 emissions). Panel (B) shows the temporal progression of average range change (%) for all species from the ~2030s to 2090s. Panel (C) shows boxplots of the vulnerability distribution (range change in %) for 2081–2100 across scenarios. Panel (D) displays stacked bar charts of the average habitat composition (%) in the protected area for 2081–2100.
Under low-emission SSP1-2.6 (blue), changes are modestly negative and relatively stable after an initial dip. Intermediate SSP2-4.5 (yellow) and high SSP3-7.0 (orange) show progressive declines, accelerating mid-century. Very high SSP5-8.5 (red) exhibits the steepest and most consistent losses, reaching ~−30% average by 2090, reflecting widespread habitat unsuitability driven by intensified warming and potential drying (Figure 9B).
Stable (yellow) habitat decreases sharply from ~75% under SSP1-2.6 to ~60%–65% under higher pathways. Loss (red) rises markedly (from ~10%–15% to ~25%–30%), while unsuitable (gray) areas and gain (blue) remain the same across scenarios, indicating predominant contraction of suitable habitats with minimal compensatory expansion opportunities (Figure 9D and Figure A6).
3.4.5. Fruska Gora
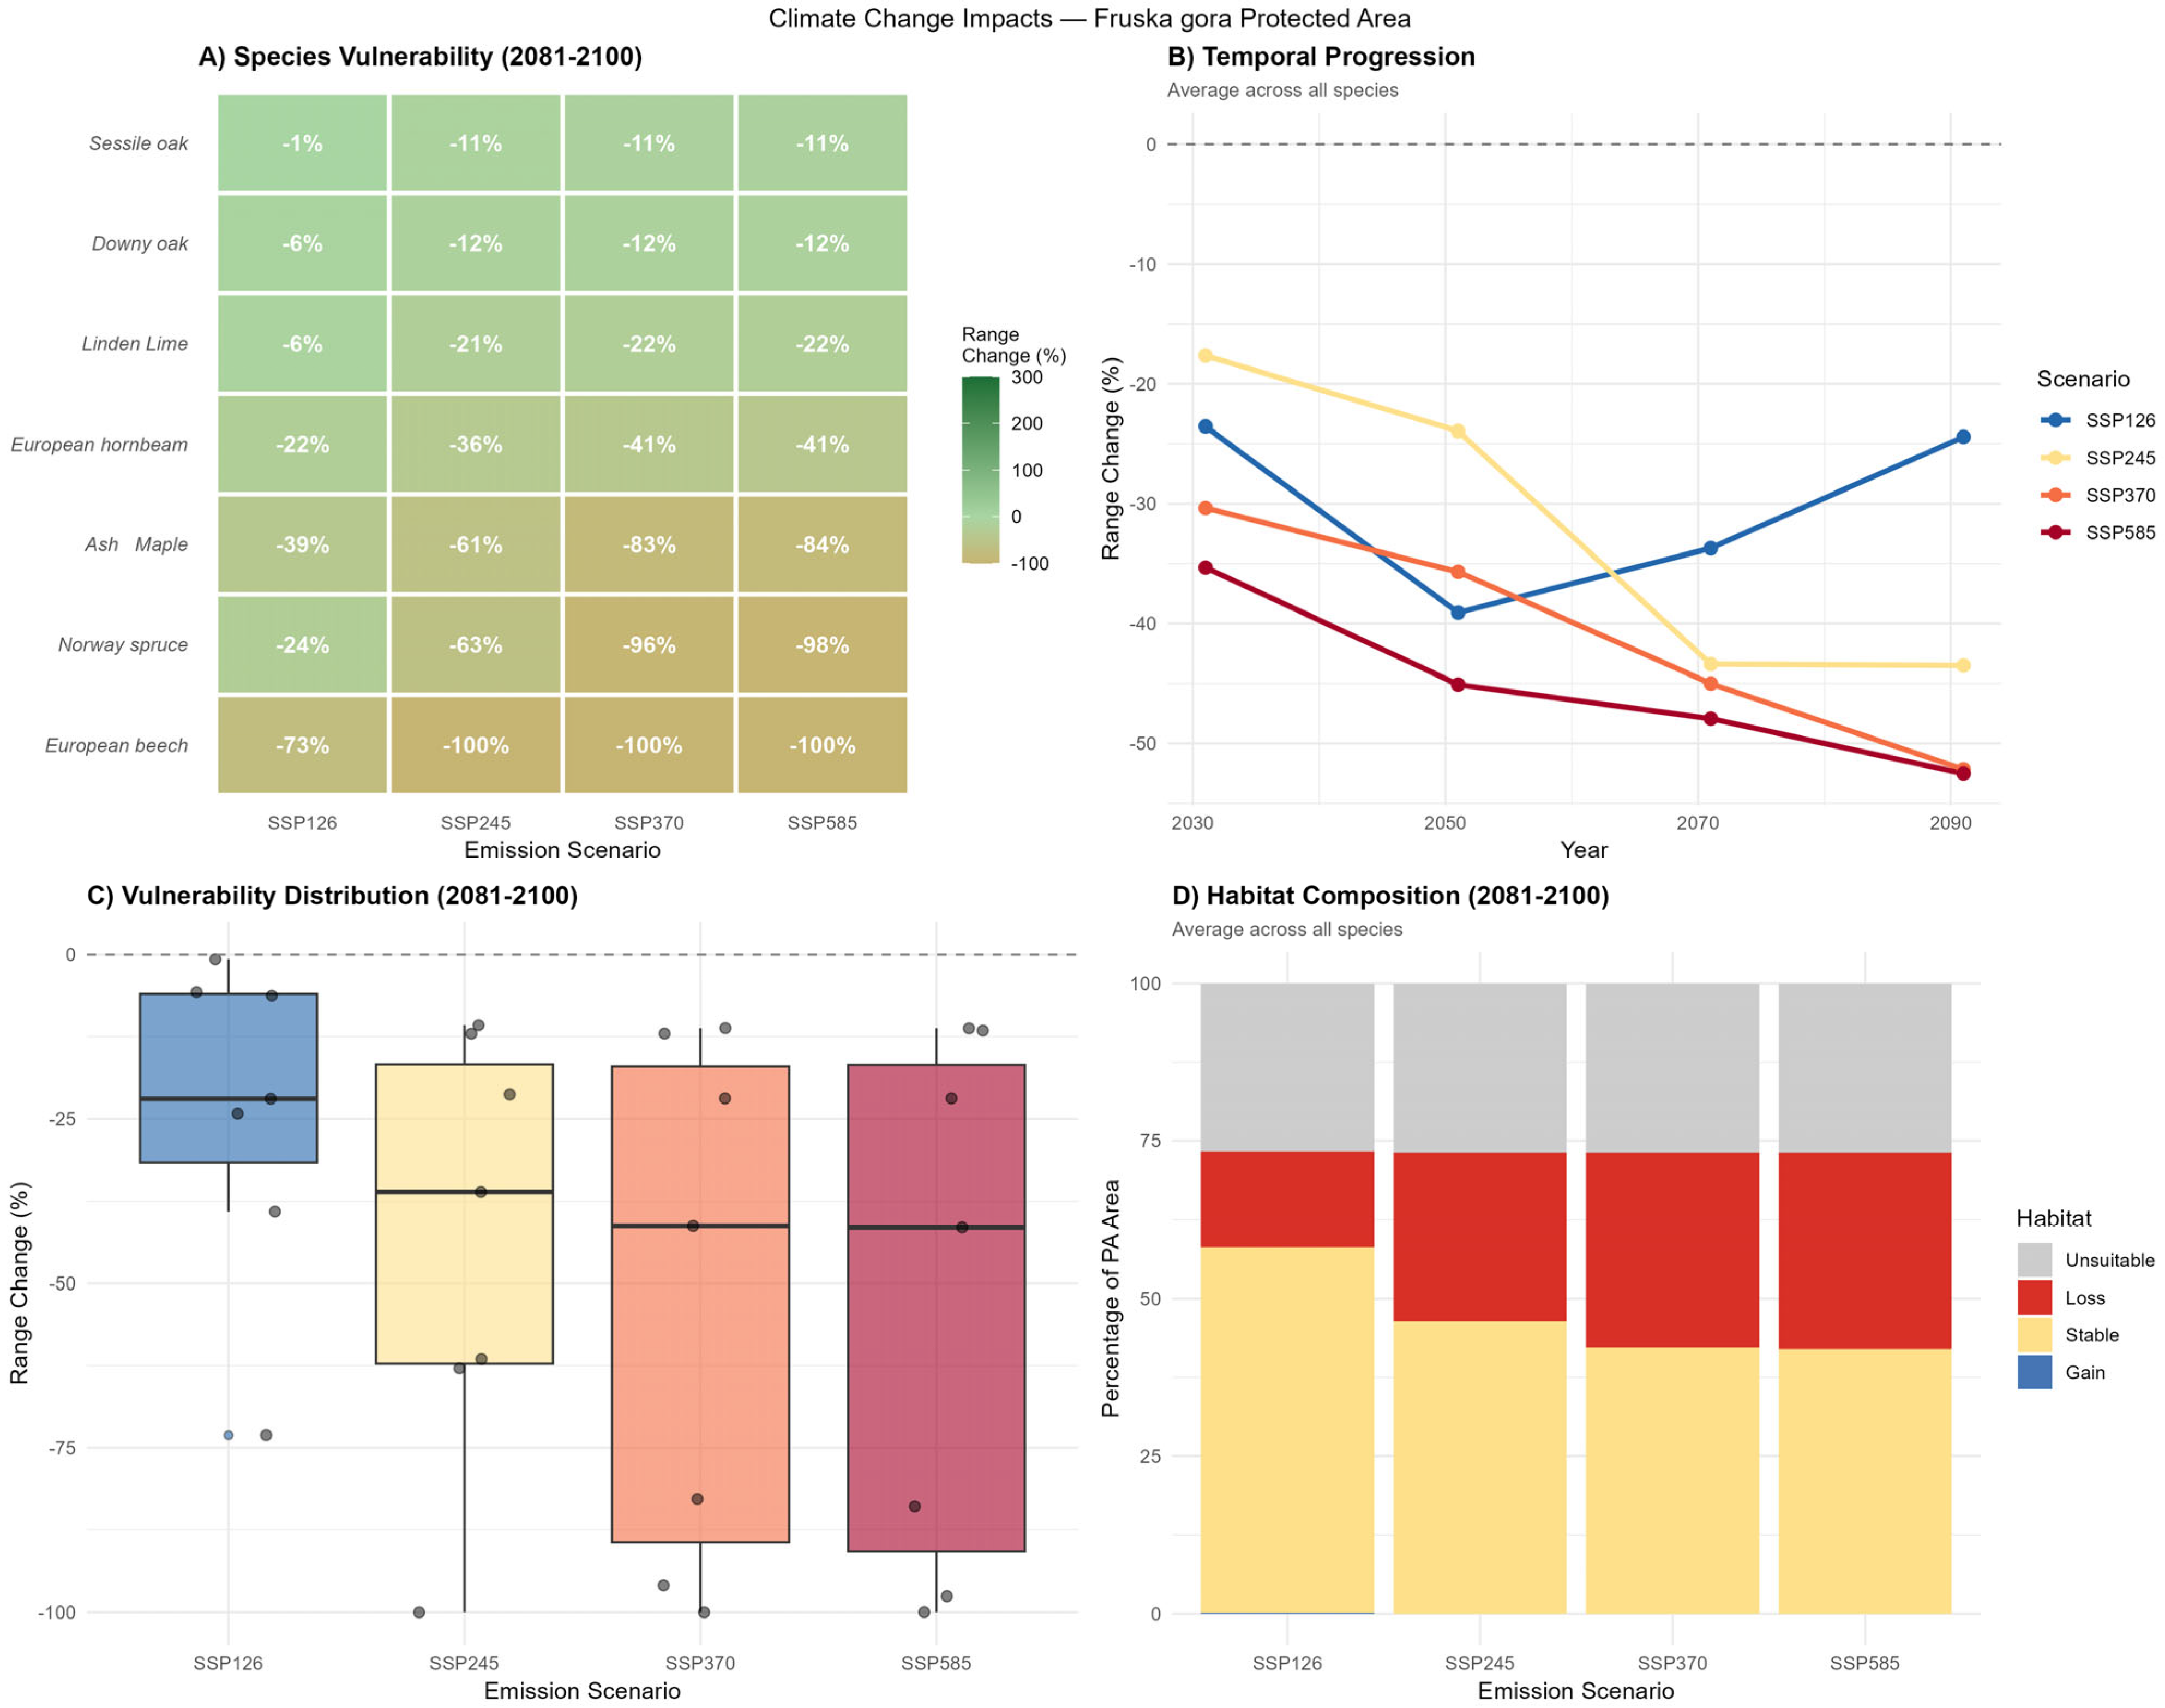
At Fruska gora mountain, all species project habitat losses by the end of the century. Sessile oak and Downy oak show the smallest declines (Sessile oak −1% to −11% and Downy oak −6% to −12%). Ash and Maple face severe losses (−39% to −84%), while Lime and European hornbeam show moderate to severe contractions (Lime −6% to −22%; hornbeam −22% to −42%). Conifers and mesic broadleaves are severely affected: Norway spruce potential habitats experience near-total loss (−24% under SSP1-2.6 to −98% under higher emissions), while European beech faces extreme contractions (−73% under SSP1-2.6 to −100% under SSP2-4.5 and above) (Figure 10A). Since conifers are not natural to Fruska gora and are limited, their potential habitat loss does not have meaningful ecological importance.
Figure 10.
Projected impacts of climate change on key tree species habitat suitability at the national park “Fruska gora”, focusing on potential range shifts within the protected area, primarily in the late 21st century (2081–2100). Panel (A) shows potential changes in the range for individual tree species across four SSP scenarios (SSP1-2.6: very low emissions; SSP2-4.5: intermediate emissions; SSP3-7.0: high emissions; and SSP5-8.5: very high CO2 emissions). Panel (B) shows the temporal progression of average range change (%) for all species from the ~2030s to 2090s. Panel (C) shows boxplots of the vulnerability distribution (range change in %) for 2081–2100 across scenarios. Panel (D) displays stacked bar charts of the average habitat composition (%) in the protected area for 2081–2100.
Under low-emission SSP1-2.6 (blue), changes are modestly negative initially but recover toward the late century. Intermediate SSP2-4.5 (yellow) and high SSP3-7.0 (orange) show progressive declines, peaking mid-to-late century, before reaching slight stabilization. Very high SSP5-8.5 (red) exhibits the steepest losses, reaching ~−30% average by mid-century and remaining severely negative (~−30%) through 2090, indicating persistent and widespread habitat degradation under intense warming (Figure 10B).
Stable (yellow) habitat decreases from ~70%–75% under SSP1-2.6 to ~60% under higher pathways. Loss (red) rises substantially (from ~10% to ~20%–25%), and gain (blue) is minimal or negligible (~0–5%), signaling predominant contraction of suitable habitats with little opportunity for compensatory expansion, likely constrained by the area’s isolated, low-elevation character (max ~539 m a.s.l.) and surrounding lowland/Pannonian Plain (Figure 10D and Figure A7).
3.4.6. Stara Planina
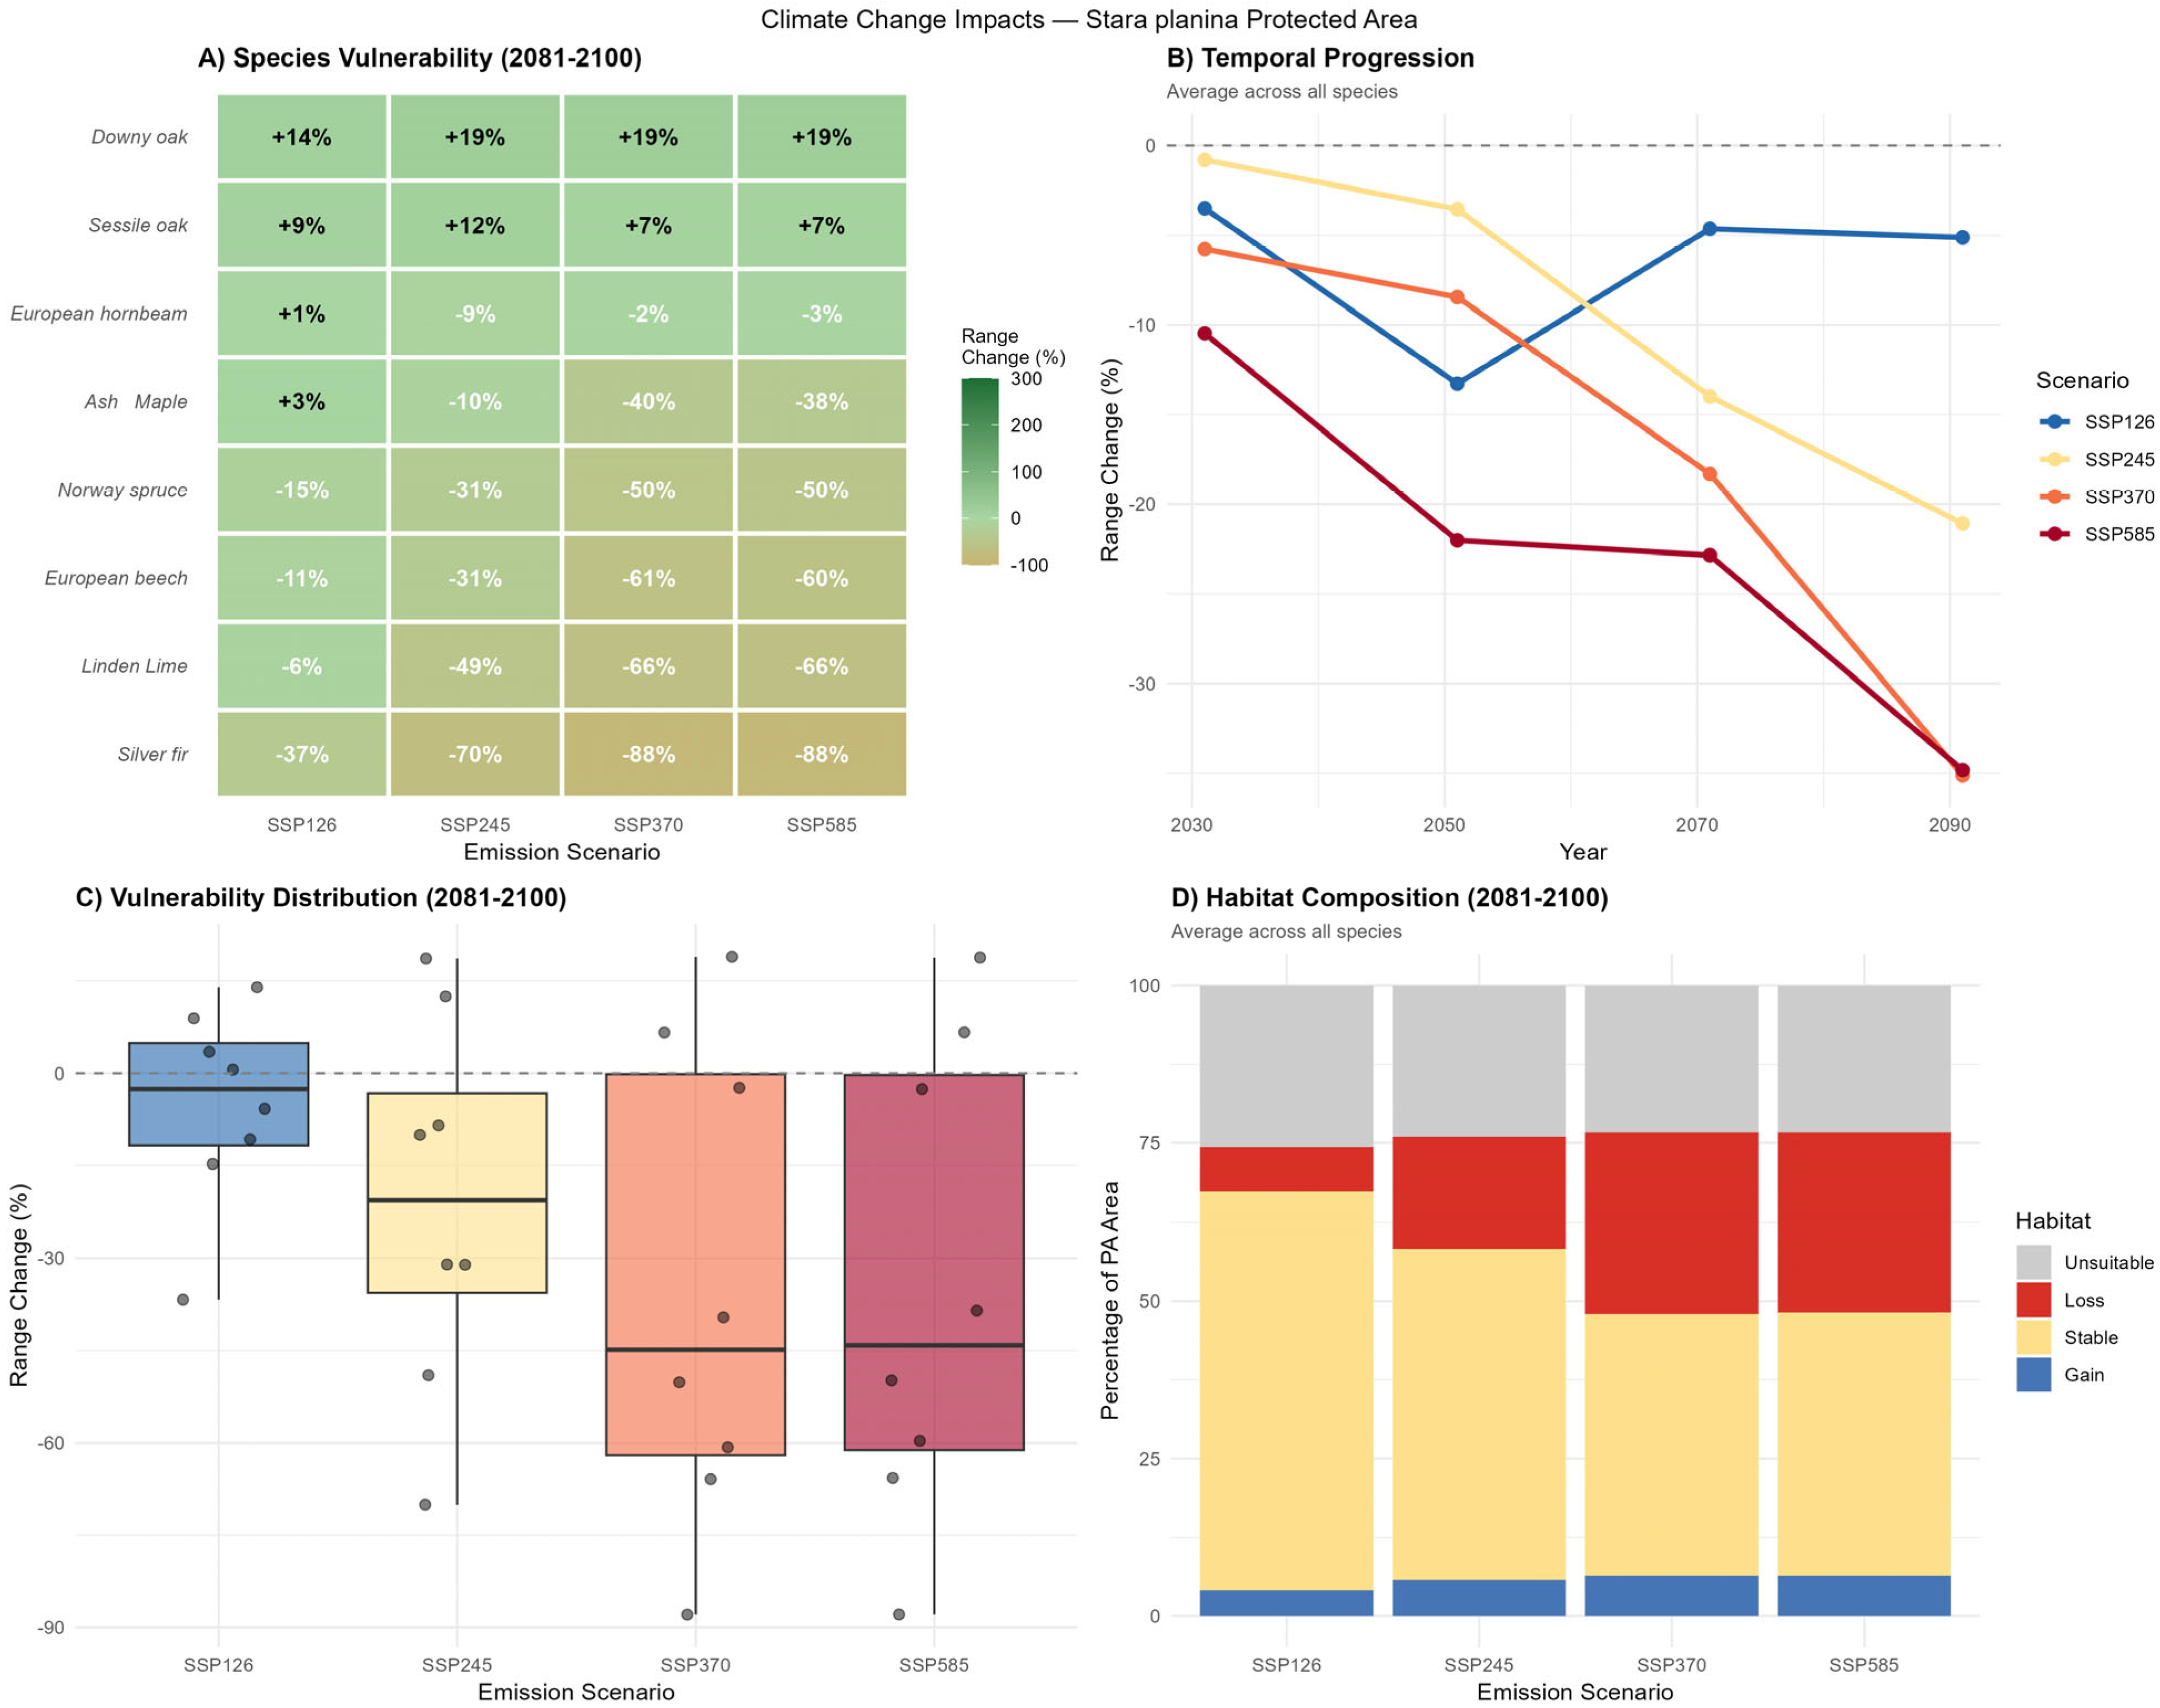
At Stara planina mountain, thermophilous or lower-elevation species like Downy oak show modest consistent gains (+14% to +19%), while Sessile oak exhibits gains across all scenarios (+7% to +13%), which contrasts with the pattern of most other protected areas. European hornbeam remains near-neutral under SSP1-2.6 (+1%) but shows moderate decline under higher scenarios (−9% under SSP2-4.5). Ash and Maple shift from slight gains under SSP1-2.6 (+4%) to substantial losses under higher scenarios (−38% to −40% under SSP3-7.0/SSP5-8.5). European beech faces increasing contractions (−11% to −61%). Conifers and mesic broadleaves are highly vulnerable: Norway spruce (−15% to −50%), Linden/Lime (−6% to −66%), and especially Silver fir (−37% to −88%, near-total loss under SSP3-7.0/SSP5-8.5) (Figure 11A).
Figure 11.
Projected impacts of climate change on key tree species habitat suitability at the nature park “Stara planina”, focusing on potential range shifts within the protected area, primarily in the late 21st century (2081–2100). Panel (A) shows potential changes in the range for individual tree species across four SSP scenarios (SSP1-2.6: very low emissions; SSP2-4.5: intermediate emissions; SSP3-7.0: high emissions; and SSP5-8.5: very high CO2 emissions). Panel (B) shows the temporal progression of average range change (%) for all species from the ~2030s to 2090s. Panel (C) shows boxplots of the vulnerability distribution (range change in %) for 2081–2100 across scenarios. Panel (D) displays stacked bar charts of the average habitat composition (%) in the protected area for 2081–2100.
Under low-emission SSP126 (blue), changes are modestly negative initially but stabilize or slightly recover toward the late century. Intermediate SSP2-4.5 (yellow) shows progressive declines accelerating by mid-century. High SSP3-7.0 (orange) and very high SSP5-8.5 (red) exhibit steeper losses, with SSP5-8.5 reaching the most severe average declines (~−45% to −50% by 2090), indicating accelerating and persistent habitat unsuitability under elevated warming and potential drying trends (Figure 11B).
Stable habitat areas (yellow) decrease sharply from ~70%–75% under SSP126 to ~40–50% under higher pathways. Loss (red) rises markedly (from ~10% to ~30%–40%) and gain (blue) remains very limited (~5%–10%), signaling predominant net contraction of suitable habitats for forest ecosystems with minimal opportunities for upslope or elevational expansion, likely constrained by the topographic limits (Figure 11D and Figure A8).
4. Discussion
4.1. Our Results in the Context of Similar Research
Our study focuses on eight tree species, Silver fir, Norway spruce, Linden/Lime, European beech, Sessile oak, European hornbeam, Ash and Maple, and Downy oak, within six protected areas and shows good alignment with several key earlier studies on climate change impacts in Europe, the Carpathians, the Alps, and temperate forests.
At the European scale, Hanewinkel et al. [39] projected where Norway spruce would be among the most severely affected species, losing the majority of its current suitable habitats.
Within a study in Hungary (bordering Serbia), where European beech and Sessile oak are at the “trailing edge”, some extremes were predicted: 56%–99% of present-day beech forests could be outside their current bioclimatic niche by ~2050 [40]. The differences between six protected mountainous areas that we evaluated are that those habitats are mostly considered optimal for tree growth, and it might be misleading to compare “edge” and “optimal” cases. The diversity of scenarios and other factors are so large that a discussion about the exact % of decline in the sense of particular species may also be misleading. Other research that included dendrochronological studies in Serbia (past tree growth) in recent decades shows that a change in climate is followed by a decline in species growth [41], leading towards eventual mortality at some point in time. Climate change may thus represent the major challenge for coniferous forests in Balkan, which has been noted in multiple studies until now [42].
Our results for six PAs align with the broader analysis of Dyderski et al. [43], who reported that many broadleaved tree species, such as oaks, exhibit smaller declines or even stable suitability patterns under climate projections compared with more climate-sensitive taxa. Such a statement may not necessarily be true for the whole range of modeled species in the territory of Serbia due to the expected severe climate conditions and species retreat, but it is completely in line with the results in the six PAs where baseline ecological conditions are particularly favorable for forest ecosystems.
Our projections for Downy oak (Quercus pubescens) showing range expansion and stability are consistent with broader patterns of thermophilous species resilience under projected warming. The projected expansion of Downy oak and Sessile oak in all six observed mountainous PAs in Serbia, currently dominated by montane and mesophilous forest types, is consistent with the expected upward elevation displacement of the sub-Mediterranean climate influence into the continental Balkans (Figure 6, Figure 7, Figure 8, Figure 9, Figure 10, Figure 11, Figure A3, Figure A4, Figure A5, Figure A6, Figure A7 and Figure A8).
Taken together, our PA-level results for Serbia align with the broader European pattern identified across multiple SDM studies: thermophilous and drought-tolerant species consistently gain suitability while cold-adapted montane taxa contract, with the magnitude and rate of change scaling with emission scenario intensity. The cross-PA comparison framework employed here, spanning a lowland Pannonian to high-mountain subalpine gradient across six ecosystems including a UNESCO Biosphere Reserve, provides a regionally specific quantification of these dynamics that can directly inform national-level adaptive conservation and forest management strategies in Southeast Europe.
4.2. Conservation Implications for the Most Endangered Species
The projected climate change impacts across Serbian PAs reveal a pronounced vulnerability gradient among the eight key tree species. Our research suggests that cold-adapted montane conifers (Norway spruce and Silver fir) and mesic broadleaves (European beech, primarily) face the most severe threats.
Silver fir emerges as the highest-priority species for immediate action, exhibiting average losses of around ~90% of current habitats under SSP5-8.5 by the end of the century (particularly in Golija, Stara Planina, and Tara). Its potential loss would disrupt ecosystem functions and reduce structural complexity. Immediate conservation measures may assume the establishment of ex situ conservation through seed banks and provenance collections and the implementation of assisted migration trials to higher-elevation refugia within high-mountain areas where fir is not dominant (e.g., Kopaonik). Conservation measures may assume the protection of all remaining populations in refugia and old-growth stands.
Norway spruce showed high vulnerability in lower-elevation PAs (complete loss of habitat suitability in Fruska gora and Djerdap, where it is not actually present in natural forests), with projected average habitat suitability losses of approximately 30% and 60% for Golija and Stara planina, respectively, under the high-emission SSP5-8.5 scenario. In the case that there are no disturbances and extremes, we might assume long-term stability, but drought events followed by bark beetle outbreaks and spruce mortality do not give us optimism. Conservation priorities may focus on active management in high-elevation refugia (Kopaonik, Stara Planina, Tara, and Golija), promoting natural regeneration; favoring cooler, moister microhabitats (north slopes); and reducing competitive pressure and pest risks through on-time sanitation felling.
European beech can be considered a not so highly vulnerable species within Serbian PAs. Populations in high-mountain PAs (Kopoanik and Tara) may not be so endangered by climate change (also expected to experience promotion/to move into currently upper-elevation conifer habitats) by the end of the century from the perspective of habitat suitability (not including extreme events that were not evaluated within this study), while the lower-elevation PAs (Fruska gora and Djerdap) would expect loss of the majority of their current populations independent from these scenarios. Conservation priorities may include active management in high-elevation refugia (e.g., Kopaonik, Tara, Stara Planina, and Golija), including the promotion of natural regeneration in cooler, moister microsites (northern exposure); a reduction in competitive stress; the establishment of migration corridors; and the promotion of mixing with other species.
4.3. Conservation Implications for the Most Endangered PAs
The most endangered Pas, in terms of projected impacts of climate change on forest habitats, tree species, and ecosystems by the end of the 21st century based on our research, are Stara Planina, Fruska Gora, and Djerdap. These sites exhibit the most severe overall habitat losses across emission scenarios.
Stara Planina Nature Park emerges as the most critically endangered protected area overall, where loss of suitable forest habitat may be up to 50% in two high-emission scenarios (SSP3-7.0 and SSP5-8.5) by the end of the 21st century. The current change in climate assumes the strongest impact in eastern parts of Serbia, where under observed normal climate conditions, in 1990–2019, a decrease in precipitation was found in comparison to the 1991–1990 period (contrary to the more western part of Serbia, where an increase in precipitation was observed and where Tara and Kopaonik are located) [10]. The past decade showed intensive drying up of mountain springs, which is an indicator of negative events that would impact vegetation. Priorities for conservation may include the establishment of strict climate refugia for remnant montane populations at the most suitable habitats; the removal of barriers to upslope shifts; the promotion of adaptive silviculture in transition zones (promotion of mixed regeneration favoring resilient oaks); and the establishment of intensive monitoring for forest dieback, phenological mismatches, and pest and disease attacks.
Fruska Gora National Park faces high vulnerability as an isolated low-elevation forest island (max ~539 m) in the Pannonian Plain. Ongoing Sessile oak dieback (data from Public Enterprise NP “Fruska gora”) on some southern slopes signals drought stress already in the year 2025. This signals the necessity for a shift toward drought-tolerant oaks but with overall substantial net habitat loss. Our predictions that assume consistent negative average forest habitat suitability changes (~−10% to −25% across scenarios) and severe declines for mesophilous species (European beech and hornbeam) by the end of the century, aggravated by limited elevational gradients, surrounding agricultural and urban areas, and isolation from other forest ecosystems that prevent species migration, should give priority to conservation measures. Forest managers may prioritize tree species compositional transitions (e.g., promoting thermophilous oaks like Turkey and Downy oak in regeneration), protecting riparian and cooler microrefugia and implementing adaptive strategies such as the promotion of mixed forests and more intensive forest monitoring.
Djerdap National Park is severely threatened by topographic and elevational barriers (max ~800 m) and steep gorges along the Danube. Habitat contractions across scenarios is expected, from modest under SSP1-2.6, about −10%, to severe under SSP5-8.5, at about −20 to −30%, and very big losses for mesic species: for European beech, from −42 to –87%, and for hornbeam, from −7 to –25%. Conservation measures may include measures to help in the transition to thermophilous species (oaks, maple, and silver lime).
4.4. Why EQ Instead of Raw Bioclim?
The Bioclim set of 19 variables has two groups: BIO1-11 temperature-derived variables and BIO12-19 precipitation-derived variables. Multiple model runs showed that selecting two or more BIO variables consistently yielded lower performance than using just EQ. An “expert knowledge approach” (since our team consists of PhD ecologists, a PhD forest engineer, a PhD agriculture engineer, and a PhD physical geographer), correlation analysis, variance of inflation factor (VIF), and LASSO were used, but all approaches were less successful than just the use of EQ [44]. Alternatively, we considered a FAI index that takes the spring and summer months’ temperatures and precipitation amounts into account, but it was not generally superior in comparison to EQ. Actually, the FAI was slightly better for some of the species, but provided poor results for the other species. The key advantage of EQ lies in its temporal stability, since it represents long-term climate using annual precipitation and July temperature, providing a stable base for future predictions where extremes during the summer months dominate. On the contrary, FAI showed a critical limitation for the projections. FAI is calculated using monthly precipitation data across the growing season (April–September) and, in some cases, produces artificially extreme values under future climate scenarios, which might be more significant in, e.g., agriculture, where everything happens during one season. When individual months are projected to near-zero precipitation in future scenarios, however, FAI values can become disproportionately inflated, leading to extremely negative habitat suitability predictions, even in the near future. In that sense, the effect of the longer period (even multiple-season precipitation) correlates significantly with tree growth and vitality [41], which EQ captures in a better way than FAI. Even the usage of EQ + FAI for climate provided less good performance and realistic predictions than just EQ.
Despite these advantages, EQ compresses intra-annual climate variation into a single quotient and therefore cannot capture ecologically critical extremes such as multi-day heatwave sequences or consecutive-month drought events. These processes are particularly relevant for conifer mortality dynamics: bark beetle outbreaks in Norway spruce, for instance, are often triggered by short-term drought stress that weakens tree defenses rather than by mean annual aridity alone. Future work incorporating indices that explicitly capture growing-season extremes such as SPEI at multiple timescales or the maximum temperature of the warmest month (BIO5) could complement EQ-based models for conifer vulnerability assessments, particularly in the context of increasing frequency of compound climate events.
4.5. Study Improvements
A way to improve the modeling of species distribution is by using a hybrid model in which we will assume significantly different modeling settings for each species. We tested a lot of different sets of modeling frameworks and different R packages (BIMOD2 [45], besides mlr3) and tried a selection of variables using various techniques (correlation, Lasso, TSS@0.5, etc.). In scenarios where maxTSS was used as the criterion for defining thresholds, model Naive Bayes was superior to other ML algorithms, since it provided much better balance between sensitivity and specificity.
Naive Bayes can perform very well even when the independence assumption is violated [44], meaning that it is relevant for SDM predictors, which are often correlated, such as EQ, elevation, SOC, and NDVI.
An improvement to the methodology in the context of fitting the framework to certain species or species groups (e.g., conifers) can be achieved by using the approach by Zimmermann et al. [46], who incorporated climatic extremes that significantly improved the predictions of spatial patterns for species in Switzerland, particularly montane conifers and species such as Abies alba and Picea abies. In model testing, we tried to use different variables that favor extremes in some sense (bioclimatic variables that focus on maximal temperatures or the driest month), but generally, the species pool was dominated by broadleaves that did not respond well to such an approach.
During model testing, we found that various approaches provided various results, usually not balanced. The most common scenarios were that some species were modeled extraordinarily well (e.g., European beech, or Silver fir and Norway spruce, as the species limited to several high-mountain ecosystems), but the majority of other species models were flawed. Our aim was to be able to make a certain amount of generalizations where the majority of species will be represented in a satisfiable way using the same framework. In that sense, for overall results improvement, a hybrid approach remains a possibility, meaning that a specific set of algorithms, parameters, and variables are devoted to each tree species, with letter joining of the model results into a coherent story.
To address the single-GCM limitation, we conducted a sensitivity analysis comparing CMCC-ESM2 with MPI-ESM1-2-HR for European beech (see Section 4.5); the results confirmed that inter-model uncertainty is negligible relative to inter-scenario uncertainty.
Two predictor-related limitations warrant explicit acknowledgement. First, NDVI was derived from a single growing season (2020) and treated as time-invariant in future projections. While this approach is justified when NDVI serves as an integrated site-productivity proxy rather than a directly projected climate variable, we cannot exclude that long-term shifts in vegetation productivity under climate change may alter the NDVI–environment relationship beyond our projection period. Our sensitivity analysis showed that excluding NDVI changed the projected range by less than 5% on average, suggesting that this assumption does not materially affect the directional conclusions of this study. Second, SOC (0–5 cm) was treated as temporally invariant. Forest topsoil SOC responds to climate change on decadal-to-centennial timescales, making static treatment defensible for near- and mid-term projections, but potentially less so towards the end of the century under high-emission scenarios. Both assumptions are consistent with common SDM practice for edaphic and structural predictors but should be revisited as dynamic soil–vegetation models become more widely available.
To address the concern regarding reliance on a single General Circulation Model (GCM), we conducted a sensitivity analysis comparing projections from two GCMs (CMCC-ESM2 and MPI-ESM1-2-HR) for European beech under SSP1-2.6 and SSP5-8.5 for 2081–2100. Spatial agreement between the two models exceeded 97% across both scenarios, with Schoener’s D values of 0.970 (SSP1-2.6) and 0.988 (SSP5-8.5). Projected range changes differed by less than 1 percentage point (−12.2% vs. −12.9% for SSP1-2.6; −47.1% vs. −47.8% for SSP5-8.5). These results confirm that inter-model GCM uncertainty is negligible compared to inter-scenario uncertainty (the difference between SSP1-2.6 and SSP5-8.5 is about 35%), supporting the robustness of our conclusions.
5. Conclusions
- Climate change has significant potential to reduce overall forest habitat suitability in at least three significant protected areas in Serbia (Fruska gora, Djerdap, and Stara planina) by the end of the 21st century, independent from climate scenarios; one protected area (Golija) would have a slight increase in two lower-emission scenarios and a significant decrease in two higher-emission scenarios; two high-mountain ecosystems (Kopaonik and Tara) can expect a net increase in overall forest suitability, but not necessarily in the same forest tree species composition.
- Reductions in habitats for conifers and mesophilous broadleaves would be followed by the promotion of habitats for thermophilus oaks at higher elevations across all observed forest ecosystems.
- By the 2090s, generally, contraction of specialized narrow ecological niche conifers (Silver fir and Norway spruce) can be expected; also, the widely populated European beech is going to suffer a decline by the end of the century, especially in low-elevation national parks (Fruska gora and Djerdap).
- Downy oak and Sessile oak will have greater potentials in higher-elevation habitats and probably an overall reduction in low-elevation reserves under high-emission scenarios by the end of the 21st century.
Author Contributions
Conceptualization, D.B.S.; methodology, D.B.S., R.S. and I.D.; validation, S.D.P. and D.T.; analysis, D.B.S. and V.V.; writing—original draft preparation, D.B.S. and V.V.; writing—review and editing, D.T., R.S., S.S., N.R. and D.V.; visualization, D.B.S. and I.D.; supervision, S.D.P. and V.V. All authors have read and agreed to the published version of the manuscript.
Funding
This research was funded by the Provincial Secretariat for higher education and science, under the title “Research into the causes of reduced vitality and dieback of Sessile oak trees on Fruška Gora”, grant number 003875013 2025 09418 003 000 000 001 04 004, and by the Ministry of Science, Technological Development and Innovation of the Republic of Serbia for 2026, grant number 451-03-33/2026-03/200197 & 451-03-34/2026-03/200125.
Data Availability Statement
The data that support the findings of this study are available from the corresponding author upon reasonable request.
Conflicts of Interest
The authors declare no conflicts of interest. The funders had no role in the design of this study; in the collection, analyses, or interpretation of data; in the writing of the manuscript; or in the decision to publish the results.
Abbreviations
The following abbreviations are used in this manuscript:
| PA | Protected Areas |
| ML | Machine Learning |
| RF | Random Forest |
| XGBoost | Extreme Gradient Boosting |
| GLMNET | Generalized Linear Model with LASSO |
| RIDGE | Ridge Regression |
| SVM | Support Vector Machine |
| SSM | Shared Socioeconomic Pathway |
| EPV | Events Per Variable |
Appendix A
Figure A1.
Projected temperature change (°C) relative to baseline (1970–2000) across four scenarios (SSP1-2.6, SSP2-4.5, SSP3-7.0, and SSP5-8.5) and four 20-year periods (2021–2040, 2041–2060, 2061–2080, and 2081–2100) at higher elevation sites (around 1000 m elevation above sea level and more; Kopaonik, Tara, Golija, and Stara planina) and lower sites (around 300 m elevation above sea level; Djerdap and Fruska Gora). The heatmap colors indicate warming (red) or cooling (blue), while gray was above 8 degrees. Scenarios are on the y-axis, and months on the x-axis. Each panel represents one protected area (data from the WorldClim database and the CMCC-ESM2 model).
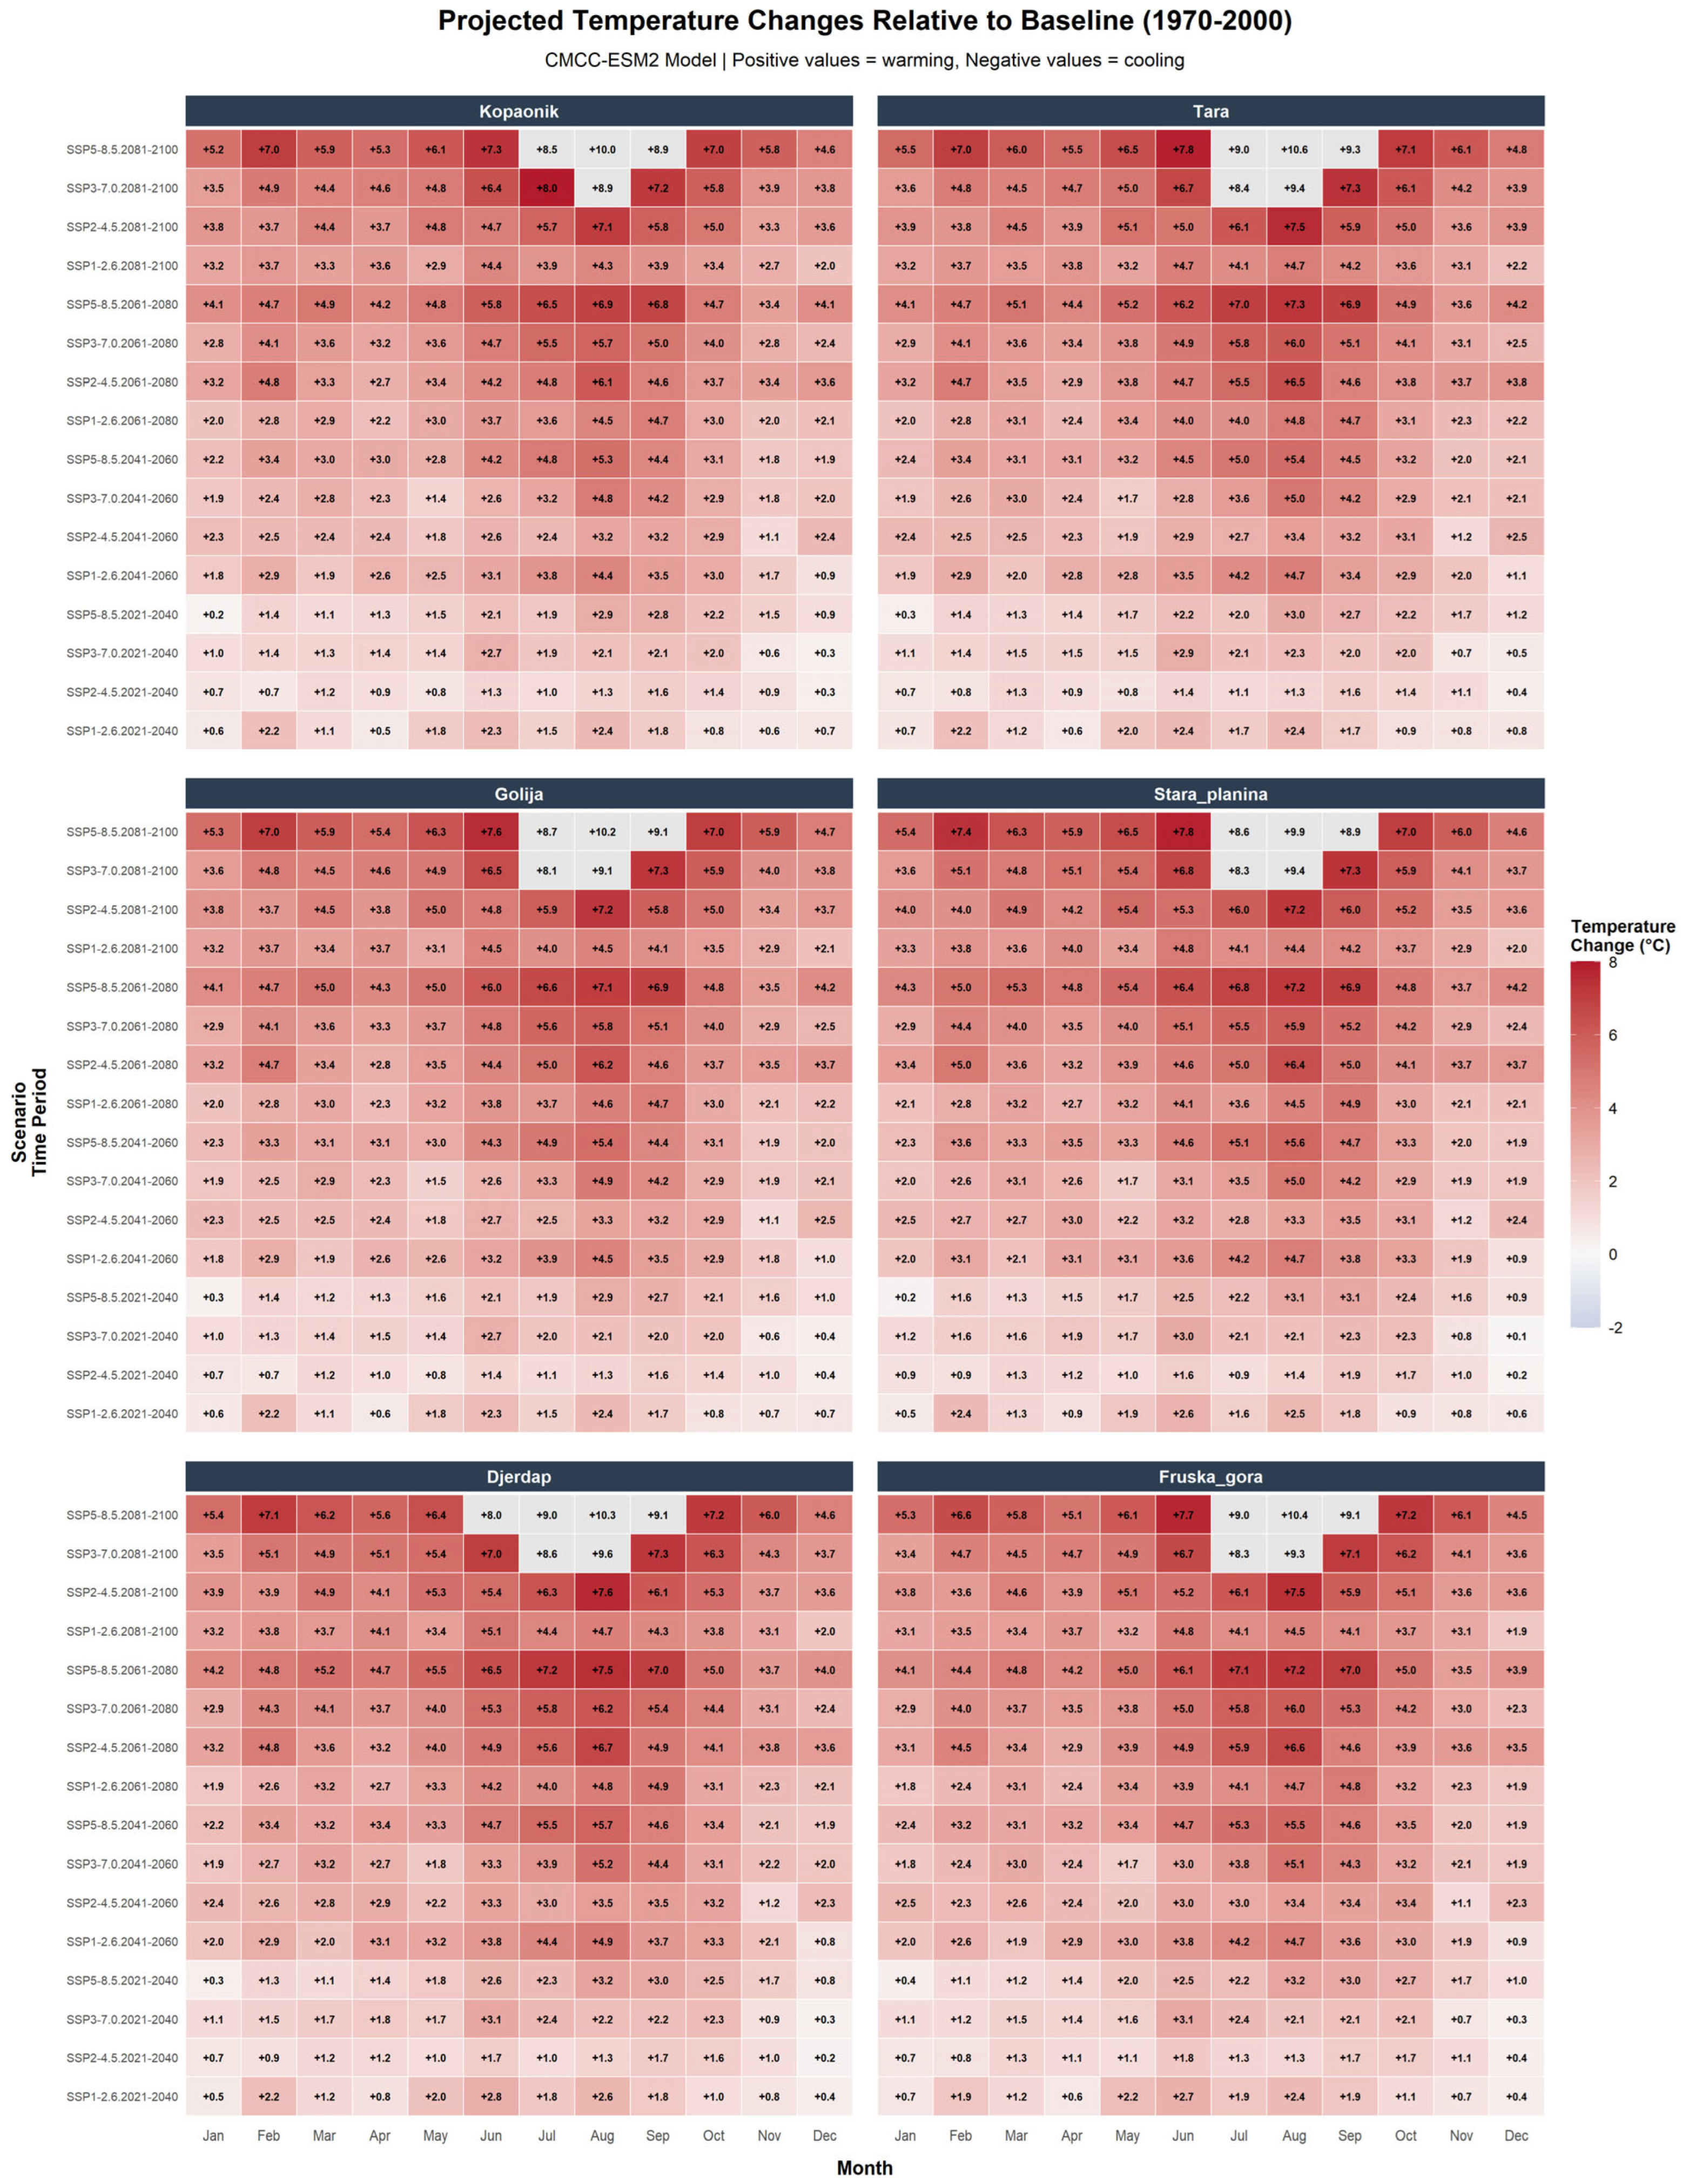
Figure A2.
Projected precipitation change (%) relative to baseline (1970–2000) across four scenarios (SSP1-2.6, SSP2-4.5, SSP3-7.0, and SSP5-8.5) and four 20-year periods (2021–2040, 2041–2060, 2061–2080, and 2081–2100) at higher elevation sites (around 1000 m above sea level and more; Kopaonik, Tara, Golija, and Stara planina) and lower sites (around 300 m above sea level; Djerdap and Fruska Gora). The heatmap colors indicate wetter (teal) or drier (brown) conditions, with values in fields showing percentage changes. Scenarios are on the y-axis, and months on the x-axis. Each panel represents one protected area (data from the WorldClim database and the CMCC-ESM2 model).
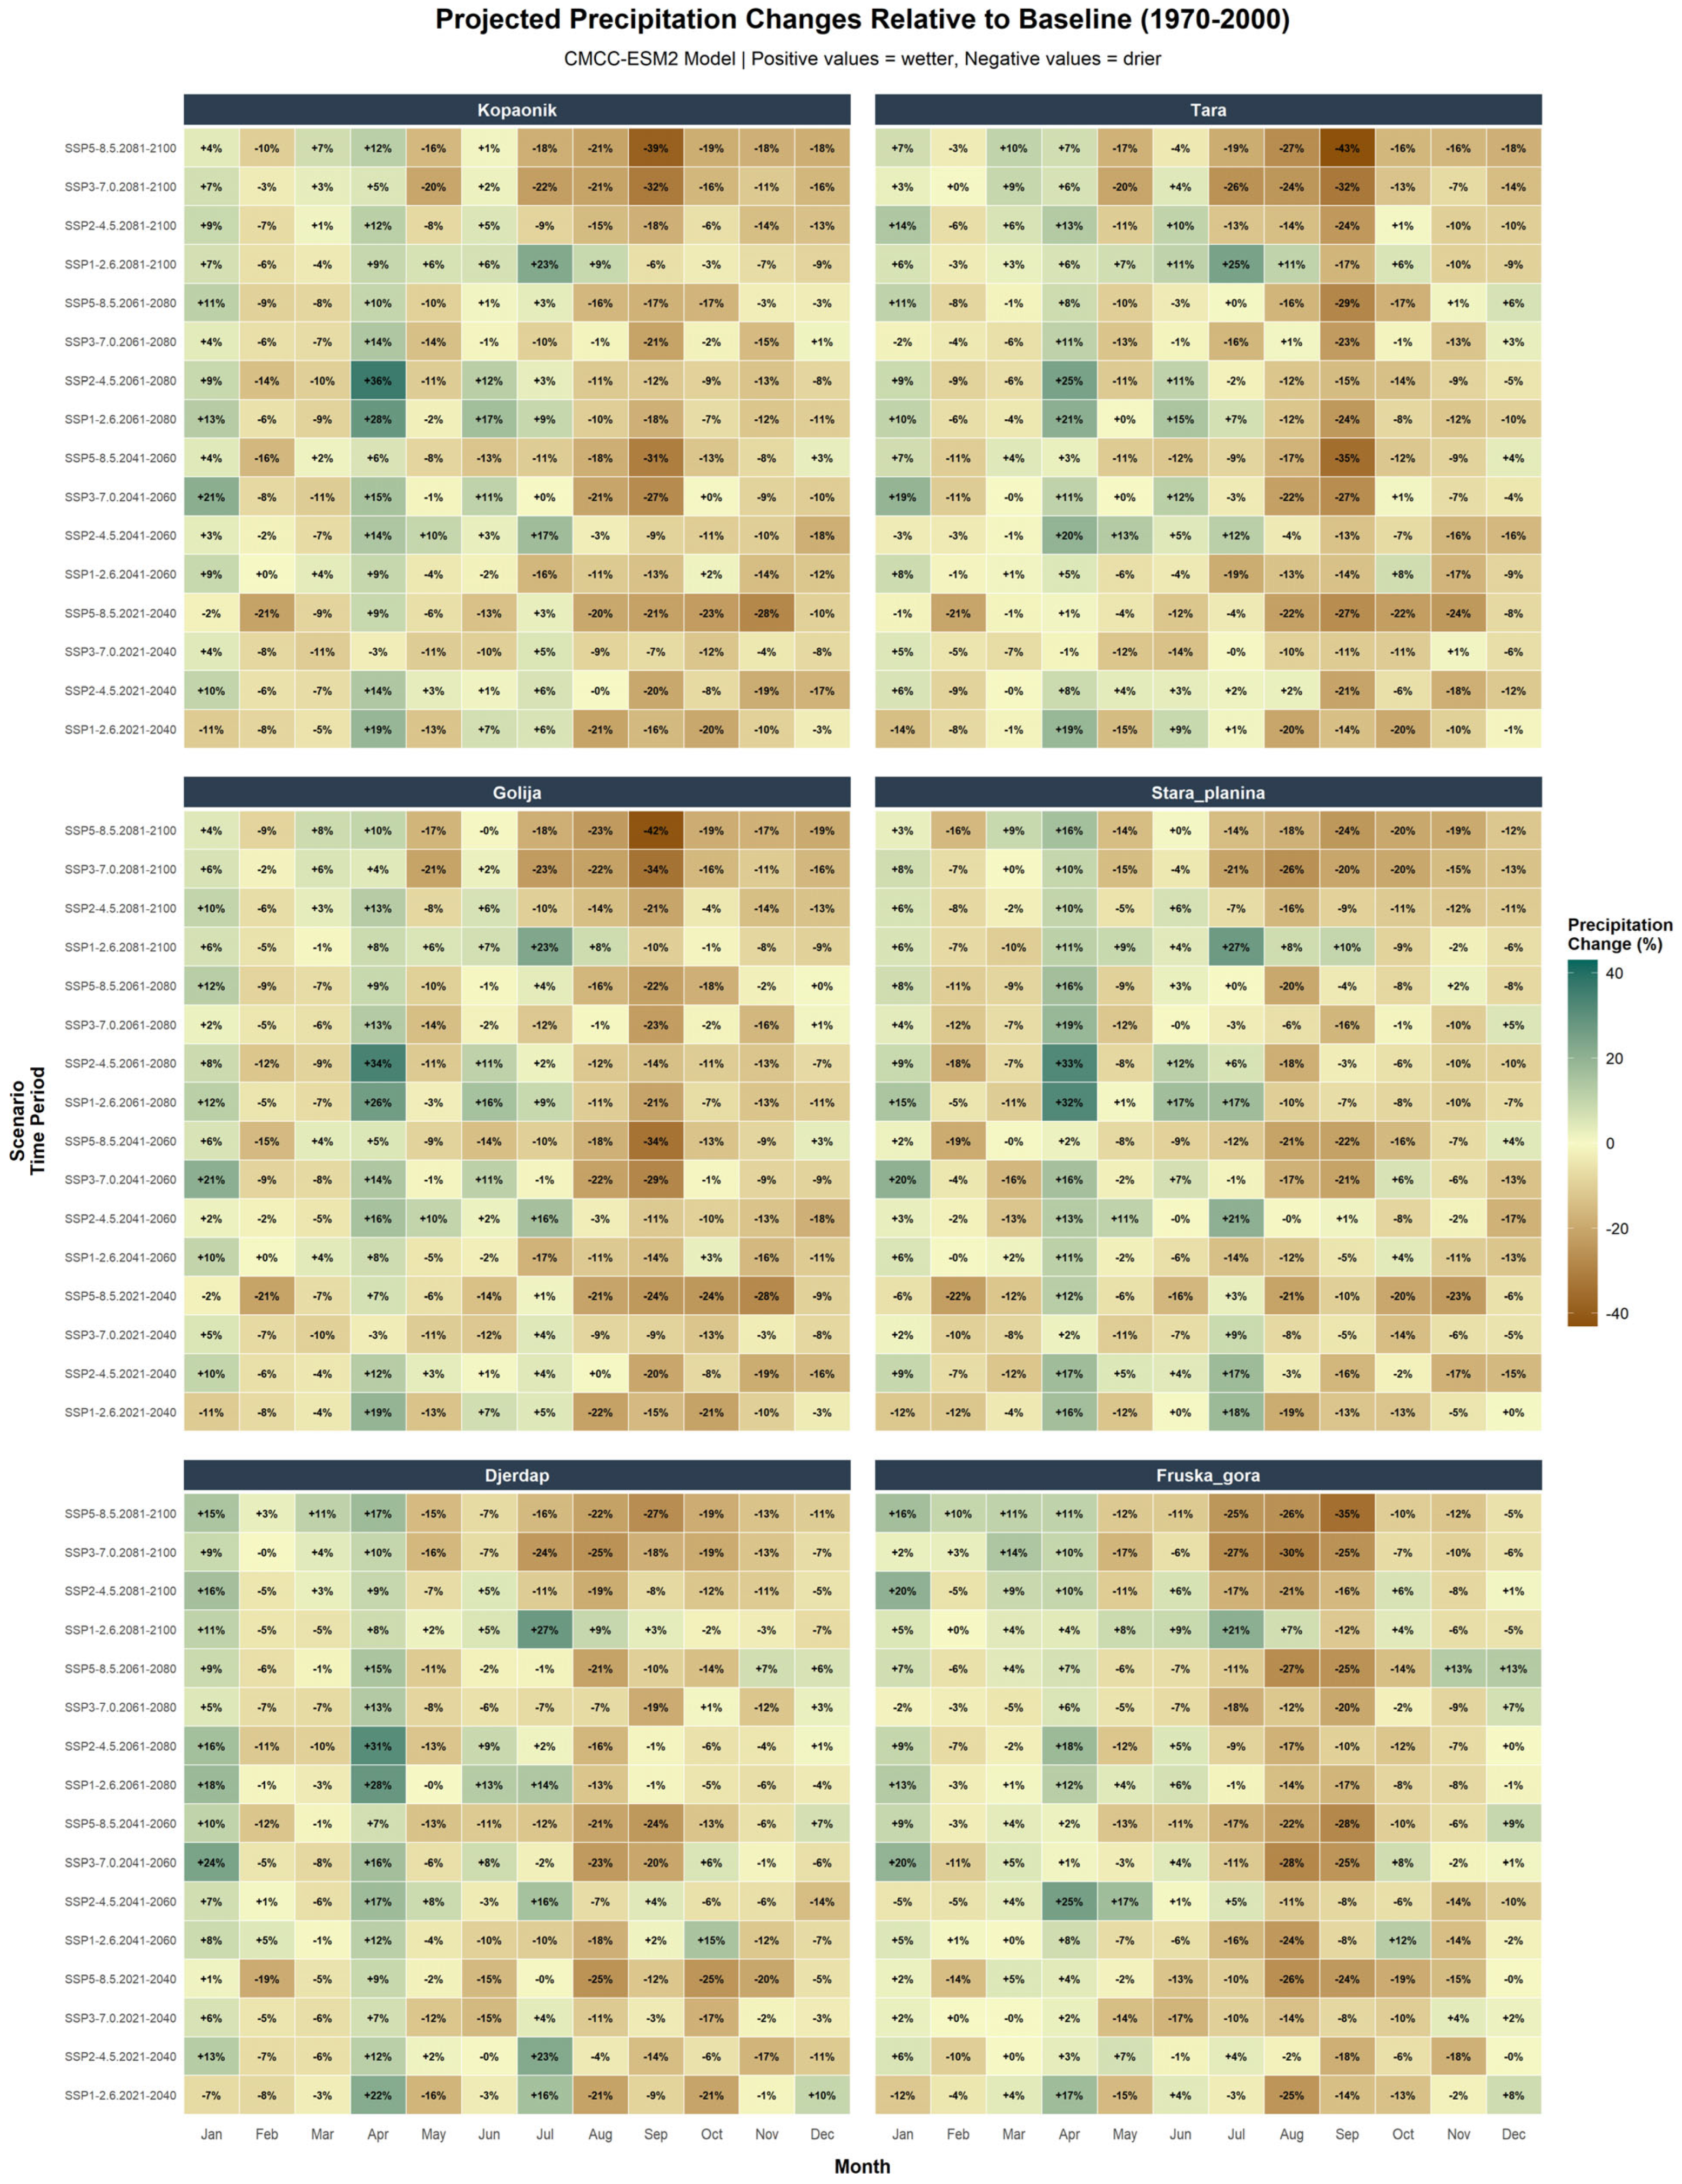
Figure A3.
Projected habitat changes for eight forest species in Kopaonik National Park under the high-emission scenario (SSP5-8.5, 2081–2100). Stable habitat (dark green)-areas remaining suitable; loss (orange)-currently suitable areas projected to become unsuitable; gain (light green)-currently unsuitable areas projected to become suitable; and unsuitable (gray)-areas unsuitable in both current and future conditions. Silver fir shows the greatest habitat losses, while thermophilous oaks (Downy) significant gains.
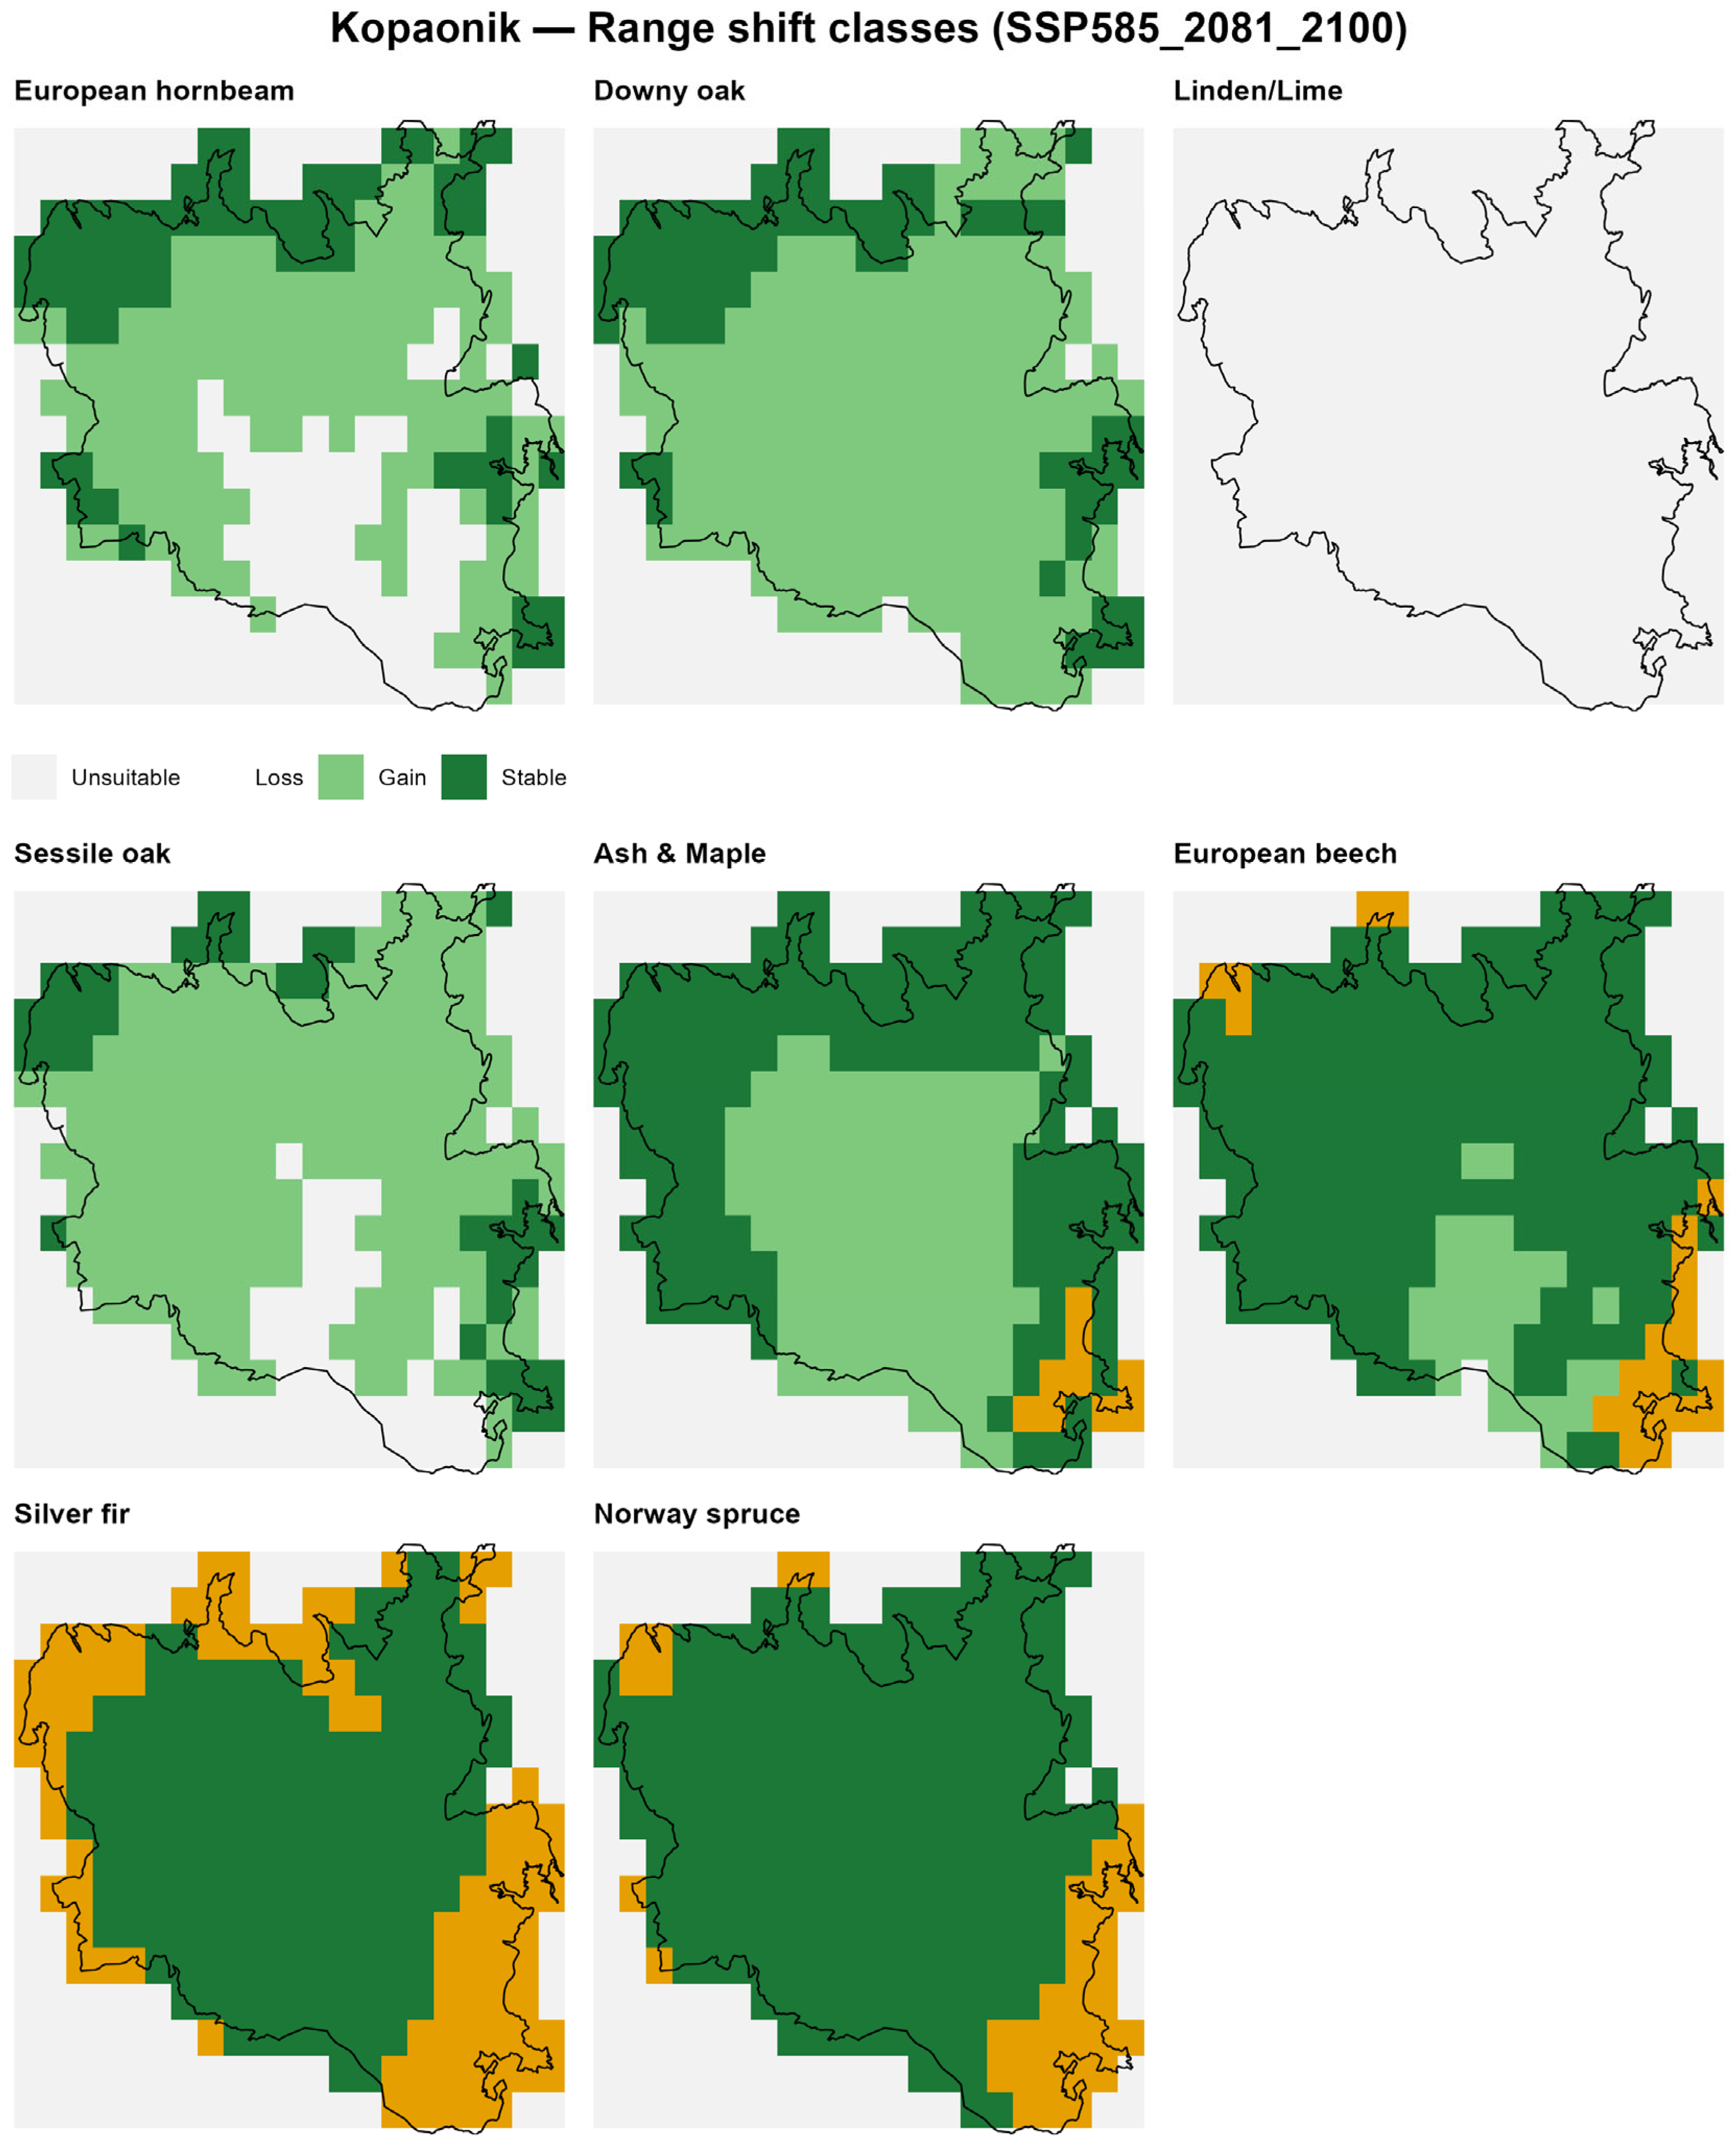
Figure A4.
Projected habitat changes for eight forest species in Tara National Park under the high-emission scenario (SSP5-8.5, 2081–2100). Stable habitat (dark green)-areas remaining suitable; loss (orange)-currently suitable areas projected to become unsuitable; gain (light green)-currently unsuitable areas projected to become suitable; and unsuitable (gray)-areas unsuitable in both current and future conditions. Silver fir shows the greatest habitat losses, and hornbeam and oaks significant gains.
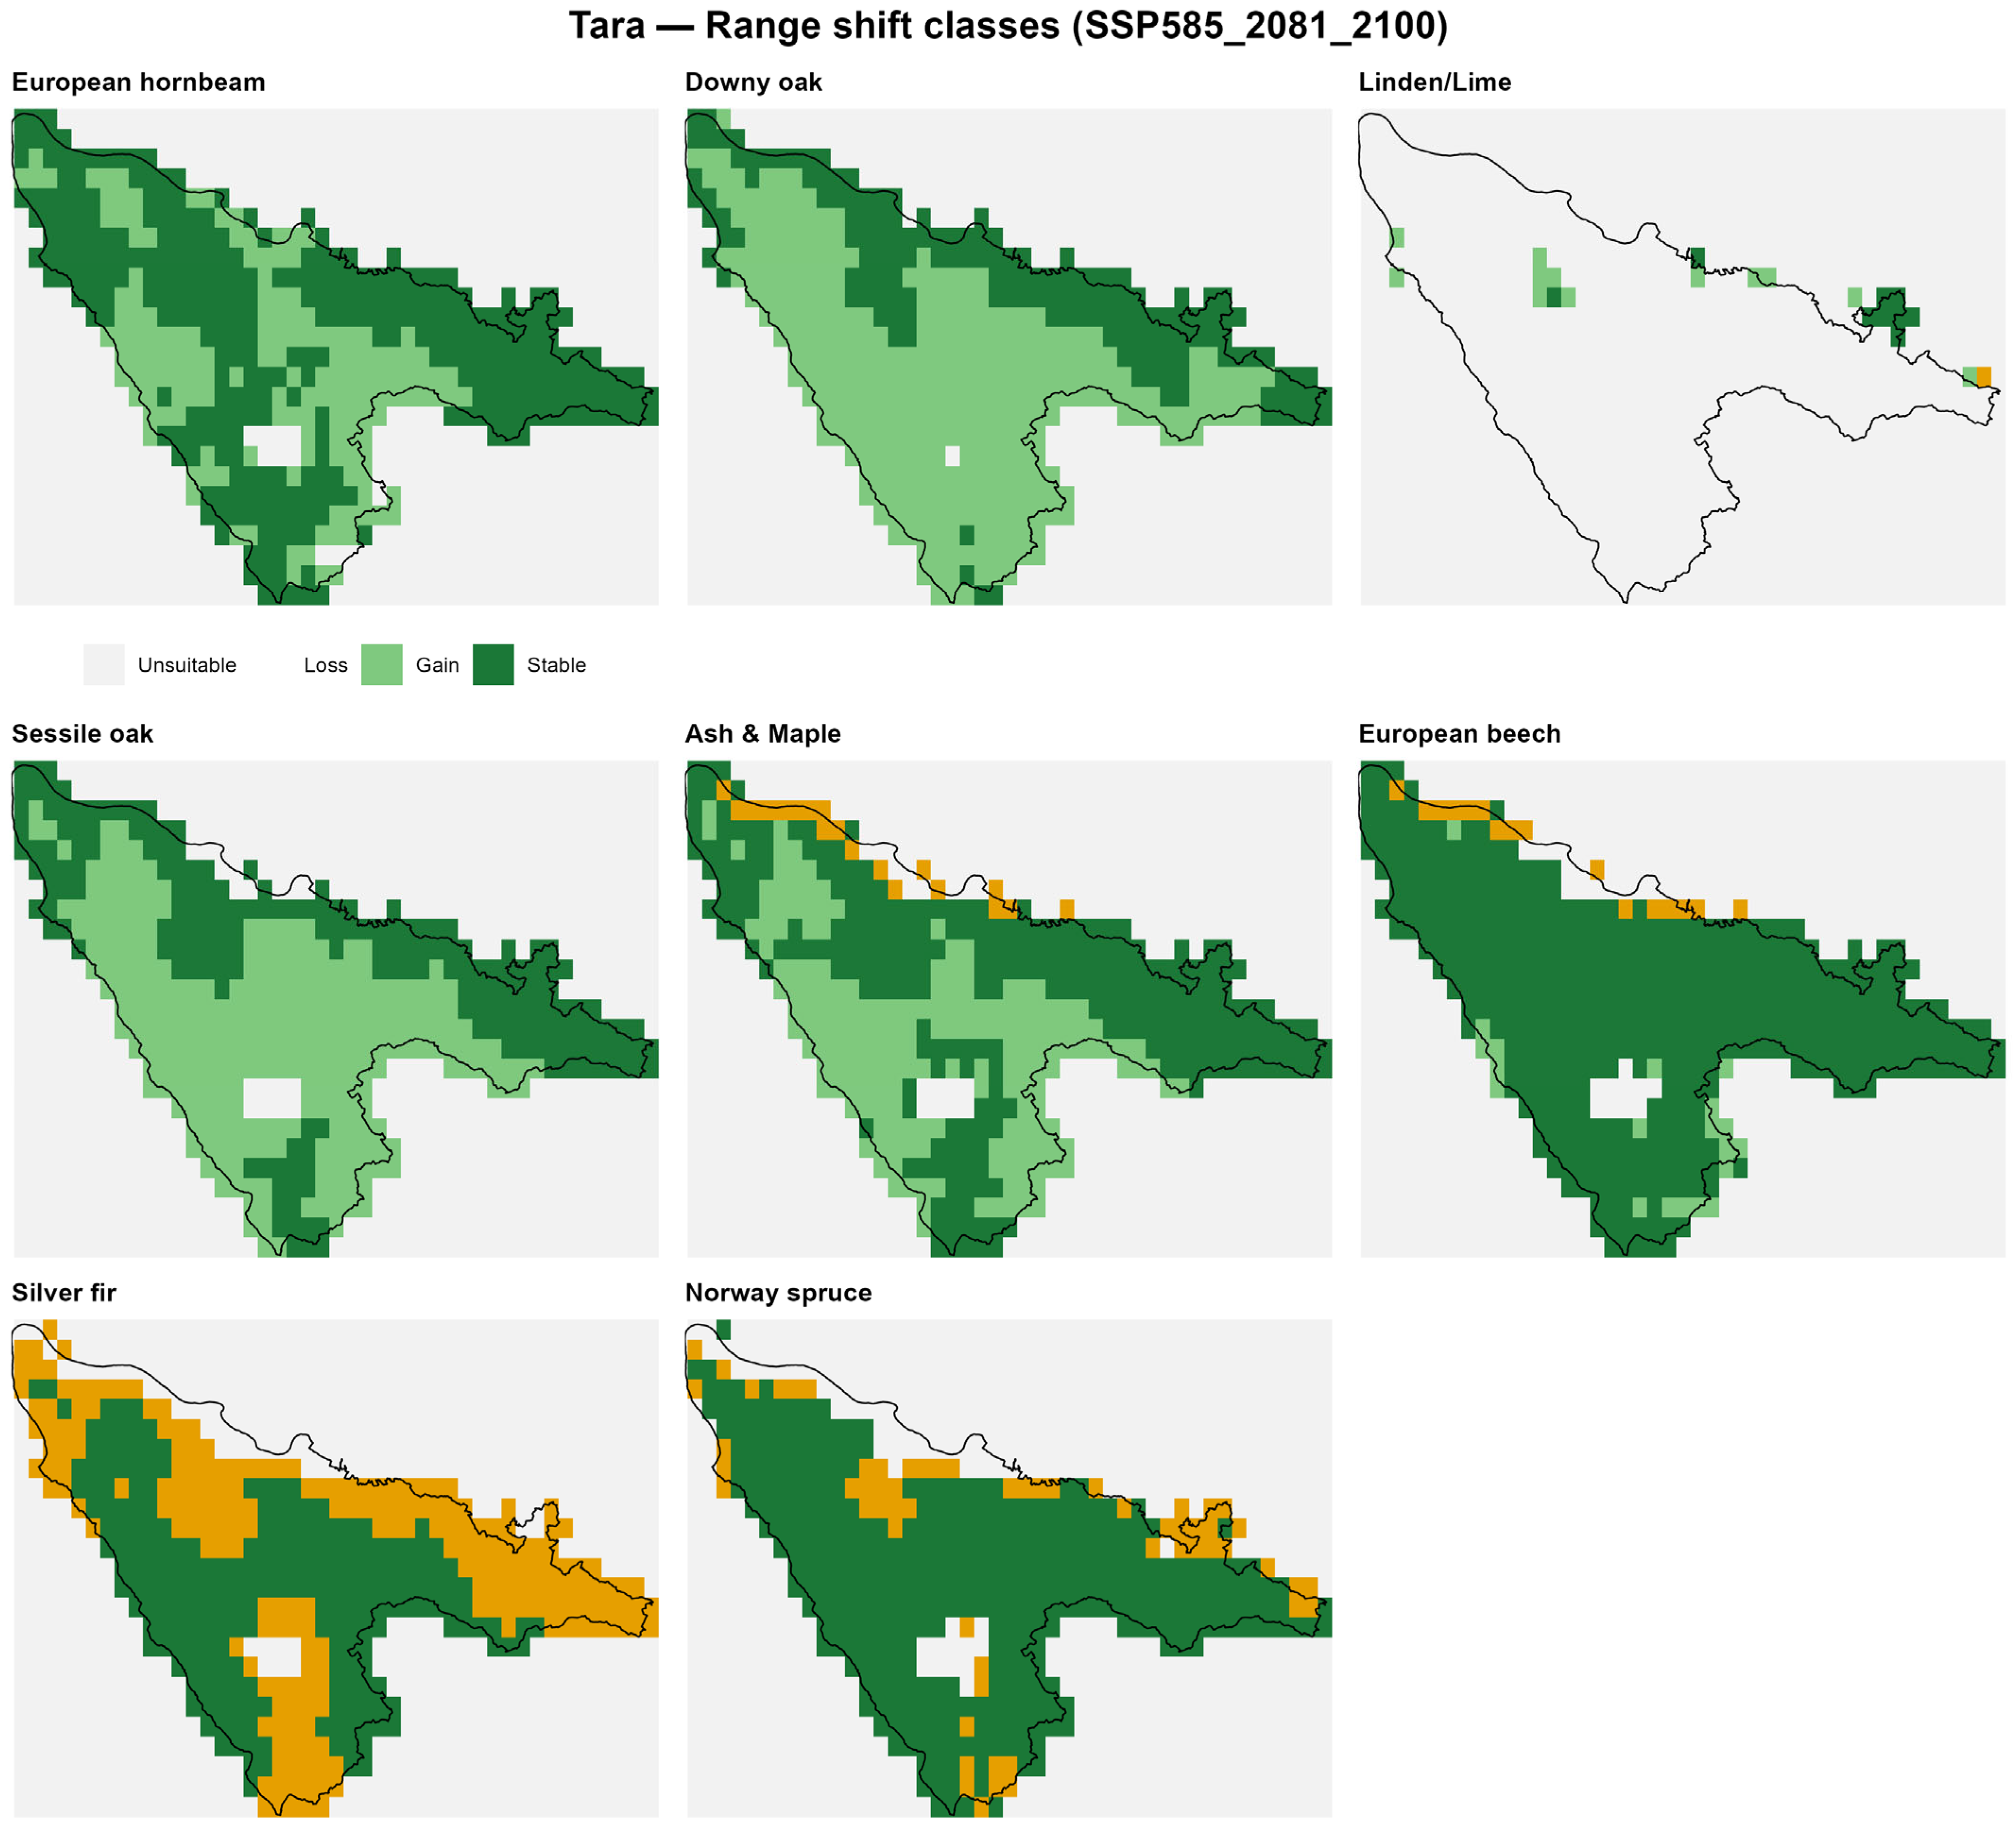
Figure A5.
Projected habitat changes for eight forest species in Golija Nature Park under the high-emission scenario (SSP5-8.5, 2081–2100). Stable habitat (dark green)-areas remaining suitable; loss (orange)-currently suitable areas projected to become unsuitable; gain (light green)-currently unsuitable areas projected to become suitable; and unsuitable (gray)-areas unsuitable in both current and future conditions. Silver fir shows the greatest habitat losses, and Ash and Maple stability, while thermophilous species Downy oak significant gains.
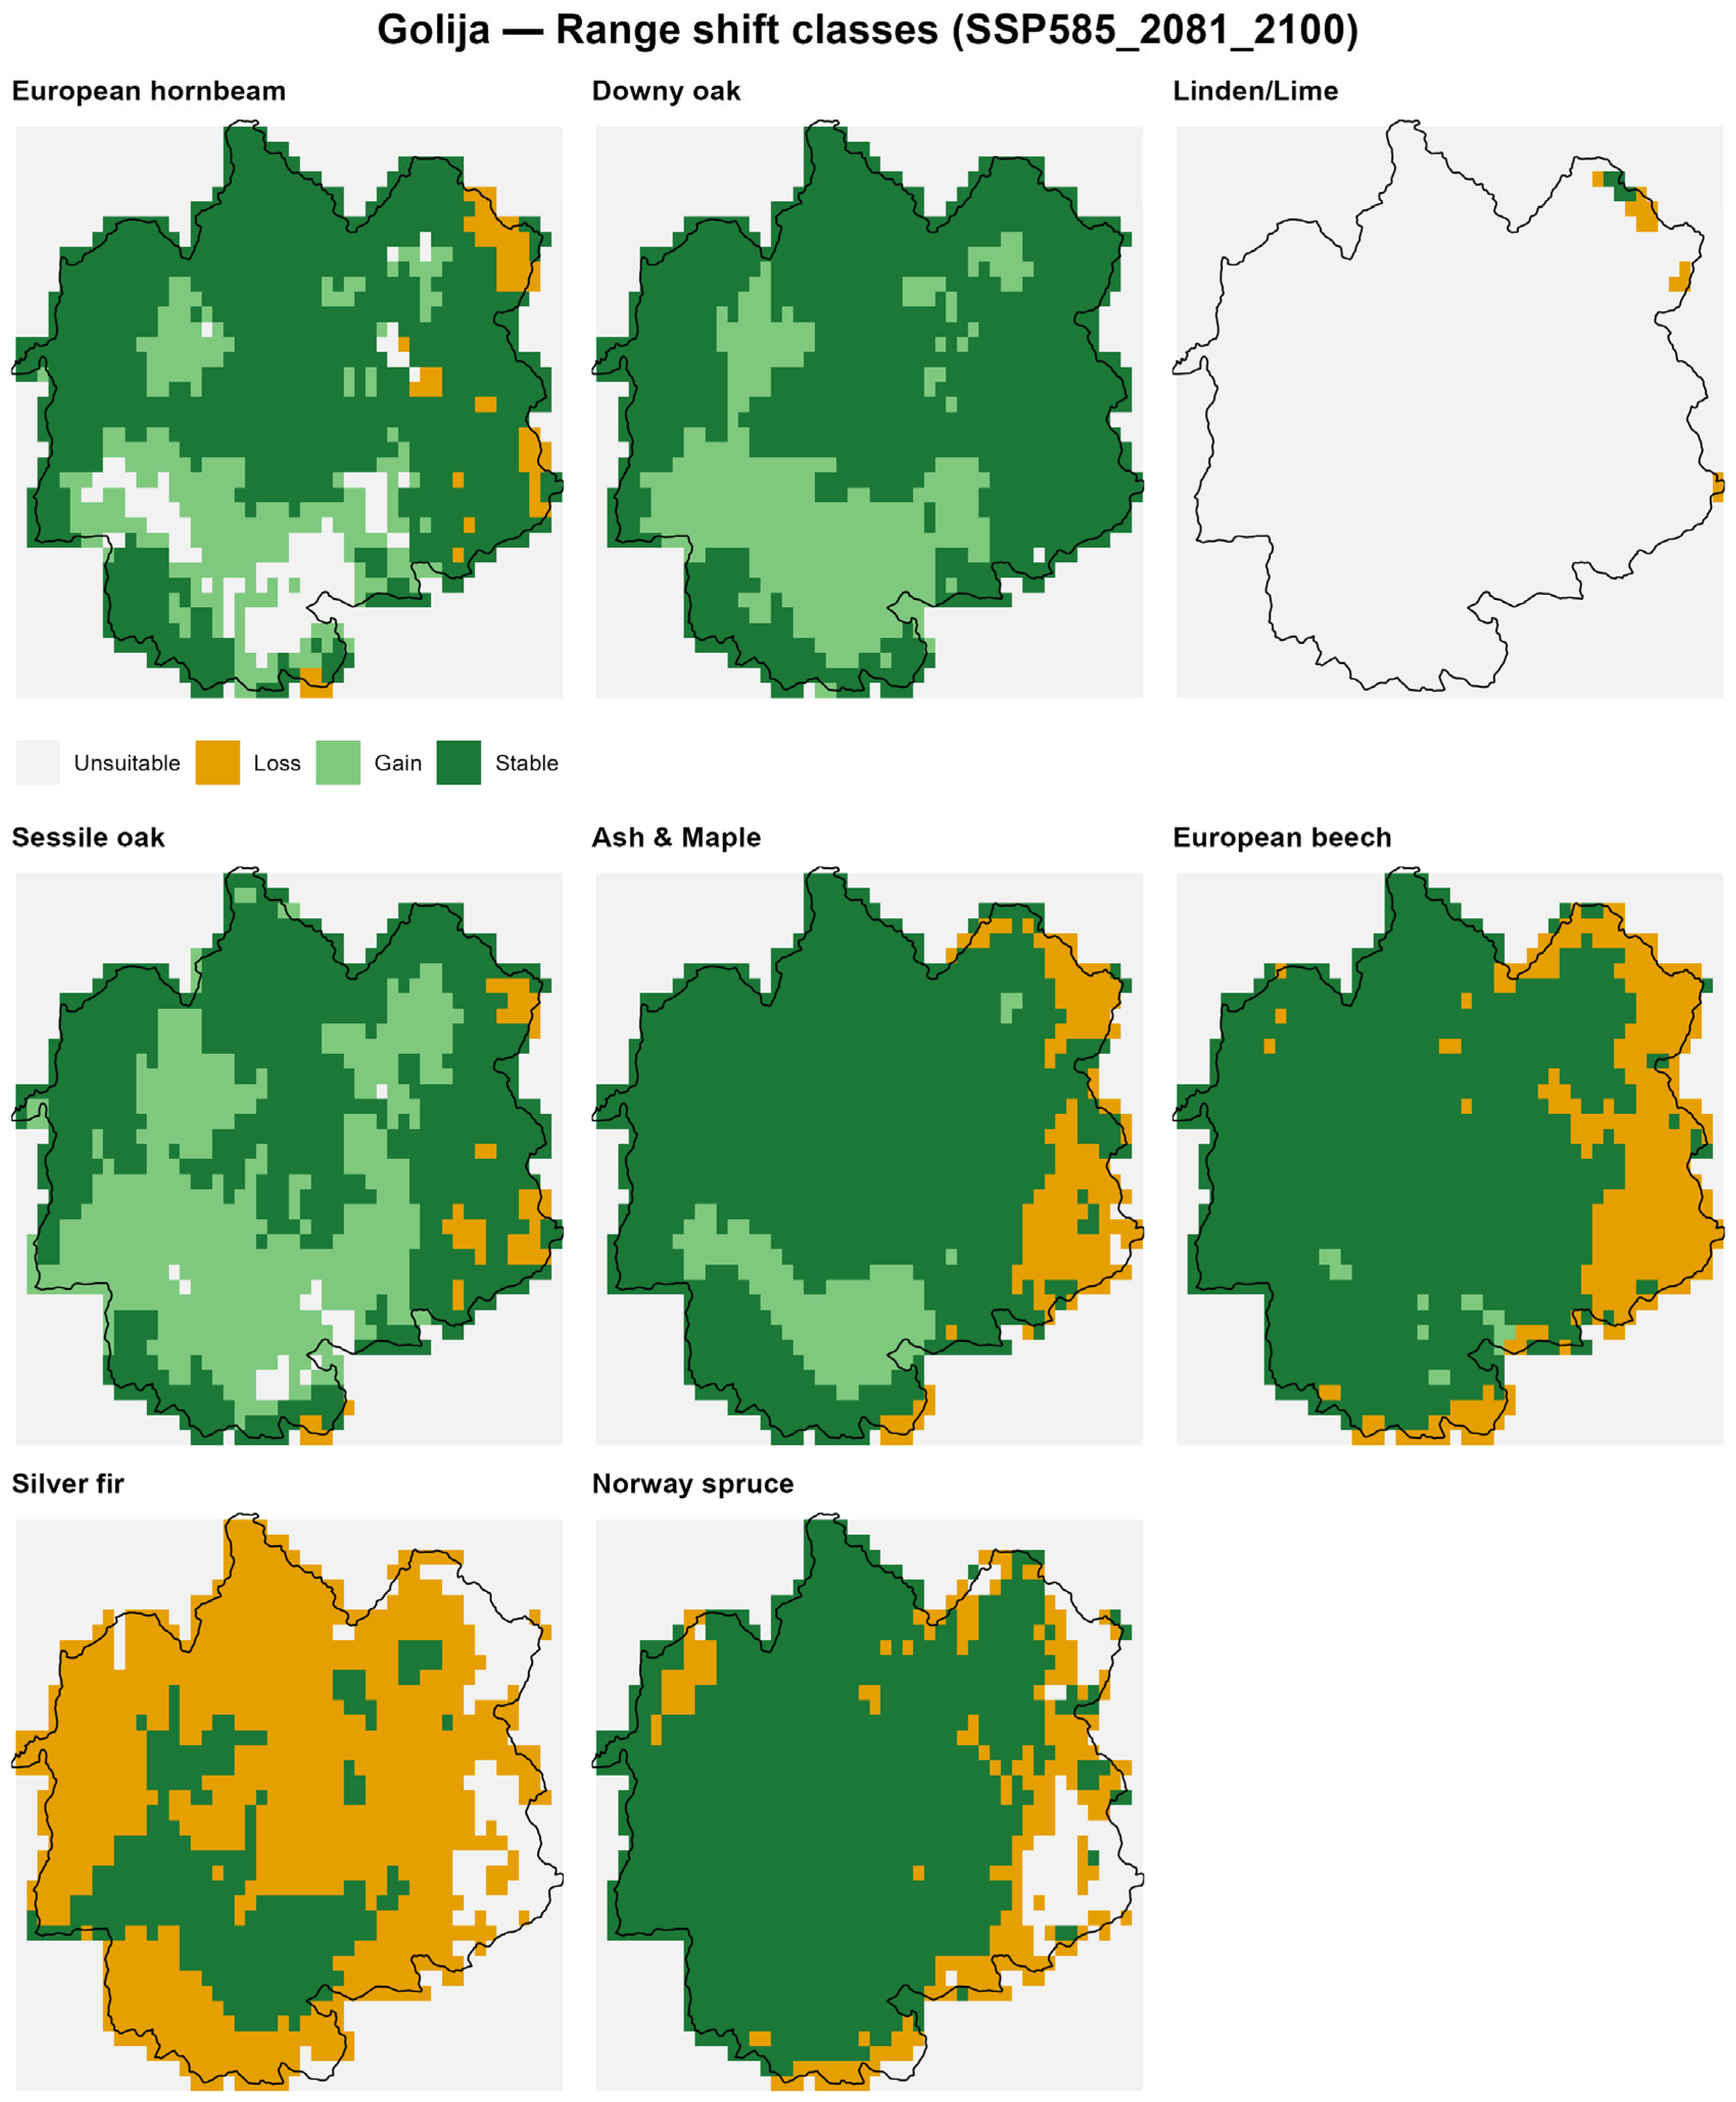
Figure A6.
Projected habitat changes for eight forest species in Djerdap National Park under the high-emission scenario (SSP5-8.5, 2081–2100). Stable habitat (dark green)-areas remaining suitable; loss (orange)-currently suitable areas projected to become unsuitable; gain (light green)-currently unsuitable areas projected to become suitable; and unsuitable (gray)-areas unsuitable in both current and future conditions. European beech and Norway spruce show the greatest habitat losses, while thermophilous species Downy oak the most stability, even gains.
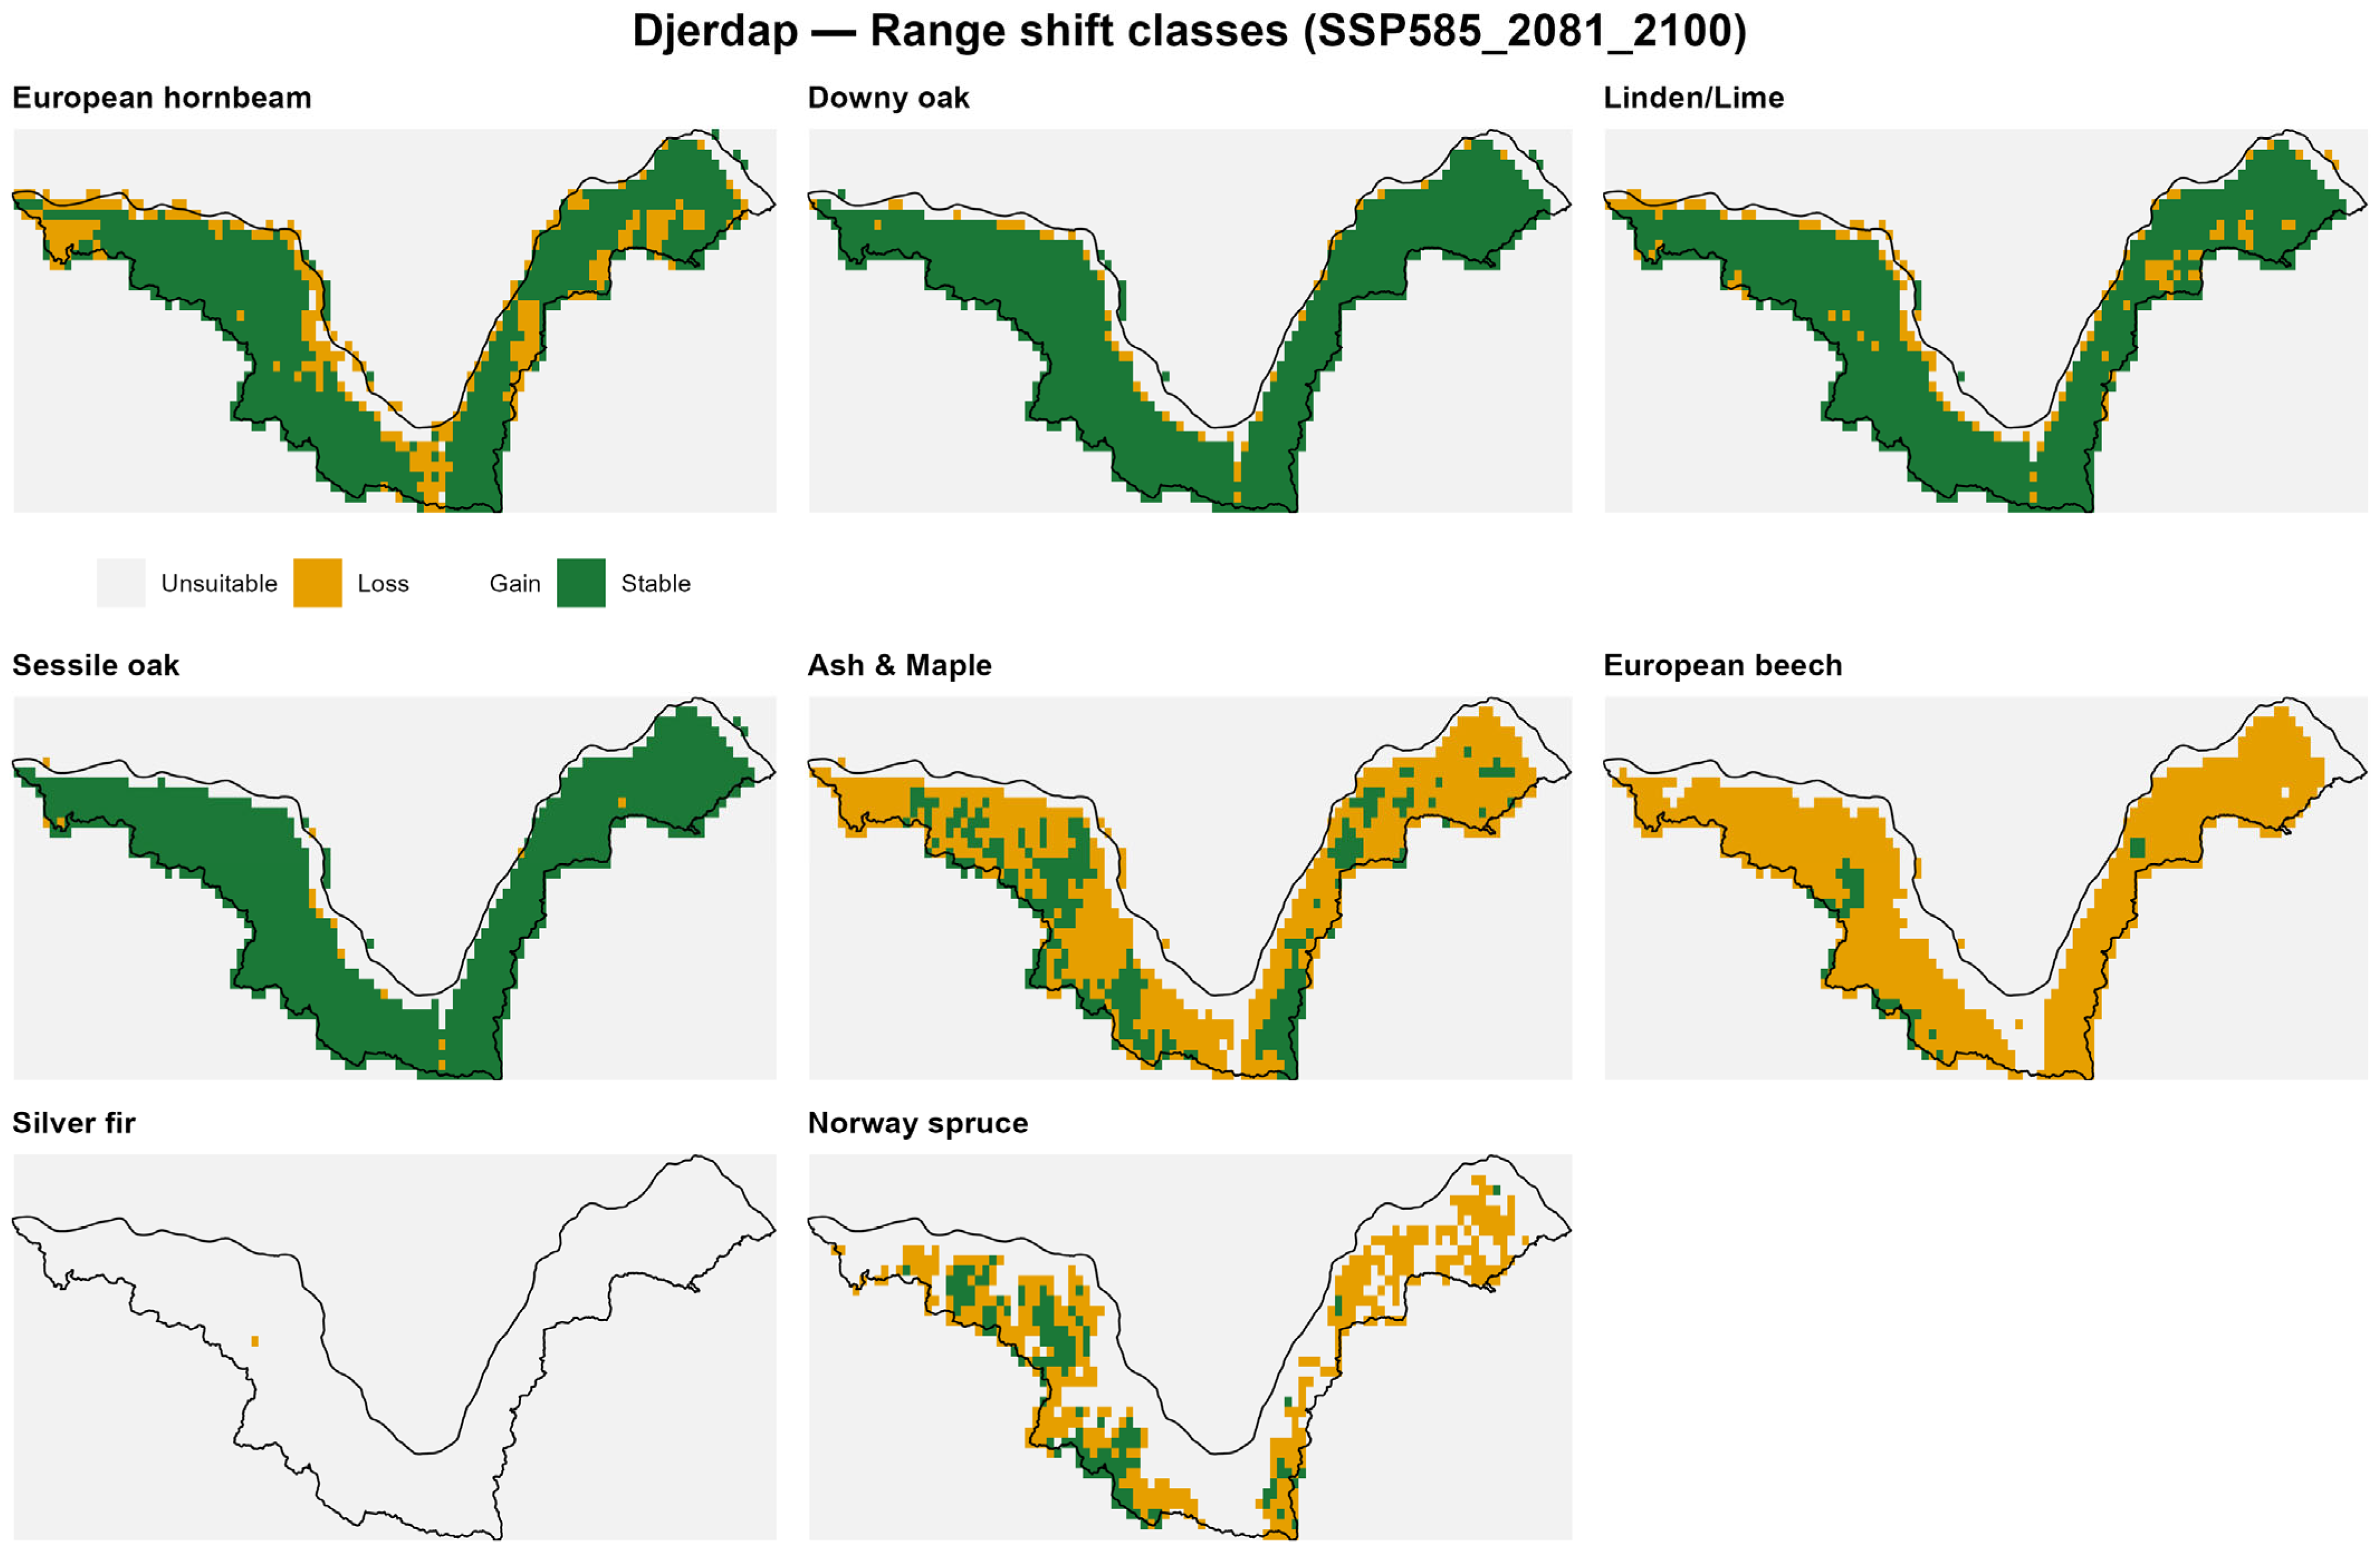
Figure A7.
Projected habitat changes for eight forest species in Fruska gora National Park under the high-emission scenario (SSP5-8.5, 2081–2100). Stable habitat (dark green)-areas remaining suitable; loss (orange)-currently suitable areas projected to become unsuitable; gain (light green)-currently unsuitable areas projected to become suitable; and unsuitable (gray)-areas unsuitable in both current and future conditions. European beech and Norway spruce show the greatest habitat losses, while thermophilous species Downy oak the most stability.
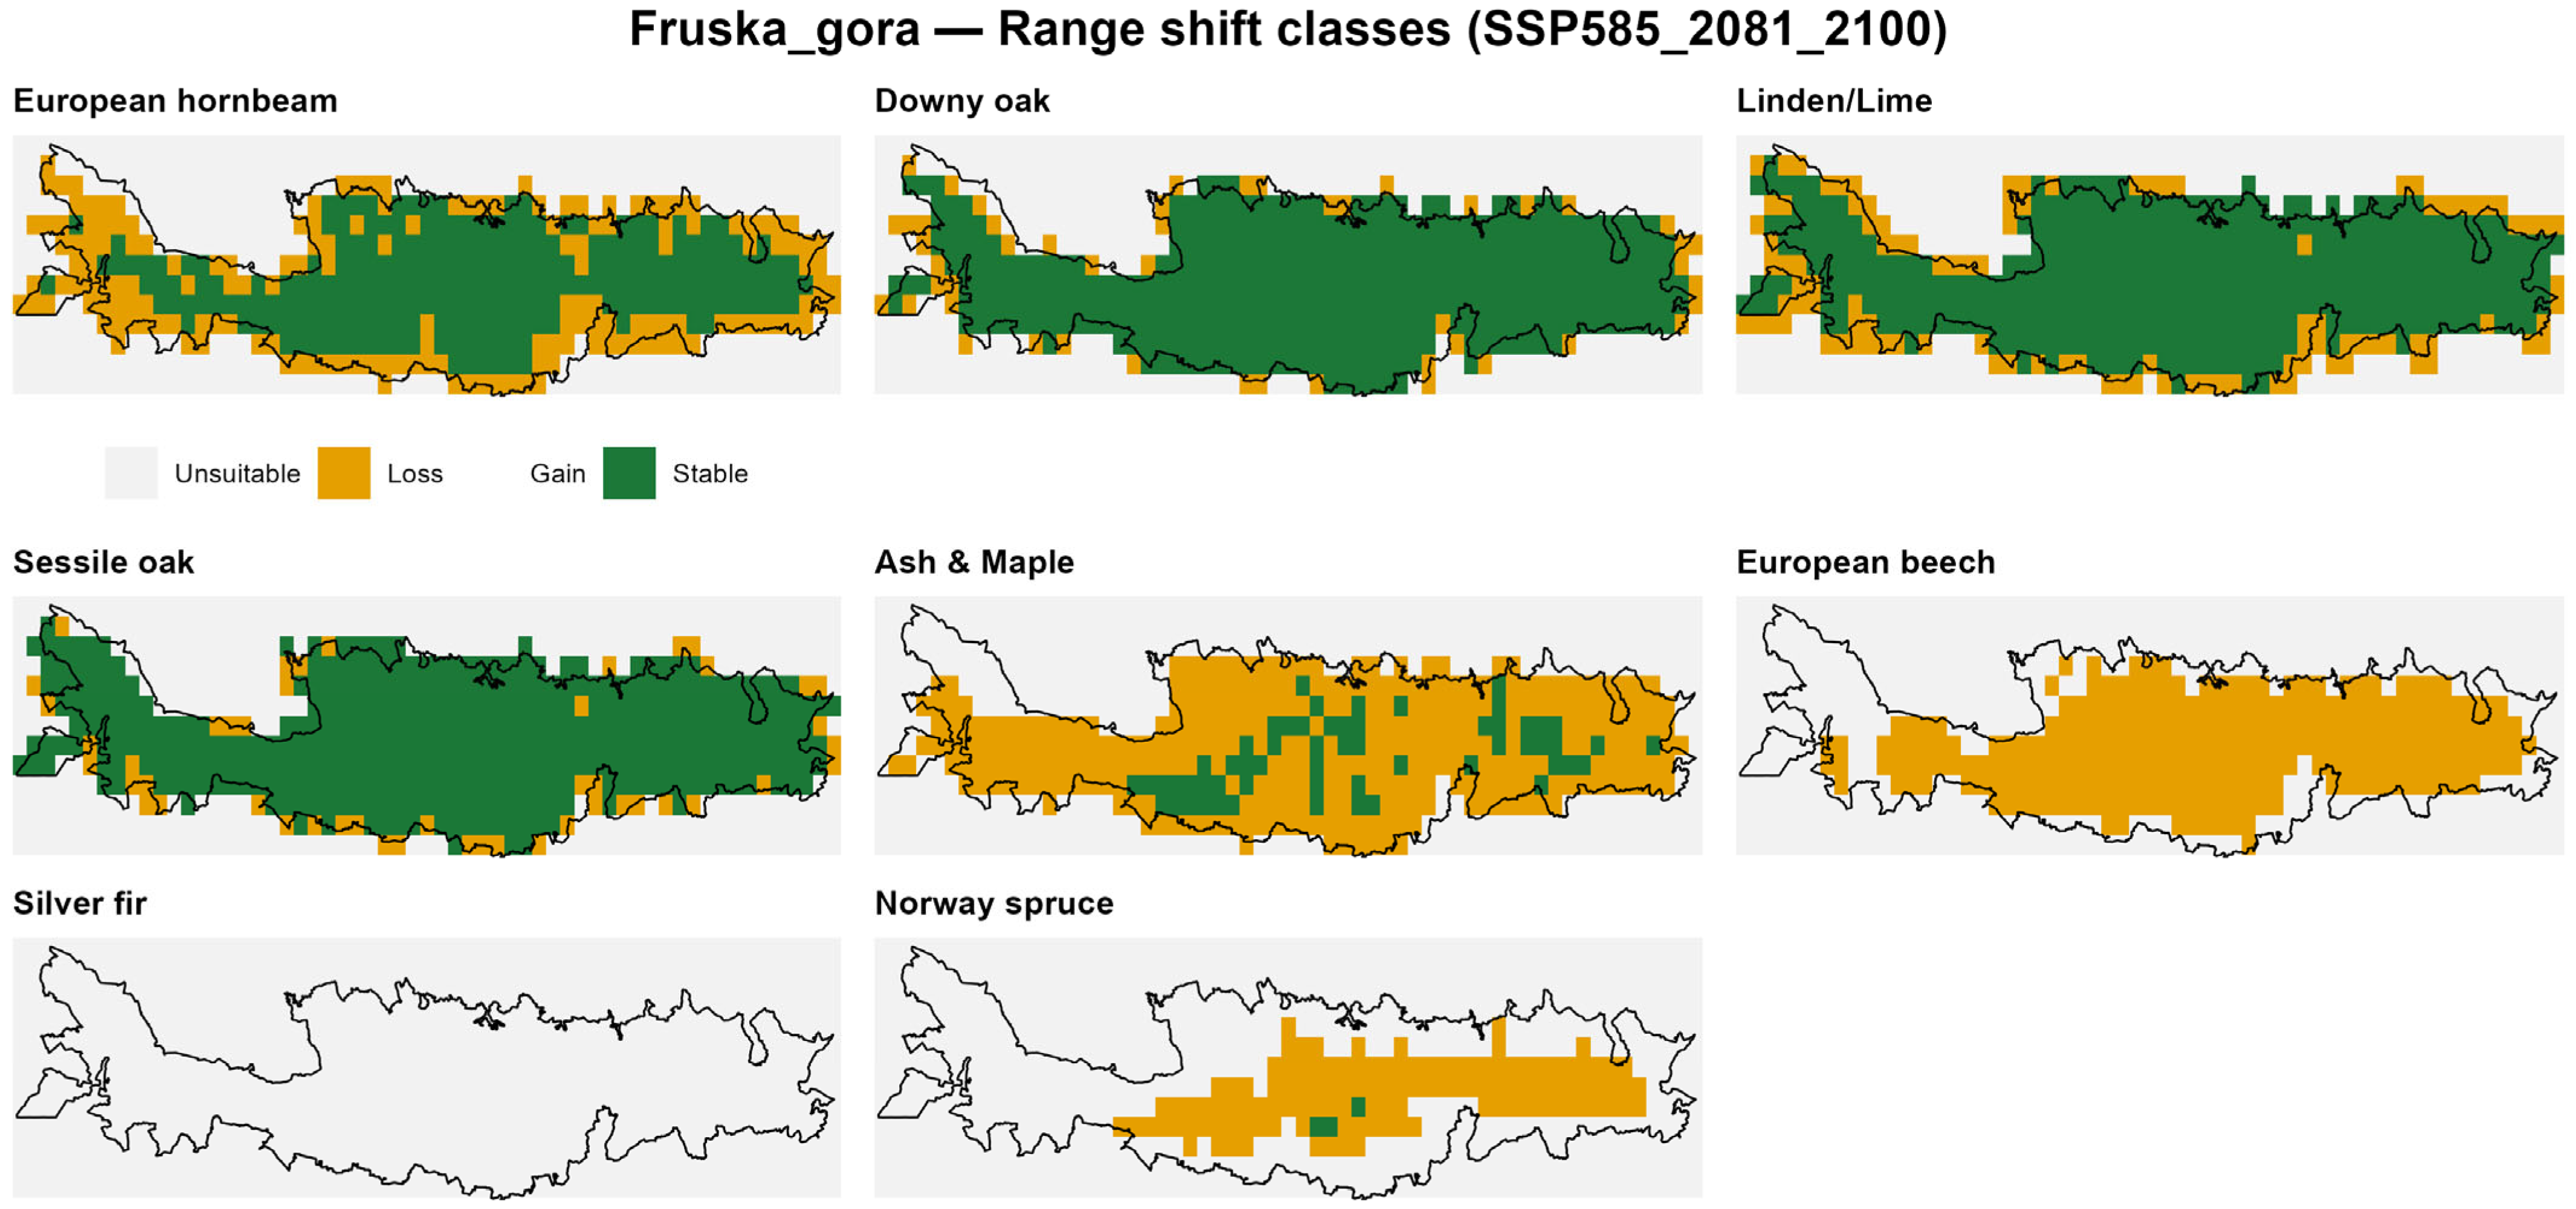
Figure A8.
Projected habitat changes for eight forest species in Stara planina National Park under designation under the high-emission scenario (SSP5-8.5, 2081–2100). Stable habitat (dark green)-areas remaining suitable; loss (orange)-currently suitable areas projected to become unsuitable; gain (light green)-currently unsuitable areas projected to become suitable; and unsuitable (gray)-areas unsuitable in both current and future conditions. General forest habitat losses were found, while thermophilous species Downy oak, and Ash and Maple expressed the most stability, even gains, in the case of oak.
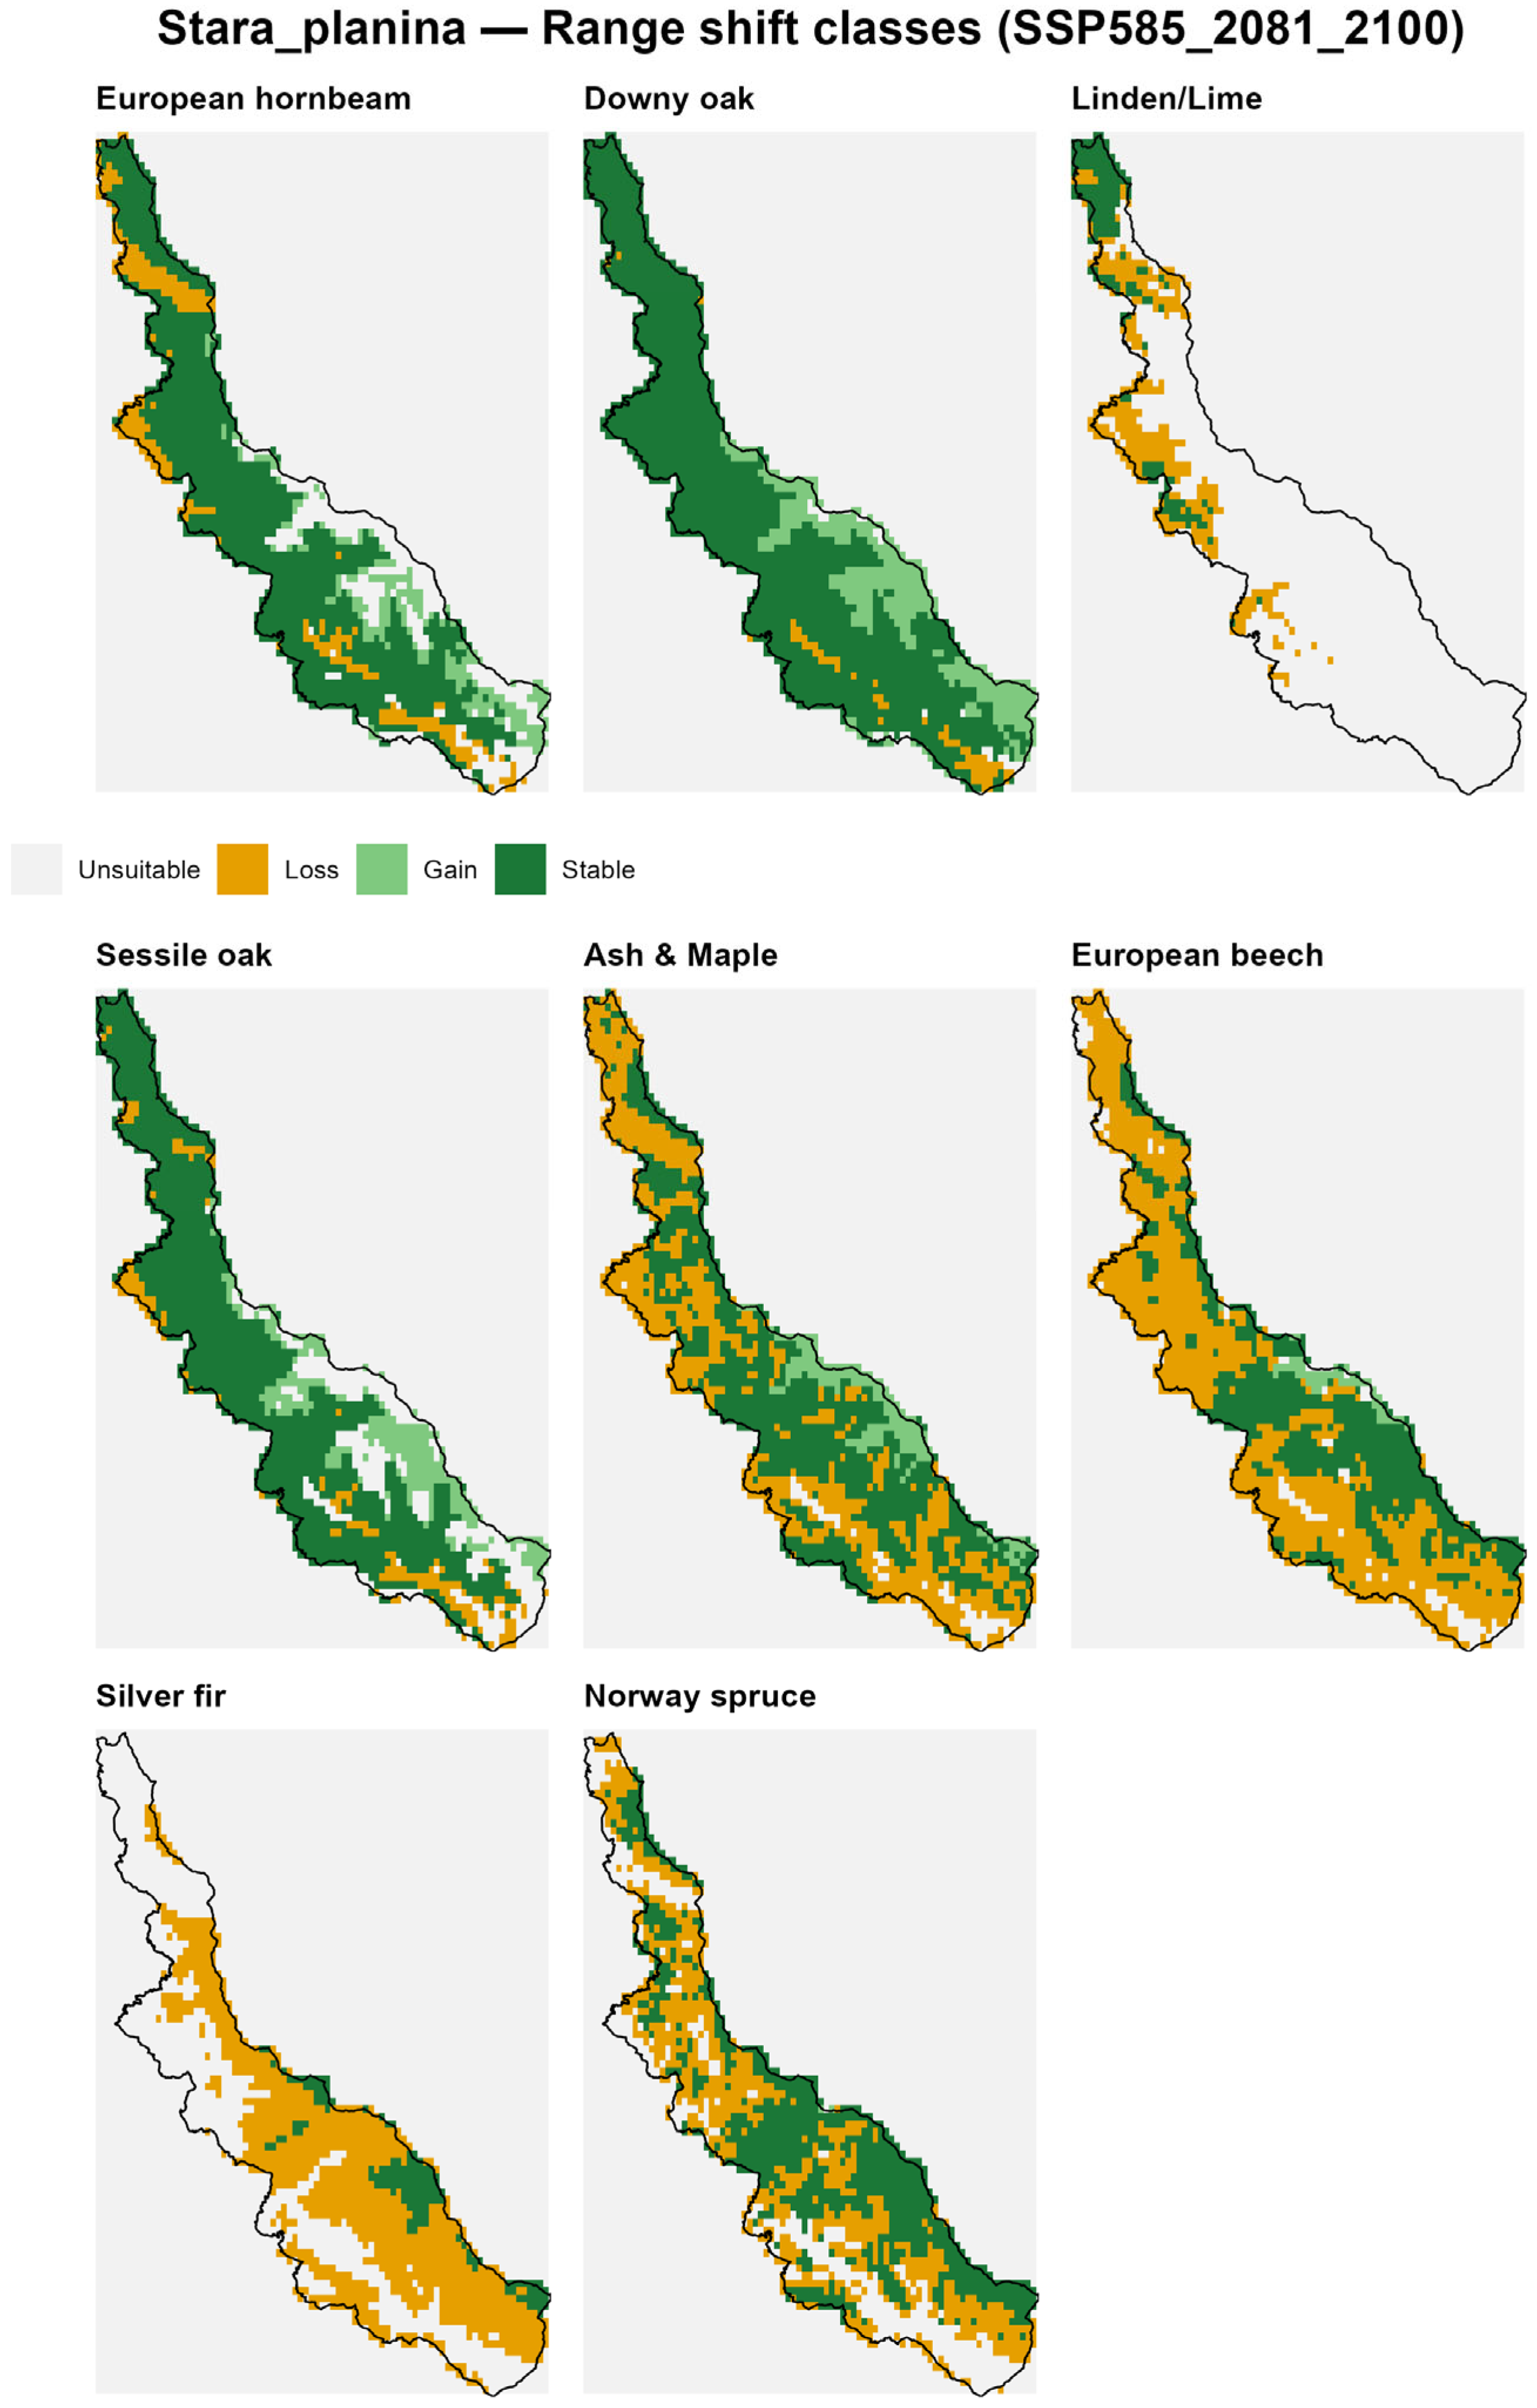
Figure A9.
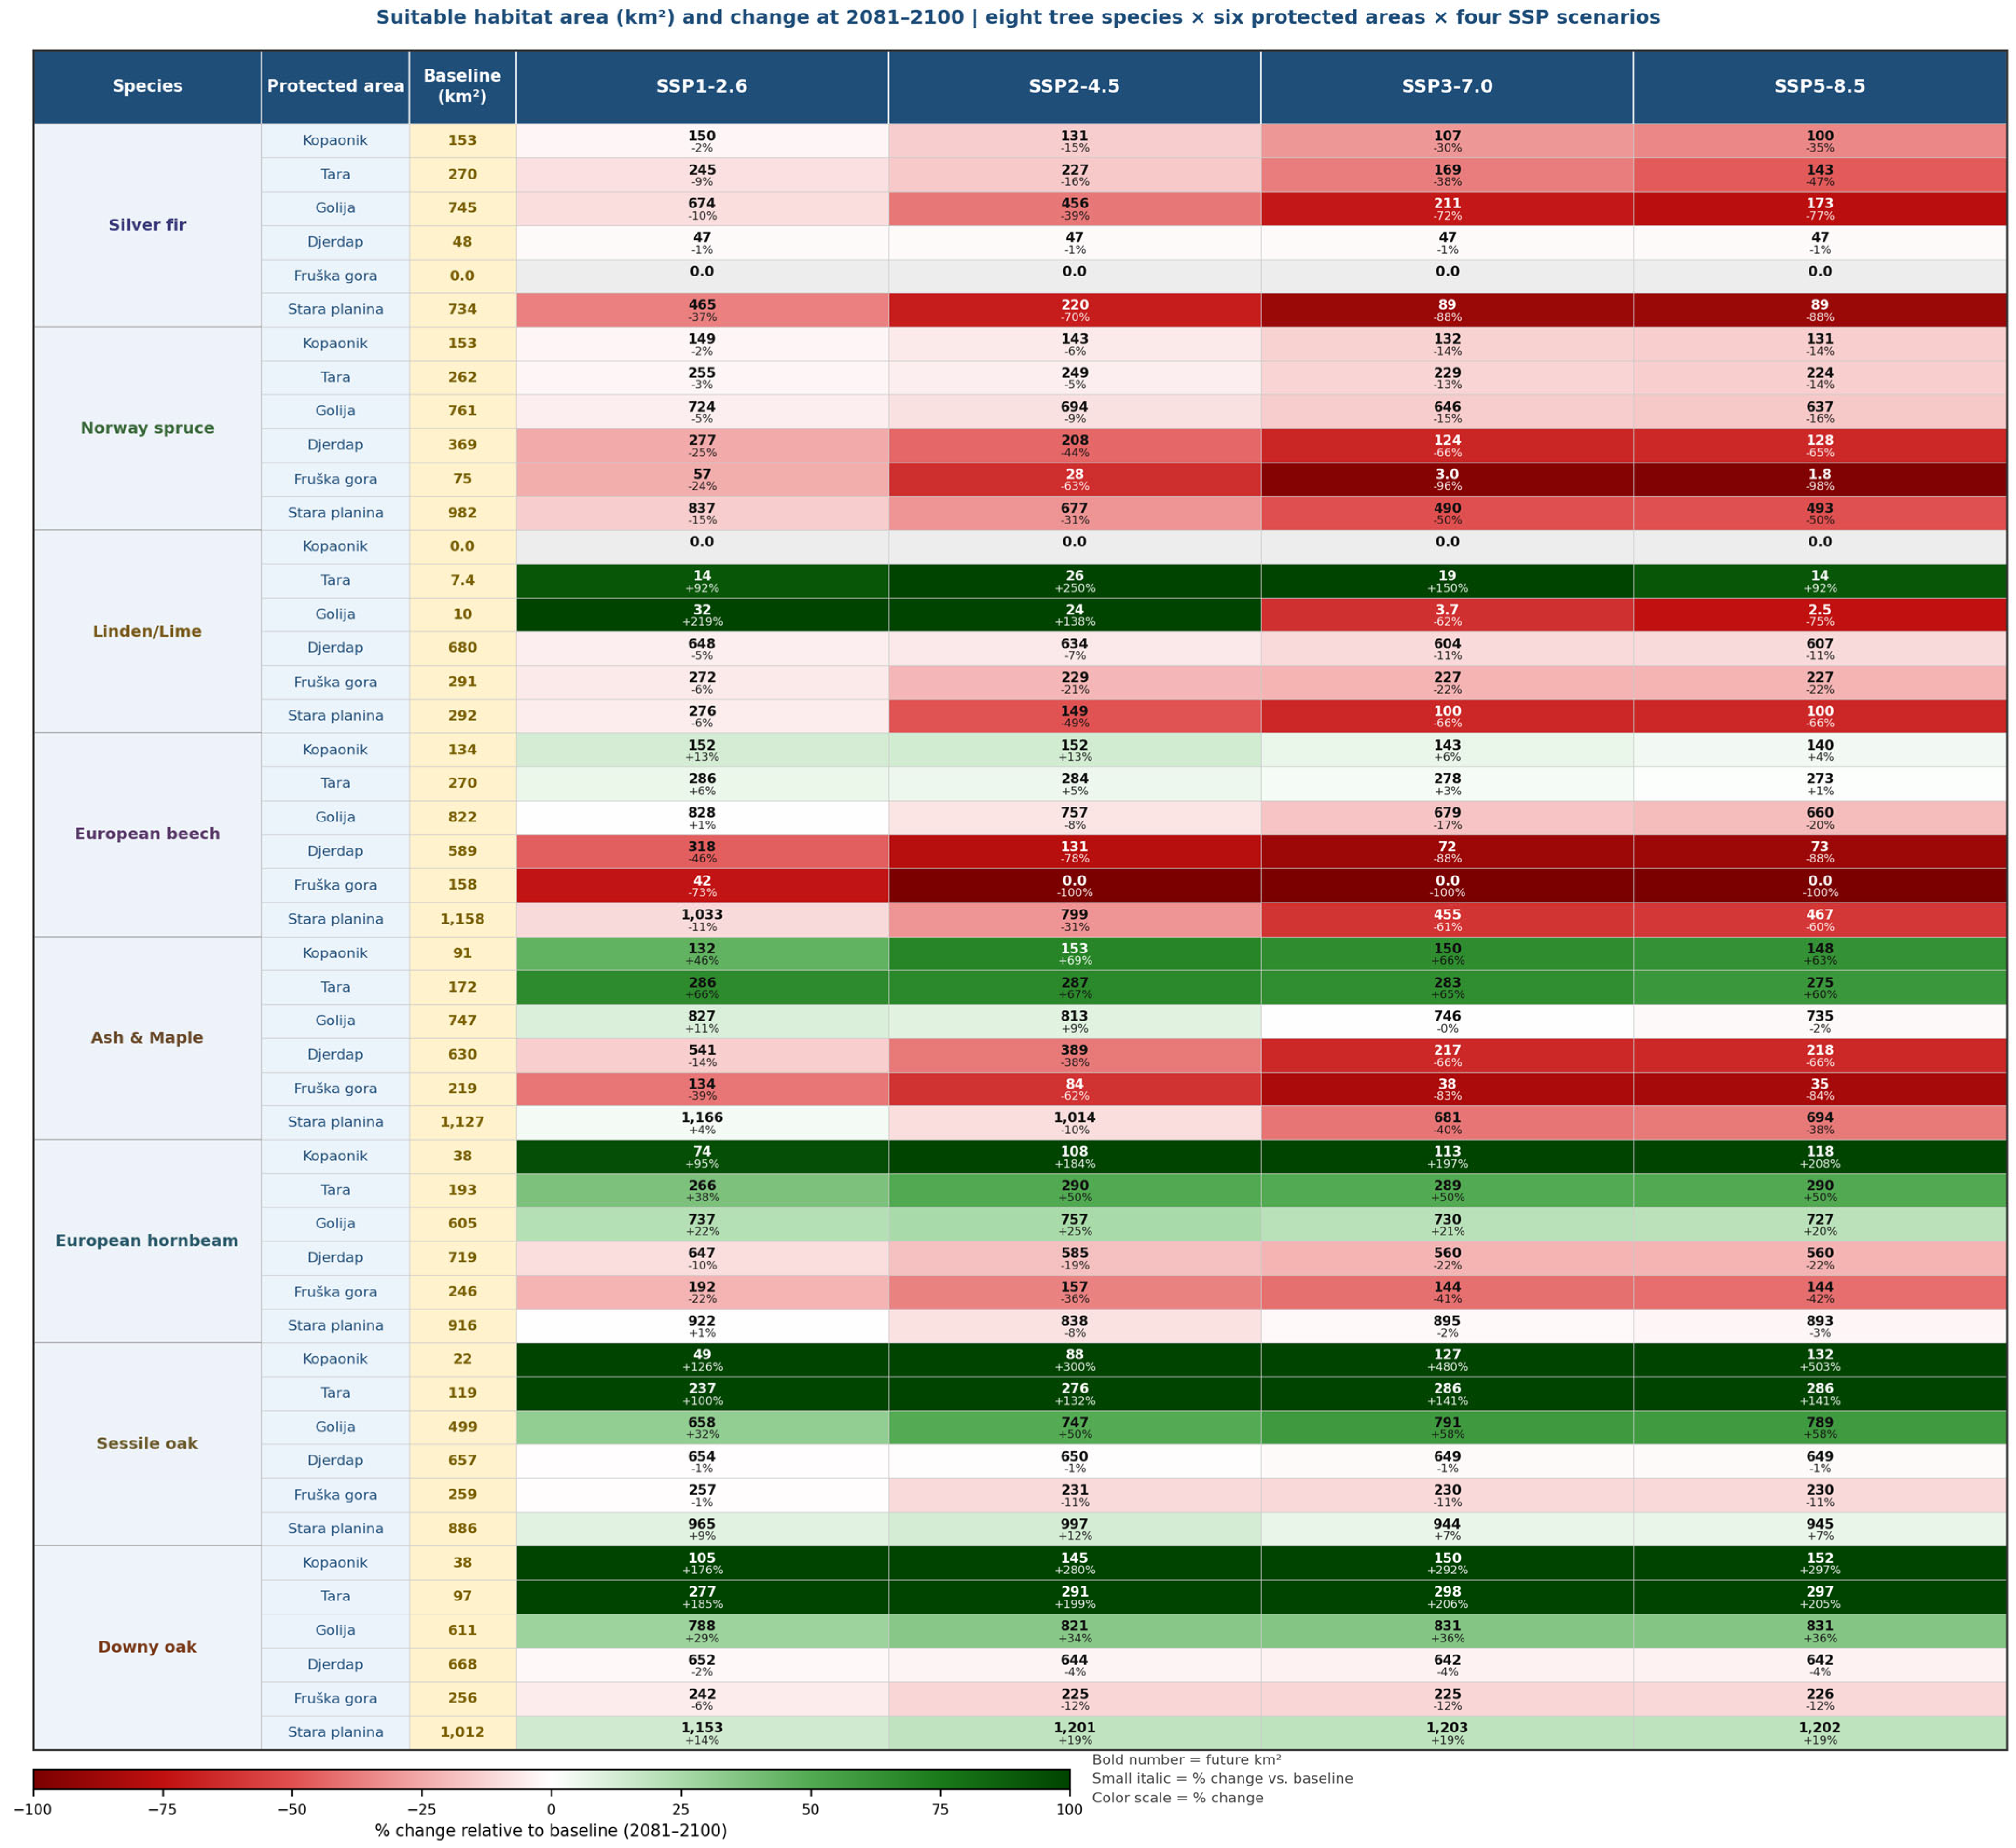
Suitable habitat area (km2) projected for 2081–2100 for eight forest tree species across six Serbian protected areas under four Shared Socioeconomic Pathway scenarios (SSP1-2.6, SSP2-4.5, SSP3-7.0, and SSP5-8.5).
References
- Republic Hydro-Meteorological Service of Serbia. Available online: https://www.hidmet.gov.rs/ (accessed on 1 February 2026).
- Seidl, R.; Schelhaas, M.J.; Rammer, W.; Verkerk, P.J. Increasing forest disturbances in Europe and their impact on carbon storage. Nat. Clim. Change 2014, 4, 806–810. [Google Scholar] [CrossRef] [Scilit] [PubMed]
- IPCC. Climate Change 2022: Impacts, Adaptation and Vulnerability; Contribution of Working Group II to the Sixth Assessment Report of the Intergovernmental Panel on Climate Change; Cambridge University Press: Cambridge, UK, 2022. [Google Scholar] [CrossRef] [Scilit]
- Giorgi, F. Climate change hot-spots. Geophys. Res. Lett. 2006, 33, L08707. [Google Scholar] [CrossRef] [Scilit]
- Cos, J.; Doblas-Reyes, F.; Jury, M.; Marcos, R.; Bretonnière, P.A.; Samsó, M. The Mediterranean climate change hotspot in the CMIP5 and CMIP6 projections. Earth Syst. Dyn. 2022, 13, 321–340. [Google Scholar] [CrossRef] [Scilit]
- Stojanović, D.B.; Kržič, A.; Matović, B.; Orlović, S.; Duputie, A.; Djurdjević, V.; Galić, Z.; Stojnić, S. Prediction of the European beech (Fagus sylvatica L.) xeric limit using a regional climate model: An example from southeast Europe. Agric. For. Meteorol. 2013, 176, 94–103. [Google Scholar] [CrossRef] [Scilit]
- Dorado-Liñán, I.; Piovesan, G.; Martínez-Sancho, E.; Gea-Izquierdo, G.; Zang, C.; Cañellas, I.; Castagneri, D.; Di Filippo, A.; Gutiérrez, E.; Ewald, J.; et al. Geographical adaptation prevails over species-specific determinism in trees’ vulnerability to climate change at Mediterranean rear-edge forests. Glob. Change Biol. 2019, 25, 1296–1314. [Google Scholar] [CrossRef] [Scilit]
- Miletić, B.; Orlović, S.; Lalić, B.; Đurđević, V.; Mandić, M.V.; Vuković, A.; Gutalj, M.; Stjepanović, S.; Matović, B.; Stojanović, D.B. The potential impact of climate change on the distribution of key tree species in Serbia under RCP4. 5 and RCP 8.5 scenarios. Austrian J. For. Sci./Cent. Gesamte Forstwes. 2021, 138, 183–208. [Google Scholar]
- Tošić, I.; Unkašević, M.; Putniković, S. Observed changes in precipitation extremes in Serbia under recent climate variability. Atmosphere 2025, 16, 436. [Google Scholar]
- Stojanović, D.B.; Orlović, S.; Zlatković, M.; Kostić, S.; Vasić, V.; Miletić, B.; Kesić, L.; Matović, B.; Božanić, D.; Pavlović, L.; et al. Climate change within Serbian forests: Current state and future perspectives. Topola 2021, 208, 39–56. [Google Scholar] [CrossRef] [Scilit]
- Cimatti, M.; Mezzanotte, V.; Heikkinen, R.K.; Hällfors, M.H.; Karger, D.N.; Di Marco, M. The accelerating exposure of European protected areas to climate change. Glob. Change Biol. 2025, 31, e70261. [Google Scholar] [CrossRef] [Scilit] [PubMed]
- Government of Serbia. Law on Nature Protection. In Official Gazette of the Republic of Serbia; Nos. 36/2009, 88/2010, 91/2010, 14/2016, 95/2018, and 71/2021; Government of Serbia: Belgrade, Serbia, 2021. [Google Scholar]
- Government of Serbia. Law on National Parks. In Official Gazette of the Republic of Serbia; Nos. 84/2015 and 95/2018; Government of Serbia: Belgrade, Serbia, 2015. [Google Scholar]
- UNESCO. Golija–Studenica Biosphere Reserve. 2024. Available online: https://www.unesco.org/en/mab/golija-studenica (accessed on 1 February 2026).
- Kermavnar, J.; Kutnar, L.; Marinšek, A. More losses than gains? Distribution models predict species-specific shifts in climatic suitability for European beech forest herbs under climate change. Front. For. Glob. Change 2023, 6, 1236842. [Google Scholar] [CrossRef] [Scilit]
- Araújo, M.B.; New, M. Ensemble forecasting of species distributions. Trends Ecol. Evol. 2007, 22, 42–47. [Google Scholar] [CrossRef] [Scilit] [PubMed]
- Leroy, B.; Delsol, R.; Hugueny, B.; Meynard, C.N.; Barhoumi, C.; Barbet-Massin, M.; Bellard, C. Without quality presence–absence data, discrimination metrics such as TSS can be misleading measures of model performance. J. Biogeogr. 2018, 45, 1994–2002. [Google Scholar] [CrossRef] [Scilit]
- Banković, S.; Medarević, M.; Pantić, D.; Petrović, N. The National Forest Inventory of the Republic of Serbia-The Growing Stock of the Republic of Serbia; Forestry and Water Management of the Republic of Serbia—Forest Directorate, Ministry of Agriculture: Belgrade, Serbia, 2009.
- Leuschner, C.; Ellenberg, H. Ecology of Central European Forests: Vegetation Ecology of Central Europe; Springer: Cham, Switzerland, 2017; Volume I. [Google Scholar]
- Eaton, E.; Caudullo, G.; Oliveira, S.; de Rigo, D. Quercus robur and Quercus petraea in Europe: Distribution, habitat, usage and threats. In European Atlas of Forest Tree Species; San-Miguel-Ayanz, J., de Rigo, D., Caudullo, G., Houston Durrant, T., Mauri, A., Eds.; Publications Office of the EU: Luxembourg, 2016. [Google Scholar]
- Ellenberg, H.; Leuschner, C. Vegetation Mitteleuropas mit den Alpen, 6th ed.; Ulmer: Stuttgart, Germany, 2010. [Google Scholar]
- Seidl, R.; Thom, D.; Kautz, M.; Martin-Benito, D.; Peltoniemi, M.; Vacchiano, G.; Wild, J.; Ascoli, D.; Petr, M.; Honkaniemi, J.; et al. Forest disturbances under climate change. Nat. Clim. Change 2017, 7, 395–402. [Google Scholar] [CrossRef] [Scilit] [PubMed]
- Radoglou, K.; Dobrowolska, D.; Spyroglou, G.; Nicolescu, V.N. A review on the ecology and silviculture of limes (Tilia cordata Mill., Tilia platyphyllos Scop. and Tilia tomentosa Moench.) in Europe. Bodenkultur 2009, 60, 9–19. [Google Scholar]
- Elling, W.; Dittmar, C.; Pfaffelmoser, K.; Rotzer, T. Dendroecological assessment of the complex causes of decline and recovery of the growth of Silver fir (Abies alba Mill.) in Southern Germany. For. Ecol. Manag. 2009, 257, 1175–1187. [Google Scholar] [CrossRef] [Scilit]
- Dobrowolska, D.; Hein, S.; Oosterbaan, A.; Wagner, S.; Clark, J.; Skovsgaard, J.P. A review of European ash (Fraxinus excelsior L.): Implications for silviculture. Forestry 2011, 84, 133–148. [Google Scholar] [CrossRef] [Scilit]
- Hein, S.; Collet, C.; Ammer, C.; Le Goff, N.; Skovsgaard, J.P.; Savill, P. A review of growth and stand dynamics of Acer pseudoplatanus L. in Europe: Implications for silviculture. Forestry 2009, 82, 361–385. [Google Scholar] [CrossRef] [Scilit]
- Carni, A.; Kosir, P.; Karadzic, B.; Krstivojevic, M.; Marinsek, A.; Pausic, A.; Szabo, A. Thermophilous deciduous forests in the southern Central Europe. Plant Biosyst. 2009, 143, 1–13. [Google Scholar] [CrossRef] [Scilit]
- Peduzzi, P.; Concato, J.; Kemper, E.; Holford, T.R.; Feinstein, A.R. A simulation study of the number of events per variable in logistic regression analysis. J. Clin. Epidemiol. 1996, 49, 1373–1379. [Google Scholar] [CrossRef] [Scilit]
- Arias, P.; Bellouin, N.; Coppola, E.; Jones, R.; Krinner, G.; Marotzke, J.; Naik, V.; Palmer, M.; Plattner, G.K.; Rogelj, J.; et al. Climate Change 2021: The Physical Science Basis. In Contribution of Working Group I to the Sixth Assessment Report of the Intergovernmental Panel on Climate Change; Technical Summary; Cambridge University Press: Cambridge, UK, 2021. [Google Scholar]
- Ellenberg, H. Vegetation Ecology of Central Europe; Cambridge University Press: Cambridge, UK, 1998. [Google Scholar]
- Breiman, L. Random forests. Mach. Learn. 2021, 45, 5–32. [Google Scholar] [CrossRef] [Scilit]
- Chen, T.; Guestrin, C. XGBoost: A scalable tree boosting system. In Proceedings of the 22nd ACM SIGKDD International Conference on Knowledge Discovery and Data Mining, San Francisco, CA, USA, 13–17 August 2016; pp. 785–794. [Google Scholar] [CrossRef] [Scilit]
- Tibshirani, R. Regression shrinkage and selection via the lasso. J. R. Stat. Soc. Ser. B (Methodol.) 1996, 58, 267–288. [Google Scholar] [CrossRef] [Scilit]
- Hoerl, A.E.; Kennard, R.W. Ridge regression: Biased estimation for nonorthogonal problems. Technometrics 1970, 12, 55–67. [Google Scholar] [CrossRef]
- Friedman, J.; Hastie, T.; Tibshirani, R. The Elements of Statistical Learning; Springer: New York, NY, USA, 2009. [Google Scholar]
- Boser, B.E.; Guyon, I.M.; Vapnik, V.N. A training algorithm for optimal margin classifiers. In Proceedings of the 5th Annual Workshop on Computational Learning Theory (COLT’92), Pittsburgh, PA, USA, 27–29 July 1992; pp. 144–152. [Google Scholar] [CrossRef] [Scilit]
- Breiman, L.; Friedman, J.; Olshen, R.A.; Stone, C.J. Classification and Regression Trees; Chapman and Hall/CRC: London, UK, 2017. [Google Scholar]
- Elith, J.; Leathwick, J.R. Species distribution models: Ecological explanation and prediction across space and time. Annu. Rev. Ecol. Evol. Syst. 2009, 40, 677–697. [Google Scholar] [CrossRef] [Scilit]
- Hanewinkel, M.; Cullmann, D.A.; Schelhaas, M.J.; Nabuurs, G.J.; Zimmermann, N.E. Climate change may cause severe loss in the economic value of European forest land. Nat. Clim. Change 2013, 3, 203–207. [Google Scholar] [CrossRef] [Scilit]
- Czúcz, B.; Gálhidy, L.; Mátyás, C. Present and forecasted xeric climatic limits of beech and Sessile oak distribution at low altitudes in Central Europe. Ann. For. Sci. 2011, 68, 99–108. [Google Scholar] [CrossRef] [Scilit]
- Stojanović, D.B.; Levanič, T.; Matović, B.; Orlović, S. Growth decrease and mortality of oak floodplain forests as a response to change of water regime and climate. Eur. J. For. Res. 2015, 134, 555–567. [Google Scholar] [CrossRef] [Scilit]
- Tanovski, V.; Matović, B.; Kesić, L.; Stojanović, D.B. A review of the influence of climate change on coniferous forests in the Balkan peninsula. Topola 2022, 210, 41–64. [Google Scholar] [CrossRef] [Scilit]
- Dyderski, M.K.; Paź-Dyderska, S.; Jagodziński, A.M.; Puchałka, R. Shifts in native tree species distributions in Europe under climate change. J. Environ. Manag. 2025, 373, 123504. [Google Scholar] [CrossRef] [Scilit] [PubMed]
- Domingos, P.; Pazzani, M. On the optimality of the simple Bayesian classifier under zero–one loss. Mach. Learn. 1997, 29, 103–130. [Google Scholar] [CrossRef] [Scilit]
- Thuiller, W.; Georges, D.; Engler, R.; Breiner, F. Biomod2: Ensemble platform for species distribution modeling. Methods Ecol. Evol. 2016, 7, 1143–1151. [Google Scholar]
- Zimmermann, N.E.; Yoccoz, N.G.; Edwards, T.C., Jr.; Meier, E.S.; Thuiller, W.; Guisan, A.; Schmatz, D.R.; Pearman, P.B. Climatic extremes improve predictions of spatial patterns of tree species. Proc. Natl. Acad. Sci. USA 2009, 106, 19723–19728. [Google Scholar] [CrossRef] [Scilit] [PubMed]

Disclaimer/Publisher’s Note: The statements, opinions and data contained in all publications are solely those of the individual author(s) and contributor(s) and not of MDPI and/or the editor(s). MDPI and/or the editor(s) disclaim responsibility for any injury to people or property resulting from any ideas, methods, instructions or products referred to in the content. |
© 2026 by the authors. Licensee MDPI, Basel, Switzerland. This article is an open access article distributed under the terms and conditions of the Creative Commons Attribution (CC BY) license.