
Edge Feathering Across Forest-Meadow Ecotones Increases Light Heterogeneity and Understory Plant Diversity


Abstract
1. Introduction
2. Materials and Methods
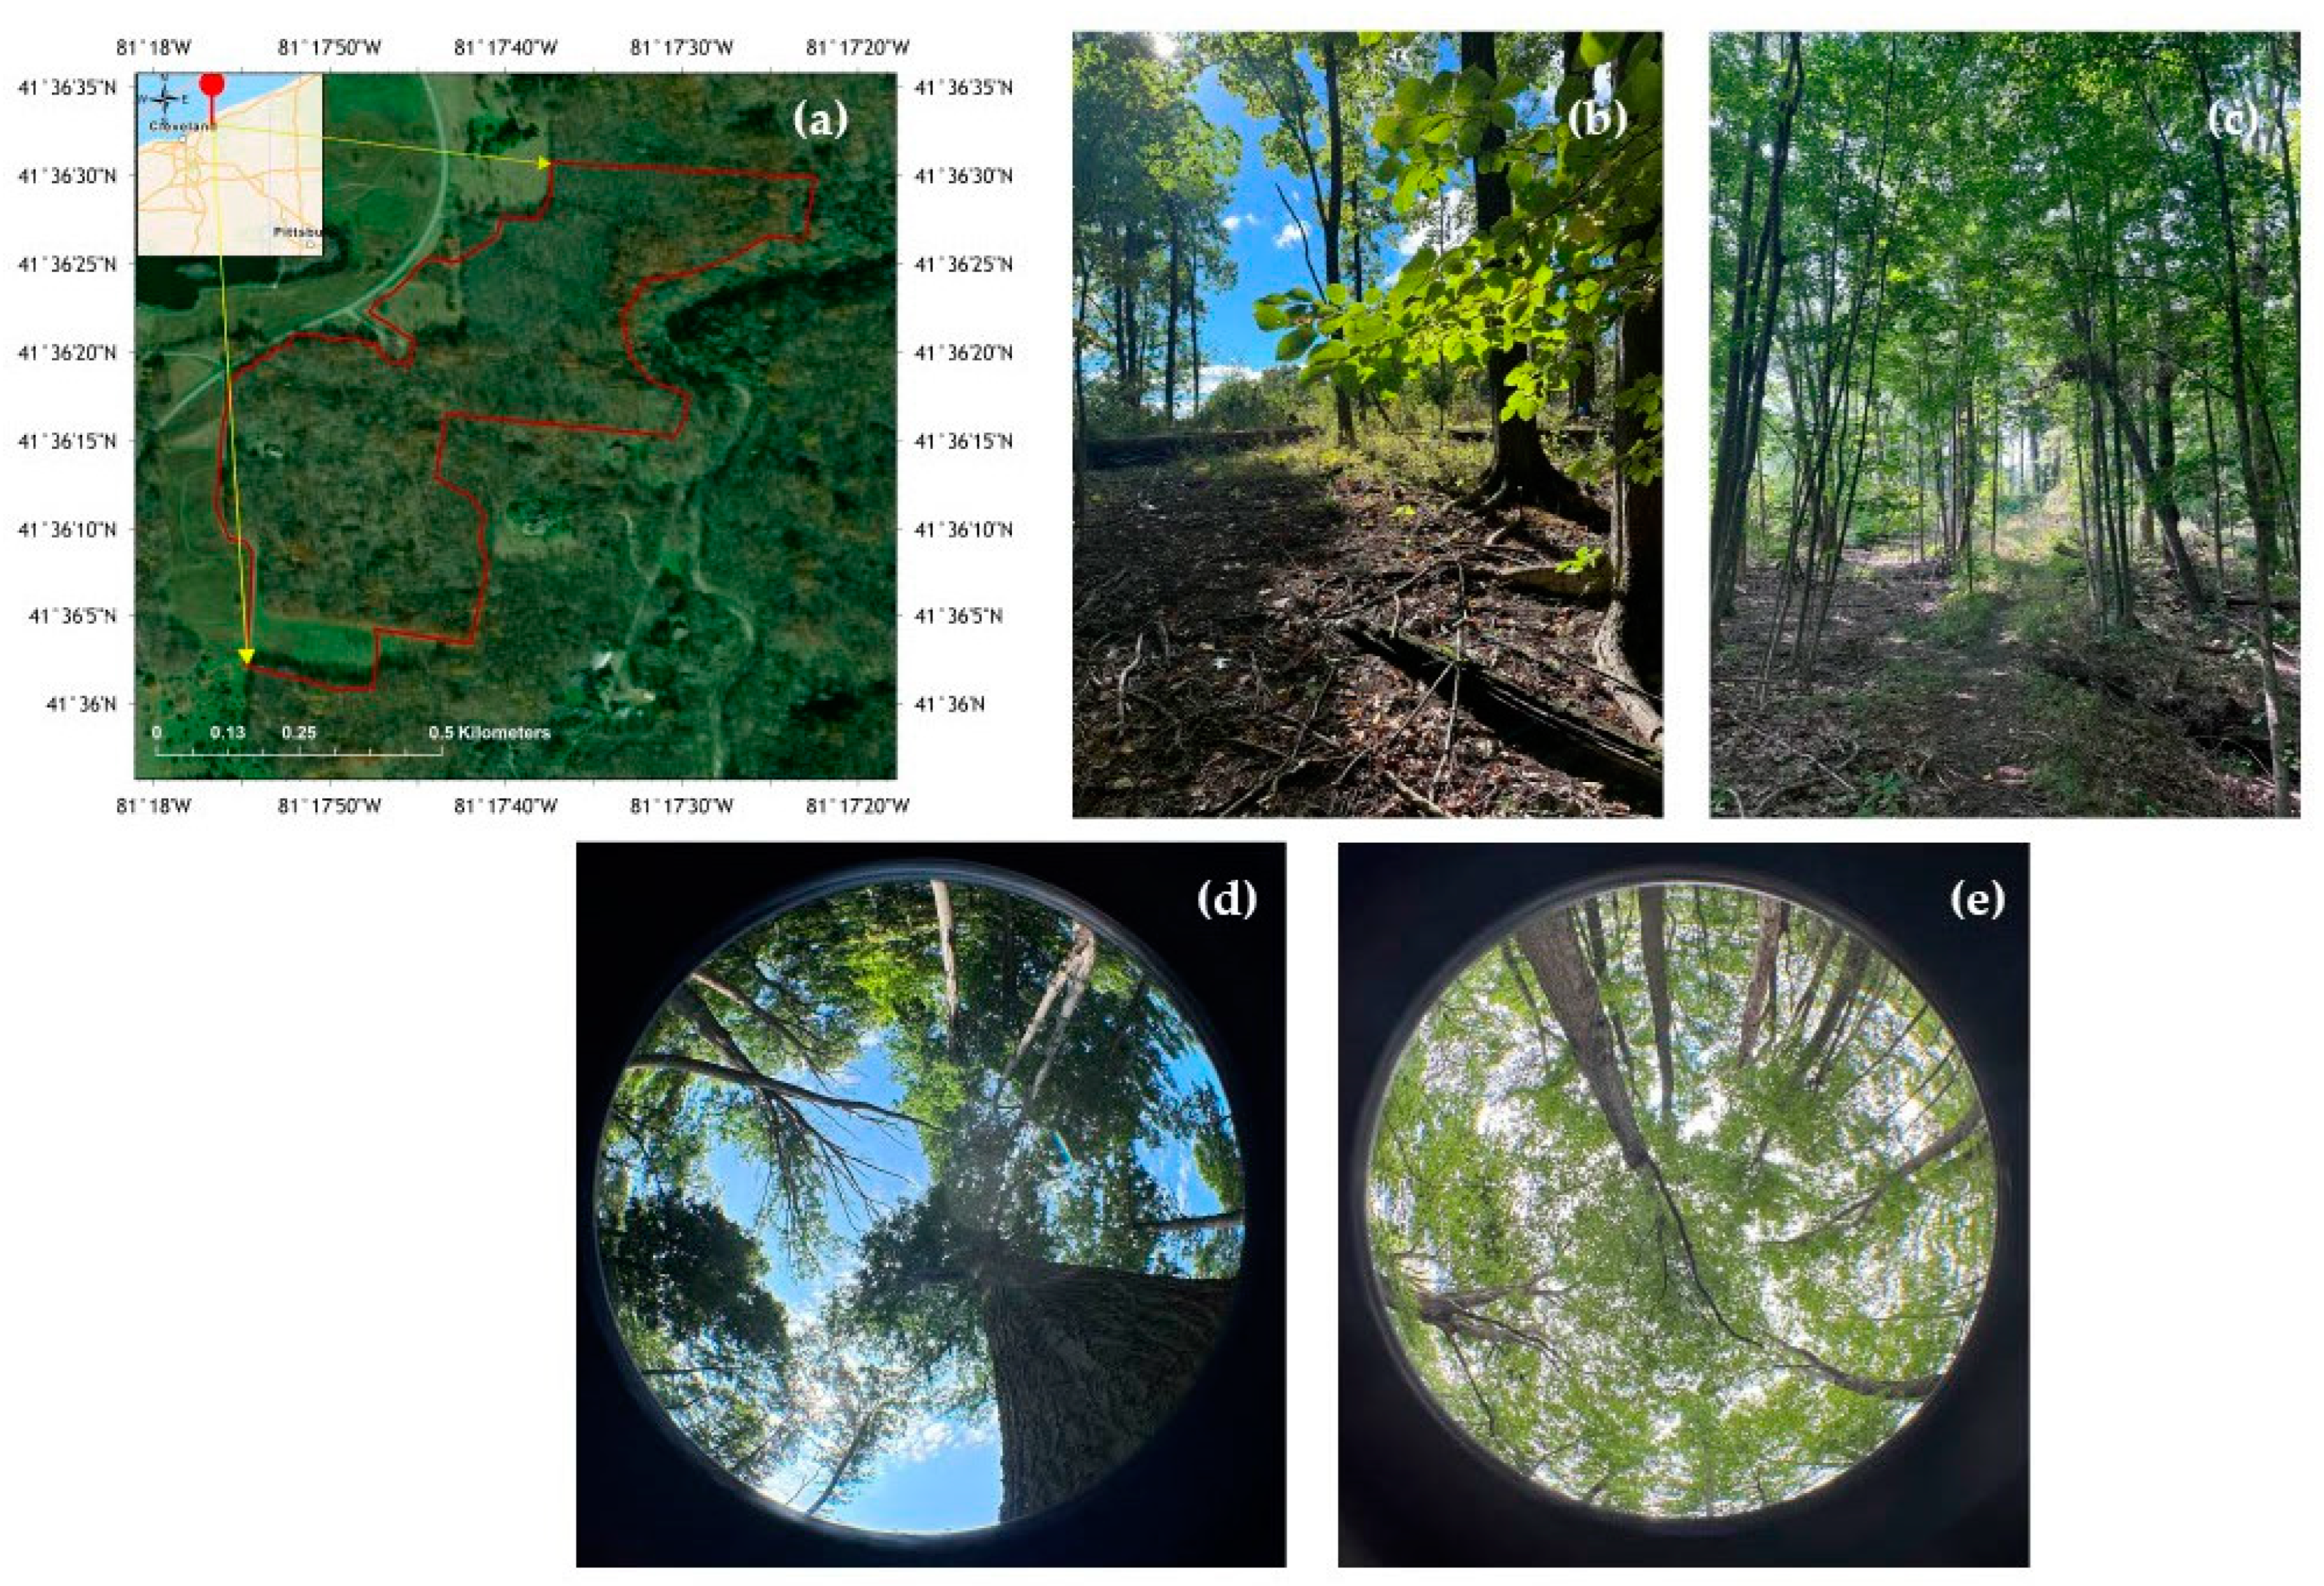
2.1. Study Site
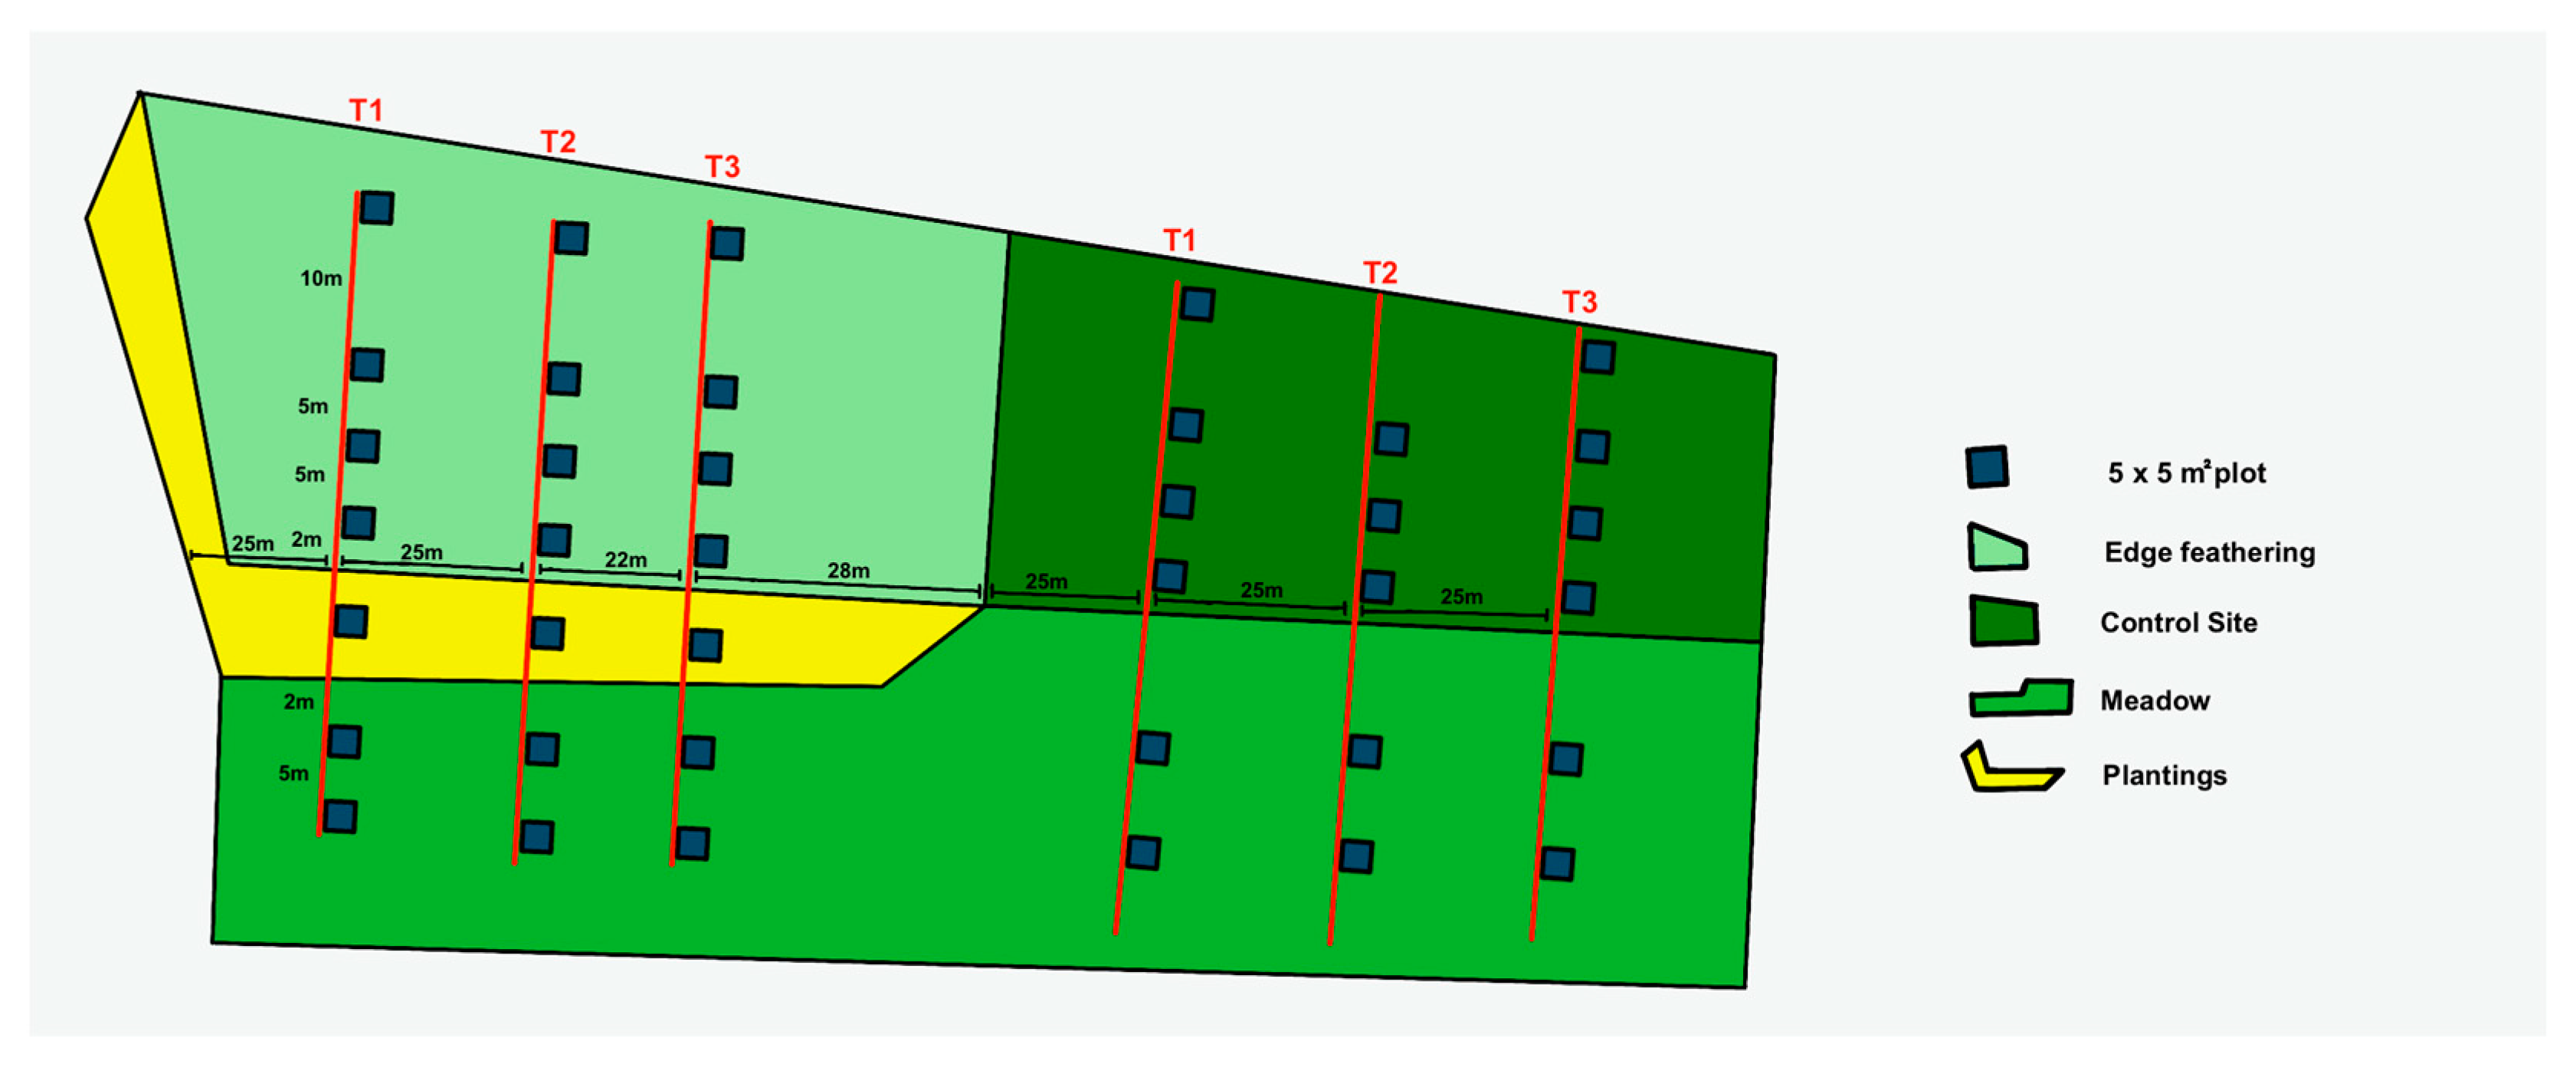
2.2. Edge Feathering Design
2.3. Cutting Intensity and Tree Species Selection and Removal
2.4. Invasive Species Removal and Planting
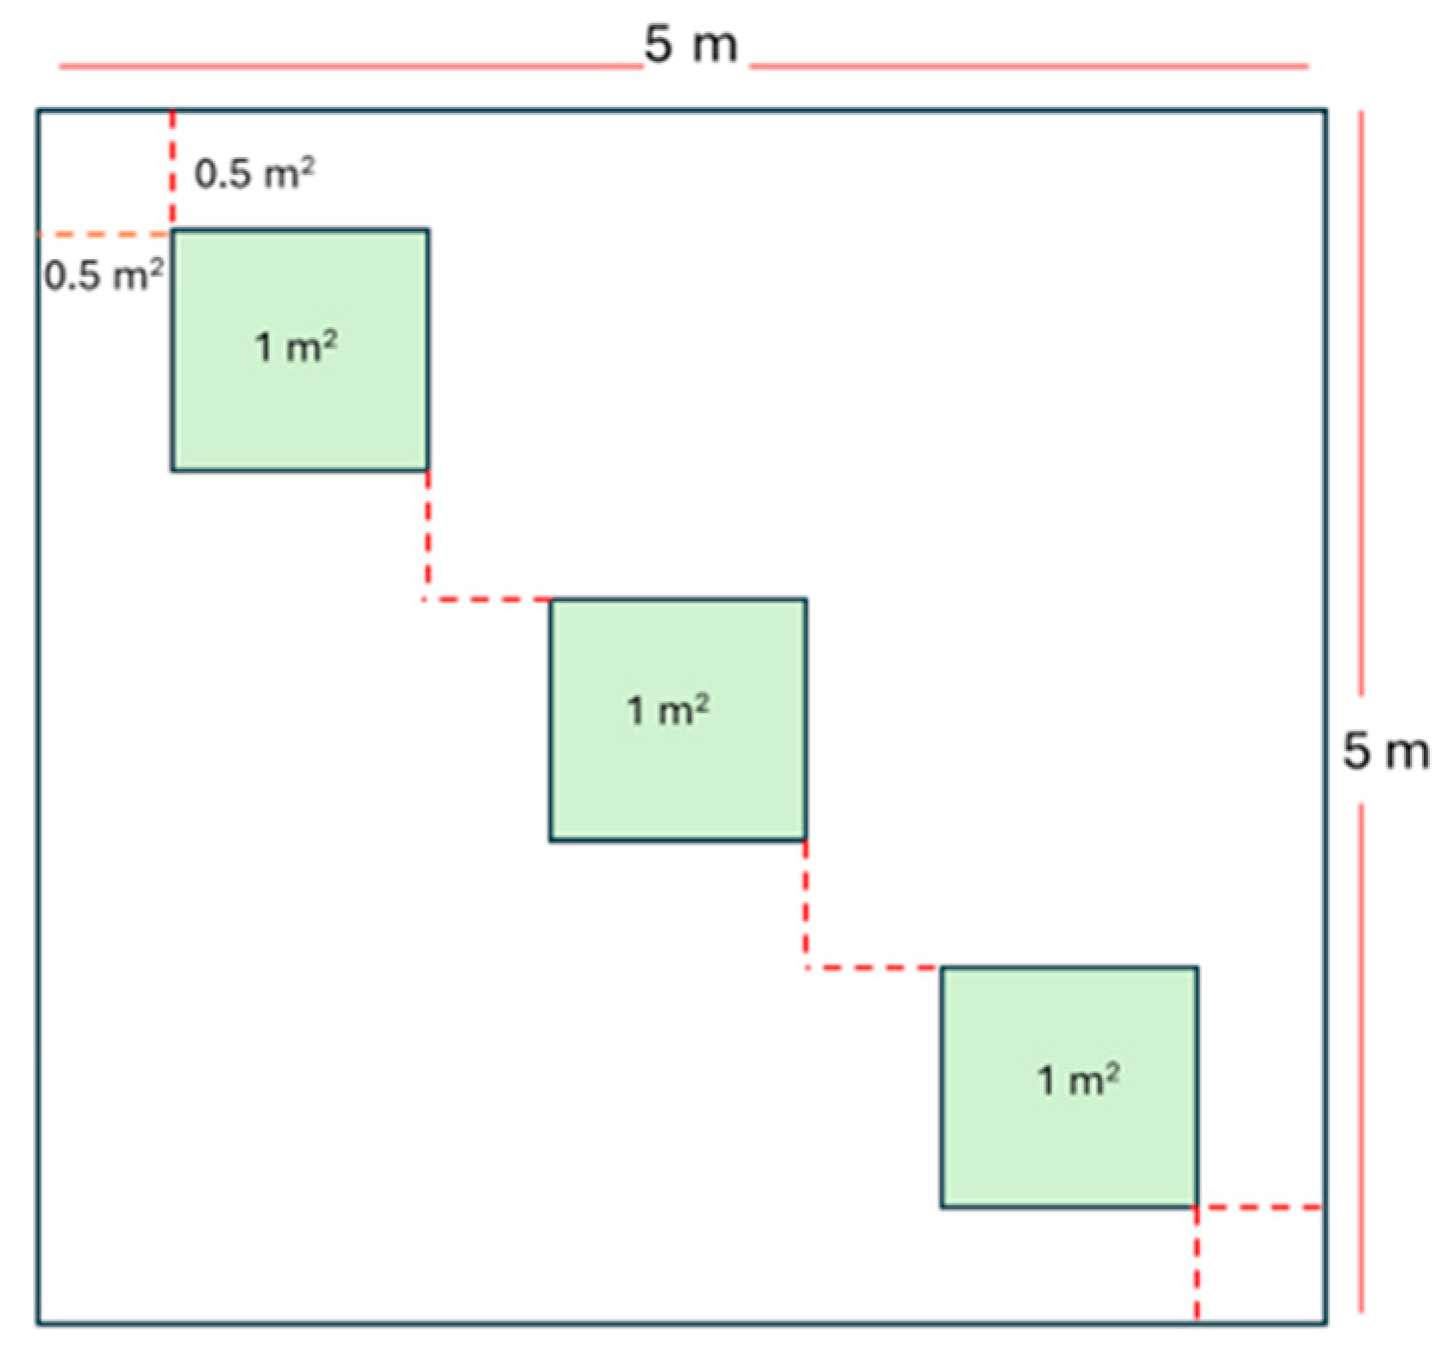
2.5. Plot Arrangement
2.6. Sampling of Understory Vegetation
2.7. Light Measurements and Analysis
2.8. Soil pH Analysis
2.9. Statistical Analysis
2.9.1. Is There a Difference Between Mean and Heterogeneity in Light Intensity and Red-to-Far-Red Ratio Among Treatments?
2.9.2. Does Edge Feathering Influence Plant Community Diversity and Total Cover?
2.9.3. Is Light Heterogeneity a Better Predictor of Diversity and Richness than Mean Light Availability?
2.9.4. Does a Greater Heterogeneity of Light Availability Correlate with Greater Plant Community Diversity?
3. Results
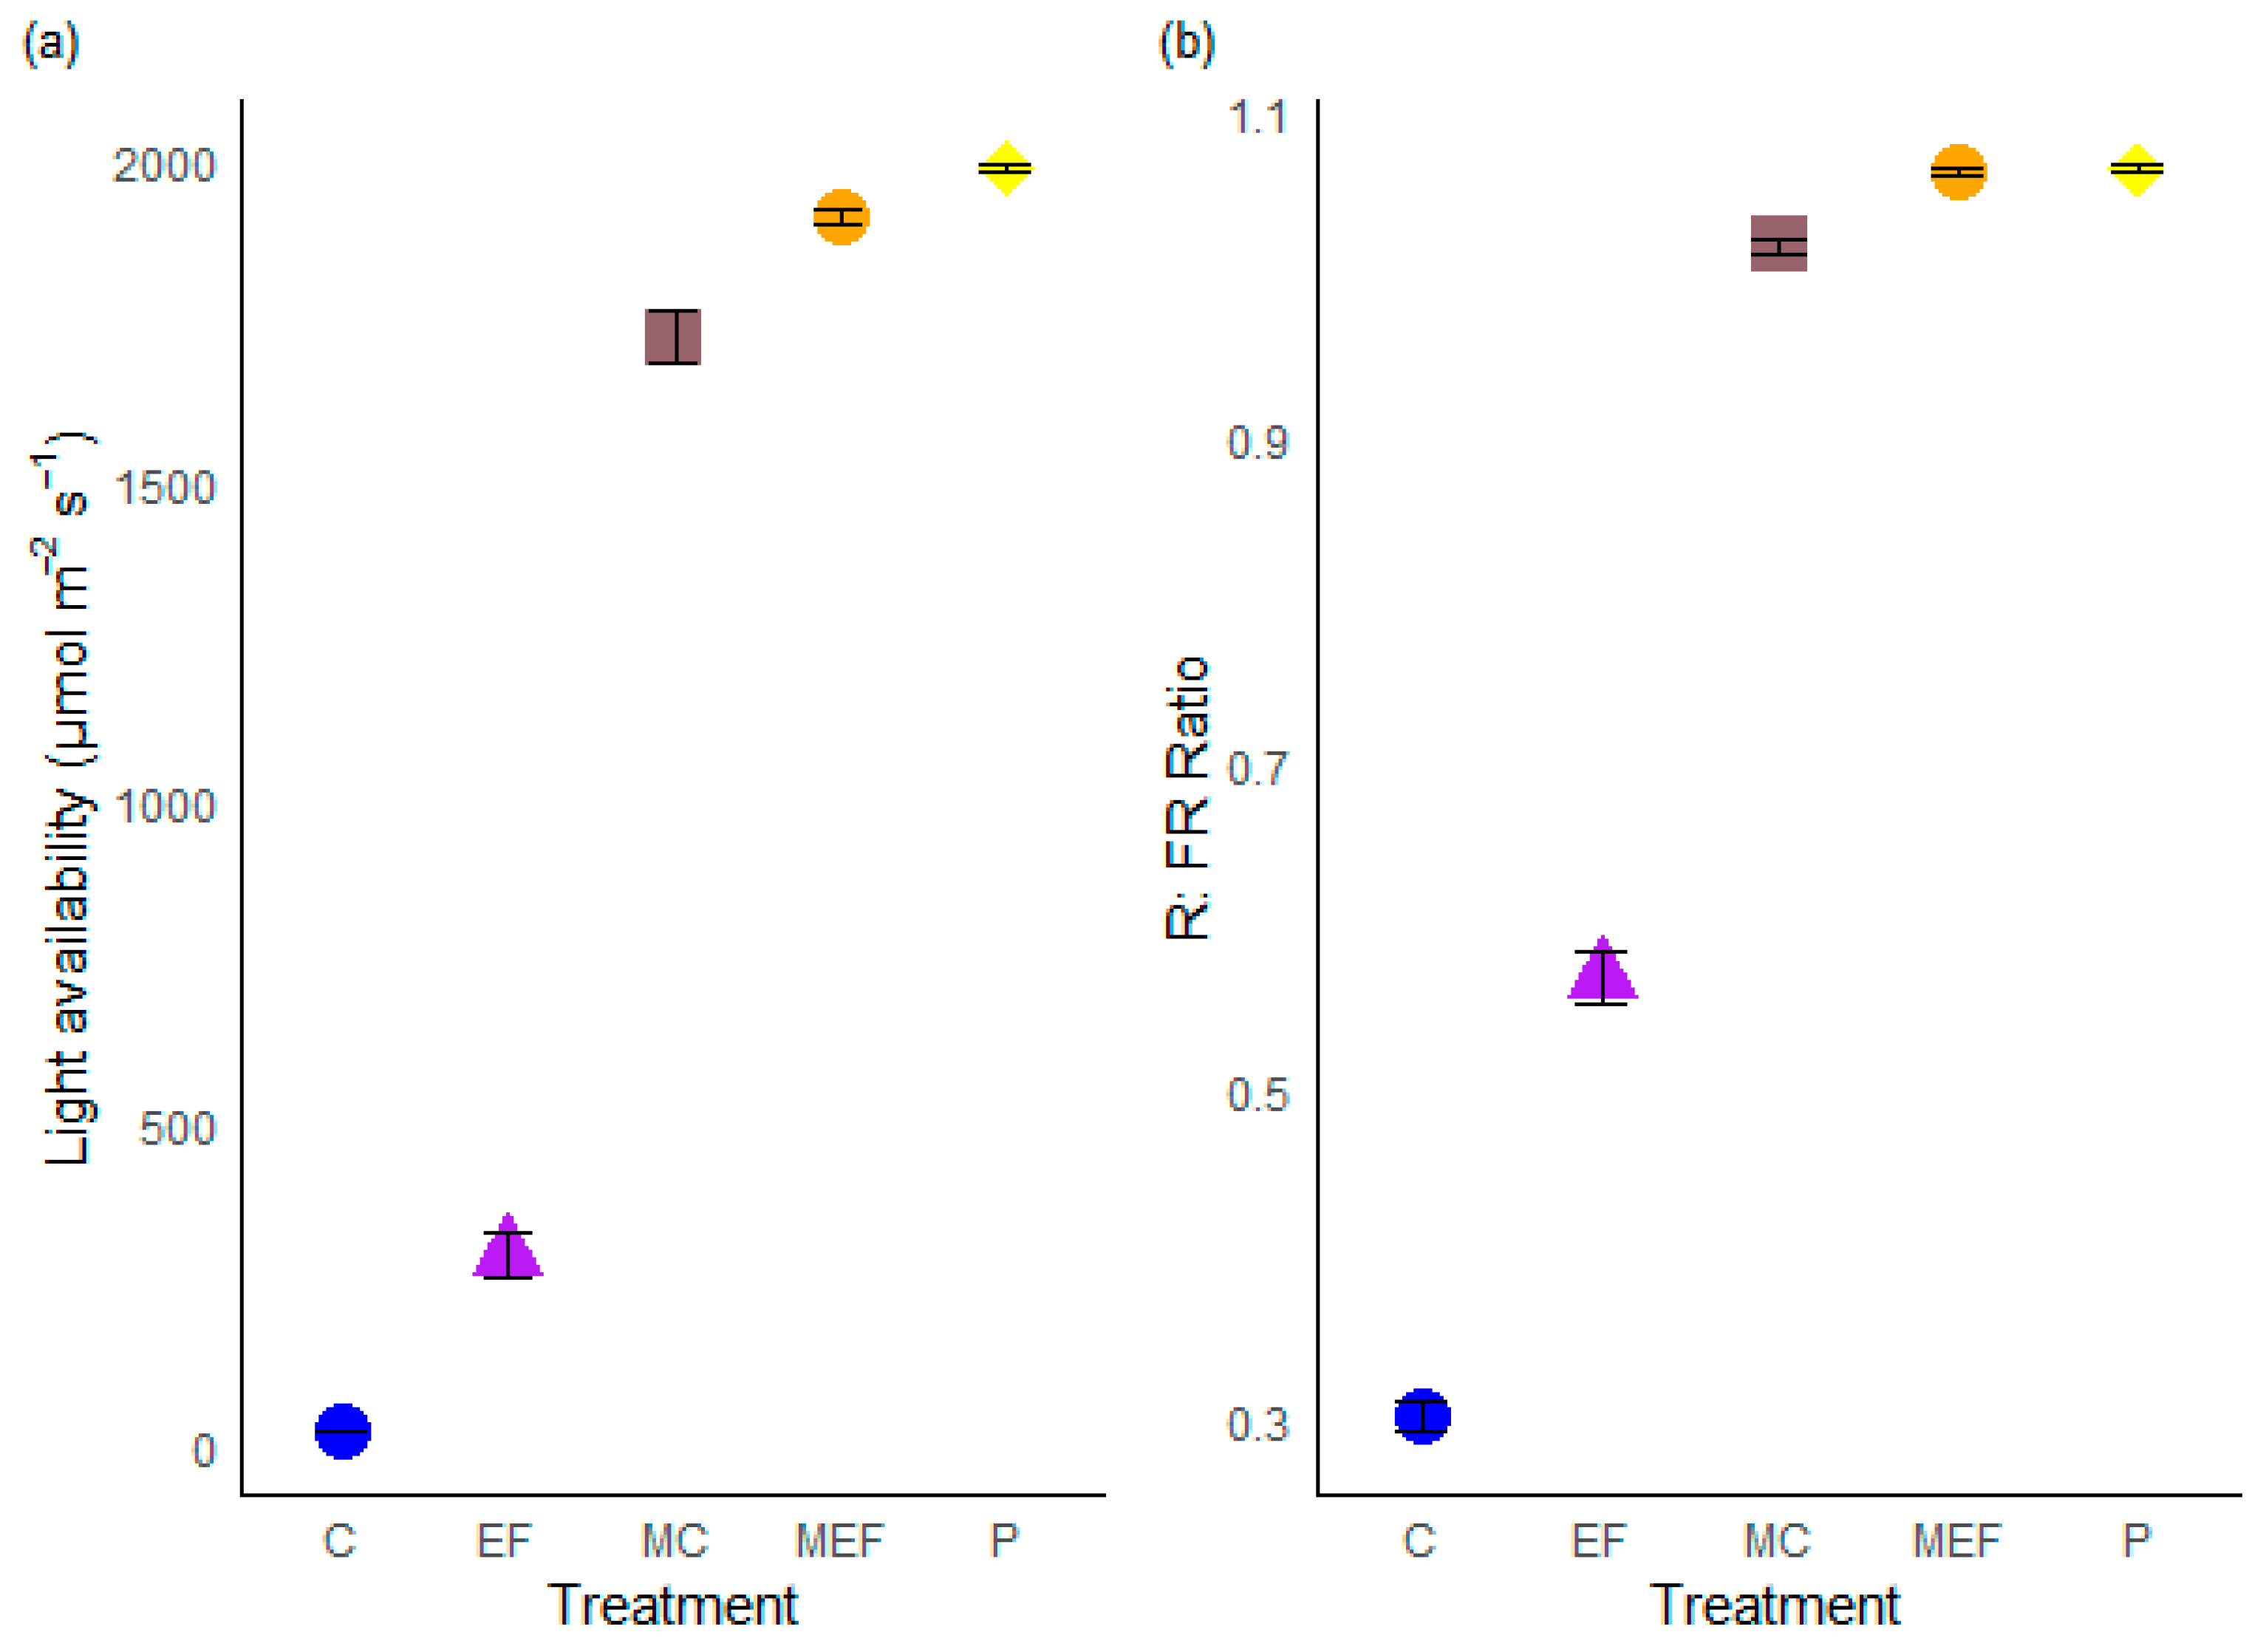
3.1. Is There a Difference Between Mean and Heterogeneity in Light Intensity and Red-to-Far-Red Ratio Among Management Treatments?

| Response Variable | Chisq | Df | p Value |
|---|---|---|---|
| Mean Light Intensity | 3134.5 | 4 | <2.2 × 10⁻¹⁶ *** |
| Mean R: FR ratio | 2362.2 | 4 | <2.2 × 10⁻¹⁶ *** |
| Response Variable | Df | F Value | p Value |
|---|---|---|---|
| CV of Light Intensity | 4, 33 | 7.5517 | 0.0001957 *** |
| CV of R: FR ratio | 4, 33 | 3.0909 | 0.02884 * |
| Response Variable | Chisq | Df | p Value |
|---|---|---|---|
| CV of Light Intensity | 25.785 | 4 | 3.497 × 10⁻⁵ |
| CV of R: FR ratio | 27.098 | 4 | 1.899 × 10⁻⁵ |

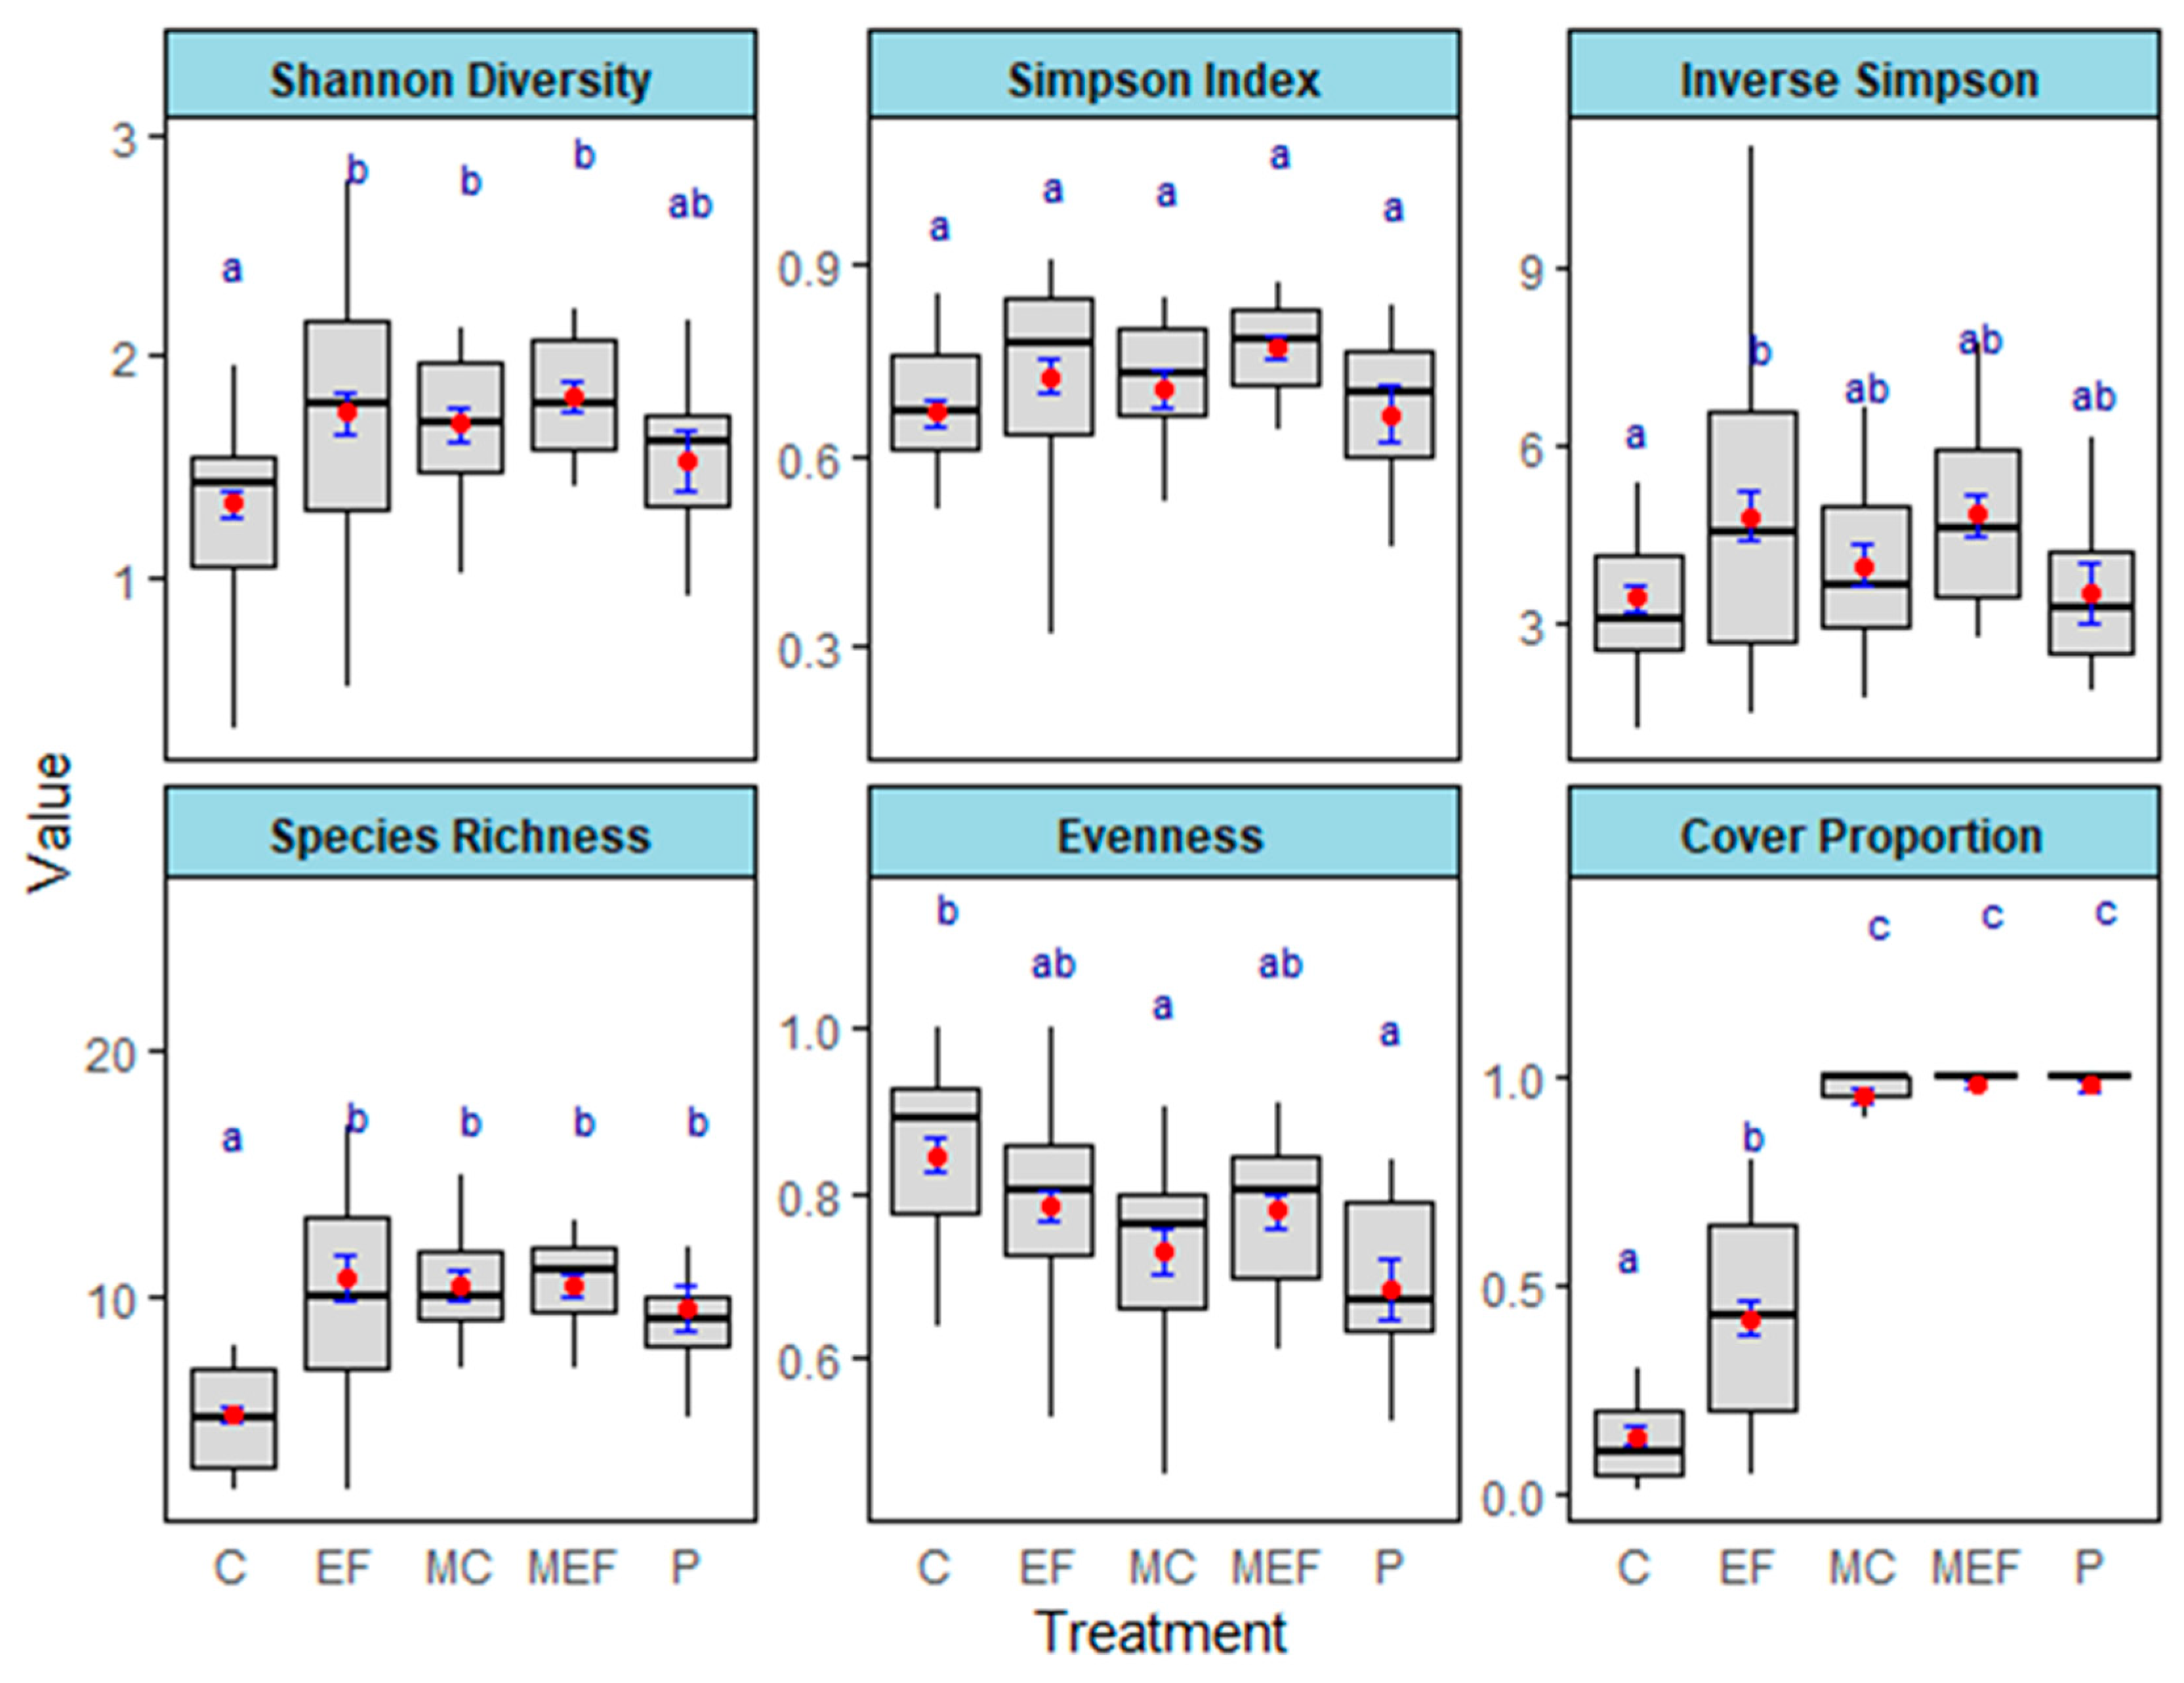
3.2. Does Edge Feathering Influence Plant Species Richness and Total Cover?
| Response Variable | Chisq | Df | p-Value |
|---|---|---|---|
| Shannon index | 25.265 | 4 | 4.45 × 10⁻⁵ *** |
| Simpson index (D) | 8.7309 | 4 | 0.06819 |
| Simpson’s Diversity Index (1/D) | 13.885 | 4 | 0.007671 ** |
| Species richness | 67.573 | 4 | 7.38 × 10⁻¹⁴ *** |
| Pielou’s evenness | 22.35 | 4 | 0.0001707 *** |
| Total cover | 505.59 | 4 | 2.2 × 10⁻¹⁶ *** |
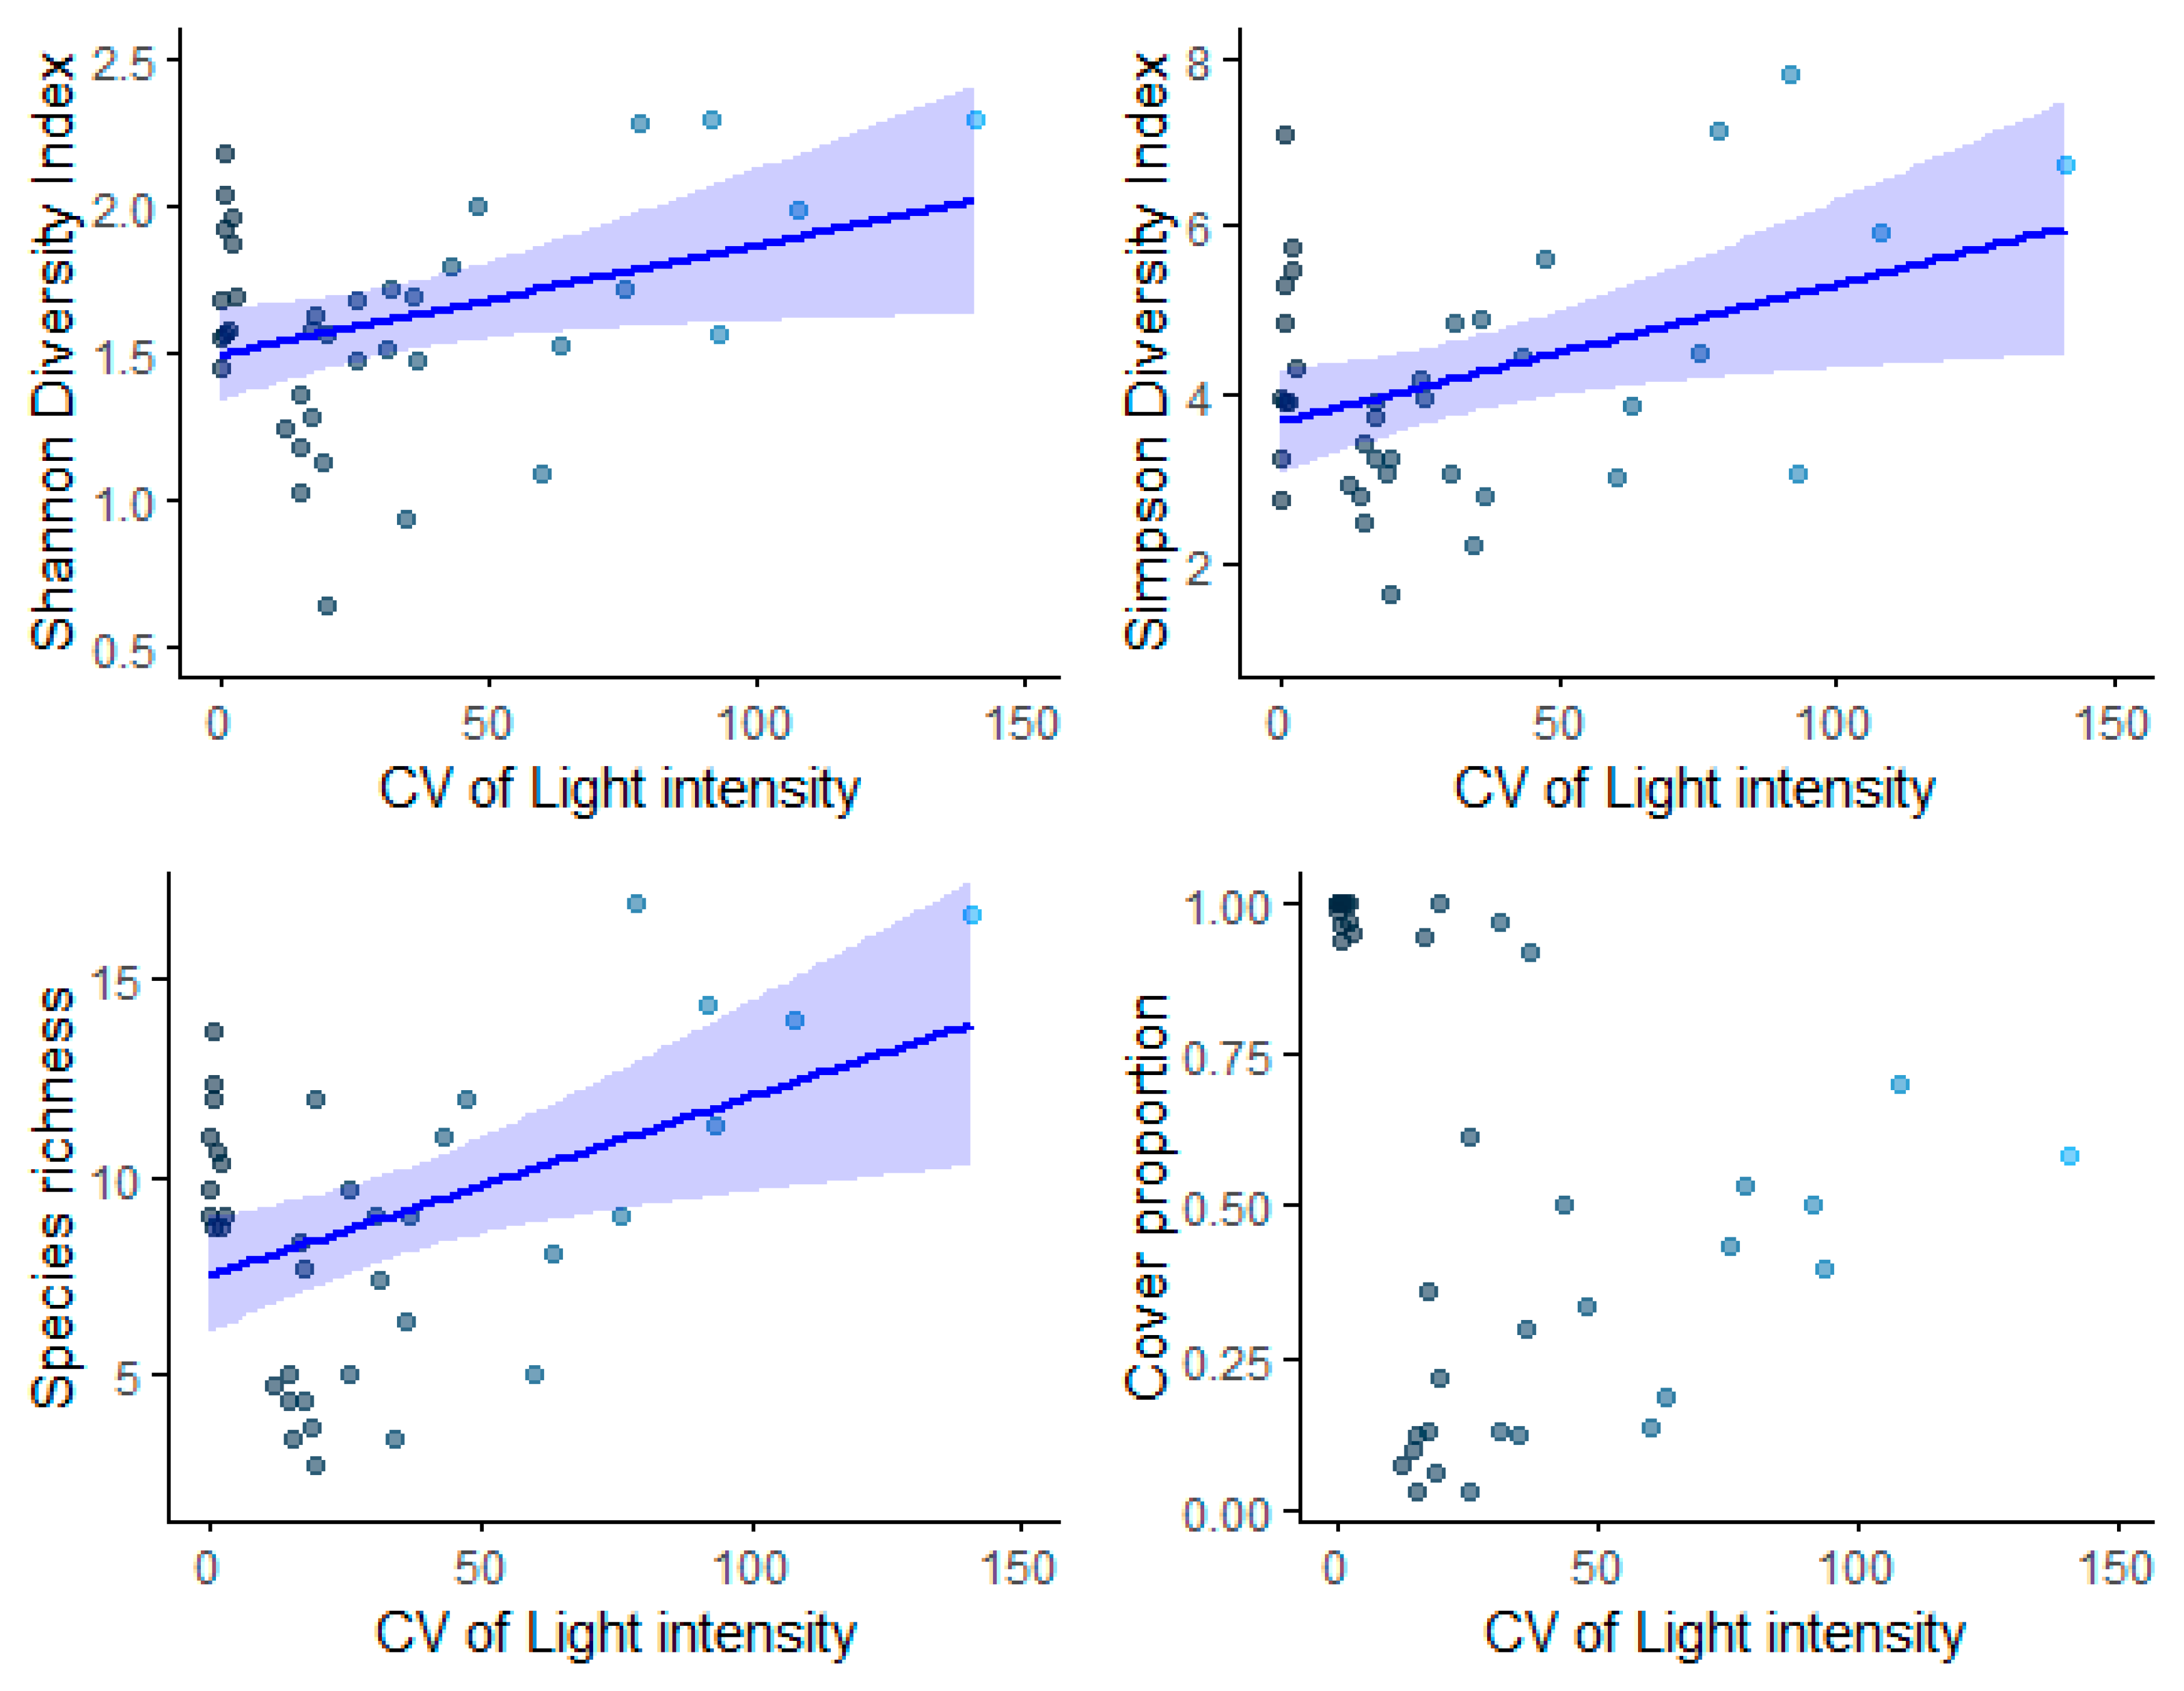
3.3. Is Light Heterogeneity a Better Predictor of Diversity and Richness than Mean Light Availability?
3.4. Does Greater Heterogeneity of Light Availability Correlate with Higher Plant Community Diversity?
4. Discussion
4.1. Edge Feathering Increased Mean Light Availability and Light Heterogeneity
4.2. Edge Feathering Increased Plant Community Diversity
4.3. Light Heterogeneity Was the Best Predictor of Plant Species Diversity
5. Conclusions
Author Contributions
Funding
Data Availability Statement
Acknowledgments
Conflicts of Interest
Abbreviations
Appendix A
| Descriptives | EF | Control | Meadow-Opposite to EF Site | Meadow-Opposite to Control Site | Planting |
|---|---|---|---|---|---|
| ID | EF | C | MEF | MC | P |
| Geographical Coordinates | 41.60156° N −81.29818° W | 41.60156° N −81.29616° W | 41.60098° N −81.29803° W | 41.600888° N, −81.296374° W | 41.601337° N, −81.298155° W |
| Landscape type | Managed Forest | Core Forest | Meadow | Meadow | Managed Plantings |
| Soil moisture content (saturated) | 26.67% | 27.01% | 40.61% | 44.52% | 47.4% |
| Management | Selective tree removal and canopy opening at different intensities in 2021 | No specific management type | No specific management type | No specific management type | Planting of hardwood trees in 2021 |
| Size | ~0.88 acres (~3566.16 m2) | ~0.75 acres (~3048 m2) | ~0.49 acres (1989 m2) | ~0.42 acres (~1700 m2) | ~0.5 acres (2023 m2) |
| Mean Annual Temperature (°C) during Growth Period, 2021–2024 | 20.7 °C | ||||
| Mean annual precipitation during Growth Period, 2021–2024 | 99.55 mm | ||||
| Soil Type | Sandy Loam | Loam | Sandy Loam | Sandy Loam | Sandy Loam |
| Main overstory tree species (>20 cm DBH) | As, Qr, Fa | As, Qr, Ta | No overstory trees | Scattered As trees | No overstory trees |
| Number of plots (5 m2) | 12 | 11 | 6 | 6 | 3 |
| Number of subplots (1 m2) | 36 | 33 | 18 | 18 | 9 |
| Mean light availability (May–Early September) | 480.95 µmol m−2 s−1 | 32.39 µmol m−2 s−1 | 1912.07 µmol m−2 s−1 | 1729.27 µmol m−2 s−1 | 1984.08 µmol m−2 s−1 |
| Treatment | Contrast | Estimate | SE | df | t Ratio | p Value |
|---|---|---|---|---|---|---|
| Mean Light intensity | C-EF | −285.3 | 32.3 | 563 | −8.82 | <0.0001 |
| C-MC | −1662.6 | 41.9 | 561 | −39.65 | <0.0001 | |
| C-MEF | −1850.6 | 41.9 | 561 | −44.135 | <0.0001 | |
| C-P | −1870.6 | 54.8 | 561 | −34.12 | <0.0001 | |
| EF-MC | −1377.3 | 41.9 | 556 | −32.834 | <0.0001 | |
| EF-MEF | −1565.4 | 41.9 | 556 | −37.318 | <0.0001 | |
| EF-P | −1585.3 | 54.8 | 559 | −28.91 | <0.0001 | |
| MC-MEF | −188.1 | 44.6 | 562 | −4.219 | 0.0003 | |
| MC-P | −208 | 56.9 | 565 | −3.657 | 0.0026 | |
| MEF-P | −19.9 | 56.9 | 565 | −0.35 | 0.9968 | |
| Mean R:FR ratio | C-EF | −0.27554 | 0.0148 | 562 | −18.675 | <0.0001 |
| C-MC | −0.72034 | 0.0191 | 565 | −37.683 | <0.0001 | |
| C-MEF | −0.76507 | 0.0191 | 565 | −40.024 | <0.0001 | |
| C-P | −0.7697 | 0.025 | 565 | −30.801 | <0.0001 | |
| EF-MC | −0.4448 | 0.0191 | 564 | −23.263 | <0.0001 | |
| EF-MEF | −0.48953 | 0.0191 | 564 | −25.603 | <0.0001 | |
| EF-P | −0.49416 | 0.025 | 564 | −19.772 | <0.0001 | |
| MC-MEF | −0.04473 | 0.0203 | 562 | −2.2 | 0.1813 | |
| MC-P | −0.04936 | 0.0259 | 564 | −1.903 | 0.3167 | |
| MEF-P | −0.00463 | 0.0259 | 564 | −0.179 | 0.9998 |
| Treatment | Contrast | Test Statistics | p Value |
|---|---|---|---|
| CV of Light intensity | C-EF | −2.26399 | 0.0707 |
| C-MC | 0.502466 | 0.6153 | |
| C-MEF | 2.482773 | 0.0521 | |
| EF-MC | 2.400105 | 0.0574 | |
| EF-MEF | 4.410193 | 0.0001 * | |
| MC-MEF | 1.740787 | 0.1634 | |
| P-C | 2.026683 | 0.1067 | |
| P-EF | 3.509077 | 0.0020 * | |
| P-MC | 1.506203 | 0.198 | |
| P-MEF | 0.084856 | 0.4662 | |
| CV of R:FR ratio | C-EF | 0.300492 | 0.7638 |
| C-MC | 3.143083 | 0.0067 * | |
| C-MEF | 3.911393 | 0.0005 * | |
| C-P | 2.633274 | 0.0254 | |
| EF-MC | 2.939485 | 0.0115 * | |
| EF-MEF | 3.719349 | 0.0009 * | |
| EF-P | 2.462786 | 0.0345 | |
| MC-MEF | 0.675381 | 0.9989 | |
| MC-P | 0.169675 | 0.4326 | |
| MEF-P | −0.38177 | 1 |
| Treatment | Contrast | Estimate | SE | df | t Ratio | p Value |
|---|---|---|---|---|---|---|
| Shannon Index | C-EF | −0.4324 | 0.0985 | 106 | −4.388 | 0.0003 |
| C-MC | −0.3573 | 0.128 | 109 | −2.792 | 0.0477 | |
| C-MEF | −0.4854 | 0.128 | 109 | −3.793 | 0.0022 | |
| C-P | −0.2215 | 0.1675 | 109 | −1.322 | 0.6782 | |
| EF-MC | 0.0751 | 0.1281 | 109 | 0.586 | 0.9768 | |
| EF-MEF | −0.053 | 0.1281 | 109 | −0.414 | 0.9938 | |
| EF-P | 0.2109 | 0.1676 | 109 | 1.258 | 0.717 | |
| MC-MEF | −0.1281 | 0.1358 | 106 | −0.943 | 0.8794 | |
| MC-P | 0.1358 | 0.1736 | 108 | 0.782 | 0.9352 | |
| MEF-P | 0.2639 | 0.1736 | 108 | 1.52 | 0.5518 | |
| Simpson Index (D) | C-EF | −0.0599 | 0.0318 | 106.9 | −1.884 | 0.3321 |
| C-MC | −0.0401 | 0.0411 | 99.5 | −0.977 | 0.8651 | |
| C-MEF | −0.1043 | 0.0411 | 99.5 | −2.54 | 0.09 | |
| C-P | −0.003 | 0.0552 | 88.1 | −0.054 | 1 | |
| EF-MC | 0.0198 | 0.041 | 93 | 0.482 | 0.9888 | |
| EF-MEF | −0.0445 | 0.041 | 93 | −1.084 | 0.8142 | |
| EF-P | 0.0569 | 0.0551 | 83.6 | 1.031 | 0.8401 | |
| MC-MEF | −0.0642 | 0.0438 | 106.2 | −1.465 | 0.5871 | |
| MC-P | 0.0371 | 0.0573 | 106.2 | 0.648 | 0.9667 | |
| MEF-P | 0.1013 | 0.0573 | 106.2 | 1.769 | 0.397 | |
| Simpson Diversity Index (1/D) | C-EF | −1.4063 | 0.433 | 107 | −3.25 | 0.0131 |
| C-MC | −0.5854 | 0.562 | 108 | −1.041 | 0.8356 | |
| C-MEF | −1.4359 | 0.562 | 108 | −2.554 | 0.0866 | |
| C-P | −0.2929 | 0.74 | 107 | −0.396 | 0.9947 | |
| EF-MC | 0.8209 | 0.562 | 105 | 1.459 | 0.5909 | |
| EF-MEF | −0.0296 | 0.562 | 105 | −0.053 | 1 | |
| EF-P | 1.1134 | 0.74 | 105 | 1.505 | 0.5617 | |
| MC-MEF | −0.8506 | 0.596 | 106 | −1.426 | 0.6123 | |
| MC-P | 0.2925 | 0.766 | 109 | 0.382 | 0.9954 | |
| MEF-P | 1.1431 | 0.766 | 109 | 1.492 | 0.5697 | |
| Species richness | C-EF | −0.76936 | 0.0962 | Inf | −7.996 | <0.0001 |
| C-MC | −0.66824 | 0.1172 | Inf | −5.703 | <0.0001 | |
| C-MEF | −0.67356 | 0.1171 | Inf | −5.754 | <0.0001 | |
| C-P | −0.57403 | 0.1496 | Inf | −3.836 | 0.0012 | |
| EF-MC | 0.10112 | 0.1026 | Inf | 0.986 | 0.8618 | |
| EF-MEF | 0.09579 | 0.1024 | Inf | 0.935 | 0.8833 | |
| EF-P | 0.19532 | 0.1386 | Inf | 1.41 | 0.6214 | |
| MC-MEF | −0.00533 | 0.1096 | Inf | −0.049 | 1 | |
| MC-P | 0.0942 | 0.1437 | Inf | 0.656 | 0.9657 | |
| MEF-P | 0.09953 | 0.1437 | Inf | 0.693 | 0.9581 | |
| Pielou’s evenness | C-EF | 0.06133 | 0.0268 | 107 | 2.287 | 0.1572 |
| C-MC | 0.11818 | 0.0326 | 107 | 3.624 | 0.004 | |
| C-MEF | 0.06829 | 0.0326 | 107 | 2.094 | 0.2302 | |
| C-P | 0.16333 | 0.0418 | 107 | 3.903 | 0.0015 | |
| EF-MC | 0.05685 | 0.0321 | 107 | 1.77 | 0.3967 | |
| EF-MEF | 0.00695 | 0.0321 | 107 | 0.216 | 0.9995 | |
| EF-P | 0.102 | 0.0415 | 107 | 2.459 | 0.1079 | |
| MC-MEF | −0.04989 | 0.0371 | 107 | −1.345 | 0.6638 | |
| MC-P | 0.04515 | 0.0454 | 107 | 0.994 | 0.8576 | |
| MEF-P | 0.09504 | 0.0454 | 107 | 2.092 | 0.2311 | |
| Cover proportion | C-EF | −0.29068 | 0.0352 | 106 | −8.268 | <0.0001 |
| C-MC | −0.79848 | 0.0456 | 109 | −17.495 | <0.0001 | |
| C-MEF | −0.82404 | 0.0456 | 109 | −18.055 | <0.0001 | |
| C-P | −0.81603 | 0.0597 | 109 | −13.664 | <0.0001 | |
| EF-MC | −0.5078 | 0.0457 | 109 | −11.12 | <0.0001 | |
| EF-MEF | −0.53336 | 0.0457 | 109 | −11.679 | <0.0001 | |
| EF-P | −0.52535 | 0.0597 | 109 | −8.794 | <0.0001 | |
| MC-MEF | −0.02556 | 0.0485 | 106 | −0.527 | 0.9844 | |
| MC-P | −0.01755 | 0.0619 | 108 | −0.284 | 0.9986 | |
| MEF-P | 0.00801 | 0.0619 | 108 | 0.129 | 0.9999 |
| Response Variable | Best Model | Distribution | Model Type | Null Deviance | Residual Deviance |
|---|---|---|---|---|---|
| Shannon_Diversity | Shannon_Diversity~Light_intensity_CV + CV_RFR_ratio | Normal | glm | 5.3433 | 3.1232 |
| Inverse_Simpson | Inverse_Simpson~Light_intensity_CV + CV_RFR_ratio | Normal | glm | 78.75 | 55.48 |
| Species_richness | Species_richness~Light_intensity_CV + CV_RFR_ratio + Mean_Light_intensity | Normal | glm | 511.2 | 168.3 |
| Evenness | Evenness~Light_intensity_CV + Mean_Light_intensity | Normal | glm | 0.2732 | 0.1822 |
| Cover_prop | Cover_prop~Light_intensity_CV + Mean_Light_intensity + CV_pH | Quasi-poisson | glm | 5.246 | 0.5065 |
| Diversity Matrix | Predictor | Estimate | Std. Error | t Value | p Value |
|---|---|---|---|---|---|
| Shannon Diversity | CV of R:FR | −0.006006 | 0.004330 | −1.387 | 0.174 |
| Simpson Diversity Index (1/D) | CV of R:FR | −0.005636 | 0.017034 | −0.331 | 0.743 |
| Species richness | CV of R:FR | −0.06889 | 0.04192 | −1.643 | 0.109 |
| Cover proportion | CV of R:FR | −0.021084 | 0.002653 | −7.947 | 1.96 × 10⁻⁹ |
References
- Peyras, M.; Vespa, N.I.; Bellocq, M.I.; Zurita, G.A. Quantifying Edge Effects: The Role of Habitat Contrast and Species Specialization. J. Insect Conserv. 2013, 17, 807–820. [Google Scholar] [CrossRef]
- Esin, M.N.; Ruchin, A.B. Ruchin. Edge Effects on Diptera Distribution in Deciduous Forests of the Centre of European Russia. J. Wildl. Biodivers. 2024, 8, 16–37. [Google Scholar] [CrossRef]
- Magura, T.; Lövei, G.L. The Permeability of Natural versus Anthropogenic Forest Edges Modulates the Abundance of Ground Beetles of Different Dispersal Power and Habitat Affinity. Diversity 2020, 12, 320. [Google Scholar] [CrossRef]
- Haugo, R.D.; Halpern, C.B.; Bakker, J.D. Landscape Context and Long-Term Tree Influences Shape the Dynamics of Forest-Meadow Ecotones in Mountain Ecosystems. Ecosphere 2011, 2, art91. [Google Scholar] [CrossRef]
- Kark, S. Effects of Ecotones on Biodiversity. In Encyclopedia of Biodiversity; Elsevier: Amsterdam, The Netherlands, 2013; pp. 142–148. [Google Scholar] [CrossRef]
- Ares, A.; Neill, A.R.; Puettmann, K.J. Understory Abundance, Species Diversity and Functional Attribute Response to Thinning in Coniferous Stands. For. Ecol. Manag. 2010, 260, 1104–1113. [Google Scholar] [CrossRef]
- Taki, H.; Inoue, T.; Tanaka, H.; Makihara, H.; Sueyoshi, M.; Isono, M.; Okabe, K. Responses of Community Structure, Diversity, and Abundance of Understory Plants and Insect Assemblages to Thinning in Plantations. For. Ecol. Manag. 2010, 259, 607–613. [Google Scholar] [CrossRef]
- Wuyts, K.; De Schrijver, A.; Vermeiren, F.; Verheyen, K. Gradual Forest Edges Can Mitigate Edge Effects on Throughfall Deposition If Their Size and Shape Are Well Considered. For. Ecol. Manag. 2009, 257, 679–687. [Google Scholar] [CrossRef]
- Matlack, G.R. Microenvironment Variation within and among Forest Edge Sites in the Eastern United States. Biol. Conserv. 1993, 66, 185–194. [Google Scholar] [CrossRef]
- De Pauw, K.; Sanczuk, P.; Meeussen, C.; Depauw, L.; De Lombaerde, E.; Govaert, S.; Vanneste, T.; Brunet, J.; Cousins, S.A.O.; Gasperini, C.; et al. Forest Understorey Communities Respond Strongly to Light in Interaction with Forest Structure, but Not to Microclimate Warming. New Phytol. 2022, 233, 219–235. [Google Scholar] [CrossRef]
- Edgefeathering.Pdf. Available online: https://fw.ky.gov/wildlife/documents/edgefeathering.pdf (accessed on 23 September 2024).
- Barbier, S.; Gosselin, F.; Balandier, P. Influence of Tree Species on Understory Vegetation Diversity and Mechanisms Involved—A Critical Review for Temperate and Boreal Forests. For. Ecol. Manag. 2008, 254, 1–15. [Google Scholar] [CrossRef]
- Helbach, J.; Frey, J.; Messier, C.; Mörsdorf, M.; Scherer-Lorenzen, M. Light Heterogeneity Affects Understory Plant Species Richness in Temperate Forests Supporting the Heterogeneity-Diversity Hypothesis. Ecol. Evol. 2022, 12, e8534. [Google Scholar] [CrossRef] [PubMed]
- Tsai, H.-C.; Chiang, J.-M.; McEwan, R.W.; Lin, T.-C. Decadal Effects of Thinning on Understory Light Environments and Plant Community Structure in a Subtropical Forest. Ecosphere 2018, 9, e02464. [Google Scholar] [CrossRef]
- Su, X.; Wang, M.; Huang, Z.; Fu, S.; Chen, H.Y.H. Forest Understorey Vegetation: Colonization and the Availability and Heterogeneity of Resources. Forests 2019, 10, 944. [Google Scholar] [CrossRef]
- Bartemucci, P.; Messier, C.; Canham, C.D. Overstory Influences on Light Attenuation Patterns and Understory Plant Community Diversity and Composition in Southern Boreal Forests of Quebec. Can. J. For. Res. 2006, 36, 2065–2079. [Google Scholar] [CrossRef]
- Beck, J.J.; Givnish, T.J. Fine-Scale Environmental Heterogeneity and Spatial Niche Partitioning among Spring-Flowering Forest Herbs. Am. J. Bot. 2021, 108, 63–73. [Google Scholar] [CrossRef] [PubMed]
- Dormann, C.F.; Bagnara, M.; Boch, S.; Hinderling, J.; Janeiro-Otero, A.; Schäfer, D.; Schall, P.; Hartig, F. Plant Species Richness Increases with Light Availability, but Not Variability, in Temperate Forests Understorey. BMC Ecol. 2020, 20, 43. [Google Scholar] [CrossRef]
- Bartels, S.F.; Chen, H.Y.H. Is Understory Plant Species Diversity Driven by Resource Quantity or Resource Heterogeneity? Ecology 2010, 91, 1931–1938. [Google Scholar] [CrossRef] [PubMed]
- Tamme, R.; Hiiesalu, I.; Laanisto, L.; Szava-Kovats, R.; Pärtel, M. Environmental Heterogeneity, Species Diversity and Co-Existence at Different Spatial Scales. J. Veg. Sci. 2010, 21, 796–801. [Google Scholar] [CrossRef]
- Zhang, H.; Jiao, X.; Zha, T.; Lv, X.; Ni, Y.; Zhang, Q.; Wang, J.; Ma, L. Developmental Dynamics and Driving Factors of Understory Vegetation: A Case Study of Three Typical Plantations in the Loess Plateau of China. Forests 2023, 14, 2353. [Google Scholar] [CrossRef]
- Smith, E. Ecological Relationships Between Overstory and Understory Vegetation in Ponderosa Pine Forests of the SouthwestKaibab Natl. For. 2011, 16. Available online: https://www.fs.usda.gov/Internet/FSE_DOCUMENTS/stelprdb5361521.pdf (accessed on 13 October 2024).
- Kern, C.C.; Montgomery, R.A.; Reich, P.B.; Strong, T.F. Harvest-Created Canopy Gaps Increase Species and Functional Trait Diversity of the Forest Ground-Layer Community. For. Sci. 2014, 60, 335–344. [Google Scholar] [CrossRef]
- Yang, H.; Pan, C.; Wu, Y.; Qing, S.; Wang, Z.; Wang, D. Response of Understory Plant Species Richness and Tree Regeneration to Thinning in Pinus Tabuliformis Plantations in Northern China. For. Ecosyst. 2023, 10, 100105. [Google Scholar] [CrossRef]
- Thomas, S.C.; Halpern, C.B.; Falk, D.A.; Liguori, D.A.; Austin, K.A. Plant diversity in managed forests: Understory responses to thinning and fertilization. Ecol. Appl. 1999, 9, 864–879. [Google Scholar] [CrossRef]
- Anderson, M.C. Light relations of terrestrial plant communities and their measurement. Biol. Rev. 1964, 39, 425–481. [Google Scholar] [CrossRef]
- Augspurger, C.K.; Salk, C.F. Understory Plants Evade Shading in a Temperate Deciduous Forest amid Climate Variability by Shifting Phenology in Synchrony with Canopy Trees. PLoS ONE 2024, 19, e0306023. [Google Scholar] [CrossRef]
- Chiang, J.-M.; Lin, K.-C.; Hwong, J.-L.; Wang, H.-C.; Lin, T.-C. Immediate Effects of Thinning with a Small Patch Clearcut on Understory Light Environments in a Cryptomeria Japonica Plantation in Central Taiwan. Taiwan J. For. Sci. 2012, 27, 319–331. [Google Scholar]
- Yu, J.; Zhang, X.; Xu, C.; Hao, M.; Choe, C.; He, H. Thinning Can Increase Shrub Diversity and Decrease Herb Diversity by Regulating Light and Soil Environments. Front. Plant Sci. 2022, 13, 948648. [Google Scholar] [CrossRef]
- Cheng, C.; Wang, Y.; Fu, X.; Xu, M.; Dai, X.; Wang, H. Thinning Effect on Understory Community and Photosynthetic Characteristics in a Subtropical Pinus Massoniana Plantation. Can. J. For. Res. 2017, 47, 1104–1115. [Google Scholar] [CrossRef]
- US Department of Commerce, N. Climate. Available online: https://www.weather.gov/wrh/climate (accessed on 10 December 2024).
- Dang, P.; Gao, Y.; Liu, J.; Yu, S.; Zhao, Z. Effects of Thinning Intensity on Understory Vegetation and Soil Microbial Communities of a Mature Chinese Pine Plantation in the Loess Plateau. Sci. Total Environ. 2018, 630, 171–180. [Google Scholar] [CrossRef] [PubMed]
- Newcomb, L. Newcomb’s Wildflower Guide, 2011th ed.; Little, Brown and Company: New York, NY, USA, 1977. [Google Scholar]
- Undersander, D.; Casler, M.; Cosgrove, D.; Martin, N.E. Identifying Pasture Grasses; University of Wisconsin—Extension: Madison, WI, USA, 1996. [Google Scholar]
- Little, E.L. National Audubon Society Field Guide to North American Trees Eastern Region, 25th ed.; Alfred A. Knopf, Inc.: New York, NY, USA, 2006. [Google Scholar]
- Gleason, H.A.; Cronquist, A. Manual of Vascular Plants of Northeastern United States and Adjacent Canada; New York Botanical Garden: Bronx, NY, USA, 1991. [Google Scholar]
- Braun, E.L.; Weishaupt, C.G. The Monocotyledoneae: Cat-Tails to Orchids; Ohio State University Press: Columbus, OH, USA, 1967. [Google Scholar]
- Holmgren, N.H. Illustrated Companion to Gleason and Cronquist’s Manual: Illustrations of the Vascular Plants of Northeastern United States and Adjacent Canada; New York Botanical Garden: Bronx, NY, USA, 1998. [Google Scholar]
- Bråkenhielm, S.; Qinghong, L. Comparison of Field Methods in Vegetation Monitoring. In Biogeochemical Monitoring in Small Catchments; Černý, J., Novák, M., Pačes, T., Wieder, R.K., Eds.; Springer: Dordrecht, The Netherlands, 1995; pp. 75–87. [Google Scholar] [CrossRef]
- Prévost, M.; Raymond, P. Effect of Gap Size, Aspect and Slope on Available Light and Soil Temperature after Patch-Selection Cutting in Yellow Birch–Conifer Stands, Quebec, Canada. For. Ecol. Manag. 2012, 274, 210–221. [Google Scholar] [CrossRef]
- Bates, D.; Maechler, M.; Bolker, B.; Walker, S. Lme4: Linear Mixed-Effects Models Using “Eigen” and S4, 2003, 1.1-35.5. Available online: https://cran.r-project.org/web/packages/lme4/index.html (accessed on 24 October 2024).
- Fox, J.; Weisberg, S.; Price, B. Car: Companion to Applied Regression, 2001, 3.1-3. Available online: https://cran.r-project.org/web/packages/car/index.html (accessed on 28 October 2024).
- Lenth, R.V. Emmeans: Estimated Marginal Means, Aka Least-Squares Means, 2017, 1.10.5. Available online: https://cran.r-project.org/web/packages/emmeans/index.html (accessed on 30 October 2024).
- Ripley, B.; Venables, B. MASS: Support Functions and Datasets for Venables and Ripley’s MASS, 2009, 7.3-61. Available online: https://cran.r-project.org/web/packages/MASS/index.html (accessed on 30 October 2024).
- Bekris, Y.; Prevéy, J.S.; Brodie, L.C.; Harrington, C.A. Effects of Variable-Density Thinning on Non-Native Understory Plants in Coniferous Forests of the Pacific Northwest. For. Ecol. Manag. 2021, 502, 119699. [Google Scholar] [CrossRef]
- Xu, X.; Wang, X.; Hu, Y.; Wang, P.; Saeed, S.; Sun, Y. Short-Term Effects of Thinning on the Development and Communities of Understory Vegetation of Chinese Fir Plantations in Southeastern China. PeerJ 2020, 8, e8536. [Google Scholar] [CrossRef] [PubMed]
- Richardson, P.J.; MacDougall, A.S.; Larson, D.W. Fine-scale Spatial Heterogeneity and Incoming Seed Diversity Additively Determine Plant Establishment. J. Ecol. 2012, 100, 939–949. [Google Scholar] [CrossRef]
- Melbourne, B.A.; Cornell, H.V.; Davies, K.F.; Dugaw, C.J.; Elmendorf, S.; Freestone, A.L.; Hall, R.J.; Harrison, S.; Hastings, A.; Holland, M.; et al. Invasion in a Heterogeneous World: Resistance, Coexistence or Hostile Takeover? Ecol. Lett. 2007, 10, 77–94. [Google Scholar] [CrossRef] [PubMed]
- Ricklefs, R.E. Environmental Heterogeneity and Plant Species Diversity: A Hypothesis. Am. Nat. 1977, 111, 376–381. [Google Scholar] [CrossRef]
- Su, X.; Zheng, G.; Chen, H.Y.H. Understory Diversity Are Driven by Resource Availability Rather than Resource Heterogeneity in Subtropical Forests. For. Ecol. Manag. 2022, 503, 119781. [Google Scholar] [CrossRef]
- Davies, K.F.; Chesson, P.; Harrison, S.; Inouye, B.D.; Melbourne, B.A.; Rice, K.J. Spatial heterogeneity explains the scale dependence of the native–exotic diversity relationship. Ecology 2005, 86, 1602–1610. [Google Scholar] [CrossRef]
- Jiménez-Alfaro, B.; Girardello, M.; Chytrý, M.; Svenning, J.-C.; Willner, W.; Gégout, J.-C.; Agrillo, E.; Campos, J.A.; Jandt, U.; Kącki, Z.; et al. History and Environment Shape Species Pools and Community Diversity in European Beech Forests. Nat. Ecol. Evol. 2018, 2, 483–490. [Google Scholar] [CrossRef] [PubMed]

| Response | Predictor | Estimate | SE | t-Value | p-Value |
|---|---|---|---|---|---|
| Shannon_Diversity | Light intensity CV | 0.008427 | 0.001803 | 4.674 | 4.28 × 10⁻⁵ *** |
| CV RFR ratio | −0.018573 | 0.004371 | −4.249 | 0.000151 *** | |
| Inverse_Simpson | Light intensity CV | 0.028664 | 0.007633 | 3.755 | 0.000629 *** |
| CV RFR ratio | −0.048381 | 0.018501 | −2.615 | 0.013072 | |
| Species_richness | Light intensity CV | 0.1017246 | 0.0138403 | 7.350 | 1.62 × 10⁻⁸ *** |
| CV RFR ratio | −0.1438746 | 0.0575613 | −2.500 | 0.017427 * | |
| Mean_Light_intensity | 0.0014541 | 0.0008904 | 1.633 | 0.111662 | |
| Evenness | Light intensity CV | −8.838 × 10⁻⁴ | 4.159 × 10⁻⁴ | −2.125 | 0.040708 * |
| Mean_Light_intensity | −6.550 × 10⁻⁵ | 1.665 × 10⁻⁵ | −3.934 | 0.000378 *** | |
| Cover proportion | Light intensity CV | 2.978 × 10⁻³ | 7.151 × 10⁻⁴ | 4.164 | 0.000202 *** |
| Mean_Light_intensity | 5.089 × 10⁻⁴ | 3.356 × 10⁻⁵ | 15.161 | <2 × 10⁻¹⁶ *** | |
| CV_pH | 1.556 × 10⁻² | 6.503 × 10⁻³ | 2.393 | 0.022389 * |
| Diversity Matrix | Predictor | Estimate | Std. Error | t Value | p-Value |
|---|---|---|---|---|---|
| Shannon Diversity | CV of light intensity | 0.003713 | 0.001726 | 2.152 | 0.0382 * |
| Simpson Diversity Index (1/D) | CV of light intensity | 0.016384 | 0.006487 | 2.526 | 0.0161 * |
| Species richness | CV of light intensity | 0.04560 | 0.01624 | 2.808 | 0.00801 ** |
| Cover proportion | CV of light intensity | −0.012557 | 0.007689 | −1.633 | 0.1112 |
Disclaimer/Publisher’s Note: The statements, opinions and data contained in all publications are solely those of the individual author(s) and contributor(s) and not of MDPI and/or the editor(s). MDPI and/or the editor(s) disclaim responsibility for any injury to people or property resulting from any ideas, methods, instructions or products referred to in the content. |
© 2025 by the authors. Licensee MDPI, Basel, Switzerland. This article is an open access article distributed under the terms and conditions of the Creative Commons Attribution (CC BY) license (https://creativecommons.org/licenses/by/4.0/).
Share and Cite
Kadawatha, A.D.; Mecaskey, J.M.; Swab, R.M.; Burns, J.H. Edge Feathering Across Forest-Meadow Ecotones Increases Light Heterogeneity and Understory Plant Diversity. Forests 2025, 16, 441. https://doi.org/10.3390/f16030441
Kadawatha AD, Mecaskey JM, Swab RM, Burns JH. Edge Feathering Across Forest-Meadow Ecotones Increases Light Heterogeneity and Understory Plant Diversity. Forests. 2025; 16(3):441. https://doi.org/10.3390/f16030441
Chicago/Turabian StyleKadawatha, Aruni D., Jessica Miller Mecaskey, Rebecca M. Swab, and Jean H. Burns. 2025. "Edge Feathering Across Forest-Meadow Ecotones Increases Light Heterogeneity and Understory Plant Diversity" Forests 16, no. 3: 441. https://doi.org/10.3390/f16030441
APA StyleKadawatha, A. D., Mecaskey, J. M., Swab, R. M., & Burns, J. H. (2025). Edge Feathering Across Forest-Meadow Ecotones Increases Light Heterogeneity and Understory Plant Diversity. Forests, 16(3), 441. https://doi.org/10.3390/f16030441