Article

Short-Term Effects of Droughts and Cold Winters on the Growth of Scots Pine at Coastal Sand Dunes around the South Baltic Sea

1
Institute of Botany and Landscape Ecology, University of Greifswald, 17487 Greifswald, Germany
2
Institute of Forestry and Engineering, Estonian University of Life Science, 51006 Tartu, Estonia
3
Department of Natural Resource Science, Thompson Rivers University, Kamloops, BC V2C 0C8, Canada
*
Author to whom correspondence should be addressed.
Forests 2022, 13(3), 477; https://doi.org/10.3390/f13030477
Submission received: 31 January 2022 / Revised: 11 March 2022 / Accepted: 16 March 2022 / Published: 18 March 2022
(This article belongs to the Special Issue Abiotic and Biotic Stress in Forest and Plantation Trees)

Abstract

:
Coastal dunes near the Baltic Sea are often stabilized by Scots pine forests and are characterized by a mild climate. These ecosystems are affected by water shortages and might be influenced by climate extremes. Considering future climate change, utilizing tree rings could help assess the role of climate extremes on coastal forest growth. We used superposed epoch analysis to study Scots pine responses to droughts and cold winters, with focus on frequency, timing, and duration. We measured ring widths (RW) and latewood blue intensity (LBI) on samples extracted from trees growing at dune ridge and bottom microsites at the south Baltic Sea. At the regional scale, we observed some similarities in tree responses to both extremes between RW and LBI within the same microsite type and region. At the local scale, RW and LBI were more frequently influenced by cold winters than droughts. RW and LBI from dune ridges were more frequently influenced by droughts than RW and LBI from dune bottoms. LBI from both microsites was more often influenced by droughts than RW. RW and LBI from both microsites were similarly often influenced by cold winters. At both scales, the response time of RW and LBI after droughts predominantly lagged by one year, while cold winters were recorded in the same year. The typical duration of growth reductions after both extremes was one year for both RW and LBI. Our study indicates that Scots pine from the Baltic Sea region is sensitive to climate extremes, especially cold winters.

1. Introduction

Across Europe, droughts and cold winters are recognized as events that influence tree growth; however, their geographical distribution, intensity, and duration differ for droughts and for cold winters (drought: [1,2,3,4,5]; cold winter: [6,7,8]). As the mean surface temperature across Europe increases, more frequent hot and fewer cold temperature extremes will occur and impact tree growth. It is predicted that the frequency, intensity, and duration of droughts will increase in the future, whereas the occurrence of cold winters will decline [9].
A growing interest is occurring in the role of extreme climate conditions, especially drought, on tree growth across different biomes [10,11]. Extreme events can be as important for tree growth as average climate conditions [12] because they can result in a sudden drop of forest productivity [13] or constitute tipping points starting the trajectory towards forest decline/dieback. Tree response to droughts differs between tree species [1,14] and geographical locations [15,16]. Additionally, specific local site characteristics (topography, soil), climate [4,5,15], biotic features such as intraspecific tree variability in size [17] and physiological traits (e.g., storage or mobility of non-structural carbohydrates [1,18] have been reported to modulate these responses. While some species display prompt but short-term growth reductions and quick recovery after drought [19,20], other species may react instantaneously but maintain reduced growth for decades [20,21], or even experience dieback and mortality (dieback: [22] and mortality: [23]). Some studies have reported that growth reductions do not always appear in the year of the drought, but may occur in the year following the extreme climate event [2,4,24].
The studies that focus on the negative effects of cold winter (defined here as exceptionally low winter temperatures) on conifer growth are not as common as drought, and are mostly restricted to high altitudes and/or latitudes, where very low temperatures in winter season occur [6,8]. Although warmer temperatures in late winter have been reported in recent decades [25], they may negatively impact tree growth, i.e., result in decrease of tree resistance to low temperatures [8,26]. In addition to single extreme climate events, the cumulative effects of successive droughts or cold winters can further amplify their impact on tree growth [5,18]. Moreover, two extreme climate events (cold winter and drought) might occur consecutively, thus synergistically reducing tree growth [27].
Scots pine (Pinus sylvestris L.) is one of the most widely distributed tree species in Europe. It mostly grows in central and northern Europe, but can be also found in southern regions, e.g., Spain [28]. Scots pine is mainly found on dry, nutrient-poor sandy soils; on more fertile sites, it is outmatched by other, more nutrient- and moisture-demanding species [28]. Although Scots pine is found on a wide range of site conditions and is generally thought to be tolerant of drought and cold winter extremes [29], there is evidence suggesting that growth of Scots pine can be reduced by climate extremes, especially droughts [2,3,4,5,20,21,30,31,32,33]. Many studies that focus on drought effects on Scots pine are in alpine settings or Mediterranean regions, where short- and long-term negative effects on radial growth have been reported (Alpine settings: [2,3,34] and Mediterranean region: [4,5,35]), including forest dieback [32]. Only a few studies provide evidence of the negative influence of drought on Scots pine in temperate, hemiboreal, and boreal forests [36,37,38,39,40]. Further, only a few studies from the central and northern part of the species distribution report cold winter as a risk for Scots pine growth [2,6,7,38,39,41,42].
Little is known about the influence of drought and cold winter on Scots pine forests on coastal sand dunes near the Baltic Sea. Baltic Sea dunes are often covered with pure Scots pine forests and are dynamic ecosystems at the spatial transition between terrestrial and marine environments [43]. Dune forests are important environments, protecting inland areas from coastal water intrusion and activation of aeolian processes, hindering the effects of salt spray, and minimizing coastal erosion and wind [44,45]. The climatic conditions at the Baltic Sea coast are generally mild, where droughts and cold winters can occur but their frequency and magnitude vary in different parts of the region [46,47]. Consequently, negative effects of climate extremes on Scots pine growth in the coastal environment might be less expected. However, the dune forests are influenced by soil water and nutrient shortages, high sand-surface temperatures, salt spray, and high winds [48,49,50]. Water of the substratum in coastal dune soils is considered one of the most important factors limiting tree growth [49,50,51]. Sandy soils have very high porosity, therefore limiting the longer-term storage capacity of water in the soils. Growing conditions can vary even within the same dune, leading to considerable microsite variability. For example, the top of the dune ridge compared to the dune bottom is much drier because of intensified water evaporation from greater wind and sun exposure, as well as water flowing down the dune [49,50,51]. This site-level complexity in growing conditions is further compounded by climate variability and extremes. Under coastal climate, winter accession is slower [38], delaying cold hardening [52,53] and consequently increasing trees’ sensitivity to sudden temperature drops [54].
Here, we study how Scots pine trees from the coastal sand dune ridge and dune bottom microsites located around the south Baltic Sea respond to historical extreme climate events. To assess tree growth responses to past extreme climate events, an approach based on the analysis of different tree-ring parameters (e.g., ring width and density) provides greater insights on the physiological responses of trees to events. We constructed microsite-based ring width (RW) and latewood blue intensity (LBI) chronologies. The objectives of our study were to use the RW and LBI datasets to: (i) investigate tree responses to two extreme climate events, i.e., growing season droughts and unusually cold winters, including the frequency (how many times growing season drought or unusually cold winter influenced the growth), timing, when the response was recorded, and duration (how long the actual growth reduction lasted) of growth responses, and (ii) examine if RW and LBI responses to events are similar, and if not, how they differ.

2. Materials and Methods

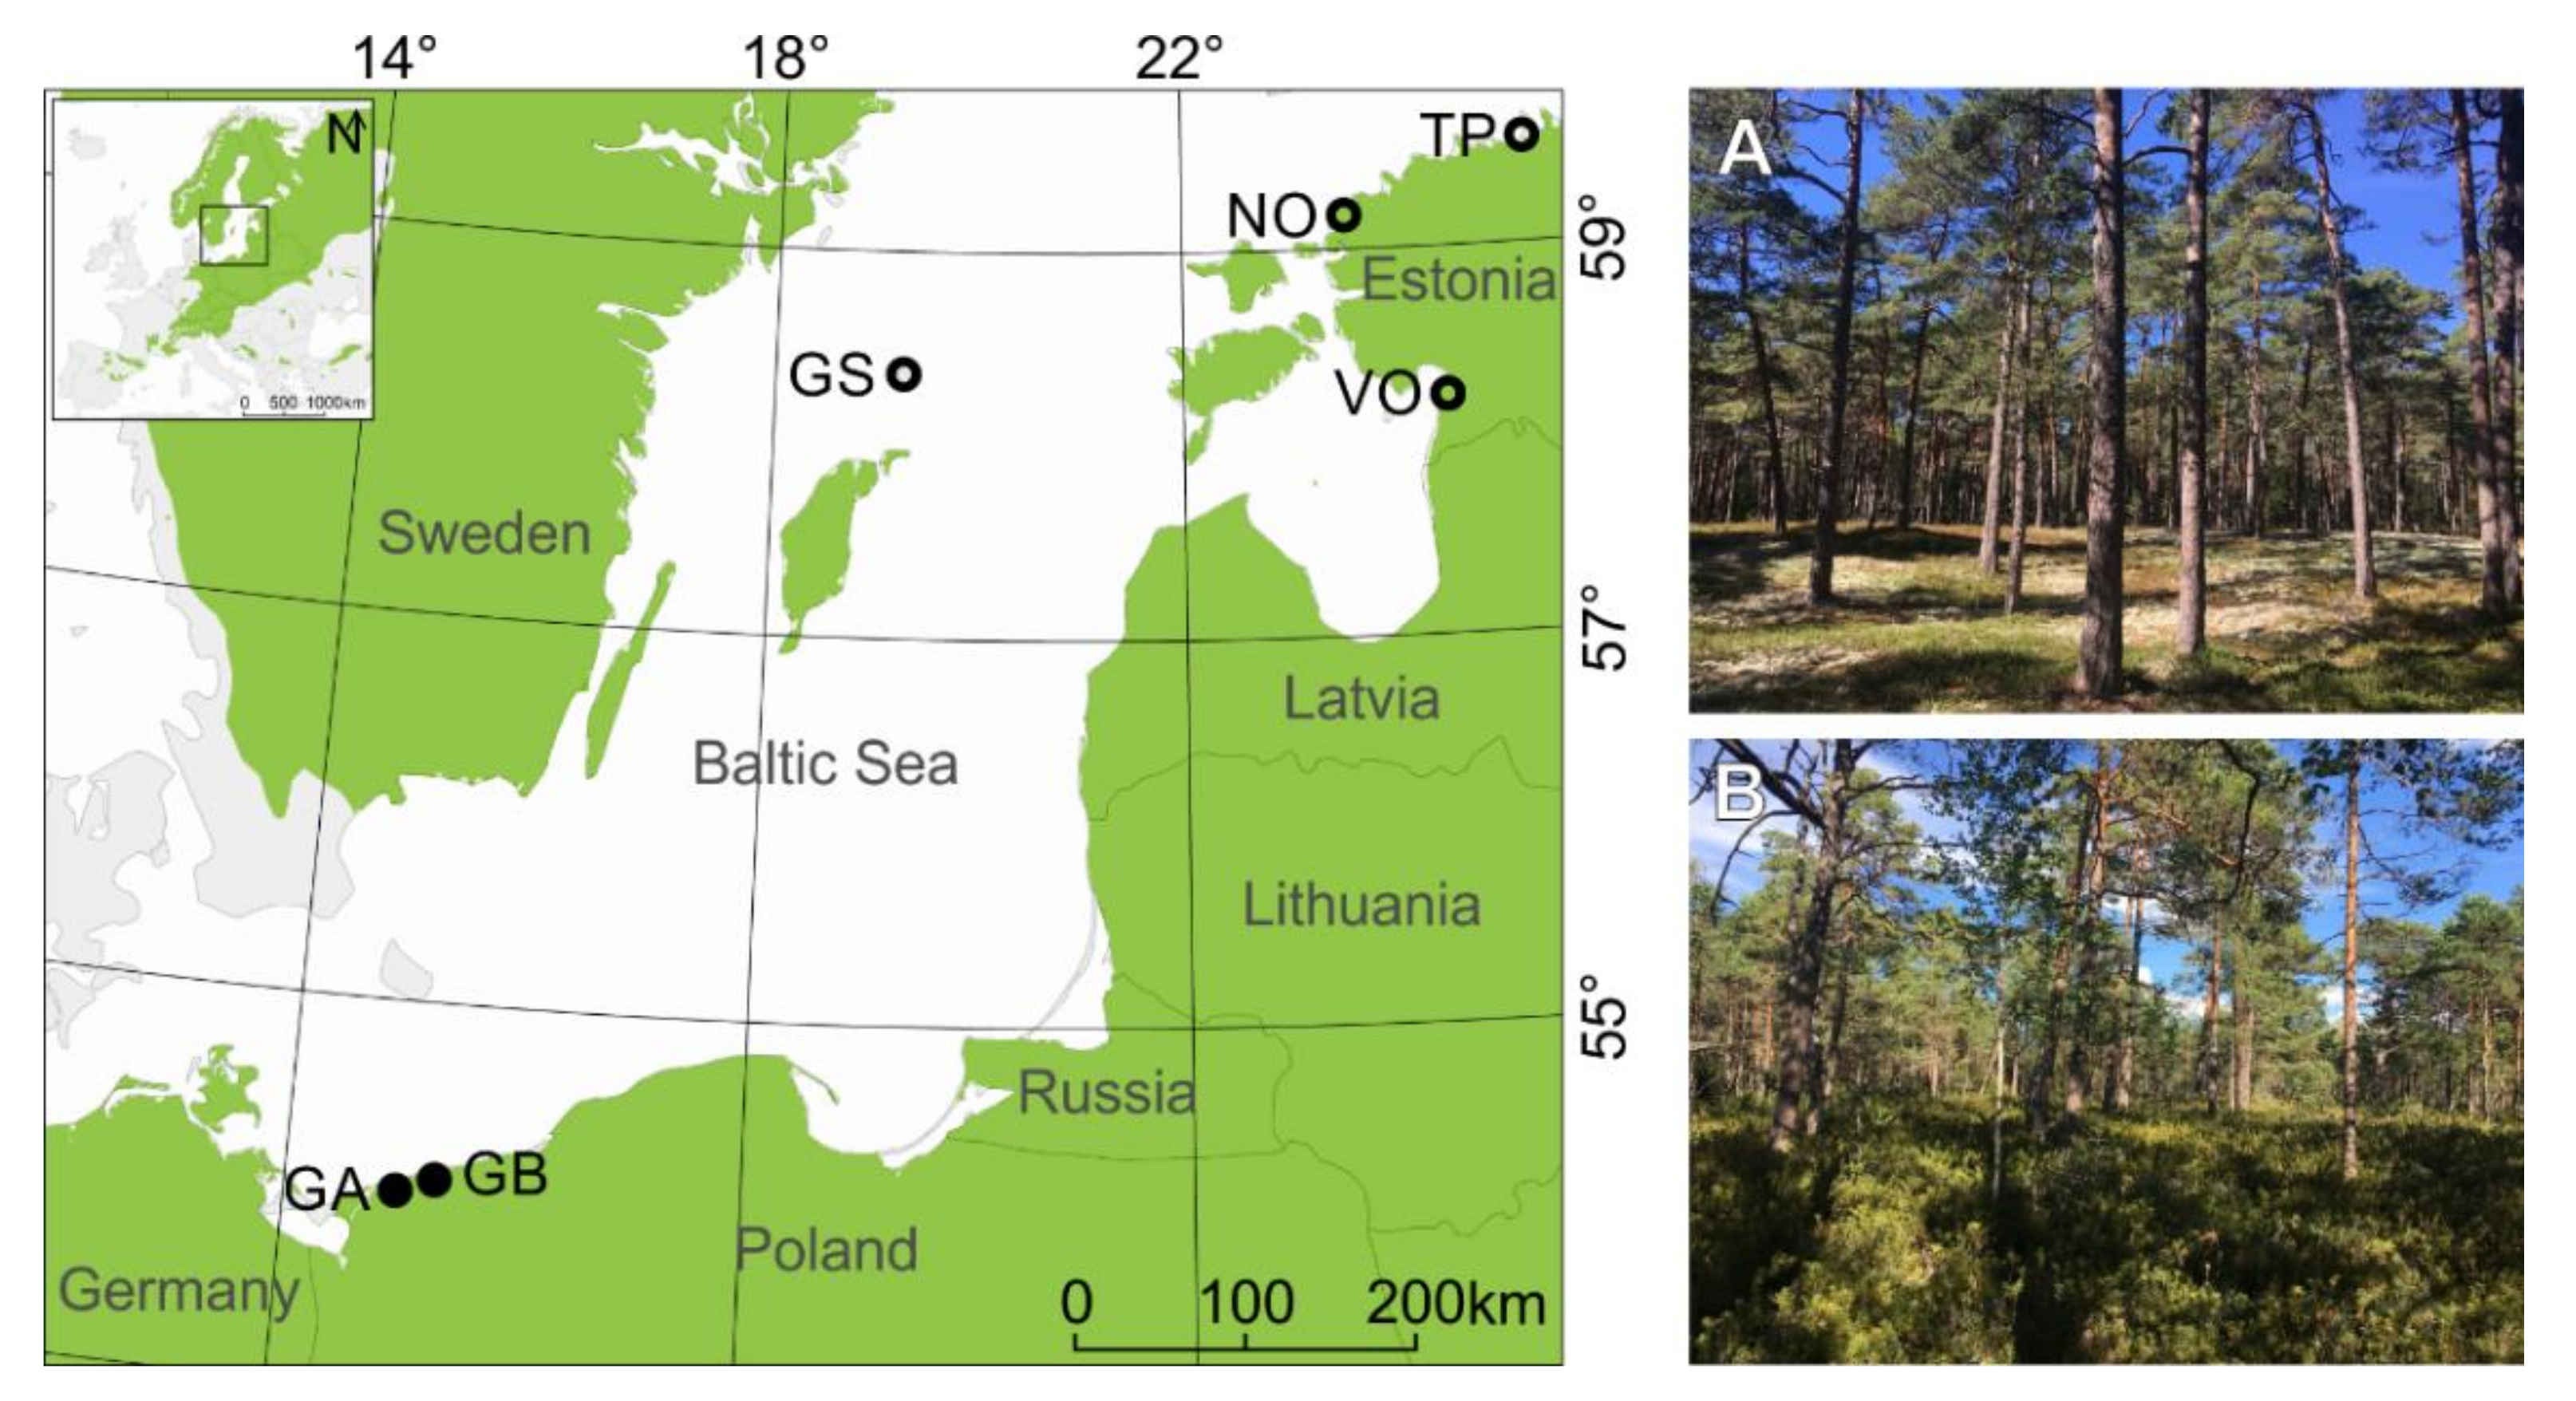
2.1. Research Area and Sampling

We selected six sampling sites from coastal dune settings (Figure 1), which have been previously used to study the climate–growth relationships using linear correlations [55]. We chose only the sites where a pronounced (>~5m) difference in relative height between dune ridge and bottom was present (this excludes one site from the Darss Peninsula, Germany, and two sites from Ustka, Poland; see Figure 1 in [55]). These six sites are located 0.2 to 2 km from the Baltic Sea coastline. Dune height and morphology vary from undulating terrain with relative height ranging from ~5 m to 10 m to typical peaked dune shapes (ridge) with the height between ~10 to 40 m a.s.l. Each site includes two contrasting microsites: (i) the dune ridge and (ii) the bottom of this dune. In total, 12 microsites from six dune sites were selected and clustered into two subregions: northern and southern (Figure 1; based on [55]). We subsampled our dataset because we wanted to concentrate on extreme climate events that most likely influence contrasting microsites differently if the microsite conditions (elevations, water, and nutrient contents) notably differ. At all sites both microsites were characterized by sandy soils but differed in ground vegetation cover (Figure 1). The microsites located at the bottom of the dunes were mainly vegetated by Calluna sp. or Vaccinium, while dune ridges were vegetated by Cladonia sp. (Table 1). All sites were managed, either in the past (GS: periodic individual tree logging, sheep grazing; TP, NO, VO: thinning and single tree removal) or more recently (GA and GB: thinning, “unplanned logging” as a consequence of natural disasters).
At each microsite, we sampled between 36 and 66 Scots pine trees, resulting in 577 individuals. From each tree, two 5 mm increment cores were extracted perpendicularly at the breast height in order to avoid compression wood occurrence [55,56]. Tree height was measured using a Vertex measuring system (Haglöf, at the sites: TP, NP, VO) or a clinometer (Suunto; at the sites: GA, GB, GS). The depth of the organic layer at 10 randomly selected places at each microsite was assessed.

2.2. Sample Preparation and Tree-Ring Measurements

All increment cores were prepared for measurements of RW [57] and LBI (inverted values of blue reflectance measured from latewood [58,59]). RW is a parameter most often used in such studies [4,20] as it is a good proxy of annual variation of tree growth [60]. By contrast, latewood minimum blue reflectance measures similar wood properties to maximum latewood density (MXD); however, it is inversely correlated with MXD. Nevertheless, both provide similar proxy estimates of relative latewood density. To ensure the detrending of MXD and blue reflectance data, an easy inversion of raw blue reflectance values has been proposed [59]. Currently, blue intensity (BI) is the term used for the inverted values of blue reflectance [61], hereafter called “LBI” for “latewood blue intensity”). Following the protocol for the LBI measurement, we placed all cores in a Soxhlet apparatus with ethanol for 48 h to remove resins and other soluble compounds [58,59,62]. Next, all cores were glued on the wooden holders and polished with progressively finer sandpaper (up to 600–800 grit) to fill lumen areas of tracheids with white wood dust. This approach ensures a flat wood surface and maximizes the contrast and visibility of ring boundaries and cell structure prior to scanning [58,59].
Digital images (2400 dpi) of all tree cores were produced with a flatbed Epson Perfection V700 scanner (Epson, Los Alamitos, CA, USA), calibrated with SilverFast Ai Studio 8.0 (LaserSoft Imaging Incorporated, Kiel, Germany) software using the IT8 Calibration Target (IT8.7/2; LaserSoft Imaging Incorporated, Kiel, Germany) printed on Kodak Professional Endura paper. RW and LBI were measured with CooRecorder v. 8.0 (Cybis Elektronik & Data AB, Saltsjöbaden, Sweden) [63]. We generated the LBI data by using the blue intensity mode [59] of the CooRecorder v. 8.0 software and the following parameters: width > 100, offset > 0.4, depth > 200 and 30% of latewood.

2.3. Cross-Dating and Chronology Building

We visually and statistically cross-dated all samples using CDendro v. 8.0 (Cybis Elektronik & Data AB, Saltsjöbaden, Sweden) [63] and COFECHA [64] software, respectively. We excluded 41 RW and 77 LBI tree-ring series from the analyses because the sample exhibited low synchronicity with other RW or LBI tree-ring series, and/or discoloration of wood surface was observed (only in the case of LBI; [59]).
After successful cross-dating, 536 RW and 484 LBI tree-ring series were detrended by applying a 30-year cubic smoothing spline with a 50% frequency cut-off using the dplR package in R [65]. This detrending option is meant to preserve annual to decadal variability in the tree-ring series while eliminating related longer-term variability (e.g., biological age trend; [66,67]). Altogether, 12 microsite-specific RW and 12 LBI chronologies were produced via division of observed simulated values in order to correct for heteroscedastic variances observed in tree-ring series [67,68] and averaged using the biweight robust mean. Descriptive statistics, including expressed population signal (EPS; [69,70]), mean inter-series correlation (Rbar), and Gleichlaeufigkeit (GLK), were calculated for each microsite chronology and both tree-ring parameters over the common 1902–2016 period (Table S1).

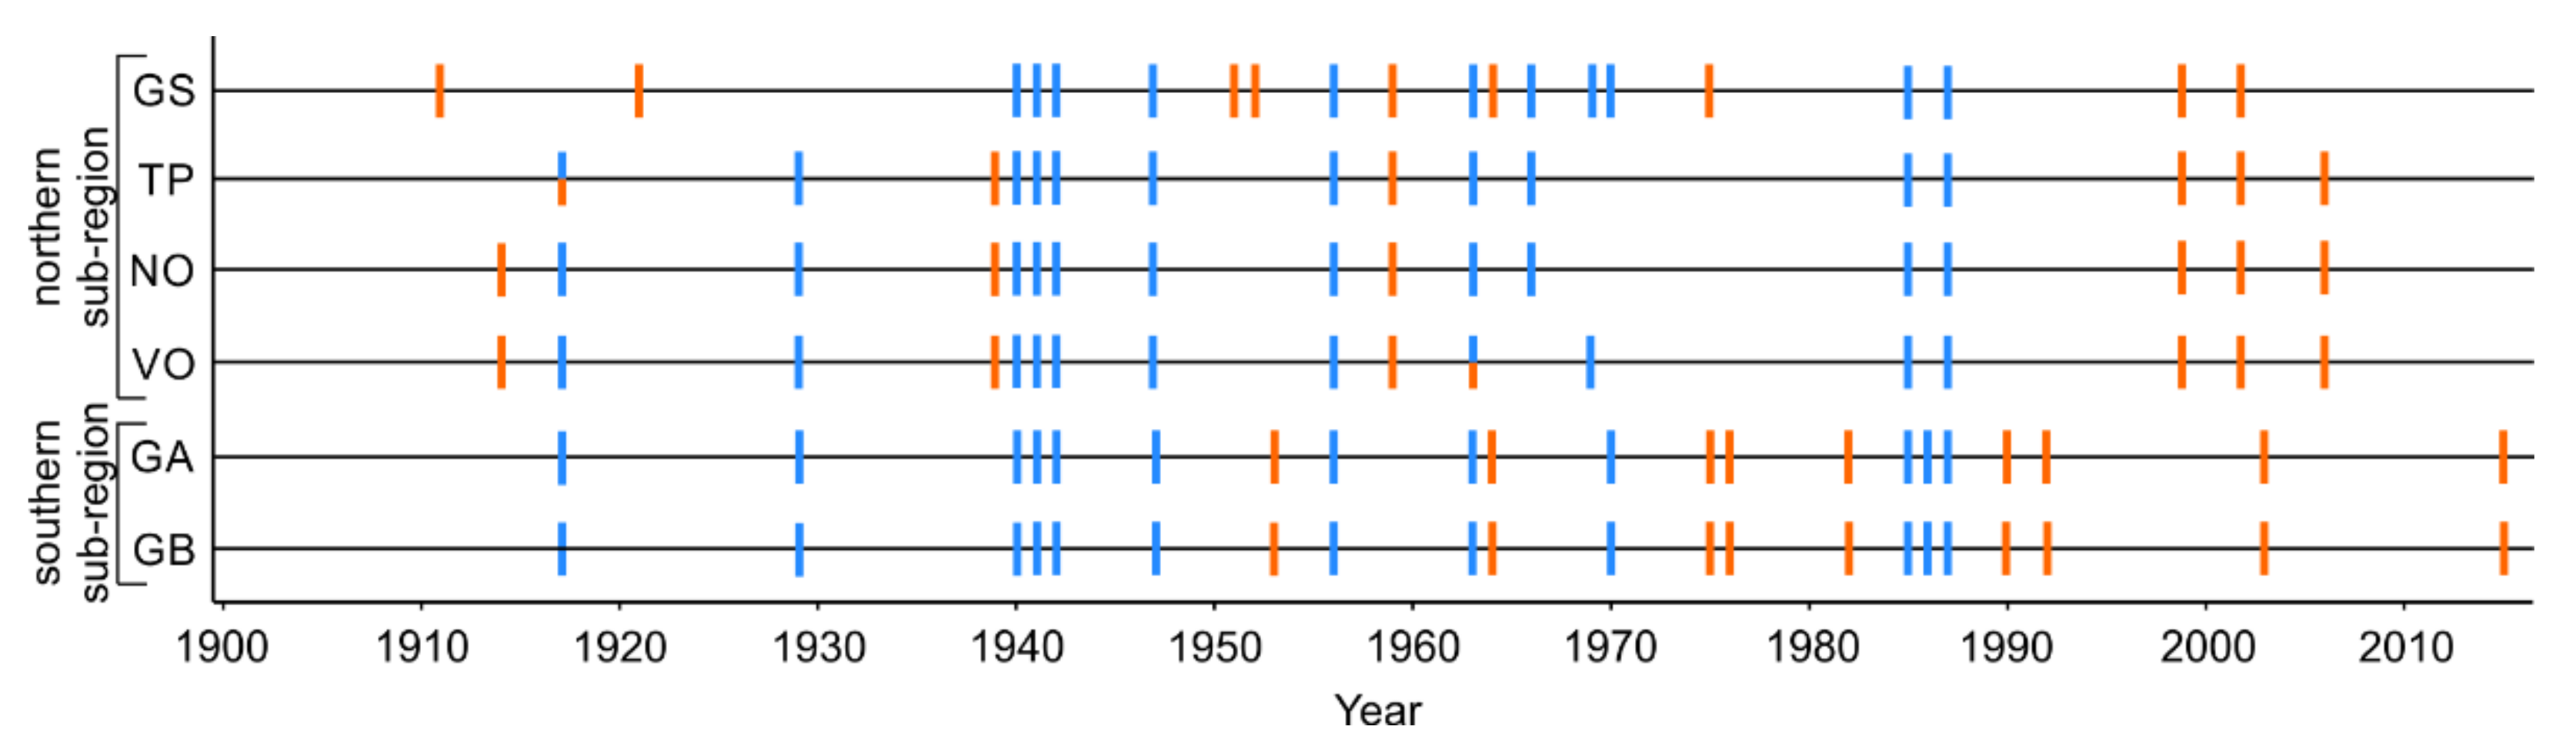
2.4. Identification of Growing Season Droughts and Unusually Cold Winters

We calculated the site-specific Standardized Precipitation Evapotranspiration Index (SPEI) in the SPEI package in R [71] in order to assess the effects of drought on Scots pine growth. The SPEI is a multiscalar index of drought intensity based on the difference between precipitation and the atmospheric evaporative demand, with more negative values indicating progressively more severe drought conditions [71]. We used SPEI for August integrated over a window of six months (March–August), thus representing a growing season across our sites. We chose the six-month SPEI timescale to reflect the low but also dynamic dune soil water content, which decreases from late winter/early spring toward summer due to the intensive drying impact of the sun and wind [49,50]. The late winter/early spring summer drought is related to the coastal regions, where a comparatively cool sea surface prevents convective rainfall formation and induces a long dry period [72]. Further, within the studied 1902–2016 interval, the growing season droughts identified based on monthly SPEI values occurred more often across our sites than, for example, spring droughts identified using SPEI integrated over March–May. We also used SPEI integrated over a window of three summer months, June–August, to investigate the effects of summer drought on Scots pine growth. However, we identified the same number of drought events as we did using SPEI6 (21 drought events), where 52% of them (11 events) were identified based on both SPEI3 (June–August) and SPEI6 (March–August). Lastly, the dry spring–summer season has been found to influence tree growth across our sites over a longer period using linear correlations [55]. Therefore, considering the above-mentioned rationale and identified drought events based on SPEI3 (June–August) and SPEI6 (March–August), only the results for SPEI6 were chosen to be presented. Here, we used a threshold of SPEI ≤ −1.5 that indicates a severe category of drought [73]. In the context of our study, hereafter we refer to growing-season drought as drought.
To determine the effects of exceptionally low winter temperatures on Scots pine growth, we identified site-specific unusually cold winters using scaled differences (only extremes with z-score ≤ −1.5) of January–March and February–March temperatures. We chose the winter–early spring season because January–February are the coldest winter months in the region. Second, little is known about the effects of cold winter episodes on Scots pine growth [2,6,7,38,39,42]. We included March in a winter season because March temperature generally remains low across our sites (mean temperature over the 1902–2016 period: between −2.7 and 2.6 °C). In the context of our study, hereafter we refer to unusually cold winter as cold winter.
To assess the relationship between droughts, cold winters, and tree-ring parameters, site-specific gridded (0.5° × 0.5°) mean monthly temperature and precipitation sums for the 1902–2016 interval were obtained from CRU TS4.03 datasets. For a site located on the Gotska Sandön Island (Figure 1), we used instrumental climate data obtained from the local climate station. In this case, instrumental data likely represent the microclimatic conditions on this small Baltic island better than the gridded dataset. A comparison between SPEI calculated based on the gridded and instrumental data from the Gotska Sandön Island revealed a small difference in the number of droughts with SPEI ≤ −1.5 over a common interval (comparison not presented). For other sites, the available instrumental data varies in length (shortest series for GA and GB: 1950–2000) and for some sites is not complete (TP, NO, VO), which would have restricted our interval for analysis to 50 years.

2.5. Assessing Scots Pine Responses to Growing Season Droughts and Unusually Cold Winters

We used superposed epoch analyses (SEA) to examine the frequency, timing, and duration of Scots pine growth reductions due to droughts and cold winters. The SEA is a nonparametric randomization technique used to test the probability that the responses of tree growth to certain extreme climate events differ from random [74]. The SEA is based on the comparison of mean values of tree-ring variables in superposed years with the occurrence of extreme events with mean values of tree-ring variables in a few superposed years preceding and/or following the event. First, we identified site-specific droughts and cold winters across our sites (see section Identification of Growing Season Droughts and Unusually Cold Winters and Figure 2). Second, to assess the effect of prior growth and climate on growth reductions, we applied a “two-way approach”, where SEA was performed:
1.
At the subregional scale, where we divided microsite-specific chronologies into two subregions (based on [55]): northern and southern. Both subregions were represented by dune ridge and dune bottom microsites. In turn, for each tree-ring parameter, we obtained four datasets of microsite-specific subregional chronologies:
  • Dune ridge from the northern subregion (GSR, TPR, NOR, VOR; hereafter called ridge-north);
  • Dune bottom from the northern subregion (GSB, TPB, NOB, VOB; hereafter called bottom-north);
  • Dune ridge from the southern subregion (GAR, GBR; hereafter called ridge-south);
  • Dune bottom from the southern subregion (GAB, GBB; hereafter called bottom-south).
Next, the SEA was calculated for the northern and southern subregional drought and cold winter events (Figure 2) for the ridge-north, bottom-north, ridge-south, and bottom-south RW and LBI datasets. Three years before and three years after the climate event [4] were considered in the SEA (“classical way”, where event years are superposed; [74]).
2.
At a local scale, where the SEA was calculated for each single microsite-specific RW and LBI chronologies. Again, three years before and three years after the climate event were considered. In the case of the local-scale SEA, we did not superpose individual years of extreme events but rather analyzed the deviation of growth in each extreme year from the mean of consecutive and following years. By adopting this approach, we highlighted the intensity of each extreme event and tested for its significance.
This “two-way approach” allowed us to examine both the regional (first approach) and local (second approach) responses of Scots pine growth to both climate extremes. Lastly, a bootstrap resampling method was employed in both SEA approaches to randomly select 1000 sets of seven years for each RW and LBI microsite-specific subregional dataset (first approach) and each RW and LBI microsite-specific chronology (second approach) and estimate confidence intervals (p < 0.05). We used standard RW and LBI chronologies, where autocorrelation was retained. LBI is usually indexed using residuals in order to avoid heteroscedastic variance; however, here we used ratios for LBI because we found evidence of heteroscedasticity in the raw measurements. The SEA analysis was performed using dplR package in R [65].

3. Results

3.1. Extreme Climate Events Dataset and Quality of Tree-Ring Series

Over the 1902–2016 interval, 21 growing season droughts and 14 cold winters were identified across the study area (Figure 2 and Figure S1). Across sites, the number of drought and cold winter events ranged from six (TP) to nine (GS, GA, GB) and from 11 (GS, TP, NO, VO) to 12 (GS, GB), respectively. More than half of the cold winter events coincided at all sites, whereas drought events were more region- and site-specific. Although we identified growing season drought in 2015 in the southern subregion, it was not considered for further analysis because our tree-ring series end in 2016 and three years of growth following the event was required for the SEA.
We identified a strong common signal in detrended tree-ring series, with high values of EPS, GLK, and moderate values of Rbar (Table S1). The mean GLK for all microsites was well above the 0.6 threshold. The EPS indicated a very high internal signal strength (EPS > 0.9), and Rbar ranged from 0.31 to 0.45 (Table S1).

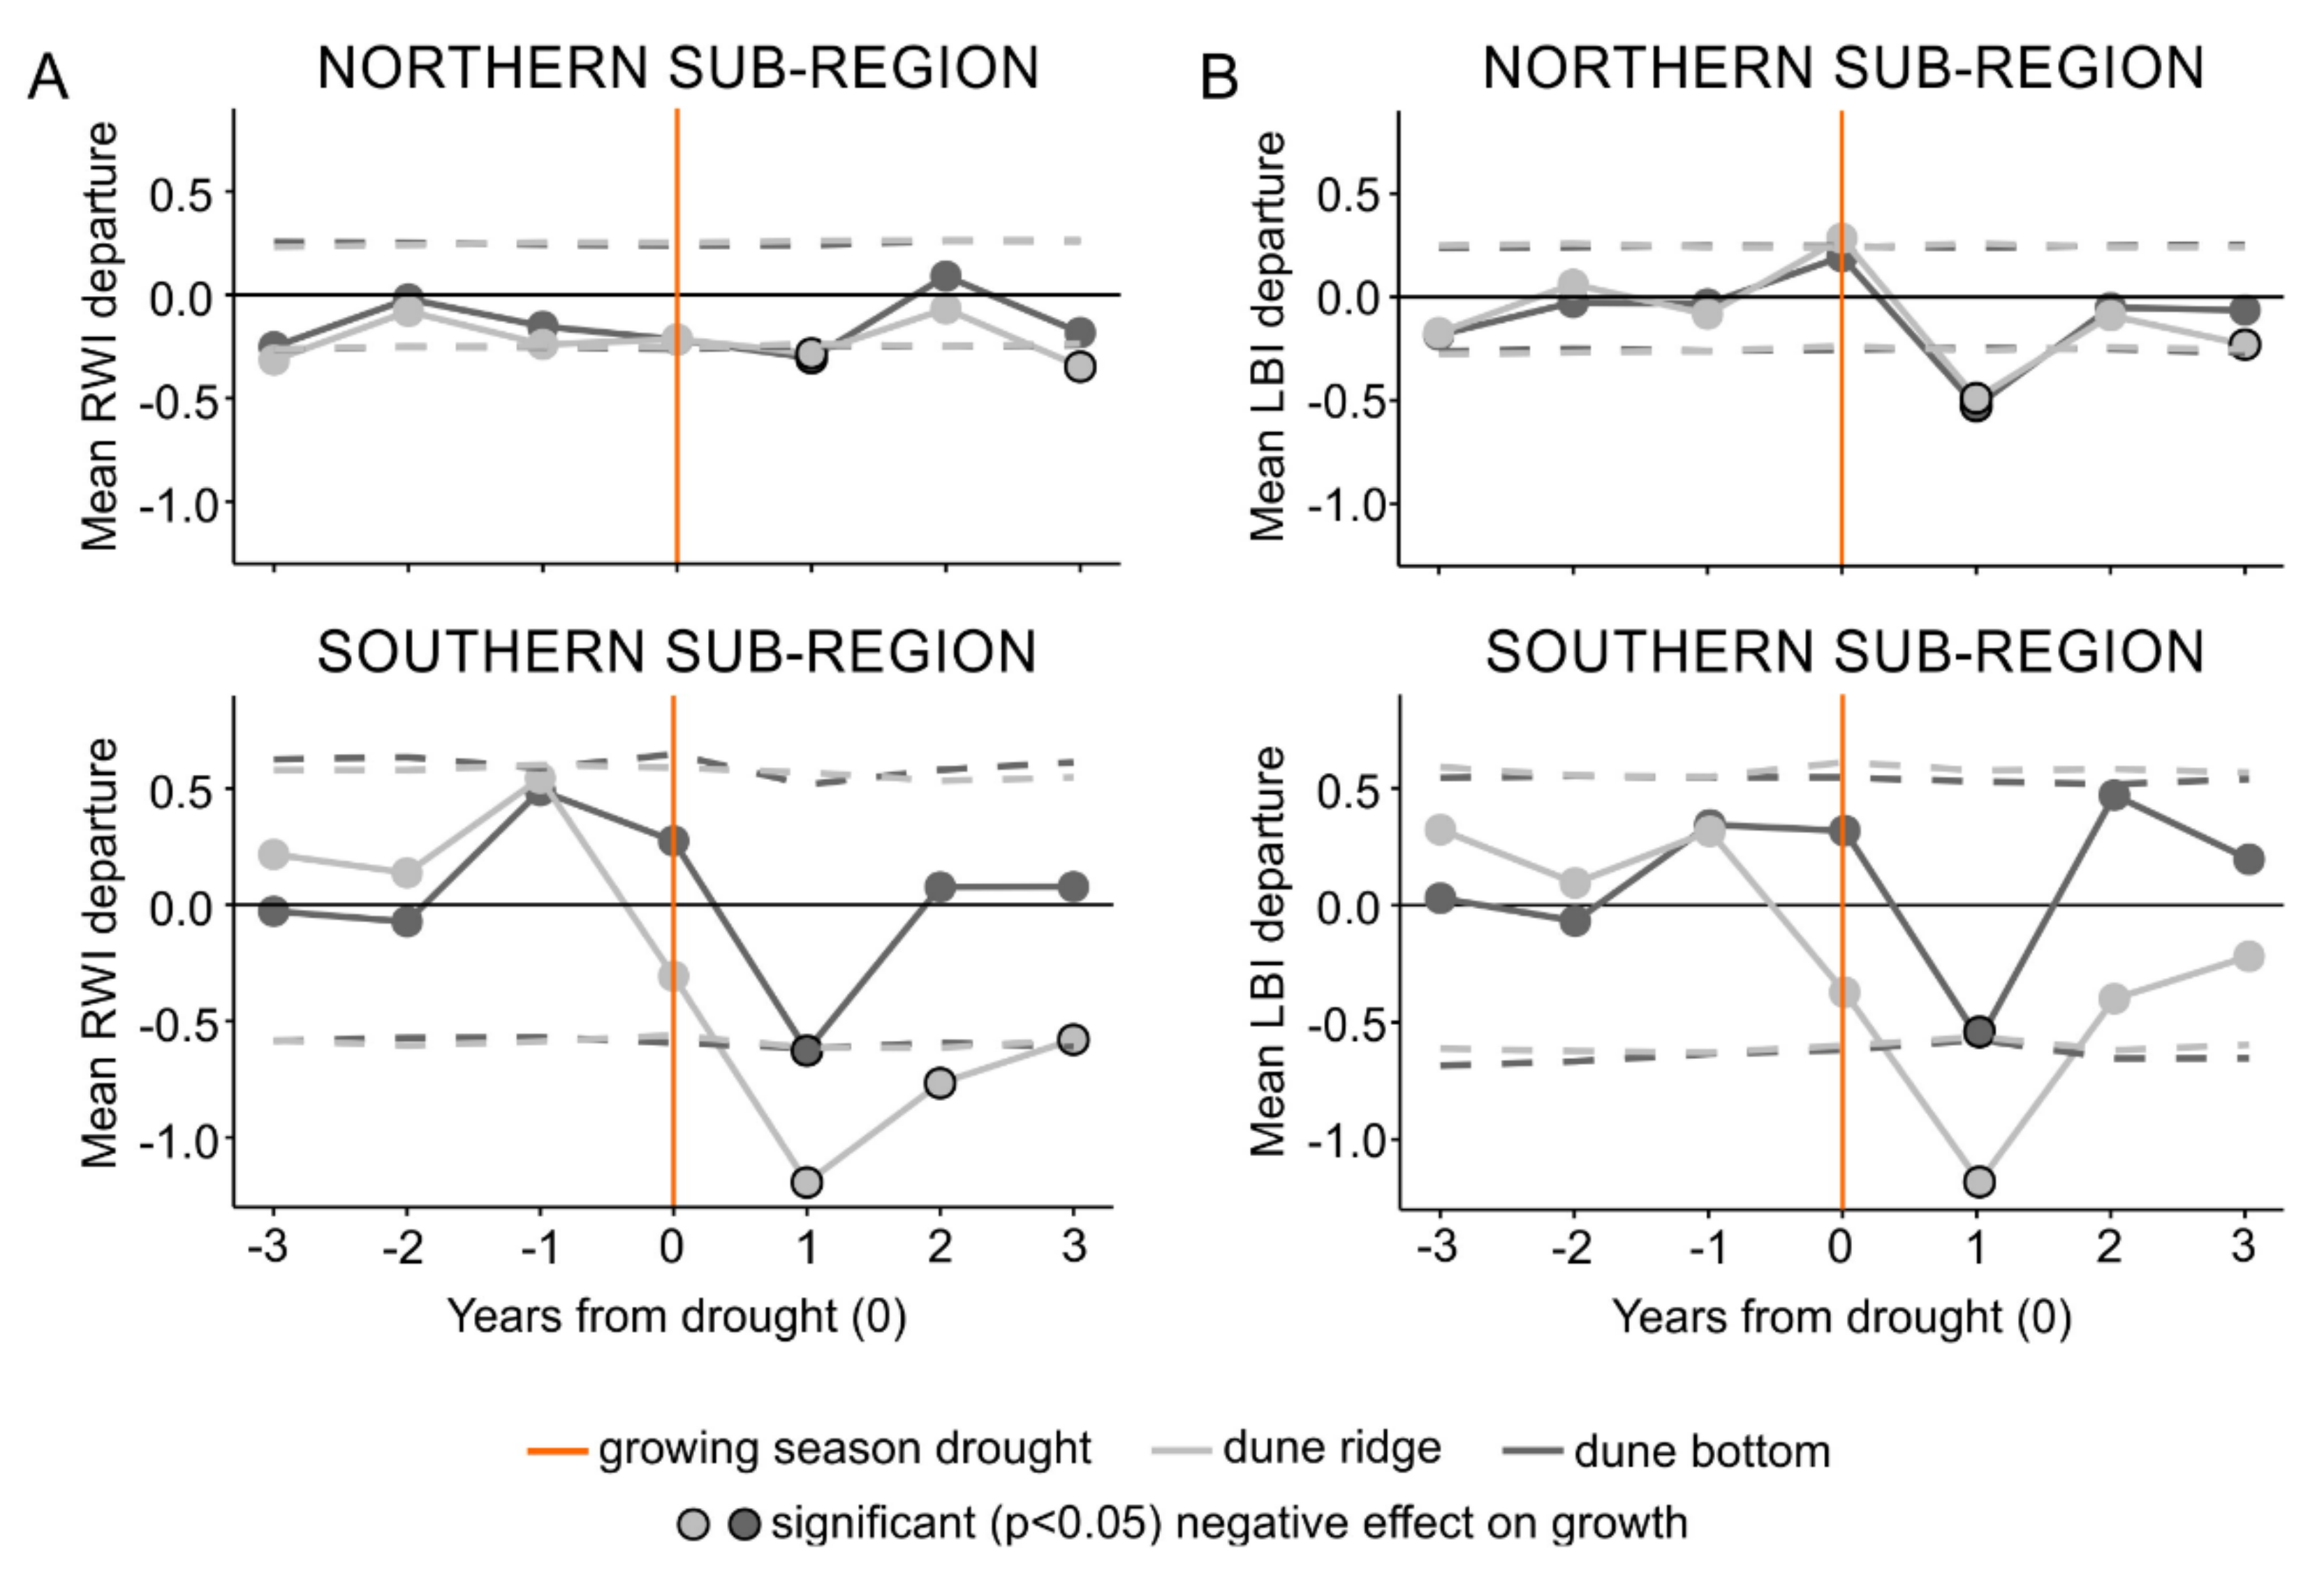
3.2. Ring Width and Latewood Blue Intensity Responses to Growing Season Droughts

The SEA performed on the subregional level (first approach), identified statistically significant relationships (p < 0.05) between droughts and both RW and LBI tree-ring parameters from both types of microsites and both subregions (Figure 3). The SEA indicated that the timing of negative growth responses due to droughts lagged by one year in both tree-ring parameters from both subregions regardless of the microsite type (Figure 3). Further, the SEA revealed that the duration of RW and LBI reductions was more complex. In the northern subregion, RW and LBI registered one-year lasting growth reduction; however, at the dune ridge we also observed a one-year response registered three years after an event. In the southern subregion, RW registered three-year (dune ridge) and one-year (dune bottom) lasting growth reduction, while LBI registered one-year growth reduction at both microsites (Figure 3).
The SEA conducted for each single microsite and drought event (second approach) revealed that seven out of 12 RW and 10 out of 12 LBI chronologies showed significant growth reductions as a result of one or several drought event(s) (Figure 4 and Figure 6; Table S2). Further, regardless of the microsite type, the SEA revealed that RW and LBI from the northern and southern subregions were similarly often influenced by droughts; however, LBI was more often influenced than RW (north RW: 6 vs. south RW: 4; Figure 4 and north LBI: 13 vs. south LBI: 9; Figure 6). Regardless of the subregion, the frequency of RW and LBI reductions was two times higher at the dune ridge compared to the dune bottom (RW: 7 vs. 3; Figure 4 and LBI: 15 vs. 7; Figure 6). Therefore, LBI from both types of microsites was more than twice as often influenced by droughts as RW (LBI: 22; Figure 6 vs. RW: 10; Figure 4). In both tree-ring parameters and microsites, the timing of significant growth reductions predominantly lagged by one year after drought events, while the duration of growth reductions lasted usually one year. Exceptionally, we also observed RW and LBI growth reductions that persisted for two or three years (RW: TPB, VOR; Figure 4 and LBI: VOR, GBR; Figure 6).
At some sites and for certain drought events, we observed the synchronized timing (RW: TP, VO; Figure 4 and LBI: TP, NO, VO, GA; Figure 6) and the same duration (only LBI: TP, NO, GA; Figure 6) of growth reductions between dune ridge and bottom microsites within a site. We also observed the synchronized timing (TPR, TPB, NOR, VOR, VOB, GAR, GBR) and the same duration (TPR, NOR, VOR, VOB, GAR, GBR) of RW and LBI reductions at the same microsite type (i.e., RW vs. LBI from dune ridge and RW vs. LBI from dune bottom; Figure 4 and Figure 6; Table S2).

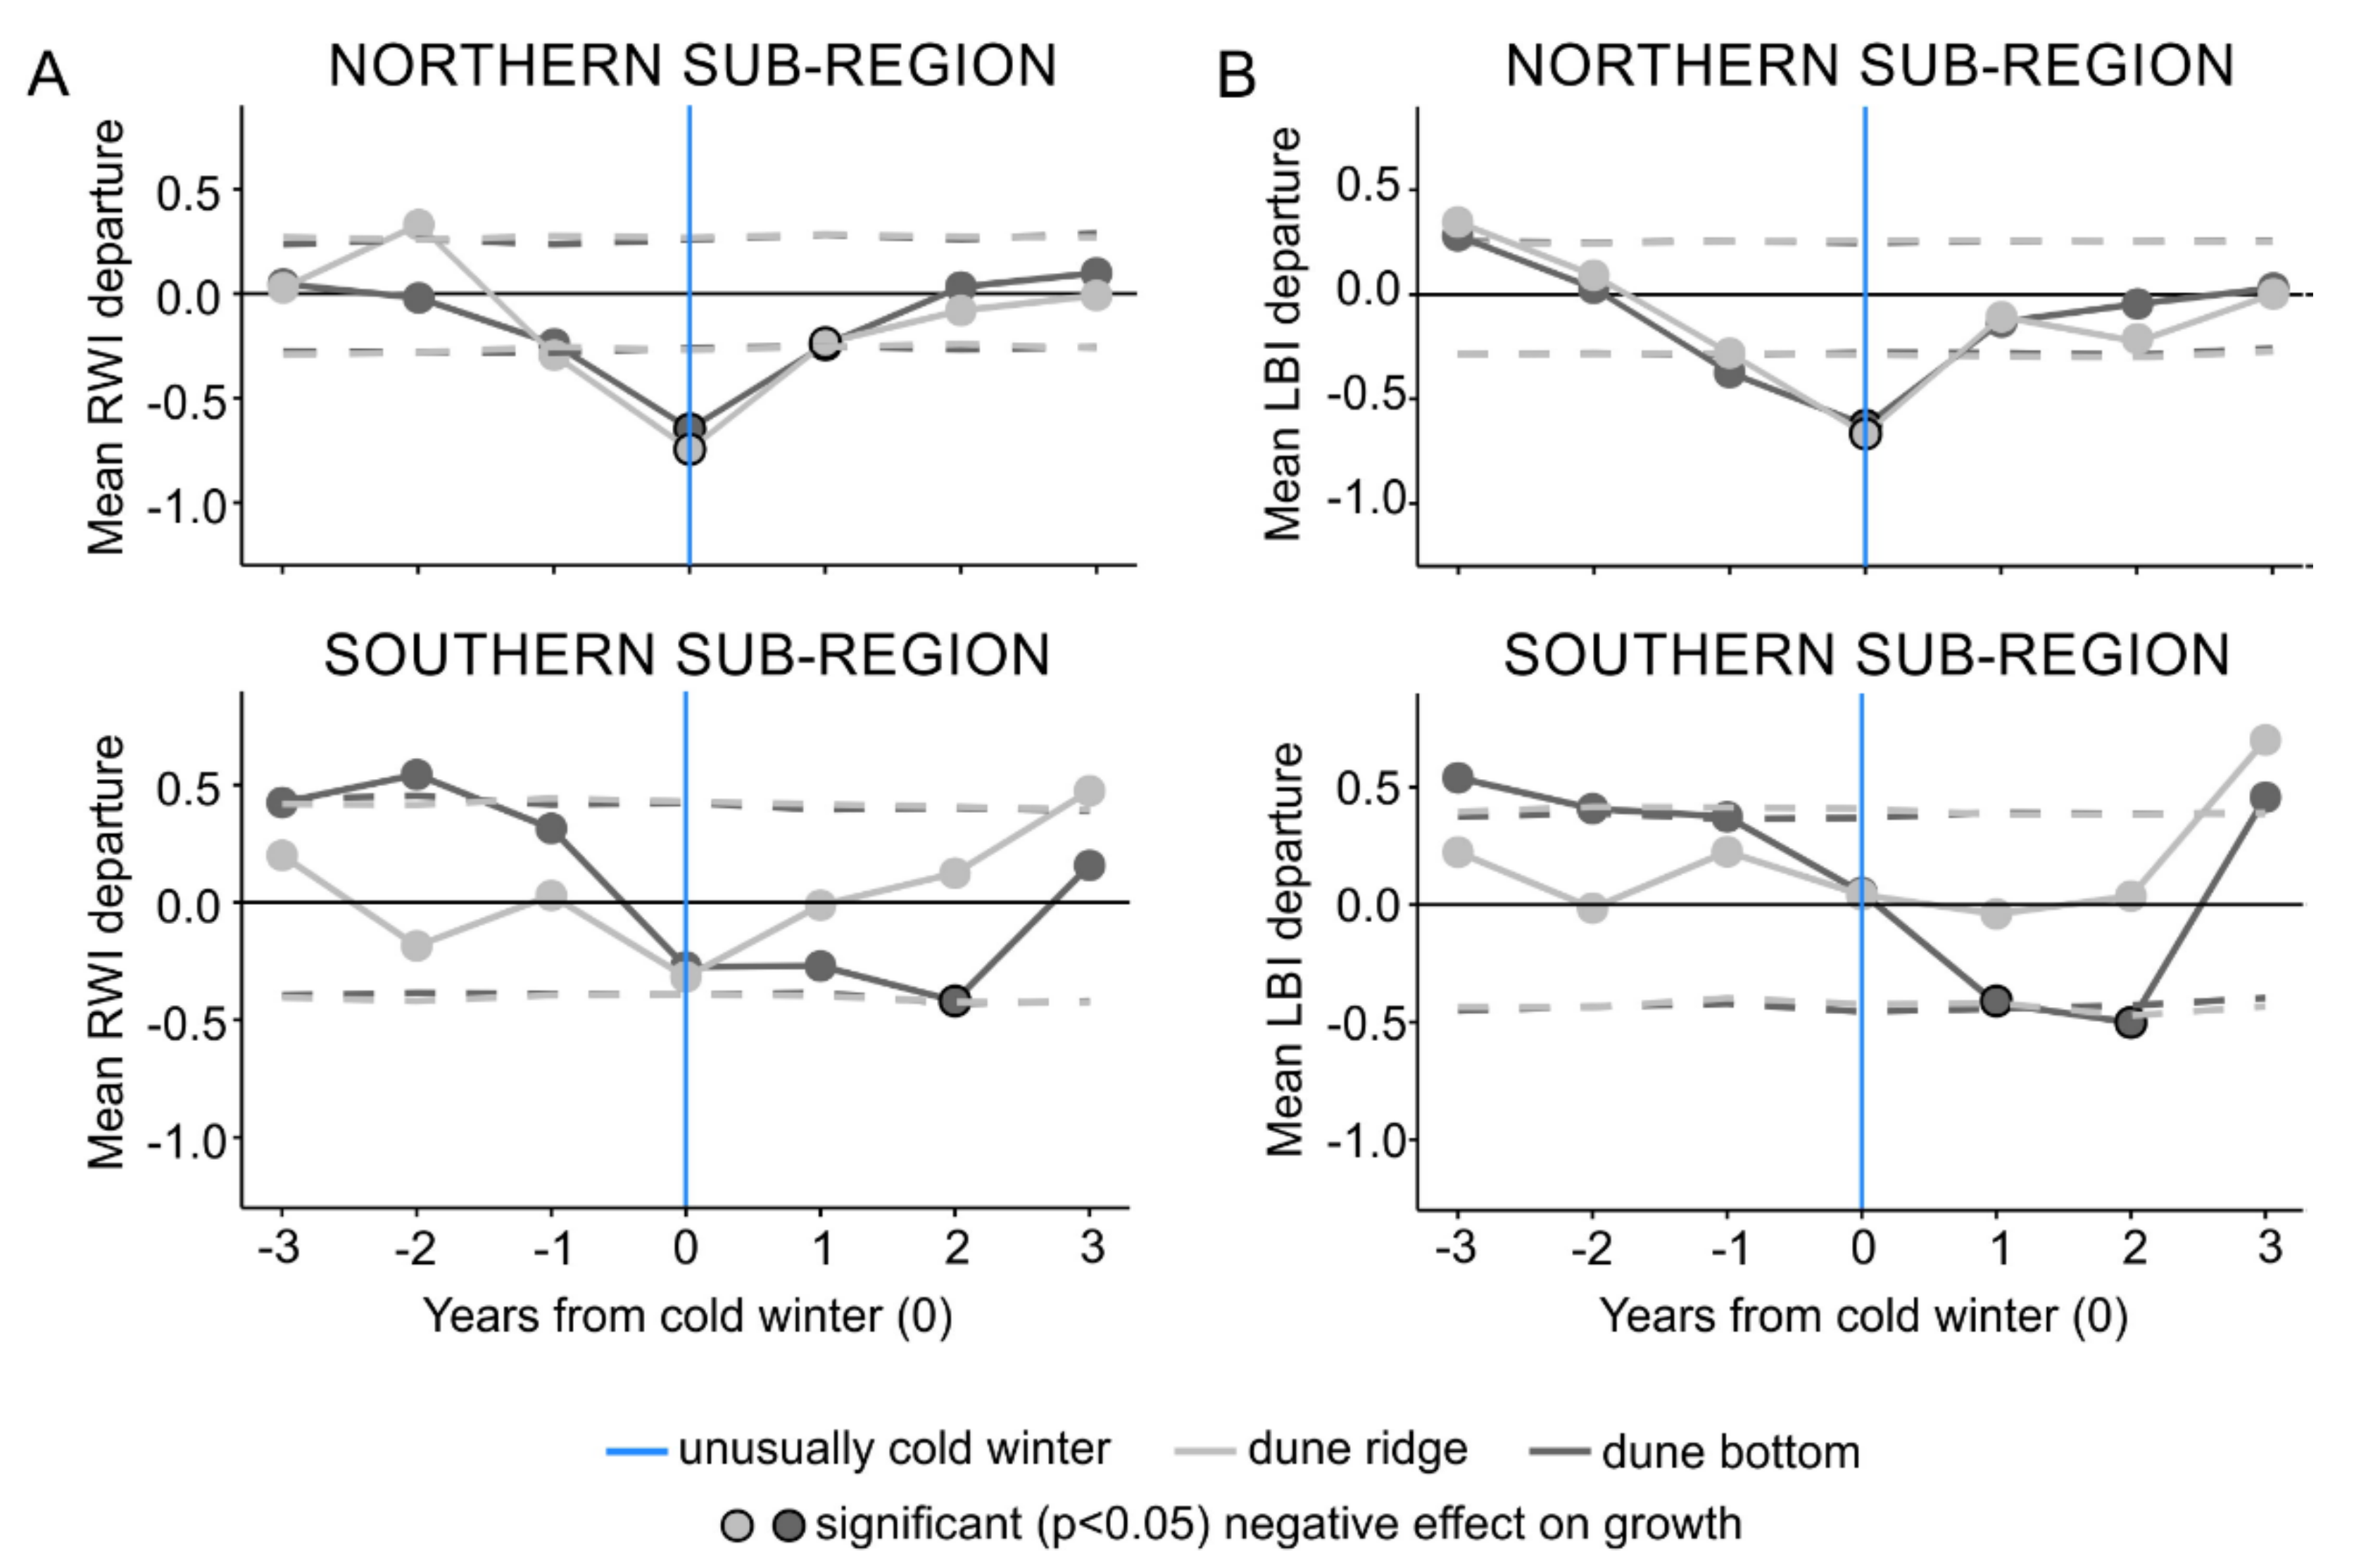
3.3. Ring Width and Latewood Blue Intensity Responses to Unusually Cold Winters

The SEA performed on the subregional level (first approach), identified statistically significant relationships (p < 0.05) between cold winters and both RW and LBI tree-ring parameters (Figure 5). For both RW and LBI, SEA revealed that in the northern subregion, both the dune ridge and bottom microsites were affected by cold winters, while in the southern subregion only the dune bottom microsite (Figure 5) was affected. The SEA indicated that the timing of growth reductions in the northern subregion was recorded in the year of the event in both tree-ring parameters and both microsite types. In the southern subregion, the timing of growth reductions was more variable and differed between tree-ring parameters. Namely, RW and LBI from the dune bottom registered growth reduction that lagged by one year for LBI and two years for RW (Figure 5). Further, the SEA revealed that the duration of RW and LBI reductions was more complex. In the northern subregion, at both the dune ridge and bottom microsites, RW reductions persisted for two years, while LBI reductions persisted for one year. In the southern subregion, the SEA did not reveal any growth reductions in RW or LBI from the dune ridge as a result of cold winters, while at the dune bottom, the RW and LBI reductions persisted for one and two year(s), respectively (Figure 5).
The SEA conducted for each single microsite and cold winter event (second approach) revealed that 11 out of 12 RW and all 12 LBI chronologies showed significant growth reductions as a result of one or several cold winter event(s) (Figure 4 and Figure 6; Table S3). Further, regardless of the microsite type, the SEA revealed that RW and LBI from the northern subregion was more often influenced by cold winter than the same tree-ring parameters from the southern subregion (north RW: 19 vs south RW: 6; Figure 4 and north LBI: 20 vs. south LBI: 7; Figure 6). Regardless of the subregion, the frequency of RW and LBI reductions was slightly higher at the dune ridge compared to the dune bottom (RW: 14 vs. 11; Figure 4 and LBI: 14 vs. 13; Figure 6). Therefore, LBI from both types of microsites exhibited a slightly greater sensitivity to cold winters compared to RW (LBI: 27; Figure 6 vs. RW: 25; Figure 4). In both tree-ring parameters and microsites, the timing of growth reductions was predominantly recorded in the year of the event, while the duration of growth reductions lasted usually about one year (Figure 4 and Figure 6; Table S3). We also observed RW and LBI growth reductions that persisted for two, three, or even four years (RW: GSR, GSB, TPB, VOR, VOB, GAB; Figure 4 and LBI: GSR, VOR, GAR, GAB, GBR, GBB; Figure 6).
At some sites and for certain cold winter events, we observed the synchronized timing (RW: GS, TP, VO, GA, GB; Figure 4 and LBI: GS, TP, NO, VO, GA, GB; Figure 6) and duration (RW: GA, GB; Figure 4 and LBI: TP, NO, VO, GA; Figure 6) of growth reductions between dune ridge and bottom microsites within a site. We also observed the synchronized timing (GSR, GSB, TPR, TPB, NOR, VOR, VOB, GBB) and duration (TPR, TPB, NOR, VOR, VOB, GBB) between RW and LBI reductions at the same microsite type (i.e., RW vs. LBI from the dune ridge and RW vs. LBI from the dune bottom; Figure 4 and Figure 6).

4. Discussion

In the light of current and future changes in the frequency and magnitude of climate extremes that exacerbate forest growth across different biomes, we established a regional network of Scots pine tree-ring chronologies to disentangle the effects of climate extremes on tree growth. Our study documents variability in the effects of growing season droughts and unusually cold winters on RW and LBI parameters of trees growing at the coastal dune ridge and bottom microsites around the south Baltic Sea.

4.1. Scots Pine Growth Responses to Growing Season Droughts

The growth of Scots pine is generally thought to exhibit a low sensitivity to drought [29]. However, our findings provide evidence that growth (RW and LBI; Figure 3, Figure 4 and Figure 6) of Scots pine trees from dune sites is negatively affected by growing season droughts in both the northern and southern subregions, though the effect is moderate. Therefore, our results contribute to a growing number of studies reporting a negative impact of drought on Scots pine radial growth at different sites across the species distribution [2,3,4,5,20,31,36,38,39,75,76].
In our study, we found that drought has a greater influence on Scots pine LBI than RW as indicated by the higher number of significant growth reductions identified by the SEA (Figure 4 for RW and Figure 6 for LBI). Previous studies indicated that under strong water deficit, trees may adapt to regulate cambial activity, resulting in a reduction of cambial division and cell wall thickening, thus potentially leading to LBI reductions [1,31,33]. Experimental research in the Swiss Alps on Scots pine by [1] provides additional support for this rationale, proposing that trees from the control (non-irrigated) site under natural drought stress invest more carbon to build larger cells but their number and cell wall thickness are significantly reduced, resulting in a reduction of ring width and wood density. Similarly, [77] observed significant reductions in the number of cells (narrower tree ring) in the trees from the control (non-irrigated) site compared to the irrigated site. However, [77] in the control (non-irrigated) trees observed significantly larger cells only in earlywood but not in latewood. Both [77] and [1] suggested that this strategy might enable trees to conduct more water if available, but could indicate a reduction in the bending strength of the water-conducting cells and therefore a negative effect on the resistance to drought-induced cavitation. These physiological adaptations to moisture-limited environments could also explain RW and LBI reductions observed across our sites; however, this does not unambiguously explain greater LBI than RW reductions.
In this study, the absence of significant growth responses after certain events might generally indicate that the identified droughts were not strong enough to influence RW and/or LBI. However, an alternative hypothesis for absent responses in LBI could be a negative sap pressure that occurs under drought and results in tracheids with thicker cell walls (higher wood density; [78,79]). Smaller tracheids have less efficient water conductance because hydraulic conductivity is decreased by the power of four with reduced lumen diameter (Hagen Poiseuille law; according to [80]). A final hypothesis for these cases of weak or absent responses could be that even though the droughts were extreme, with SPEI close to or ≤ −2 (e.g., 1999 and 2006 at the TP site; 2002 at the NO and VO sites; 2003 at the GA site; 1951, 1952, and 1959 at the GS site; Figure S1), the drop in growth rate could have been buffered by a mobilization of stored carbohydrates [81]. This could also explain lagged timing (~1 year) of RW and LBI responses to drought that we observed across our microsites (Figure 4 and Figure 6). Lagged timing has also been reported for the Mediterranean pine species (Pinus pinea L., Pinus halapensis Mill.) from dry regions [4,5], Scots pine at experimental sites [77], several different broadleaf and coniferous species from the Swiss network of strict forest reserves [2,3], and four different deciduous tree species (Fagus sylvatica L., Quercus robur L., Acer pseudoplatanus L. Carpinus betulus L.) from northeast Germany [24]. The authors [24] suggest that sufficient soil water recharge during autumn and winter before the drought event occurs may have a positive impact on tree growth in the dry year, but depleted soil moisture reserves may amplify growth reduction one year after the drought event. Across our sites, some of the drought events might have occurred after most of the wood formation was completed, resulting in a more prominent response in the year after the drought event [24]. However, soil moisture during summer and autumn was probably too low to allow trees to produce sufficient amounts of non-structural carbohydrates (NSC) as storage compounds. Thus, incomplete soil water recharge at the end of the dry year might have resulted in lack of spring soil moisture availability next year, and together with too low NSC might have led to lagged responses observed across our sites. Similarly, [82] assessed the seasonal origins of water in soils and three different tree species (Fagus sylvatica L., Quercus robur L., and Picea abies (L.) Karst.) across 182 Swiss forest sites, and concluded that beech and oak mostly used winter precipitation, whereas spruce used water of more diverse seasonal origins to mitigate their vulnerability to summer drought.

4.2. Microsite Differences in Scots Pine Growth Responses to Growing Season Droughts

RW and LBI from the dune ridge were more often impacted by droughts compared to the same tree-ring parameters from the dune bottom (Figure 4 and Figure 6). This may have resulted from physical and chemical features of coastal dunes [49,50,51], where frequent water deficits, together with nutrient shortages, cause functional plant stress [49,83]. Due to water drainage from the dune top towards the bottom, the more pronounced lack of groundwater might be expected at the dune ridge compared to the dune bottom. Similar findings have been reported for xeric and mesic microsites and different conifers [74,84,85], including Scots pine at the southern range of its species distribution [4,5] and in the Alps [34,86]. These studies reported higher susceptibility of conifers to drought at xeric compared to mesic sites because lower water availability at xeric sites strongly constrains the main physiological vegetation processes (growth and nitrogen use). The authors of [87] studied pedunculated oak (Quercus robur L.) growing in the floodplain of the Czech section of the Elbe River. They found that after drought, the trees growing at a reference site situated outside the flood area registered strong growth reduction in contrast to the trees growing at the river bank, where no growth reduction was registered. They concluded that the groundwater table (high at the river bank and low at the reference site) had a direct effect in modulating the responses observed between the sites.
In our study, apart from tree growth reductions, we recorded differences in the forest understory vegetation and humus depth (Table 1). Forest understory vegetation at our sites (Table 1) confirms that the dune-ridge microsites experience more intensive soil-water shortages compared to the bottom microsites, and therefore only little water-demanding vegetation is able to develop at the dune ridges. By contrast, at the bottom microsites a sufficient layer of understory vegetation acts as an insulation and can help retain soil moisture from evaporation during extended dry periods. Thus, we postulate that drought could have influenced Scots pine cambial activity more at the dune ridge, resulting in microsite-specific differences in RW and LBI reductions as we also described above.
We also observed longer (three years) microsite-specific RW and LBI reductions; however, this was recorded at only one dune-ridge (VOR) microsite (Figure 4 for RW, Figure 6 for LBI). Several authors [74,88,89] suggested that prolonged growth reductions occur as a result of drought stress associated with reduced leaf photosynthetic activity, twig, bud, fine-roots, and branch mortality, xylem cavitation, and modifications in carbon allocation. Moreover, [27] suggested that the reduced carbon reserve during drought can consequently affect tree cold resistance the following winter. Although we observed longer (three years) microsite-specific RW and LBI reductions at the VOR microsite, at this point, it remains unclear if they are associated with a synergistic effect of drought (1939) and cold winter (1940–1942) or a combination of extreme climate events with associated physiological adjustments (Figure 2).

4.3. Scots Pine Growth Responses to Unusually Cold Winters

Although Scots pine is thought to be generally tolerant to low winter temperatures [29], we found a clear relationship between cold winter and negative growth responses in RW and LBI of Scots pine from both the northern and southern subregions. Therefore, our findings support the growing body of evidence reporting negative impact of cold winter on Scots pine growth [2,6,7,8,38,41,42].
In our study, we demonstrated that Scots pine RW and LBI are similarly susceptible to cold winters. The differences in the frequency of RW and LBI responses are very minor and not as distinctive as for drought. However, we observed that RW and LBI from the northern subregion were much more susceptible to cold winters than the same parameters from the southern subregion. In general, trees in winter are usually insensitive to low temperatures and freezing due to the dormancy of cambial processes [90]. However, exceptionally low temperatures for an extended time period during winter, especially in the northern subregion, might have had a considerable effect on tree growth [2,41]. Generally, warmer temperatures in winter that have been observed across our study area [25] might have resulted in tree hardening disturbance, particularly in the northern subregion, and have led to a decrease in tree resistance to unusually low winter temperatures [8,26]. Consequently, cold winters can similarly as drought affect tree growth, leading to prompt growth reduction [2,6,7,8,38,39,42]. Although the physiological mechanisms responsible for cold winter damage in trees are not fully known [2,91], a few rationales could explain our findings. Several studies on different coniferous species suggested that winter embolism (hydraulic failure) occurring during cold and dry conditions in winter might lead to xylem dysfunction [80,92,93]. The authors of [92] suggested that during cold winter with stronger and more frequent embolism, energy that could be invested in spring radial growth is instead used for recovery after winter embolism. Consequently, cold winter has been suggested [2,92] to act immediately and force abrupt RW decrease in the subsequent growing season, as we also observed across most of our microsites (Figure 4). Further, the lack of snow (i.e., winter drought conditions) and of subsequent insulation leading to deeper frozen soils might have a detrimental impact on radial tree growth due to fine root damage [6,94]. Deep snow cover in late winter, on the other hand, has been demonstrated to significantly reduce radial growth by maintaining low soil temperatures and delaying spring cambial reactivation [95,96]. The observed differences in Scots pine growth (RW and LBI) responses to cold winter seasons in the northern and southern subregions may also result from generally colder winters occurring in the north compared to the south. In this case, the growth reduction due to unusually low winter temperatures might have been attributed to greater frost damage to needles, especially in the northern subregion [39]. Lastly, Scots pine from different locations across its distribution range might display higher or lower sensitivity of growth to cold winters. In our study, Scots pine from the southern subregion might be able to utilize the longer growing season and assimilate greater nutrient reserves compared to the trees from the northern subregion, therefore exhibiting a greater ability to mitigate the negative effect of cold winters on tree growth [38].
The lack of significant growth responses after certain events might indicate that the identified cold winters were not strong enough (Figure S1) to influence RW and/or LBI. At some sites, even though the identified cold winters were stronger than z-score ≤ −2 (Figure S1), Scots pine did not record these events in RW and/or LBI (Figure 4 and Figure 6). We suggest that a layer of dense groundcover vegetation, as we especially observed at the bottom microsites (common plants: Calluna sp., Vaccinum uliginosum sp., and Rhododendron tomentosum; Table 1) could insulate the soil from the penetration of anomalously low air temperatures and consequently protect Scots pine roots from damage [41]. Severe winter in northern Finland has been reported to significantly reduce RW in young but not mature Scot pine trees, while latewood density was not affected at all [41]. The same study suggested that the root system of mature trees is developed better, covers a larger area and goes deeper into the soil than that of young trees and thus, fine root damage in older trees might be less expected.

4.4. Microsite Differences in Scots Pine Growth Responses to Unusually Cold Winters

Apart from very minor differences between RW and LBI responses to cold winter, we observed that microsite type slightly modulates these RW responses. We suggest that the observed mild differences (i.e., dune ridge more sensitive than the dune bottom) may arise from the lesser snow accumulated at the dune ridge compared to the dune bottom. Higher wind velocities at the coastal dunes [49,50,51] can blow snow from the dune ridge, resulting in snow-free, dry conditions. As described above, reduced snow cover during the winter could predispose Scots pine growing at the dune ridge to cold-induced injury and thus reduced growth. Similar conditions might have occurred during snowless winters or just with very little snow, resulting in water shortage and frozen soil at the dune ridge compared to the dune bottom. As we reported, we also observed longer (three years) microsite-specific RW and/or LBI reductions; however, these were recorded just at three dune-ridge (GSR: RW, VOR: RW and LBI, and GBR: LBI) microsites (Figure 4 for RW, Figure 6 for LBI). Interestingly, [97] reported strong growth reductions in Scots pine tree rings after three consecutive very cold winters (1939/1940, 1940/1941, 1941/1942) and drought (1940) at the Gotska Sandön Island. However, although we observed prolonged growth reductions of RW and/or LBI at three microsites, at this point, it is uncertain if the reductions are associated with consecutive cold winters occurring at our sites.

4.5. Limitations of our Approach

The statistical SEA framework we applied allowed us to demonstrate Scots pine tree responses to growing-season droughts and cold winters as an important first step in understanding coastal Scots pine responses to future climate changes. Although our approach was robust and informative, it also had several limitations. First, SEA does not permit distinguishing between the factors triggering growth reductions when multiple factors occurred consecutively (e.g., drought: 1939 and cold winter: 1940–1942) as we recorded for three sites (TP, NO, VO; Figure 2). Consequently, as an example, a synergistic effect of two climate extremes on growth reductions might cause uncertainties in tree-ring-based climate reconstructions from Scots pine trees if no other tree-ring parameter is present. Second, the use of tree-ring parameters of living trees only (e.g., ring width or wood density) did not allow for evaluating changes in stand structure (e.g., tree mortality). This means that some of the trees could have died in the response to certain climate extremes. Climatically driven dieback represents an ultimate growth response to climatic extreme; however, we were not able to assess this situation because we focused on the survivor responses [98]. Third, the applied SEA relies on bootstrapping to randomly selected sets of the time series and to determine if growth reductions for event years vary from random [74]. Therefore, the a priori subjective definition of what constitutes a severe drought and cold winter can impact the capability to identify significant growth reductions [4,99]. It might happen that an extreme event, although not included in our drought (SPEI ≤ 1.5) or cold winter (z-score ≤ −1.5) threshold, can cause a pronounced growth reduction [74] such as what we observed in our RW and LBI chronologies. Fourth, the SEA also partly revealed significant growth reductions registered in the years before the event year (i.e., t − 1, t − 2, or t − 3; Figure 3A, Figure 5A,B) and significant growth increases registered in the years after the event year (i.e., t + 1, t + 2, t + 3; Figure 5). Such growth reductions may be associated with other confounding factors besides drought and cold winter that could have occurred before the events investigated in this study. It is not uncommon for the SEA to detect growth reductions registered in the years preceding a studied event [100]; however, the SEA does not allow determining the cause of such reductions. On the other side, the observed growth increases after the event year (Figure 5) could indicate the recovery after cold winter [74]. Although some rationale could explain our findings, the explicit reasons for the growth reductions and increases observed before and after an event in our study, respectively, remain unclear at this point. Fifth, the SEA applied in a “classical way” ([74]; our first approach) may present significant but weak growth reductions following the event year as observed for droughts and RW from the northern subregion (Figure 3). Such growth reductions may rather resemble a local departure from the long-term mean than a growth reduction after an extreme event. However, such effect as we observed (Figure 3) may arise from the fact that several drought events of different magnitudes are superposed. It means that the overall growth reduction detected by the SEA performed at the subregional level may be diminished if a few extreme events did not lead to significant growth reductions, as we could observe because of the local-scale approach. Therefore, the application of the local-scale SEA expanded the results and showed the detailed RW and LBI responses to particular extreme events. Interestingly, both the strength and the number of extreme events superposed in the analysis (“classical way”; [74]) may impact the final results, as we showed for the RW and LBI from the southern subregion, when particularly cold winters from the 1940s were excluded from the SEA (Figure S2). Sixth, the identified climate extremes and applied thresholds could be affected by the quality of the available climate data. We used gridded temperature and precipitation datasets for most of our sites. However, interpolated over a large area, gridded climate data might underrepresent the microclimatic conditions at our coastal dune sites. Thus, the identification of droughts or cold winters might be particularly challenging. Seventh, in the SEA, a window setting for which the analysis is performed has to be selected [74]. Here, we applied a window of three years before and after an event; however, using a wider window (e.g., five years) would have brought just subtle differences in the results. For example, using a window of five years would have only allowed us to detect one year longer growth reduction in LBI from the VOR microsite after drought in 1939, and detected a single, lagged by five years RW reduction at the NO site after the cold winter in 1929. Considering these slight differences, we feel the three-year window was significantly robust. Lastly, the results of SEA may be biased if other external factors negatively impact tree growth. For example, wind constitutes an important factor shaping the coastal dune environment. Wind causes sand movement, especially if the dune lacks ground vegetation or is very sparse. Strong winds can blow out sand [101] and expose tree roots, resulting in fine-roots damage. In turn, these effects may be registered in tree rings (e.g., narrow rings, eccentric rings, stem tapering), possibly influencing our results. However, once ground vegetation and a forest have been established, as observed at our sites (Figure 1), wind erosion is considered low [101]. Historical local wind speed data for our sites were either too short and not sufficient for reliable analysis, or not available.

5. Conclusions

Both RW and LBI represent important proxies recording Scots pine growth responses to droughts and cold winters at the coastal dunes around the south Baltic Sea. Growth reductions after droughts were less frequent and less instantaneous but of comparable duration compared to reductions after cold winters. Additionally, we showed marginal but ecologically reasonable differences between tree-ring parameters and microsite types in the pattern of the response to climate extremes. Notably, due to the exposed position of the dune-ridge microsites, we observed stronger effects of both drought and cold winter events compared to the less-exposed dune-bottom microsites. Overall, Scots pine is more susceptible to cold winters than to droughts, especially from the northern subregion. Assessing the current risk of drought and cold winter as the two major climate factors that induce Scots pine growth changes and thus impact long-term growth patterns is crucial to improve our understanding of future coastal dune forest dynamics. The risk of drought occurrence in our study region has increased over the years, and thus it is very likely that droughts will occur with a higher frequency, intensity, and duration in the future. Moreover, the occurrence of cold winters, although not observed since 1987 (for ~ last 30 years) across our sites, will probably become more sporadic [9]. As a result, Scots pine trees already challenged by the Baltic Sea coastal dune features [49,50,51] might be less stressed by cold winter but more often impacted by severe droughts in the future. Therefore, in the face of future climate change, testing how Scots pine, and also other tree species from coastal dunes, respond to climate extremes is important to promote sustainable coastal forest management. However, to employ a suitable forest management on a local scale, it is important not just to generalize from global or regional perspectives but also to identify local specificities. We recommend testing multiple tree-ring parameters, including not only RW and LBI, to gain a more comprehensive picture of Scots pine responses to climate extremes at specific sites or regions.

Supplementary Materials

The following supporting information can be downloaded at: https://www.mdpi.com/article/10.3390/f13030477/s1, Figure S1: SPEI6 integrated over March–August season (orange line) and z-scores of January–March (dashed blue line) and February–March (solid blue line) temperatures as well as individual site-specific growing season droughts (orange vertical lines) and unusually cold winters (blue vertical lines) which exceed a threshold of SPEI and z-score ≤ −1.5 (horizontal dashed line). See Table 1 in the article for description of site names and abbreviations; Figure S2: The results of superposed epoch analysis (SEA) conducted to study the robustness of the method. The comparison has been done for the SEA performed for all and selected (all excluding the events in the 1940s) superposed subregion-specific cold winter events, ring width (A) and latewood blue intensity (B) datasets. Light and dark gray represent dune ridge and bottom microsites, respectively. Blue line shows an event year (i.e., superposed subregion-specific cold winters) and circles with black outline present significant negative effect on growth. Horizontal dashed lines represent significance threshold at p < 0.05. Green rectangle indicates that after excluding the 1940s cold winter events from the SEA, the response stayed significant within a subregion and a tree-ring parameter. Orange rectangle indicates that after excluding the 1940s cold winter events from the SEA, the response was insignificant within a subregion and a tree-ring parameter; Table S1: Descriptive statistics of ring width (RW) and latewood blue intensity (LBI) chronologies per microsite calculated for the 1902–2016 period relevant for superposed epoch analysis; Table S2: Results of superposed epoch analysis for all individual growing season droughts, microsite ring-width (RW), and latewood blue intensity (LBI) chronologies. White cells indicate lack of drought detected at a certain site, while orange cells indicate identified drought. The numbers in the orange cells indicate the timing of growth response, for example, 0 means an effect on RW/LBI in the event year, +1, +2, and +3 mean an effect on RW/LBI one, two, and three year(s) after the event. At the same time, these numbers indicate the duration of growth reductions, for example: 1, 2, and 3 in a single orange cell mean that growth reduction lasted three years. A blank orange cell (i.e., with no numerical value) indicates an absence of drought effect on growth although drought was climatically recorded. See Table 1 in the article for description of (micro)site names and abbreviations; Table S3: Results of superposed epoch analysis for all individual unusually cold winter events, microsite ring-width (RW), and latewood blue intensity (LBI) chronologies. White cells indicate lack of cold winter detected at a certain site, while blue cells indicate identified cold winter. The numbers in the blue cells indicate the timing of growth response, for example, 0 means an effect on RW/LBI in the event year, +1, +2, and +3 mean an effect on RW/LBI one, two, and three year(s) after the event. At the same time, these numbers indicate the duration of growth reductions, for example: 1, 2, and 3 in a single blue cell mean that growth reduction lasted three years. A blank blue cell (i.e., with no numerical value) indicates an absence of cold winter effect on growth although winter frost was climatically recorded. See Table 1 in the article for description of (micro)site names and abbreviations.

Author Contributions

K.J. designed the study, analyzed the data and led the writing of the manuscript. M.W., S.M., M.M., and J.E.H. discussed the results and commented on the manuscript. All authors have read and agreed to the published version of the manuscript.

Funding

K.J. was supported by the Deutscher Akademischer Austauschdienst (DAAD), J.E.H. was supported by an Alexander von Humboldt Postdoctoral Fellowship. This research was funded by research consortium BaltRap (The Baltic Sea and its Southern Lowlands: Proxy-Environment interactions in times of rapid changes) funded by the Leibniz Association and the Estonian University of Life Sciences (projects P180024MIME, P200029MIME, and P200189MIMP) and Estonian Research Council grant (PRG1586). We acknowledge support for the Article Processing Charge by the German Research Foundation and the Open Access Publication Fund of the University of Greifswald.

Data Availability Statement

Datasets are available on request: The raw data supporting the conclusions of this manuscript will be made available by the authors, without undue reservation, to any qualified researcher.

Acknowledgments

We thank Ryszard Kaczka for help with all fieldwork, Petter Rimfors, Örjan Siik, Magnus Lepschi, and Mats Niklasson for constructive advice during the fieldwork on the Gotska Sandön Island. We would like to also thank two anonymous reviewers; their comments improved our manuscript. The authors are grateful to Jan Tumajer for comments on the manuscript.

Conflicts of Interest

The authors declare that the research was conducted in the absence of any commercial or financial relationships that could be construed as a potential conflict of interest.

References

  1. Eilmann, B.; Zweifel, R.; Buchmann, N.; Graf Pannatier, E.; Rigling, A. Drought alters timing, quantity, and quality of wood formation in Scots pine. J. Exp. Bot. 2011, 62, 2763–2771. [Google Scholar] [CrossRef] [PubMed] [Green Version]
  2. Vanoni, M.; Bugmann, H.; Nötzli, M.; Bigler, C. Drought and frost contribute to abrupt growth decreases before tree mortality in nine temperate tree species. For. Ecol. Manag. 2016, 382, 51–63. [Google Scholar] [CrossRef] [Green Version]
  3. Vanoni, M.; Bugmann, H.; Nötzli, M.; Bigler, C. Quantifying the effects of drought on abrupt growth decreases of major tree species in Switzerland. Ecol. Evol. 2016, 6, 3555–3570. [Google Scholar] [CrossRef]
  4. Gazol, A.; Camarero, J.J.; Sánchez-Salguero, R.; Vicente-Serrano, S.M.; Serra-Maluquer, X.; Gutiérrez, E.; De Luis, M.; Sangüesa-Barreda, G.; Novak, K.; Rozas, V.; et al. Drought legacies are short, prevail in dry conifer forests and depend on growth variability. J. Ecol. 2020, 108, 2473–2484. [Google Scholar] [CrossRef]
  5. Gazol, A.; Camarero, J.J.; Sangüesa-Barreda, G.; Serra-Maluquer, X.; Sánchez-Salguero, R.; Coll, L.; Casals, P. Tree Species Are Differently Impacted by Cumulative Drought Stress and Present Higher Growth Synchrony in Dry Places. Front. For. Glob. Chang. 2020, 3. Available online: https://www.frontiersin.org/articles/10.3389/ffgc.2020.573346/full (accessed on 29 January 2022). [CrossRef]
  6. Vitas, A. Sensitivity of Scots Pine Trees to Winter Colds and Summer droughts. Balt. For. 2006, 12, 220–226. [Google Scholar]
  7. Jansons, Ā.; Matisons, R.; Šēnhofa, S.; Katrevičs, J.; Jansons, J. High-frequency variation of tree-ring width of some native and alien tree species in Latvia during the period 1965–2009. Dendrochronologia 2016, 40, 151–158. [Google Scholar] [CrossRef]
  8. Misi, D.; Nafradi, K. Late Winter—Early Spring Thermal Conditions and their long-term effect on tree-ring growth in Hungary. Balt. For. 2013, 22, 203–211. [Google Scholar]
  9. IPCC SYR TSU. Climate Change 2014: Synthesis Report; Intergovernmental Panel on Climate Change: Geneva, Switzerland, 2015. [Google Scholar]
  10. Anderegg, W.R.L.; Schwalm, C.R.; Biondi, F.; Camarero, J.J.; Koch, G.W.; Litvak, M.; Ogle, K.; Shaw, J.D.; Shevliakova, E.; Williams, A.P.; et al. Pervasive drought legacies in forest ecosystems and their implications for carbon cycle models. Science 2015, 349, 528–532. [Google Scholar] [CrossRef] [PubMed] [Green Version]
  11. Büntgen, U.; Urban, O.; Krusic, P.J.; Rybníček, M.; Kolář, T.; Kyncl, T.; Ač, A.; Koňasová, E.; Čáslavský, J.; Esper, J.; et al. Recent European drought extremes beyond Common Era background variability. Nat. Geosci. 2021, 14, 190–196. [Google Scholar] [CrossRef]
  12. Neuwirth, B.; Esper, J.; Schweingruber, F.H.; Winiger, M. Site ecological differences to the climatic forcing of spruce pointer years from the Lötschental, Switzerland. Dendrochronologia 2004, 21, 69–78. [Google Scholar] [CrossRef]
  13. Reichstein, M.; Ciais, P.; Papale, D.; Valentini, R.; Running, S.; Viovy, N.; Cramer, W.; Granier, A.; Ogée, J.; Allard, V.; et al. Reduction of ecosystem productivity and respiration during the European summer 2003 climate anomaly: A joint flux tower, remote sensing and modelling analysis. Glob. Chang. Biol. 2007, 13, 634–651. [Google Scholar] [CrossRef]
  14. Vitasse, Y.; Bottero, A.; Cailleret, M.; Bigler, C.; Fonti, P.; Gessler, A.; Lévesque, M.; Rohner, B.; Weber, P.; Rigling, A.; et al. Contrasting resistance and resilience to extreme drought and late spring frost in five major European tree species. Glob. Chang. Biol. 2019, 25, 3781–3792. [Google Scholar] [CrossRef] [PubMed]
  15. Gazol, A.; Camarero, J.J.; Vicente-Serrano, S.M.; Sánchez-Salguero, R.; Gutiérrez, E.; de Luis, M.; Sangüesa-Barreda, G.; Novak, K.; Rozas, V.; Tíscar, P.A.; et al. Forest resilience to drought varies across biomes. Glob. Chang. Biol. 2018, 24, 2143–2158. [Google Scholar] [CrossRef]
  16. Kunstler, G.; Guyennon, A.; Ratcliffe, S.; Rüger, N.; Ruiz-Benito, P.; Childs, D.Z.; Dahlgren, J.; Lehtonen, A.; Thuiller, W.; Wirth, C.; et al. Demographic performance of European tree species at their hot and cold climatic edges. J. Ecol. 2021, 109, 1041–1054. [Google Scholar] [CrossRef]
  17. Song, L.; Zhu, J.; Zhang, J.; Zhang, T.; Wang, K.; Wang, G.; Liu, J. Effect of Drought and Topographic Position on Depth of Soil Water Extraction of Pinus sylvestris L. var. mongolica Litv. Trees in a Semiarid Sandy Region, Northeast China. Forests 2019, 10, 370. [Google Scholar] [CrossRef] [Green Version]
  18. Peltier, D.M.P.; Ogle, K. Legacies of more frequent drought in ponderosa pine across the western United States. Glob. Chang. Biol. 2019, 25, 3803–3816. [Google Scholar] [CrossRef]
  19. Eilmann, B.; Rigling, A. Tree-growth analyses to estimate tree species’ drought tolerance. Tree Physiol. 2012, 32, 178–187. [Google Scholar] [CrossRef] [Green Version]
  20. Camarero, J.J.; Gazol, A.; Sangüesa-Barreda, G.; Cantero, A.; Sánchez-Salguero, R.; Sánchez-Miranda, A.; Granda, E.; Serra-Maluquer, X.; Ibáñez, R. Forest Growth Responses to Drought at Short- and Long-Term Scales in Spain: Squeezing the Stress Memory from Tree Rings. Front. Ecol. Evol. 2018, 6. Available online: https://www.frontiersin.org/articles/10.3389/fevo.2018.00009/full (accessed on 29 January 2022). [CrossRef] [Green Version]
  21. Sánchez-Salguero, R.; Navarro-Cerrillo, R.M.; Camarero, J.J.; Fernández-Cancio, A. Selective drought-induced decline of pine species in southeastern Spain. Clim. Chang. 2012, 113, 767–785. [Google Scholar] [CrossRef]
  22. Gazol, A.; Camarero, J.J. Functional diversity enhances silver fir growth resilience to an extreme drought. J. Ecol. 2016, 104, 1063–1075. [Google Scholar] [CrossRef]
  23. Senf, C.; Buras, A.; Zang, C.S.; Rammig, A.; Seidl, R. Excess forest mortality is consistently linked to drought across Europe. Nat. Commun. 2020, 11, 6200. [Google Scholar] [CrossRef]
  24. Scharnweber, T.; Smiljanic, M.; Cruz-García, R.; Manthey, M.; Wilmking, M. Tree growth at the end of the 21st century—The extreme years 2018/19 as template for future growth conditions. Environ. Res. Lett. 2020, 15, 074022. [Google Scholar] [CrossRef] [Green Version]
  25. Harvey, J.E.; Smiljanić, M.; Scharnweber, T.; Buras, A.; Cedro, A.; Cruz-García, R.; Drobyshev, I.; Janecka, K.; Jansons, Ā.; Kaczka, R.; et al. Tree growth influenced by warming winter climate and summer moisture availability in northern temperate forests. Glob. Chang. Biol. 2019, 26, 2505–2518. [Google Scholar] [CrossRef] [PubMed]
  26. Koprowski, M. Spatial distribution of introduced Norway spruce growth in lowland Poland: The influence of changing climate and extreme weather events. Quat. Int. 2013, 283, 139–146. [Google Scholar] [CrossRef]
  27. Galvez, D.A.; Landhäusser, S.M.; Tyree, M.T. Low root reserve accumulation during drought may lead to winter mortality in poplar seedlings. New Phytol. 2013, 198, 139–148. [Google Scholar] [CrossRef]
  28. Durrant, T.H.; De Rigo, D.; Caudullo, G. Pinus sylvestris in Europe—Distribution, habitat, usage and threats. Eur. Atlas For. Tree Species 2016, 132–133. Available online: https://forest.jrc.ec.europa.eu/media/atlas/Pinus_sylvestris.pdf (accessed on 29 January 2022).
  29. Pâques, L.E. Forest Tree Breeding in Europe; Springer: Dordrecht, The Netherlands, 2013. [Google Scholar]
  30. Klõšeiko, J.; Tilk, M. Drought tolerance of Scots pine in diverse growth conditions on a dune estimated on the basis of carbohydrates and chlorophyll fluorescence in needles. For. Stud. 2008, 49, 25–36. [Google Scholar] [CrossRef]
  31. Candel-Pérez, D.; Lo, Y.-H.; Blanco, J.A.; Chiu, C.-M.; Camarero, J.J.; De Andrés, E.G.; Imbert, J.B.; Castillo, F.J. Drought-Induced Changes in Wood Density Are Not Prevented by Thinning in Scots Pine Stands. Forests 2018, 9, 4. [Google Scholar] [CrossRef] [Green Version]
  32. Martínez-Vilalta, J.; Pinol, J. Drought-induced mortality and hydraulic architecture in pine populations of the NE Iberian Peninsula. For. Ecol. Manag. 2002, 161, 247–256. [Google Scholar] [CrossRef]
  33. Martin-Benito, D.; Beeckman, H.; Cañellas, I. Influence of drought on tree rings and tracheid features of Pinus nigra and Pinus sylvestris in a mesic Mediterranean forest. Eur. J. For. Res. 2013, 132, 33–45. [Google Scholar] [CrossRef]
  34. Rigling, A.; Bigler, C.; Eilmann, B.; Feldmeyer-Christe, E.; Gimmi, U.; Ginzler, C.; Graf, U.; Mayer, P.; Vacchiano, G.; Weber, P.; et al. Driving factors of a vegetation shift from Scots pine to pubescent oak in dry Alpine forests. Glob. Chang. Biol. 2013, 19, 229–240. [Google Scholar] [CrossRef] [PubMed]
  35. Sánchez-Salguero, R.; Camarero, J.J.; Rozas, V.; Génova, M.; Olano, J.M.; Arzac, A.; Gazol, A.; Caminero, L.; Tejedor, E.; de Luis, M.; et al. Resist, recover or both? Growth plasticity in response to drought is geographically structured and linked to intraspecific variability in Pinus pinaster. J. Biogeogr. 2018, 45, 1126–1139. [Google Scholar] [CrossRef]
  36. Taeger, S.; Zang, C.; Liesebach, M.; Schneck, V.; Menzel, A. Impact of climate and drought events on the growth of Scots pine (Pinus sylvestris L.) provenances. For. Ecol. Manag. 2013, 307, 30–42. [Google Scholar] [CrossRef]
  37. Merlin, M.; Perot, T.; Perret, S.; Korboulewsky, N.; Vallet, P. Effects of stand composition and tree size on resistance and resilience to drought in sessile oak and Scots pine. For. Ecol. Manag. 2015, 339, 22–33. [Google Scholar] [CrossRef] [Green Version]
  38. Matisons, R.; Jansone, D.; Elferts, D.; Adamovičs, A.; Schneck, V.; Jansons, A. Plasticity of response of tree-ring width of Scots pine provenances to weather extremes in Latvia. Dendrochronologia 2019, 54, 1–10. [Google Scholar] [CrossRef]
  39. Aldea, J.; Ruiz-Peinado, R.; del Río, M.; Pretzsch, H.; Heym, M.; Brazaitis, G.; Jansons, A.; Metslaid, M.; Barbeito, I.; Bielak, K.; et al. Species stratification and weather conditions drive tree growth in Scots pine and Norway spruce mixed stands along Europe. For. Ecol. Manag. 2021, 481, 118697. [Google Scholar] [CrossRef]
  40. Stolz, J.; van der Maaten, E.; Kalanke, H.; Martin, J.; Wilmking, M.; van der Maaten-Theunissen, M. Increasing climate sensitivity of beech and pine is not mediated by adaptation and soil characteristics along a precipitation gradient in northeastern Germany. Dendrochronologia 2021, 67, 125834. [Google Scholar] [CrossRef]
  41. Tuovinen, M.; Jalkanen, R.; McCarroll, D. The effect of severe ground frost on Scots pine (Pinus sylvestris) trees in northern Finland and implications for palaeoclimate reconstructionand implications for paleoclimate reconstruction. Fennia 2005, 183, 109–120. [Google Scholar]
  42. Zunde, M.; Briede, A.; Elferts, D. Influence of Climatic Factors on the Annual Radial Growth of Scots Pine (Pinus sylvestris L.) in Western Latvia. Proc. Latv. Acad. Sci. Sect. B. Nat. Exact Appl. Sci. 2008, 62, 120–128. [Google Scholar] [CrossRef] [Green Version]
  43. Martínez, M.L.; Psuty, N.P. Coastal Dunes: Ecology and Conservation; Springer: Berlin/Heidelberg, Germany; New York, NY, USA, 2008. [Google Scholar]
  44. Ratas, U.; Rivis, R.; Käärt, K. Changes of coastal dune landscapes in Estonia. For. Stud. 2008, 49, 59–70. [Google Scholar] [CrossRef]
  45. Łabuz, T.A. Polish coastal dunes—Affecting factors and morphology. Landf. Anal. 2013, 22, 33–59. [Google Scholar] [CrossRef]
  46. Rutgersson, A.; Jaagus, J.; Schenk, F.; Stendel, M. Observed changes and variability of atmospheric parameters in the Baltic Sea region during the last 200 years. Clim. Res. 2014, 61, 177–190. [Google Scholar] [CrossRef] [Green Version]
  47. Rimkus, E.; Stonevicius, E.; Kilpys, J.; Maciulyte, V.; Valiukas, D. Drought identification in the eastern Baltic region using NDVI. Earth Syst. Dyn. 2017, 8, 627–637. [Google Scholar] [CrossRef] [Green Version]
  48. Mandre, M.; Kõresaar, K. Mineral nutrition of natural regeneration of Scots pine on coastal dunes in South-West Estonia. Estonian J. Ecol. 2008, 57, 70. [Google Scholar] [CrossRef] [Green Version]
  49. Mandre, M.; Lukjanova, A.; Pärn, H.; Kõresaar, K. State of Scots pine (Pinus sylvestris L.) under nutrient and water deficit on coastal dunes of the Baltic Sea. Trees 2010, 24, 1073–1085. [Google Scholar] [CrossRef]
  50. Maun, M.A. The Biology of Coastal Sand Dunes; Oxford University Press: Oxford, UK; New York, NY, USA, 2009. [Google Scholar]
  51. Örd, A. Edela-Eesti luitemetsade mullastik. Metsanduslikud Uurim. 1972, 9, 207–221. [Google Scholar]
  52. Repo, T.; Zhang, G.; Ryyppö, A.; Rikala, R.; Vuorinen, M. The relation between growth cessation and frost hardening in Scots pines of different origins. Trees 2000, 14, 456–464. [Google Scholar] [CrossRef]
  53. Beck, E.H.; Heim, R.; Hansen, J. Plant resistance to cold stress: Mechanisms and environmental signals triggering frost hardening and dehardening. J. Biosci. 2004, 29, 449–459. [Google Scholar] [CrossRef]
  54. Avotniece, Z.; Klavins, M.; Rodinovs, V. Changes of Extreme Climate Events in Latvia. Sci. J. Riga Tech. Univ. Environ. Clim. Technol. 2012, 9, 4–11. [Google Scholar] [CrossRef] [Green Version]
  55. Janecka, K.; Harvey, J.E.; Trouillier, M.; Kaczka, R.J.; Metslaid, S.; Metslaid, M.; Buras, A.; Wilmking, M. Higher Winter-Spring Temperature and Winter-Spring/Summer Moisture Availability Increase Scots Pine Growth on Coastal Dune Microsites Around the South Baltic Sea. Front. For. Glob. Chang. 2020, 3. Available online: https://www.frontiersin.org/articles/10.3389/ffgc.2020.578912/full (accessed on 29 January 2022). [CrossRef]
  56. Janecka, K.; Kaczka, R.J.; Gärtner, H.; E Harvey, J.; Treydte, K. Compression wood has a minor effect on the climate signal in tree-ring stable isotope records of montane Norway spruce. Tree Physiol. 2020, 40, 1014–1028. [Google Scholar] [CrossRef] [PubMed]
  57. Speer, J. Fundamentals of Tree-Ring Research; University of Arizona Press: Tucson, AZ, USA, 2010. [Google Scholar]
  58. Wilson, R.; Rao, R.; Rydval, M.; Wood, C.; Larsson, L.; Luckman, B.H. Blue Intensity for dendroclimatology: The BC blues: A case study from British Columbia, Canada. Holocene 2014, 24, 1428–1438. [Google Scholar] [CrossRef]
  59. Rydval, M.; Larsson, L.; McGlynn, L.; Gunnarson, B.E.; Loader, N.; Young, G.H.; Wilson, R. Blue intensity for dendroclimatology: Should we have the blues? Experiments from Scotland. Dendrochronologia 2014, 32, 191–204. [Google Scholar] [CrossRef]
  60. Xu, K.; Wang, X.; Liang, P.; An, H.; Sun, H.; Han, W.; Li, Q. Tree-ring widths are good proxies of annual variation in forest productivity in temperate forests. Sci. Rep. 2017, 7, 1945. [Google Scholar] [CrossRef] [PubMed] [Green Version]
  61. Kaczka, R.J.; Wilson, R. I-BIND: International Blue intensity network development working group. Dendrochronologia 2021, 68, 125859. [Google Scholar] [CrossRef]
  62. Kaczka, R.J.; Spyt, B.; Janecka, K.; Beil, I.; Büntgen, U.; Scharnweber, T.; Nievergelt, D.; Wilmking, M. Different maximum latewood density and blue intensity measurements techniques reveal similar results. Dendrochronologia 2018, 49, 94–101. [Google Scholar] [CrossRef]
  63. Larsson, L. CDendro: Cybis Dendro Dating Program; Cybis Elektronik & Data AB: Saltsjöbaden, Sweden, 2003. [Google Scholar]
  64. Holmes, R.L. Quality control of crossdating and measuring. Users manual for computer program COFECHA. In Tree-Ring Chronologies of Western North America: California, Eastern Oregon and Northern Great Basin with Procedures Used in the Chronology Development Work Including Users Manuals for Computer Programs COFECHA and ARSTAN; Laboratory of Tree-Ring Research, University of Arizona: Tucson, AZ, USA, 1986. [Google Scholar]
  65. Bunn, A. A dendrochronology program library in R (dplR). Dendrochronologia 2008, 26, 115–124. [Google Scholar] [CrossRef]
  66. Cook, E.R.; Peters, K. Calculating unbiased tree-ring indices for the study of climatic and environmental change. Holocene 1997, 7, 361–370. [Google Scholar] [CrossRef]
  67. Helama, S.; Lindholm, M.; Timonen, M.; Eronen, M. Detection of climate signal in dendrochronological data analysis: A comparison of tree-ring standardization methods. Theor. Appl. Climatol. 2004, 79, 239–254. [Google Scholar] [CrossRef]
  68. Cook, E.R.; Briffa, K.; Shiyatov, S.; Mazepa, V. Tree-ring standardization and growth trend estimation. In Methods of Dendrochronology: Applications in the Environmental Sciences; Kluwer: Dordrecht, The Netherlands, 1990; pp. 104–123. [Google Scholar]
  69. Wigley, T.M.L.; Briffa, K.R.; Jones, P.D. On the Average Value of Correlated Time Series, with Applications in Dendroclimatology and Hydrometeorology. J. Appl. Meteorol. Climatol. 1984, 23, 201–213. [Google Scholar] [CrossRef]
  70. Buras, A. A comment on the expressed population signal. Dendrochronologia 2017, 44, 130–132. [Google Scholar] [CrossRef]
  71. Vicente-Serrano, S.M.; Beguería, S.; López-Moreno, J.I. A Multiscalar Drought Index Sensitive to Global Warming: The Standardized Precipitation Evapotranspiration Index. J. Clim. 2010, 23, 1696–1718. [Google Scholar] [CrossRef] [Green Version]
  72. Tammets, T.; Jaagus, J. Climatology of precipitation extremes in Estonia using the method of moving precipitation totals. Arch. Meteorol. Geophys. Bioclimatol. Ser. B 2013, 111, 623–639. [Google Scholar] [CrossRef]
  73. Li, B.; Zhou, W.; Zhao, Y.; Ju, Q.; Yu, Z.; Liang, Z.; Acharya, K. Using the SPEI to Assess Recent Climate Change in the Yarlung Zangbo River Basin, South Tibet. Water 2015, 7, 5474–5486. [Google Scholar] [CrossRef] [Green Version]
  74. Orwig, D.A.; Abrams, M.D. Variation in radial growth responses to drought among species, site, and canopy strata. Trees 1997, 11, 474–484. [Google Scholar] [CrossRef]
  75. Pasho, E.; Camarero, J.J.; de Luis, M.; Vicente-Serrano, S.M. Impacts of drought at different time scales on forest growth across a wide climatic gradient in north-eastern Spain. Agric. For. Meteorol. 2011, 151, 1800–1811. [Google Scholar] [CrossRef]
  76. Lévesque, M.; Saurer, M.; Siegwolf, R.T.W.; Eilmann, B.; Brang, P.; Bugmann, H.; Rigling, A. Drought response of five conifer species under contrasting water availability suggests high vulnerability of Norway spruce and European larch. Glob. Chang. Biol. 2013, 19, 3184–3199. [Google Scholar] [CrossRef]
  77. Eilmann, B.; Zweifel, R.; Buchmann, N.; Fonti, P.; Rigling, A. Drought-induced adaptation of the xylem in Scots pine and pubescent oak. Tree Physiol. 2009, 29, 1011–1020. [Google Scholar] [CrossRef] [Green Version]
  78. Hacke, U.G.; Sperry, J.S.; Pockman, W.T.; Davis, S.D.; McCulloh, K.A. Trends in wood density and structure are linked to prevention of xylem implosion by negative pressure. Oecologia 2001, 126, 457–461. [Google Scholar] [CrossRef]
  79. Pittermann, J.; Sperry, J.S.; Wheeler, J.K.; Hacke, U.G.; Sikkema, E.H. Mechanical reinforcement of tracheids compromises the hydraulic efficiency of conifer xylem. Plant Cell Environ. 2006, 29, 1618–1628. [Google Scholar] [CrossRef] [Green Version]
  80. Tyree, M.T.; Zimmermann, M.T. Xylem Structure and the Ascent of Sap; Springer: Berlin/Heidelberg, Germany, 2002. [Google Scholar]
  81. Högberg, P.; Nordgren, A.; Buchmann, N.; Taylor, A.F.S.; Ekblad, A.; Högberg, M.N.; Nyberg, G.; Ottosson-Löfvenius, M.; Read, D.J. Large-scale forest girdling shows that current photosynthesis drives soil respiration. Nature 2001, 411, 789–792. [Google Scholar] [CrossRef] [PubMed]
  82. Allen, S.T.; Kirchner, J.W.; Braun, S.; Siegwolf, R.T.W.; Goldsmith, G.R. Seasonal origins of soil water used by trees. Hydrol. Earth Syst. Sci. 2019, 23, 1199–1210. [Google Scholar] [CrossRef] [Green Version]
  83. Mandre, M. Conditions for mineral nutrition and content of nutrients in scots pine on dunes in Southwest Estonia. For. Ecosyst. Coast. Dunes Southwest Est. 2003, 39, 32–42. [Google Scholar]
  84. Abrams, M.D.; Ruffner, C.M.; Morgan, T.A. Tree-Ring Responses to Drought Across Species and Contrasting Sites in the Ridge and Valley of Central Pennsylvania. For. Sci. 1998, 44, 550–558. [Google Scholar]
  85. Vicente-Serrano, S.M.; Lasanta, T.; Gracia, C. Aridification determines changes in forest growth in Pinus halepensis forests under semiarid Mediterranean climate conditions. Agric. For. Meteorol. 2010, 150, 614–628. [Google Scholar] [CrossRef]
  86. Rigling, A.; Brühlhart, H.; Bräker, O.U.; Forster, T.; Schweingruber, F.H. Effects of irrigation on diameter growth and vertical resin duct production in Pinus sylvestris L. on dry sites in the central Alps, Switzerland. For. Ecol. Manag. 2003, 175, 285–296. [Google Scholar] [CrossRef]
  87. Tumajer, J.; Treml, V. Response of floodplain pedunculate oak (Quercus robur L.) tree-ring width and vessel anatomy to climatic trends and extreme hydroclimatic events. For. Ecol. Manag. 2016, 379, 185–194. [Google Scholar] [CrossRef]
  88. Fritts, H. Tree Rings and Climate; Elsevier: Amsterdam, The Netherlands, 2012. [Google Scholar]
  89. Tyree, M.T.; Sperry, J.S. Vulnerability of Xylem to Cavitation and Embolism. Annu. Rev. Plant. Physiol. Plant. Mol. Biol. 1989, 40, 19–36. [Google Scholar] [CrossRef]
  90. Perry, T.O. Dormancy of trees in winter. Science 1971, 171, 29–36. [Google Scholar] [CrossRef]
  91. Kozlowski, T.T.; Kramer, P.J.; Pallardy, S.G. The Physiological Ecology of Woody Plants; Academic Press: Cambridge, MS, USA, 2012. [Google Scholar]
  92. Pederson, N.; Cook, E.R.; Jacoby, G.C.; Peteet, D.M.; Griffin, K.L. The influence of winter temperatures on the annual radial growth of six northern range margin tree species. Dendrochronologia 2004, 22, 7–29. [Google Scholar] [CrossRef]
  93. Sperry, J.S.; Sullivan, J.E.M. Xylem Embolism in Response to Freeze-Thaw Cycles and Water Stress in Ring-Porous, Diffuse-Porous, and Conifer Species. Plant Physiol. 1992, 100, 605–613. [Google Scholar] [CrossRef] [PubMed]
  94. Tierney, G.L.; Fahey, T.J.; Groffman, P.; Hardy, J.P.; Fitzhugh, R.D.; Driscoll, C.T. Soil freezing alters fine root dynamics in a northern hardwood forest. Biogeochemistry 2001, 56, 175–190. [Google Scholar] [CrossRef]
  95. Peterson, D.W.; Ettl, G.J.; Peterson, D.L. Growth responses of subalpine fir to climatic variability in the Pacific Northwest. Can. J. For. Res. 2002, 32, 1503–1517. [Google Scholar] [CrossRef]
  96. Peterson, D.W.; Peterson, D.L. Mountain hemlock growth responds to climatic variability at annual and decadal time scales. Ecology 2001, 82, 3330–3345. [Google Scholar] [CrossRef]
  97. Niklasson, M. Skogshistoria och Bränder på Gotska Sandön; Länsstyrelsen: Visby, Sweden, 2015; p. 58. [Google Scholar]
  98. Brienen, R.J.; Gloor, E.; Zuidema, P.A. Detecting Evidence for CO2 Fertilization from Tree Ring Studies: The Potential Role of Sampling Biases. Glob. Biogeochem. Cycles Int. J. Glob. Change 2012, 26, GB1025. Available online: https://agupubs.onlinelibrary.wiley.com/doi/full/10.1029/2011GB004143 (accessed on 29 January 2022).
  99. Rao, M.P.; Cook, E.R.; Cook, B.I.; Anchukaitis, K.J.; D’Arrigo, R.D.; Krusic, P.J.; LeGrande, A.N. A double bootstrap approach to Superposed Epoch Analysis to evaluate response uncertainty. Dendrochronologia 2019, 55, 119–124. [Google Scholar] [CrossRef]
  100. Lévesque, M.; Rigling, A.; Bugmann, H.; Weber, P.; Brang, P. Growth response of five co-occurring conifers to drought across a wide climatic gradient in Central Europe. Agric. For. Meteorol. 2014, 197, 1–12. [Google Scholar] [CrossRef]
  101. Doody, J.P. Sand Dune Conservation, Management and Restoration; Springer: Dordrecht, The Netherlands, 2013. [Google Scholar]
Figure 1. The map shows the location of sampling sites around the south Baltic Sea. Black dots indicate sites located in the southern subregion, while black circles indicate sites located in the northern subregion (see Figure 2 in [55]). The inset map shows the location of research area, and green shading presents the Scots pine distribution (www.euforgen.org/species/, accessed on 30 January 2022). See Table 1 for description of site names and abbreviations. Images show one of our study sites—NO located near Nõva in northwest Estonia. (A)—the dune ridge microsite with Cladonia understory; (B)—the dune bottom microsite with Vaccinum uliginosum understory.
Forests 13 00477 g001
Figure 2. Growing season droughts (orange bars) and unusually cold winters (blue bars) identified at six dune sites divided into northern and southern subregions around the south Baltic Sea for the 1902 to 2016 period. See Table 1 for description of site names and abbreviations.
Forests 13 00477 g002
Figure 3. The results of the superposed epoch analysis for the subregion-specific droughts and the ridge-north, bottom-north, ridge-south, and bottom-south datasets of ring width (A) and latewood blue intensity (B) parameters. Light and dark gray represent dune ridge and bottom microsites, respectively. Orange lines show an event year (i.e., superposed subregion-specific droughts) and circles with black outline present significant negative effect on growth. Horizontal dashed lines represent significance threshold at p < 0.05.
Forests 13 00477 g003
Figure 4. Standardized microsite ring-width chronologies (dune bottom = dark gray line and dune ridge = light gray line), individual site-specific droughts (orange vertical lines), and cold winters (blue vertical lines) as well as the timing of negative growth responses to droughts (dune bottom = dark gray dots, dune ridge = light gray dots) and cold winters (dune bottom = dark gray stars, dune ridge = light gray stars). The occurrence and significance of growth reductions were determined by means of the superposed epoch analysis (p < 0.05). The number of consecutive dots or stars indicates the duration of growth reduction after drought or cold winter, respectively. See Table 1 for description of microsite names and abbreviations.
Forests 13 00477 g004
Figure 5. The results of superposed epoch analysis for the subregion-specific cold winters and the ridge-north, bottom-north, ridge-south, and bottom-south datasets of ring width (A) and latewood blue intensity (B) parameters. Light and dark gray represent dune ridge and bottom microsites, respectively. Vertical blue lines show an event year (i.e., superposed subregion-specific cold winters), and circles with black contour present significant negative effect on growth. Dashed lines represent significance at p < 0.05.
Forests 13 00477 g005
Figure 6. Standardized microsite latewood blue intensity chronologies (dune bottom = dark gray line, dune ridge = light gray line), individual site-specific droughts (orange vertical lines) and cold winters (blue vertical lines) as well as the timing of growth reductions to droughts (dune bottom = dark gray dots, dune ridge = light gray dots) and cold winters (dune bottom = dark gray stars, dune ridge = light gray stars). The occurrence and significance of growth reductions were determined by means of the superposed epoch analysis (p < 0.05). The number of consecutive dots or stars indicates the duration of growth reduction after drought or cold winter, respectively. See Table 1 for description of microsite names and abbreviations.
Forests 13 00477 g006
Table 1. Description of the sampling sites (the last letter in the code of microsite type refers to the ridge (R) and bottom (B) of the dune), number of analyzed trees (RW—ring width, LBI—latewood blue intensity), the tree metadata (average tree height), average organic layer and forest understory type (CL—Cladonia, CA Calluna, VU—Vaccinum uliginosum).
SubregionCountrySiteMicrositeLatLonNumber of Analyzed TreesTree Height (m)Organic Layer (cm)Forest Site Type
RWLBI
northernSwedenGotska Sandön (GS)bottom (GSB)58.38°19.20°434015.3 **10.2 **CA
ridge (GSR)58.37°19.20°645217.2 **5.1 **CL
EstoniaTapurla (TP)bottom (TPB)59.59°25.55°504828.5 ***11.9 ***VU
ridge (TPR)59.60°25.55°474419.2 ***7 ***CL
Nõva (NO)bottom (NOB)59.21°23.62°433913.3 ***11.5 ***VU
ridge (NOR)59.22°23.61°504315.8 ***5.5 ***CL
Võiste (VO)bottom (VOB)58.20°24.49°493623.427.2 ***VU
ridge (VOR)58.20°24.49°504722.712.4 ***CL
southernPolandGryfice (GA)bottom (GAB)54.11°15.20°343414.911 ***CA
ridge (GAR)54.11°15.20°363316.38.6 ***CL
Gryfice (GB)bottom (GBB)54.11°15.20°353417.6 ***11.4 ***CA
ridge (GBR)54.11°15.20°353412.7 ***7.3 ***CL
total536484
Tree height and organic layer were tested for significant difference between mean of each pair of the ridge and bottom microsites using a Wilcoxon rank-sum test. ** significantly different; (p < 0.01). *** significantly different (p < 0.001).
Publisher’s Note: MDPI stays neutral with regard to jurisdictional claims in published maps and institutional affiliations.

