


Abstract
Reliability assessment of ship equipment is often constrained by insufficient or unavailable failure data, particularly for highly reliable components with extremely low failure frequencies. To support the use of reference information from similar equipment in subsequent reliability analysis, this study proposes a domain-guided multi-type feature-fusion framework for ship equipment clustering. The proposed framework addresses the heterogeneous nature of ship equipment records by integrating textual, categorical, and numerical attributes into a unified representation. Specifically, equipment names and specification/model information are represented using character-level TF-IDF features; categorical attributes are encoded through One-Hot representation, and numerical attributes are processed using logarithmic transformation and standardization. Six engineering attributes, including equipment name, specification/model information, technical category, measurement unit, number of installations per platform, and reference unit price, are incorporated into the fused feature space. In addition, a domain-knowledge-driven feature-group weighting mechanism is introduced to emphasize attributes that directly reflect functional and technical similarities, especially equipment names and specification/model information. K-Means clustering is then performed in the weighted fused feature space, and the number of clusters is determined by jointly considering the Silhouette Coefficient, Calinski–Harabasz index, Davies–Bouldin index, and cluster-size distribution. Experiments on 1345 practical ship equipment samples show that K = 36 provides a reasonable balance among clustering structure, candidate-set availability, engineering consistency, and stability under random initialization. Compared with the equal-weight scheme, Attribute-Weighted K-Means, K-Prototypes, and Gower-based hierarchical clustering, the proposed framework achieves higher equipment-name and specification/model similarities while maintaining meaningful technical-category consistency. These results indicate that the proposed framework can effectively identify latent functional and technical similarity relationships among ship equipment and provide candidate reference sets for reliability assessment under sparse failure data conditions.
MSC:
62H30
1. Introduction
The reliability of ship equipment is directly associated with the success rate of maritime mission execution. However, because timely support is difficult to secure at sea and both space and funding are constrained, ship equipment, particularly critical components, is subject to more stringent reliability requirements. Failures in high-reliability components occur infrequently or may not occur at all, and failure data may remain unavailable even after multiple maritime missions, posing a serious “no available data” challenge to traditional statistics-based reliability assessment methods. Ship equipment comprises a wide range of components, some of which may exhibit structural and functional similarities, and their reliability characteristics often follow similar patterns. This creates the possibility of inferring the reliability information of a target component from data derived from similar components. However, identifying which components can be regarded as similar has become an urgent issue requiring resolution.
Cluster analysis, as a key technique in unsupervised learning, has been widely applied across numerous domains. Traditional clustering methods are largely restricted to processing either numerical or non-numerical data [1]. However, real-world datasets frequently exhibit mixed characteristics [2]. Clustering mixed-type data has become one of the fundamental problems in big data environments, and its central challenge lies in simultaneously accommodating the distance information of numerical attributes and the discrete semantics of categorical attributes within a unified framework. A commonly adopted approach is feature transformation, in which categorical attributes are uniformly mapped to numerical values and then processed using conventional numerical clustering algorithms. For example, categorical features may be encoded through One-Hot encoding, target encoding, or frequency encoding, and then concatenated with standardized numerical features, after which methods such as K-Means or spectral clustering are applied [3]. To reduce the information loss associated with simple encoding schemes, another line of research has focused on designing dedicated similarity or distance measures for mixed attributes. The similarity coefficient proposed by Gower is one of the earliest general-purpose similarity measures for mixed-attribute data. It defines local similarities separately for numerical, categorical, and ordinal attributes and then computes an overall distance through weighted summation [4]. Compared with feature transformation and pure distance design, specialized clustering algorithms for mixed-type data have developed most rapidly over the past decade. The K-Prototypes algorithm proposed by Huang is widely regarded as one of the benchmark methods for handling data containing both numerical and categorical attributes. It establishes an objective function by linearly combining the Euclidean distance for numerical attributes with a simple dissimilarity measure for categorical attributes, such as 0/1 matching, thereby enabling direct partitional clustering of mixed-type data [5]. On this basis, Yu et al. proposed an improved K-Prototypes algorithm based on distributed centroids and a novel dissimilarity measure. This method accounts for differences in attribute importance by designing separate dissimilarity metrics for numerical and categorical attributes, thereby improving clustering accuracy for mixed-attribute data [6]. Mainstream research on mixed-type data clustering, both in domestic and international contexts, has largely assumed that mixed attributes consist only of numerical and categorical types, with method design, distance construction, and prototype representation predominantly focused on these two attribute types [7,8]. For unstructured attributes such as text, existing studies usually model textual content independently and then directly concatenate the resulting continuous vectors with numerical features for unified numerical clustering [9,10]. In text clustering, the measurement of text similarity requires careful consideration. Based on the underlying principles of different approaches, Wei et al. classified text similarity computation methods into five categories: string-based, word-vector-based, pre-trained-model-based, deep-learning-based, and other methods. They provided a concise introduction to each category and also compiled and analyzed commonly used datasets and evaluation criteria for text similarity computation [11]. To date, research specifically addressing the joint clustering of numerical, categorical, and textual attributes remains limited.
The evaluation of clustering results plays an important role in cluster analysis [12], and determining the optimal number of clusters and assessing clustering quality are key aspects of clustering validity evaluation. In the absence of external labels, researchers primarily rely on internal validity indices. Common internal indices based on the geometric structure of dataset samples include the Davies–Bouldin (DB) index [13,14], the Xie–Beni index [15], the Silhouette Coefficient (SC) [16], and the between-within proportion index [17]. In recent years, the reliability of traditional clustering validity indices for high-dimensional and noisy datasets has been extensively analyzed, and corresponding improvement methods have been proposed [18]. Among these indices, the SC evaluates clustering compactness and separation by calculating the difference in similarity between each sample and its own cluster and other clusters [19]. The Calinski–Harabasz (CH) index, also known as the variance ratio criterion, is calculated as the ratio of inter-cluster dispersion to intra-cluster dispersion, with a higher value generally indicating better clustering performance [14]. The DB index is calculated based on the distances between cluster centers and the internal dispersion of each cluster, with a lower value indicating better inter-cluster separation [19].
Accordingly, the objective of this study is not to claim that ship equipment records contain highly separable natural clusters, but to construct a transparent and reproducible similarity-grouping framework for heterogeneous engineering data. The contributions are threefold: (i) a unified feature-representation framework is designed for numerical, categorical, and textual attributes of ship equipment; (ii) domain knowledge is incorporated through equipment-name weighting to emphasize functional similarity; (iii) multiple internal validity indices and baseline methods are used to assess the relative improvement of the proposed representation.
2. Related Work
2.1. Mixed-Data Clustering Methods
Mixed-data clustering aims to group observations described by heterogeneous attributes, typically including numerical, categorical, ordinal, and sometimes textual variables. Unlike purely numerical clustering, mixed-data clustering must define similarity while respecting the statistical scale and semantic meaning of each attribute type. Recent studies have emphasized that directly converting all variables into a single numerical space may be computationally convenient but can also distort attribute semantics, especially when nominal categories are treated as ordered quantities [1,2,20]. Therefore, existing studies can be broadly divided into feature-transformation-based methods, distance-metric-based methods, dedicated mixed-data clustering algorithms, and representation-learning-based approaches.
2.1.1. Feature-Transformation-Based Methods
Feature-transformation-based methods first convert non-numerical attributes into numerical representations and then apply conventional numerical clustering algorithms. One-Hot encoding, frequency encoding, target encoding, and embedding-based representations are common examples. This strategy has the advantage of algorithmic simplicity and compatibility with efficient methods such as K-Means. However, the quality of the resulting clusters depends heavily on whether the transformed feature space preserves the original attribute semantics. In particular, label encoding may introduce artificial ordinal relationships among nominal categories under Euclidean distance, whereas One-Hot encoding better preserves categorical independence [1,2,21]. Recent work on categorical and mixed-type clustering also shows that categorical variables require dedicated similarity treatment because they do not possess natural order or numerical intervals [22]. In the present study, One-Hot encoding is therefore selected for categorical variables to avoid artificial ordinality while retaining the scalability of a unified feature-space representation.
2.1.2. Distance-Metric-Based Methods
A second research line constructs mixed-type distances by defining local similarity functions for different attribute types and then aggregating them. The Gower coefficient is a classical and widely used approach because it separately handles numerical, categorical, binary, and ordinal attributes before combining them into an overall similarity [4]. More recent studies have extended this idea through weighted Gower distances and adaptive metric-learning strategies. For example, weighted Gower-distance clustering has been shown to improve mixed-type segmentation by accounting for variable importance [2], while generalized multi-aspect and kernel-based metric-learning methods attempt to learn more flexible heterogeneous distances [10]. These methods have strong theoretical appeal because they explicitly respect attribute heterogeneity. Nevertheless, many distance-matrix-based approaches require storage and computation, which can become inefficient as the number of equipment records increases. Moreover, a precomputed distance matrix is not directly optimized by the standard K-Means objective. For this reason, the present study discusses Gower-distance-based clustering as an important baseline and future direction but adopts a unified feature-space strategy for the main implementation.
2.1.3. Dedicated Algorithms for Mixed Numerical and Categorical Data
Dedicated mixed-data clustering algorithms, especially K-Prototypes, have been widely used for datasets containing numerical and categorical variables. K-Prototypes combines the squared Euclidean distance for numerical attributes with simple matching dissimilarity for categorical attributes and introduces a trade-off parameter to balance the two components [5]. Recent studies further show that K-Prototypes remains attractive because of its interpretability and scalability, although its performance can be affected by initialization strategies, variable weighting, and the treatment of ordinal or missing variables [23,24]. However, the standard K-Prototypes framework does not directly model high-dimensional text representations such as TF-IDF vectors, nor does it explicitly distinguish between structured technical identifiers and semantic equipment names. Therefore, when textual fields are important, additional representation steps are still necessary. This limitation motivates the proposed framework, which first constructs numerical, categorical, structured-text, and TF-IDF representations and then integrates them in a unified weighted space.
2.1.4. Spectral, Density-Based, and Deep Clustering Alternatives
Other clustering paradigms have also been adapted to complex or mixed-type data. Spectral clustering has been extended to mixed-type data by replacing Euclidean similarity with heterogeneous dissimilarity measures and kernel functions [6,11]. Such methods can capture non-linear structures, but they often require careful similarity-matrix construction, kernel selection, and parameter tuning. Density-based methods such as DBSCAN can identify irregularly shaped clusters and noise points, but they are sensitive to neighborhood parameters and may suffer from distance concentration in high-dimensional sparse spaces. Deep clustering can learn low-dimensional representations before clustering, but it usually requires large corpora, substantial computing resources, and sufficient training data. These requirements are not fully consistent with the present ship-equipment scenario, where the sample size is moderate, domain text is specialized, and interpretability is essential for reliability assessment. Consequently, this study prioritizes a transparent feature-fusion framework over more complex black-box representation learning.
2.2. Heterogeneous Feature Fusion and Text Representation
Heterogeneous feature fusion seeks to combine different data modalities into a representation that preserves complementary information. In industrial records, numerical values may describe cost or usage intensity; categorical variables may reflect supply and technical classes, and text fields may contain functional names, models, and specification descriptors. A simple concatenation of these features is easy to implement but may underrepresent sparse or semantically important text features. Therefore, weighting mechanisms or domain-guided feature emphases are often needed to balance feature contributions [10]. In this study, the equipment name is assigned additional weight because it often directly conveys functional and technical similarity among ship equipment items.
For text representation, TF-IDF remains a widely used statistical method because it is computationally efficient, interpretable, and effective for small- or medium-sized domain corpora [25]. Word embeddings and Transformer-based models, such as BERT and Sentence-BERT, can provide richer semantic representations, but they require sufficient domain corpora and can be less transparent in engineering applications [26,27]. For ship equipment records, where terminology is specialized and sample size is limited, TF-IDF combined with structured information extraction offers a pragmatic balance between interpretability and discriminative ability. The proposed method therefore uses textual representations of equipment names and specification/model information, together with categorical and numerical engineering attributes.
2.3. Cluster Validity Evaluation and Interpretation
Cluster validity evaluation is essential in unsupervised learning because external labels are usually unavailable. Classical internal indices include the Silhouette Coefficient, Calinski–Harabasz Index, Davies–Bouldin Index, and Xie–Beni Index. Recent reviews emphasize that these indices should not be interpreted mechanically; rather, they reflect different aspects of compactness, separation, density, or geometric structure and may behave differently in high-dimensional, noisy, or overlapping datasets [28,29]. This issue is particularly relevant to ship equipment data, because functional similarity may vary continuously across equipment types and cluster boundaries may be inherently ambiguous [30]. Therefore, this study uses SC, CH, and DB jointly, and interprets them as relative evidence for selecting a reasonable similarity grouping rather than as proof that the data contain highly separated natural clusters.
The above literature shows that mixed-data clustering has been extensively studied for numerical-categorical data, and that many sophisticated distance measures and dedicated algorithms have been proposed. However, three limitations remain relevant to the ship-equipment reliability context. First, many existing methods focus mainly on numerical and categorical attributes and provide limited treatment of short technical text fields. Second, distance-metric-based methods may be computationally expensive or less directly compatible with efficient centroid-based clustering. Third, highly accurate cluster separation is not always realistic in engineering datasets where equipment functions, specifications, and usage patterns form overlapping continua. The present study addresses these issues by constructing a domain-guided multi-type feature-fusion framework that combines numerical, categorical, structured-text, and TF-IDF features; emphasizes equipment-name information through weighting; and interprets clustering results as engineering similarity groups that can support subsequent reliability assessment under sparse failure data.
3. Data Characteristics Analysis of Ship Equipment
The effectiveness of clustering largely depends on whether the selected attributes can adequately represent the intrinsic characteristics of the target objects. For ship equipment clustering, the selected attributes should satisfy two fundamental requirements: (1) they should provide sufficient information to characterize equipment properties and similarity relationships; (2) they should be practically available from existing equipment management records.
Based on these considerations, six attributes are selected for clustering analysis in this study. Among them, equipment name and specification/model information jointly define the identity and technical characteristics of ship equipment and serve as essential indicators for evaluating functional and structural similarities. The number of installations per platform and reference unit price are numerical attributes that describe equipment configuration scale and economic value, respectively. In addition, technical category and measurement unit are categorical attributes that further characterize equipment consumption patterns from the perspectives of professional domain classification, measurement methods, and partial physical characteristics.
These six attributes collectively describe the similarity structure among ship equipment from multiple dimensions, including functional characteristics, technical specifications, configuration requirements, economic properties, and management information. By integrating these heterogeneous attributes, a more comprehensive representation of equipment similarity can be established, providing the foundation for subsequent multi-type feature fusion and clustering analysis. The detailed definitions and data types of the selected attributes are presented in Table 1.
Table 1.
Shipboard equipment clustering attributes and preprocessing methods.
4. Clustering Method Based on Multi-Type Feature Fusion
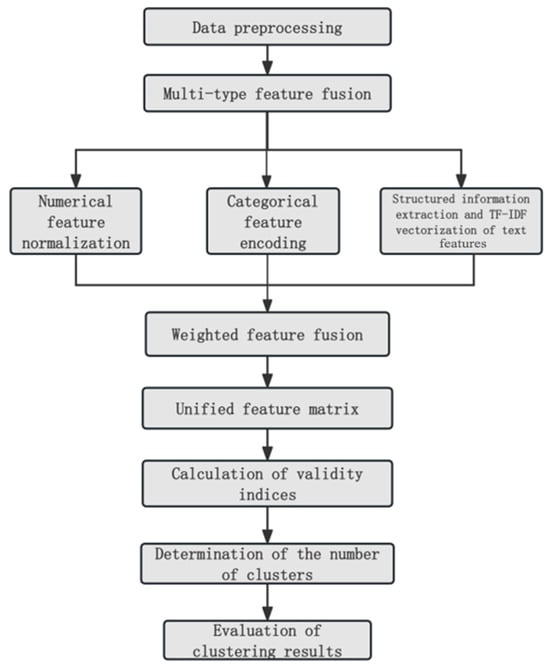
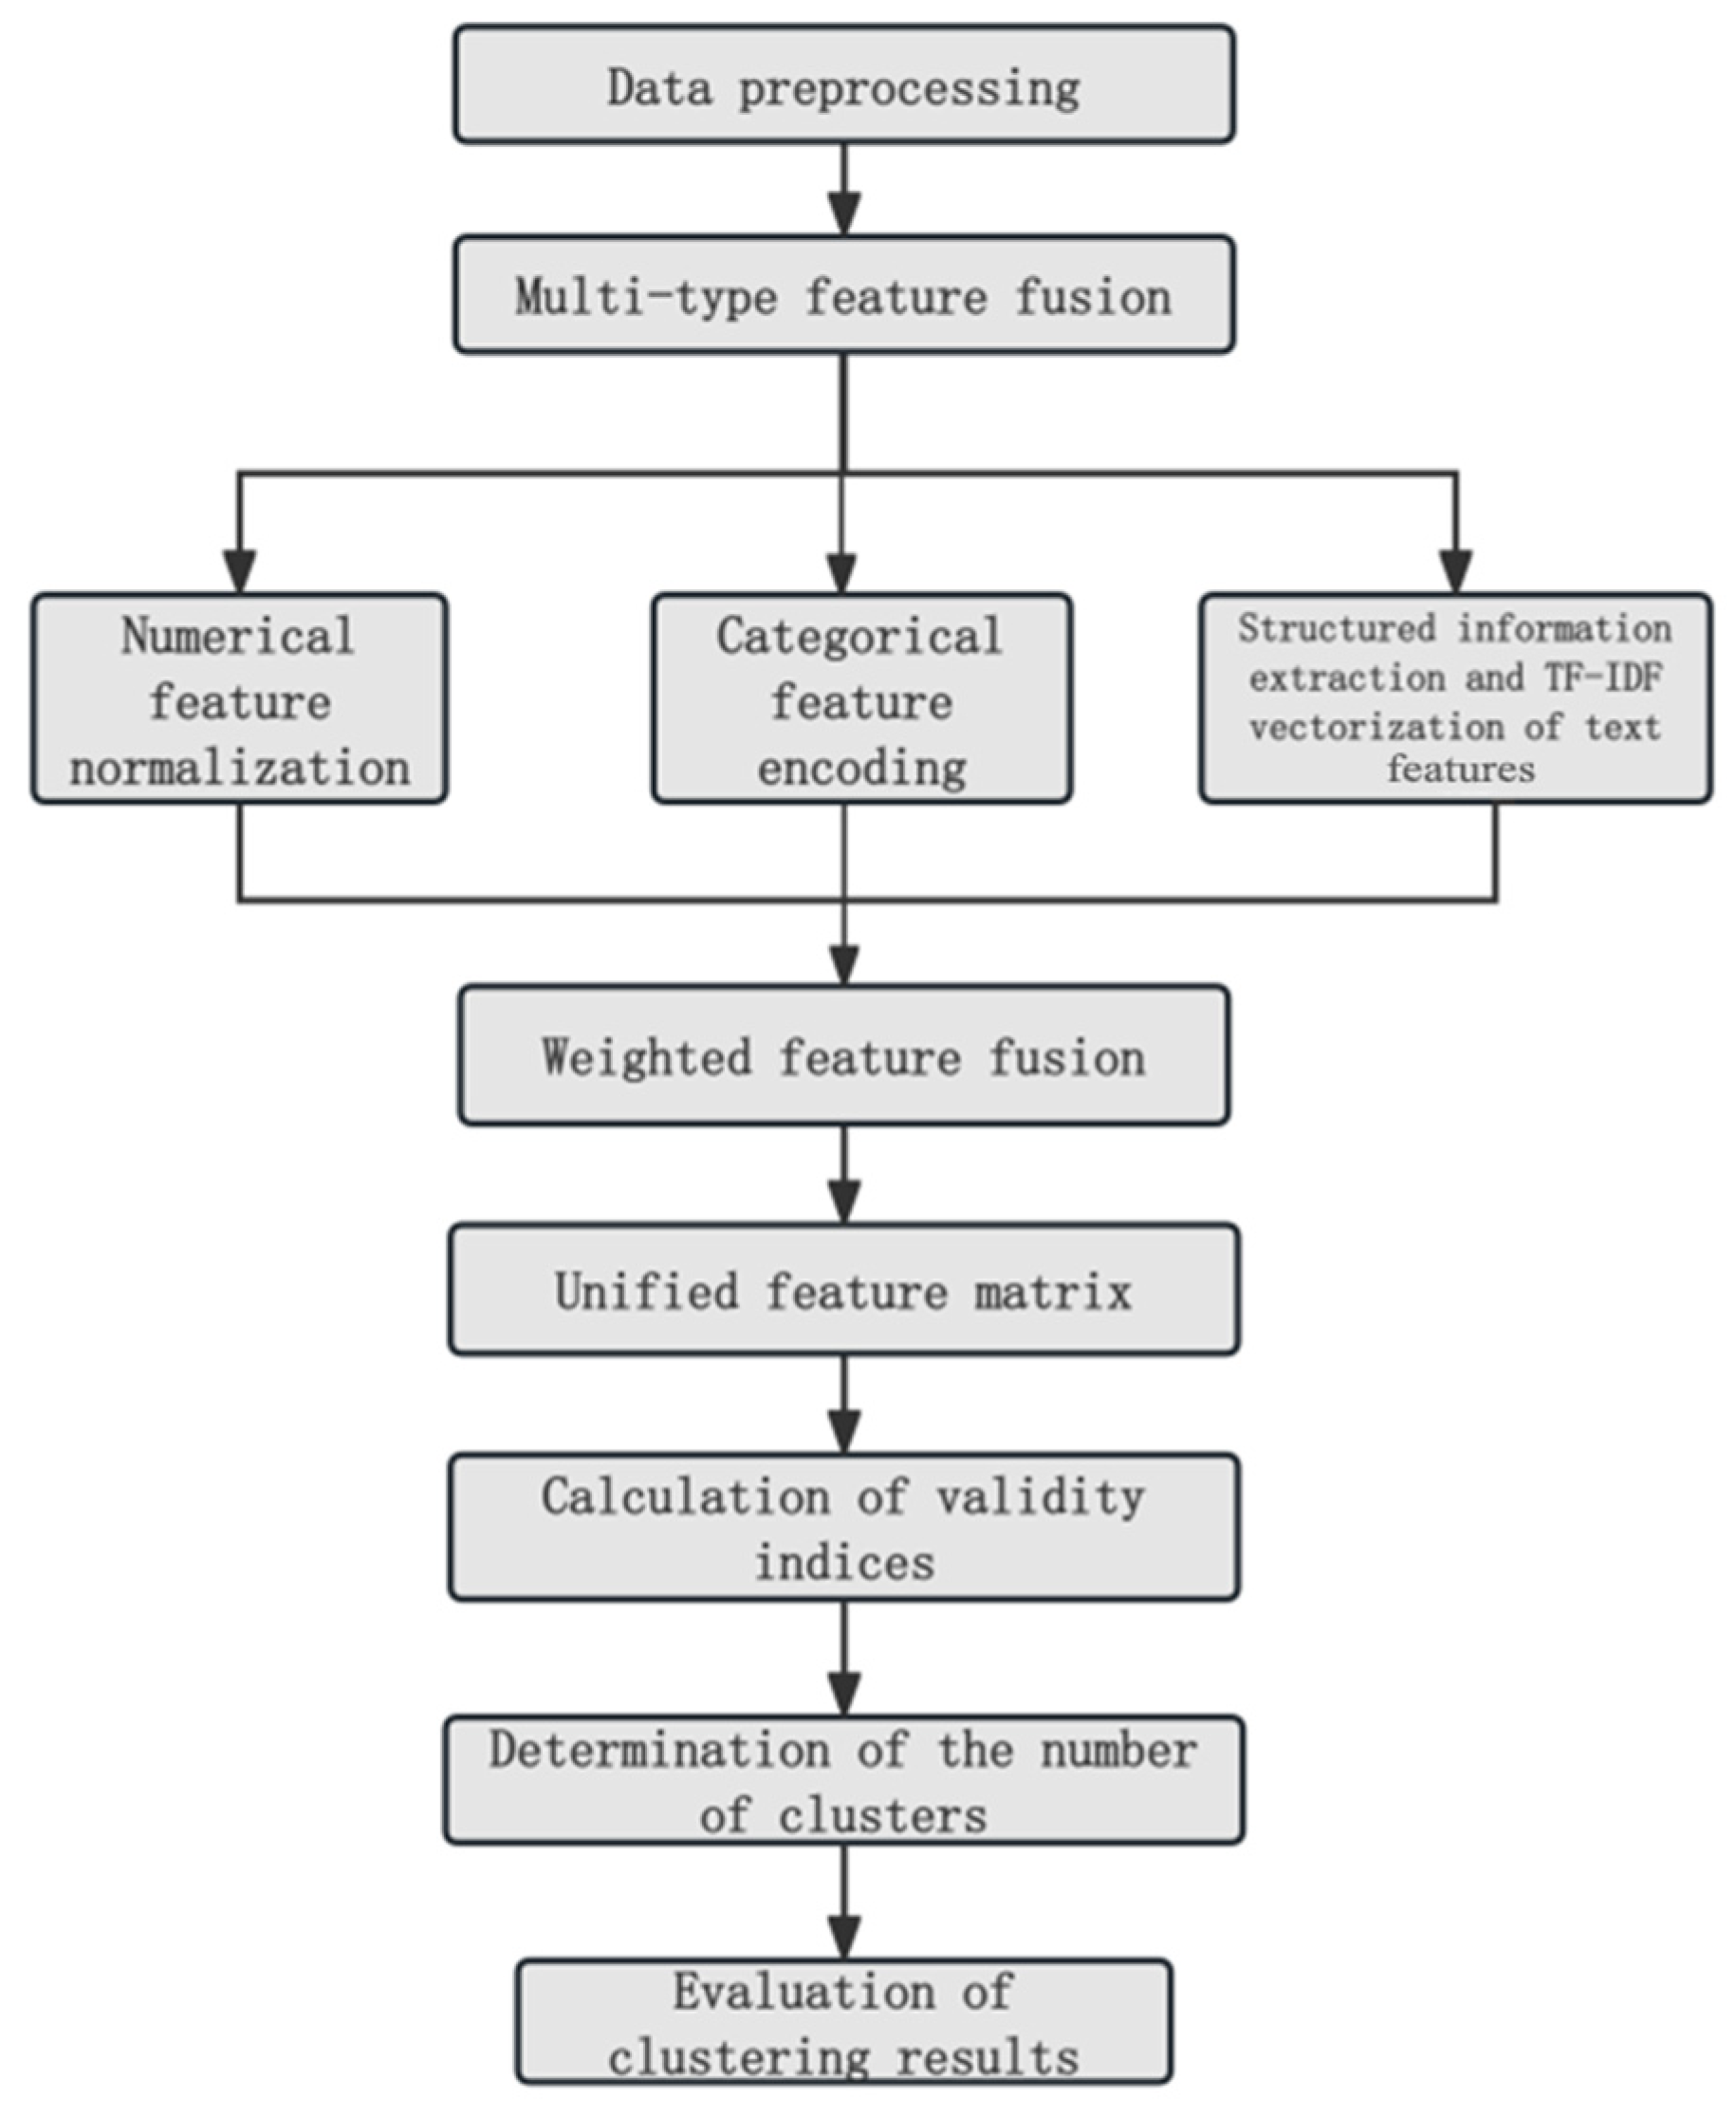
After performing feature analysis on the basic data of ship equipment, the ship equipment information undergoes several steps, including multi-type feature fusion, clustering algorithm selection and cluster number determination, and clustering result evaluation. The workflow of the clustering algorithm is shown in Figure 1.
Figure 1.
Flowchart of the proposed method.
4.1. Multi-Type Feature Fusion Method
For ship equipment data with multiple attributes, a multi-type feature fusion method is adopted. Numerical features are standardized, whereas categorical features are processed through One-Hot encoding. For critical textual features, a dual strategy combining structured information extraction and TF-IDF vectorization is applied, after which the processed features are integrated through weighted fusion.
4.1.1. Numerical Feature Processing
The number of installations per platform and the reference unit price are both non-negative numerical attributes. To reduce the scale differences caused by large numerical values, logarithmic transformation is first applied to the original numerical data. Let the original value of the sample for a numerical attribute be , which is defined as:
The addition of 1 in the transformation ensures that the logarithmic operation remains defined when . After logarithmic transformation, the mean and standard deviation of the corresponding attribute over all samples are calculated as:
When the condition is satisfied, the standardized feature is defined as:
The above transformation is independently applied to the number of installations per platform and the reference unit price, resulting in:
where μ and σ represent the mean and standard deviation of the two numerical attributes after logarithmic transformation, respectively. After preprocessing, both numerical features are introduced into the fused feature space as dimensionless scalars. The logarithmic transformation is employed to adjust the variable distribution and reduce the influence of extreme values, whereas standardization is used to eliminate differences in measurement units and scales. The relative importance of these two attributes in the final similarity representation is controlled through feature weighting.
4.1.2. Categorical Feature Processing
Both the technical category and measurement unit are nominal categorical variables without inherent numerical ordering. To avoid introducing artificial ordinal relationships among categories through integer encoding, One-Hot encoding is adopted to construct categorical feature vectors.
Assume that a categorical attribute contains possible values:
If the attribute value of the sample is , its One-Hot representation is expressed as:
where
According to the above definition, if two samples and belong to the same category, then their corresponding One-Hot vectors are identical; if their categories are different, the non-zero positions of the two vectors are different. Therefore,
where denotes the indicator function. Following this procedure, the technical category feature vector and measurement unit feature vector are obtained separately, where and represent the actual numbers of categories for the technical category and measurement unit attributes, respectively.
4.1.3. Text Feature Processing
The equipment name and specification/model information are short-text attributes that contain model identifiers, alphabetic combinations, and domain-specific technical terms. In this study, character-level n-grams are adopted as the basic textual units, and independent corpora are constructed for equipment names and specification/model information, respectively. Let the corpus corresponding to a specific textual field be:
Continuous character fragments with lengths of 2, 3, and 4 are extracted from each text field to construct the candidate character-level n-gram vocabulary. In the actual implementation, only character fragments appearing in at least two samples are retained. The maximum feature dimensions for equipment names and specification/model information are limited to 800 and 600, respectively.
Let the vector obtained from the TF-IDF representation of the i-th text sample be . The non-zero vectors are normalized, whereas zero vectors remain unchanged.
For two non-zero TF-IDF vectors, after normalization, the following relationship is obtained:
Therefore, under the condition of non-zero textual representations, the squared Euclidean distance in the normalized TF-IDF space has a deterministic correspondence with cosine dissimilarity. Independent vocabularies are constructed for equipment names and specification/model information, respectively, resulting in:
4.1.4. Feature-Weighted Fusion
After the above preprocessing procedures, the i-th sample is represented by six feature components:
Let the weights assigned to the six types of features be:
The baseline weight configuration adopted in this study is:
These weights correspond respectively to equipment name, specification/model information, technical category, measurement unit, number of installations per platform, and reference unit price. The weight configuration is predefined according to domain knowledge, and its sensitivity and practical effects are further examined through weight perturbation experiments and equal-weight comparison experiments.
The K-Means algorithm uses squared Euclidean distance as the basic distance measure in its objective function. If a feature vector is directly multiplied by a weigh , the contribution of this feature to the squared distance becomes . To ensure that the predefined weights appear as first-order coefficients in the squared Euclidean distance, a square-root scaling transformation is applied to each feature vector. For normalized textual features and One-Hot categorical features, their natural squared distances contain a coefficient of 2. Therefore, the corresponding feature vectors are multiplied by . Two standardized scalar numerical features are multiplied by . The final fused feature vector is defined as:
The dimension of the fused feature vector is:
To clarify the distance interpretation of the proposed scaling strategy, the textual feature difference is defined as:
When both TF-IDF vectors are non-zero, ; when zero vectors exist, the corresponding distance can still be directly calculated using the normalized Euclidean distance. Combining the distance relationship of categorical features under One-Hot encoding, the squared Euclidean distance between any two ship equipment samples in the final fused feature space can be expressed as:
where and represent the normalized textual feature differences in equipment names and specification/model information, respectively.Through this process, textual, categorical, and numerical attributes are transformed into a unified weighted feature representation that can be measured using squared Euclidean distance. Furthermore, each predefined weight directly corresponds to the contribution of the associated feature type to the final similarity calculation.
4.2. Clustering Algorithm and Optimal Cluster Number Determination
4.2.1. Clustering Algorithm Selection
Let the fused feature set of all ship equipment samples be defined as:
For a given cluster number , the fused feature set is partitioned into non-empty subsets . The optimization objective of K-Means is formulated as minimizing the within-cluster sum of squared errors:
where
denotes the centroid of the k-th cluster. Considering that the performance of K-Means is sensitive to the initialization of cluster centroids, multiple random initializations are performed during the optimization process. Among the obtained clustering solutions, the one achieving the minimum objective function value is retained as the final clustering result.
4.2.2. Determination of the Optimal Number of Clusters
The determination of the cluster number is a critical step in the proposed framework. It not only influences the intra-cluster compactness and inter-cluster separation within the fused feature space but also directly determines the size of the candidate reference set available for subsequent similarity-based reliability assessment. Therefore, the cluster number is not determined solely according to the optimum value of an individual internal validity index. Instead, a comprehensive evaluation strategy integrating clustering validity metrics and cluster-size characteristics is adopted.
Let the candidate cluster-number set be defined as . For each , K-Means clustering is performed under the same fused feature representation and algorithmic configuration. The Silhouette Coefficient (SC), Calinski–Harabasz (CH) index, and Davies–Bouldin (DB) index are subsequently calculated to evaluate clustering performance from different perspectives. Meanwhile, the size of the k-th cluster is denoted:
Furthermore, the minimum cluster size, maximum cluster size, and median cluster size are considered, which are defined as:
For a predefined reference size threshold , the number of small-size clusters is defined as:
The values and are used to describe the degree of clustering fragmentation under different values; these two values are solely intended to assist in observing changes in the cluster size structure. They are not employed as rigid criteria for determining clustering validity.
An excessively small value of may result in clusters containing a large number of heterogeneous equipment items, thereby increasing engineering discrepancies within the candidate reference sets. Conversely, an excessively large value of may generate numerous small-size clusters, reducing the availability of sufficient reference equipment for target items. Therefore, the final cluster number is determined by jointly considering the variation trends of SC, CH, and DB, together with the minimum, median, and maximum cluster sizes and the number of small-size clusters.
4.3. Evaluation and Analysis of Clustering Results
Since no predefined ground-truth labels are available in this study, the clustering results are evaluated from three complementary perspectives: internal validity, engineering consistency, and stability under random initialization.
- Internal Validity Evaluation
The internal validity of the clustering results is evaluated using the Silhouette Coefficient (SC), Calinski–Harabasz (CH) index, and Davies–Bouldin (DB) index. In general, higher values of SC and CH indicate better intra-cluster compactness and inter-cluster separation, whereas lower values of DB correspond to more compact and well-separated clustering structures.
The three indices characterize the geometric properties of the fused feature space from different perspectives. Therefore, SC, CH, and DB are jointly considered in this study to analyze the variation trends of clustering performance, rather than treating any single index as a sufficient criterion for determining clustering validity.
- 2.
- Engineering Consistency Evaluation
Internal validity indices primarily reflect the geometric distance structure within the fused feature space and cannot independently determine whether equipment items within the same cluster exhibit meaningful engineering consistency. Therefore, additional engineering-oriented evaluation metrics are introduced, including the intra-cluster cosine similarity of equipment names, the intra-cluster cosine similarity of specification/model information, technical-category purity, and measurement-unit purity.
For a specific textual feature, let the normalized TF-IDF vector be . The cosine similarity between any two non-zero textual vectors is defined as:
For normalized non-zero vectors, we have . The text-based engineering consistency metric is then defined as the average cosine similarity over all unordered sample pairs within the same cluster:
This metric is calculated separately in the TF-IDF spaces of equipment names and specification/model information, yielding the name cosine similarity and specification/model cosine similarity, respectively.
For categorical attributes, let the category value of the i-th sample be . The number of samples belonging to the most frequent category within the k-th cluster is defined as:
The overall purity is calculated as:
A higher purity value indicates stronger concentration of categorical attributes within clusters. However, technical category and measurement unit play different engineering roles in describing equipment similarity. In particular, measurement units mainly reflect metrological and management characteristics rather than functional similarity. Therefore, categorical purity is used only to characterize the engineering attribute distribution of the clustering results. The clustering process itself is evaluated and selected primarily based on the distance structure of the fused feature space and clustering validity indices, rather than optimizing categorical purity as an independent objective.
- 3.
- Clustering Stability Evaluation
Since K-Means relies on the initialization of cluster centroids, different random initializations may lead to different locally optimal partitions. To evaluate clustering robustness, repeated clustering experiments are conducted while keeping the feature representation and the number of clusters unchanged. The Adjusted Rand Index (ARI) and Normalized Mutual Information (NMI) are employed to quantify the consistency among different clustering partitions.
Let the two clustering results be represented as and . The contingency table elements and marginal sample counts are defined as:
Let:
Then, the ARI is defined as:
When two clustering partitions are completely identical, ARI equals 1; an ARI value close to 0 indicates that the agreement between two partitions approaches the expected level of random assignment. Furthermore, let , and ; the mutual information between two clustering partitions is defined as:
where only terms satisfying the corresponding non-zero conditions are considered in the summation. The entropy values of the two partitions are defined as:
Using arithmetic-mean normalization, NMI is defined as:
A larger NMI value indicates that the two clustering partitions share more common information structures. Compared with NMI, ARI is more sensitive to whether individual sample pairs maintain the same cluster assignments. Therefore, the joint use of ARI and NMI provides a more comprehensive characterization of clustering stability under different initializations.
In addition to ARI and NMI, the mean values, standard deviations, and coefficients of variation in SC, CH, and DB are also calculated across repeated experiments. For any positive evaluation metric , its coefficient of variation is defined as:
where and denote the sample mean and sample standard deviation of metric obtained from repeated experiments, respectively. Accordingly, internal validity, engineering consistency, and stability under random initialization jointly constitute the evaluation framework for the clustering results.
5. Case Study
5.1. Experimental Settings
The experimental dataset consists of 1345 valid ship equipment samples. All selected attributes were complete for the final 1345 samples, and no missing-value or duplicate removal was required. The equipment name and specification/model information are represented using character-level TF-IDF features, with the character n-gram range set to 2–4, the minimum document frequency set to 2, and the maximum feature dimensions limited to 800 and 600, respectively. The technical category and measurement unit attributes are encoded using One-Hot representation, whereas the number of installations per platform and reference unit price are logarithmically transformed and subsequently standardized. The six feature components, namely equipment name, specification/model information, technical category, measurement unit, number of installations per platform, and reference unit price, are assigned weights of 0.40, 0.25, 0.15, 0.05, 0.05, and 0.10, respectively, to construct the weighted fused feature space.
The K-Means algorithm is employed for clustering. To reduce the influence of random initialization, the random seed is fixed at 42. In total, 20 initializations are performed for each clustering run, and the maximum number of iterations is set to 500. The candidate range of cluster numbers is defined as K = 10,12,⋯,100, and the final cluster number is determined by jointly considering the SC, CH, and DB indices together with cluster-size distribution characteristics.
The clustering results are evaluated by considering both internal validity and engineering consistency. Specifically, SC, CH, and DB indices are used to assess the clustering structure within the fused feature space, while intra-cluster cosine similarity of equipment names and specification/model information, technical-category purity and measurement-unit purity are employed to evaluate the engineering consistency of equipment items within the same cluster.
5.2. Sensitivity Analysis of Feature Weights
To investigate the influence of predefined feature weights on clustering performance, relative perturbation experiments are conducted based on the baseline weight configuration: (0.40,0.25,0.15,0.05,0.05,0.10). For each feature component under investigation, its corresponding weight is multiplied by a perturbation coefficient c ∈ {0.50,0.75,1.00,1.25,1.50}. After perturbation, all feature weights are renormalized to ensure that their sum remains equal to 1. The cluster number is fixed at K = 36, while all other K-Means parameters remain unchanged. The variations in clustering validity indices under different feature-weight perturbations are presented in Table 2.
Table 2.
Changes in clustering indices under relative-weight perturbations of individual features.
The results presented in Table 2 indicate that different feature-weight variations have distinct effects on SC, CH, and DB. Among all feature components, changes in the weights of equipment name and specification/model information exert a relatively stronger influence on clustering structures, whereas perturbations of auxiliary categorical features, such as technical category and measurement unit, have comparatively limited effects. Although certain weight adjustments may improve individual validity indices—for example, reducing the weights of specification/model information or reference unit price may decrease the DB value—they may simultaneously result in imbalanced cluster-size distributions. Therefore, determining feature weights solely based on a single internal validity index may not produce a clustering structure suitable for subsequent similarity-based information transfer among equipment items.
A comprehensive analysis reveals that no single weight configuration simultaneously optimizes SC, CH, and DB. Therefore, the baseline weight configuration adopted in this study should not be interpreted as a globally optimal solution in terms of internal validity indices. Instead, it represents a domain-knowledge-driven weighting scheme determined according to the relative engineering importance of different equipment attributes.
5.3. Determination of the Number of Clusters
The cluster number K directly determines the granularity of equipment grouping and the size of the candidate reference set for similar equipment. A relatively small K may result in excessive numbers of equipment items within each cluster, thereby increasing internal engineering heterogeneity. Conversely, an excessively large K may generate numerous small-size clusters and reduce the availability of sufficient reference equipment. Therefore, the final cluster number is determined by jointly considering clustering validity indices and cluster-size characteristics. A search is conducted within the range of K = 10~100, and representative results are summarized in Table 3.
Table 3.
Internal validity indices and cluster sizes under different numbers of clusters.
The results in Table 3 show that as K increases, SC generally exhibits an increasing trend; DB gradually decreases, whereas CH shows an overall decreasing tendency. These three indices therefore do not provide a consistent optimal cluster number. Although larger values of K can improve intra-cluster compactness, they also reduce cluster sizes and increase the number of small-size clusters. When K = 36, the SC value is 0.179861; the DB value is 2.156935; the maximum cluster size is 117, and the median cluster size is 31.5. This configuration achieves a favorable balance between clustering validity and the size of the candidate reference set. Although further increasing K may continue to improve SC and DB, it also substantially increases the number of small-size clusters, which may lead to insufficient reference equipment for subsequent analyses. Considering that the objective of clustering in this study is to construct similarity-based equipment candidate sets for subsequent reliability information fusion rather than to generate excessively fine-grained classifications, K = 36 is selected as the final cluster number. This selection represents a compromise between clustering quality and candidate-set availability.
5.4. Analysis of Clustering Results
After determining the cluster number as K = 36, the proposed feature-fusion scheme and K-Means configuration are applied to cluster the 1345 ship equipment samples. The clustering results are further analyzed from three perspectives: cluster-size distribution, engineering consistency, and clustering stability.
5.4.1. Cluster-Size Distribution
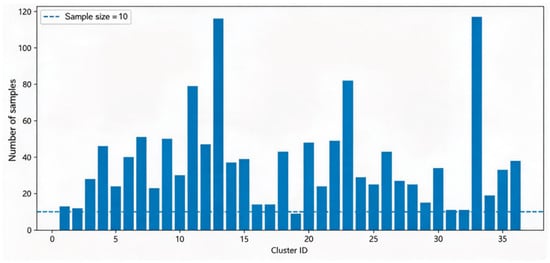
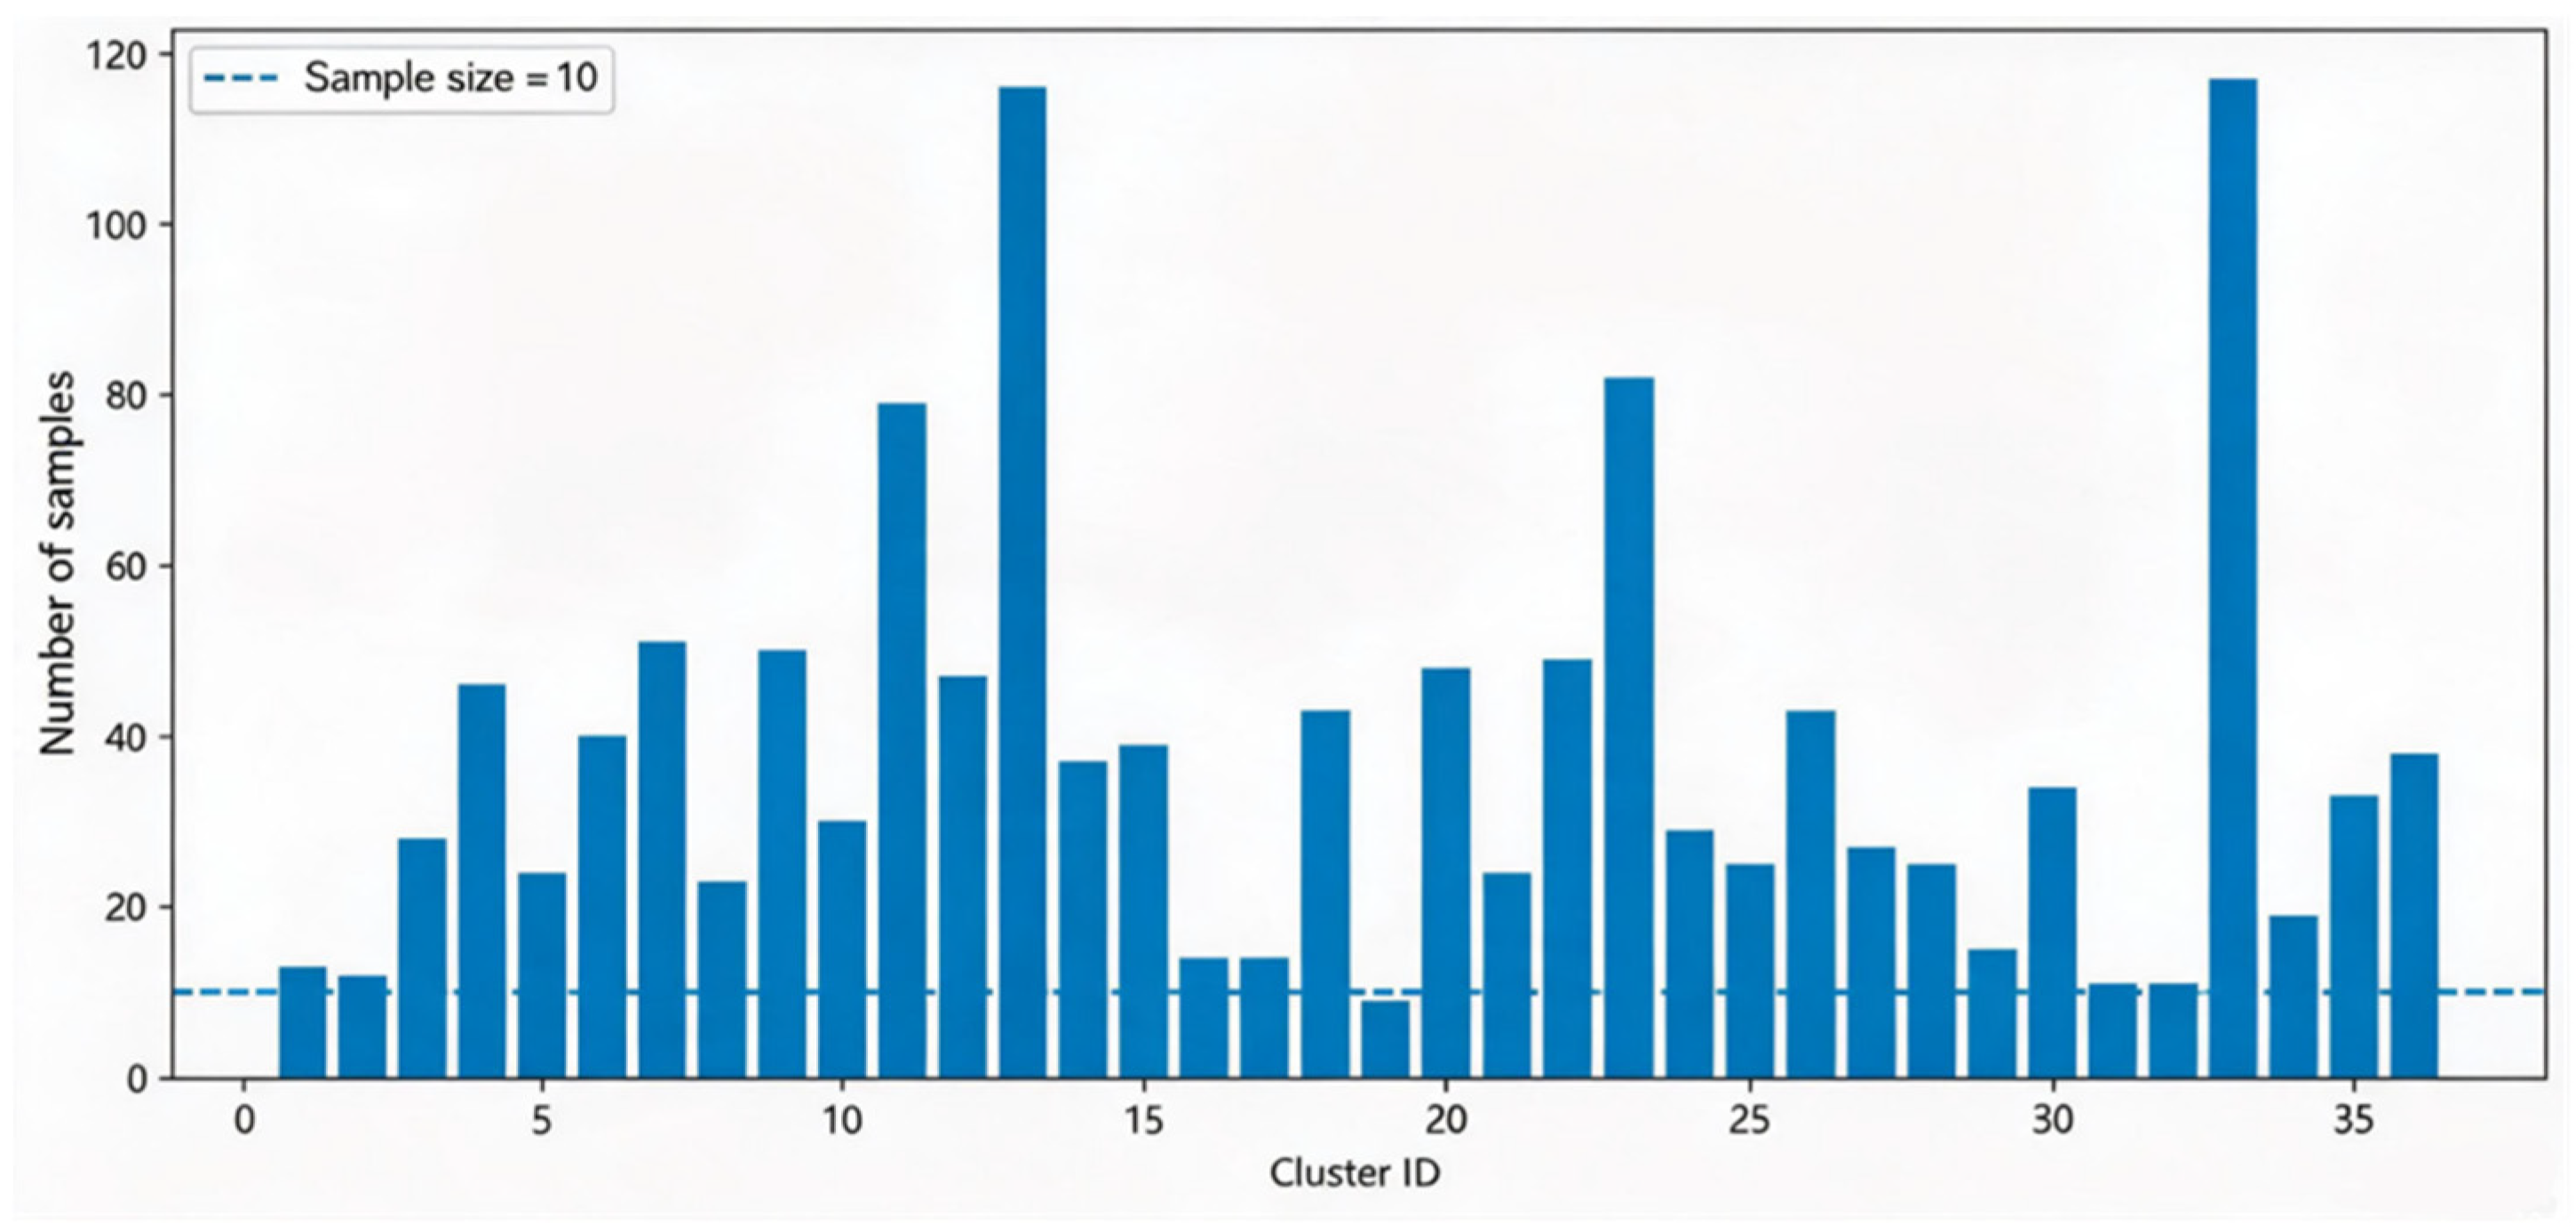
The final clustering result contains 36 equipment clusters. The minimum cluster size is 9, the median cluster size is 31.5, and the maximum cluster size is 117. No cluster contains fewer than five samples, and only one cluster contains fewer than ten samples. Overall, the cluster-size distribution remains well balanced, without generating a large number of fragmented small clusters or excessively large clusters.
As illustrated in Figure 2, most equipment clusters contain sufficient samples to support further selection of similar reference equipment within the same cluster. Compared with larger cluster numbers, K = 36 avoids excessive fragmentation; compared with smaller cluster numbers, it effectively controls the cluster size and improves the engineering applicability of the candidate reference sets.
Figure 2.
Sample-size distribution of clusters at K = 36.
5.4.2. Representative Cluster Profiles
To further illustrate the engineering interpretability of the clustering results, representative cluster profiles are analyzed. While clustering validity indices provide quantitative evaluations, they cannot directly reveal the practical meanings of individual clusters. Therefore, eight representative clusters are selected from the final clustering result (K = 36) for detailed analysis.
As shown in Table 4, the obtained clusters exhibit clear functional and structural similarities. For example, the first cluster mainly contains digital-to-analog conversion-related boards, including digital-to-analog conversion polarity switch boards and control logic boards, with corresponding specification/model terms such as DA-PW and DA-LC. Both professional-category purity and measurement-unit purity reach 1.0, indicating strong engineering consistency within this cluster. Similarly, the power module cluster groups different voltage conversion modules with similar functional characteristics, demonstrating that the proposed method can identify equipment similarity beyond exact name matching.
Table 4.
Representative profiles of selected ship equipment clusters.
Some clusters contain equipment with different names but related technical roles. For example, computer-board-related equipment with different naming expressions is grouped together due to their similar functional characteristics and specification patterns. This indicates that the combination of character-level text representation and domain-guided feature weighting can capture latent engineering relationships among equipment items.
Overall, the representative cluster profiles demonstrate that the proposed framework can generate meaningful equipment groups based on functional and technical similarity rather than simple attribute matching, providing interpretable candidate sets for subsequent reliability analysis.
5.4.3. Engineering Consistency Analysis
To evaluate whether the obtained clusters possess meaningful engineering interpretations, four engineering consistency metrics are calculated: intra-cluster cosine similarity of equipment names, intra-cluster cosine similarity of specification/model information, technical-category purity, and measurement-unit purity. Meanwhile, 100 random grouping experiments with identical cluster-size distributions are conducted as a baseline comparison. The results are presented in Table 5.
Table 5.
Engineering-consistency comparison between the proposed clustering result and random grouping.
The results in Table 5 demonstrate that the proposed clustering approach consistently outperforms random grouping across all four engineering consistency metrics. Specifically, the equipment-name cosine similarity increases from 0.023208 to 0.193760, while the specification/model cosine similarity increases from 0.022718 to 0.154359. These improvements indicate that the fused feature space is capable of effectively grouping equipment items with similar functional characteristics, structural information, and model-related attributes. Furthermore, the technical-category purity increases from 0.581554 to 0.870632, and the measurement-unit purity improves from 0.647100 to 0.801487, indicating that the resulting clusters exhibit strong consistency in engineering attributes.
Overall, the 36 equipment clusters obtained by the proposed method are not formed randomly. Instead, they demonstrate clear engineering similarity in critical attributes, including equipment names, specification/model information, and technical categories. Therefore, these clusters can serve as meaningful candidate reference sets for subsequent reliability information fusion.
5.4.4. Clustering Stability Analysis
Considering the sensitivity of K-Means to centroid initialization, repeated clustering experiments are conducted using 30 different random seeds while maintaining K = 36, the feature representation, and all other algorithmic parameters unchanged. The clustering stability is evaluated from two aspects: the variability of internal validity indices and the consistency of cluster assignments. The results are summarized in Table 6.
Table 6.
Stability results of 30 repeated clustering runs at K = 36.
Across the 30 repeated experiments, the coefficients of variation for SC, CH, and DB are 3.031%, 0.959%, and 3.219%, respectively, indicating limited fluctuations in the internal clustering structure. Compared with the reference random seed, both ARI and NMI maintain relatively high values. In particular, the mean NMI value reaches 0.785802, demonstrating that the global information structure of clustering partitions remains highly consistent under different initializations.
5.5. Analysis of Feature-Weighting Mechanism
The feature-weight sensitivity analysis indicates that different feature weights influence the distance structure of the fused feature space. To further verify whether the domain-knowledge-driven feature-weighting mechanism improves clustering performance, an equal-weight comparison experiment is conducted. Except for feature weighting, all preprocessing procedures, the cluster number, and K-Means parameters are kept identical. The weighted scheme adopts (0.40,0.25,0.15,0.05,0.05,0.10) whereas the equal-weight scheme assigns identical weights to all six attribute types.
5.5.1. Comparison of Internal Validity
The internal validity comparison between the two weighting schemes is presented in Table 7.
Table 7.
Internal validity comparison of weighted and equal-weight schemes.
As shown in Table 7, the weighted scheme achieves SC and CH values of 0.179861 and 35.995673, respectively, both exceeding those obtained by the equal-weight scheme (0.125394 and 31.491564). Meanwhile, the DB value decreases from 2.661584 to 2.156935. These results indicate that introducing feature weights improves both intra-cluster compactness and inter-cluster separation within the fused feature space. However, internal validity indices depend on the underlying feature representation and distance definition. Therefore, they only characterize structural differences among clustering schemes in the fused space and should be complemented with engineering consistency analysis when assessing practical applicability.
5.5.2. Comparison of Engineering Consistency
The engineering consistency of the two weighting schemes is further compared, and the results are summarized in Table 8.
Table 8.
Engineering-consistency and cluster-size comparison of weighted and equal-weight schemes.
The results in Table 8 show that the weighted scheme outperforms the equal-weight scheme in equipment-name cosine similarity, specification/model cosine similarity, and technical-category purity. Specifically, the equipment-name cosine similarity increases from 0.148335 to 0.193760, while the specification/model cosine similarity increases from 0.129822 to 0.154359. These improvements demonstrate that increasing the contribution of textual attributes within the fused feature space enhances the aggregation of equipment items with similar functional and structural characteristics. Although the equal-weight scheme achieves slightly higher measurement-unit purity, measurement units mainly represent management and metrological characteristics rather than direct functional or structural similarity. Therefore, measurement-unit purity is not considered the primary optimization objective for identifying similar equipment. The two schemes exhibit comparable cluster-size distributions, and neither generates significant fragmented clusters. This indicates that the weighted scheme improves engineering consistency without sacrificing cluster size structure.
Overall, the combined analysis of internal validity and engineering consistency demonstrates that the feature-weighting mechanism effectively enhances the contribution of critical attributes, such as equipment names and specification/model information, thereby improving the suitability of the obtained clusters for constructing candidate sets of similar equipment.
5.6. Comparative Experimental Analysis
To further validate the effectiveness of the proposed method for heterogeneous ship equipment data, four representative clustering approaches for mixed-type or weighted feature clustering are selected as comparison methods, including One-Hot + K-Means, Attribute-Weighted K-Means (AW-KMeans), K-Prototypes, and Gower + hierarchical clustering. All five methods are evaluated using the same dataset containing 1345 ship equipment samples and the same six engineering attributes. The number of clusters is fixed at K = 36 for all methods. Among the benchmark methods, One-Hot + K-Means transforms categorical and textual attributes into numerical representations before applying conventional K-Means clustering, where all feature dimensions are assigned equal importance. AW-KMeans introduces attribute weights into the K-Means objective function and automatically learns feature importance from the data distribution, representing a typical data-driven feature weighting strategy. K-Prototypes simultaneously handles numerical and categorical attributes by combining numerical distances with categorical dissimilarities, whereas Gower + hierarchical clustering performs hierarchical clustering based on mixed-type attribute distances. The proposed method constructs a unified fused feature space by integrating character-level TF-IDF representations, One-Hot-encoded categorical attributes, standardized numerical features, and domain-knowledge-driven feature weights, followed by K-Means clustering. To ensure engineering-level comparability, all methods are further evaluated using the same engineering consistency metrics, including equipment-name cosine similarity, specification/model cosine similarity, technical-category purity, and measurement-unit purity.
As shown in Table 9, the proposed method achieves the highest similarity values in both equipment-name and specification/model information among all comparison methods. Specifically, the equipment-name cosine similarity reaches 0.193760, exceeding those obtained by One-Hot + K-Means (0.114064), AW-KMeans (0.146825), K-Prototypes (0.100896), and Gower + hierarchical clustering (0.046349). Similarly, the specification/model cosine similarity reaches 0.154359, demonstrating that the proposed framework provides superior capability in capturing textual similarity relationships among ship equipment.
Table 9.
Engineering-consistency comparison of different clustering methods.
Compared with One-Hot + K-Means, AW-KMeans improves both textual similarity and categorical consistency by automatically learning feature importance from data distribution. The equipment-name cosine similarity and specification/model cosine similarity of AW-KMeans reach 0.146825 and 0.126743, respectively, which are higher than those of the equal-weight K-Means method. This indicates that adaptive feature weighting can effectively reduce the influence of less informative attributes. However, the proposed method still achieves higher textual consistency than AW-KMeans, suggesting that automatically learned weights based only on statistical characteristics cannot fully capture the engineering semantics embedded in ship equipment descriptions.
Gower + hierarchical clustering achieves the highest technical-category purity (0.987361) and measurement-unit purity (0.995539), indicating its strong capability in preserving categorical attribute consistency. However, its relatively low equipment-name cosine similarity (0.046349) and specification/model cosine similarity (0.039971) suggest that the resulting clusters are more strongly influenced by categorical similarity rather than textual and functional similarities. Therefore, although Gower-based clustering maintains high consistency in management-related attributes, it is less effective in identifying latent functional relationships among equipment items.
The proposed method achieves a technical-category purity of 0.870632, which is higher than One-Hot + K-Means (0.854275) and K-Prototypes (0.837175), while maintaining the highest textual consistency among all methods. Although its measurement-unit purity (0.801487) is lower than some comparison methods, measurement units mainly represent management and metrological characteristics rather than intrinsic equipment functionality. Therefore, the lower measurement-unit purity does not compromise the objective of constructing engineering-similar equipment groups for subsequent reliability assessment.
Overall, the proposed method effectively integrates textual, categorical, and numerical attributes while introducing domain-knowledge-driven feature weighting. This strategy enhances the contribution of critical attributes, particularly equipment names and specification/model information.
6. Conclusions
Reliability assessment of ship equipment is often constrained by the scarcity or absence of failure data, particularly for highly reliable equipment with extremely low failure frequencies. To address this challenge, this study proposes a multi-type feature fusion clustering framework for heterogeneous ship equipment data. By constructing similarity-based equipment groups, the proposed method provides a data foundation for subsequent reliability assessment using historical information from similar equipment. The proposed framework integrates numerical, categorical, and textual attributes through a unified feature representation strategy. Specifically, different data types are processed using appropriate representation methods, and a domain-knowledge-driven feature-weighting mechanism is introduced to enhance the contribution of critical attributes during clustering. The resulting fused feature space simultaneously captures functional characteristics, technical properties, and configuration information of ship equipment, thereby improving the identification of similar equipment items.
The main contributions and conclusions of this study are summarized as follows:
- (1)
- To address the coexistence of multiple attribute types in ship equipment data, a unified feature representation method integrating numerical, categorical, and textual information is developed. By applying type-specific preprocessing strategies and feature-weighted fusion, the proposed representation effectively captures functional, technical, and configuration characteristics of the equipment and improves similarity identification performance.
- (2)
- To overcome the difficulty of determining the cluster number using a single evaluation criterion, a multi-index cluster number determination strategy is proposed. By jointly considering internal validity indices, including SC, CH, and DB, together with cluster-size characteristics, the proposed strategy reduces the bias caused by individual evaluation metrics and achieves a balance between clustering quality and candidate reference-set availability.
- (3)
- A complete ship equipment clustering framework is established, including data preprocessing, multi-type feature fusion, clustering implementation, and result evaluation. Experimental validation using real ship equipment data demonstrates that the obtained equipment clusters exhibit strong interpretability in terms of name similarity, specification/model similarity, and engineering attribute consistency. Therefore, the proposed framework can generate engineering-meaningful candidate sets of similar equipment.
The proposed research provides practical support for engineering applications. For highly reliable ship equipment with limited or unavailable failure data, existing reliability information from similar equipment can be incorporated through approaches such as Bayesian estimation and empirical Bayes methods, thereby alleviating the challenges associated with reliability parameter estimation under small-sample conditions.
Future research will focus on three directions. First, more advanced and interpretable text representation methods will be explored to improve the characterization of professional terminology and technical semantics in ship equipment data. Second, expert knowledge and semi-supervised constraint mechanisms will be incorporated to further enhance the engineering validity of similarity-based equipment grouping. Third, the clustering results will be further integrated with reliability assessment models to quantitatively evaluate the practical contribution of similarity grouping to reliability analysis.
Author Contributions
Conceptualization, R.Y. and Y.Z.; methodology, R.Y.; validation, R.Y., Y.Z. and Z.G.; formal analysis, R.Y. and S.S.; data curation, Z.G.; writing—original draft preparation, R.Y.; writing—review and editing, Y.Z. and S.S. All authors have read and agreed to the published version of the manuscript.
Funding
This research received no external funding.
Data Availability Statement
The data supporting the findings of this study involve secrets and are classified as confidential. As such, they are not publicly available. Access to the data is restricted to authorized personnel only. Further inquiries regarding data access should be directed to the corresponding authors.
Conflicts of Interest
The authors declare no conflicts of interest.
References
- Wei, M.; Chow, T.W.S.; Chan, R.H.M. Clustering heterogeneous data with k-means by mutual information-based unsupervised feature transformation. Entropy 2015, 17, 1535–1548. [Google Scholar] [CrossRef] [Scilit]
- Liu, P.; Yuan, H.; Ning, Y.; Chakraborty, B.; Liu, N.; Peres, M.A. A modified and weighted Gower distance-based clustering analysis for mixed type data: A simulation and empirical analyses. BMC Med. Res. Methodol. 2024, 24, 305. [Google Scholar] [CrossRef] [Scilit] [PubMed]
- Mousavi, E.; Sehhati, M. A generalized multi-aspect distance metric for mixed-type data clustering. Pattern Recognit. 2023, 138, 109353. [Google Scholar] [CrossRef] [Scilit]
- Gower, J.C. A general coefficient of similarity and some of its properties. Biometrics 1971, 27, 857–871. [Google Scholar] [CrossRef] [Scilit]
- Huang, Z. Extensions to the k-means algorithm for clustering large data sets with categorical values. Data Min. Knowl. Discov. 1998, 2, 283–304. [Google Scholar] [CrossRef] [Scilit]
- Yu, W.L.; Yu, J.J.; Fang, J.W. K-prototypes clustering algorithm for mixed attribute data. Comput. Syst. Appl. 2015, 24, 168–172. [Google Scholar]
- Zhang, Y.; Zhao, M.; Chen, Y.; Lu, Y.; Cheung, Y. Learning unified distance metric for heterogeneous attribute data clustering. Expert Syst. Appl. 2025, 273, 126738. [Google Scholar] [CrossRef] [Scilit]
- Zhang, Y.; Zou, R.; Zhang, Y.; Zhang, Y.; Cheung, Y.; Li, K. Adaptive micro partition and hierarchical merging for accurate mixed data clustering. Complex Intell. Syst. 2024, 11, 84. [Google Scholar] [CrossRef] [Scilit]
- Silva, S.D.F.; Reis, D.C.J.; Reis, S.D.M. Enhancing clustering stability, compactness, and separation in multimodal data environments. Data Knowl. Eng. 2026, 162, 102536. [Google Scholar] [CrossRef] [Scilit]
- Ghashti, S.J.; Thompson, J.R.J. Mixed-type distance shrinkage and selection for clustering via kernel metric learning. J. Classif. 2024, 42, 311–334. [Google Scholar] [CrossRef] [Scilit]
- Wei, W.; Ding, X.X.; Guo, M.X.; Yang, Z.; Liu, H. A review of text similarity calculation methods. Comput. Eng. 2024, 50, 18–32. [Google Scholar]
- Wang, J.; Zhang, Z.; Yue, S. A validity index for clustering evaluation by grid structures. Mathematics 2025, 13, 1017. [Google Scholar] [CrossRef] [Scilit]
- Davies, D.L.; Bouldin, D.W. A cluster separation measure. IEEE Trans. Pattern Anal. Mach. Intell. 1979, 2, 224–227. [Google Scholar] [CrossRef] [Scilit]
- Amorim, D.C.R.; Makarenkov, V. Improving clustering quality evaluation in noisy Gaussian mixtures. Neurocomputing 2026, 680, 133330. [Google Scholar] [CrossRef] [Scilit]
- Xie, X.L.; Beni, G. A validity measure for fuzzy clustering. IEEE Trans. Pattern Anal. Mach. Intell. 1991, 13, 841–847. [Google Scholar] [CrossRef] [Scilit]
- Rousseeuw, P.J. Silhouettes: A graphical aid to the interpretation and validation of cluster analysis. J. Comput. Appl. Math. 1987, 20, 53–65. [Google Scholar] [CrossRef] [Scilit]
- Fan, S.; Ding, S.; Xue, Y. Self-adaptive kernel K-means algorithm based on the shuffled frog leaping algorithm. Soft Comput. 2016, 20, 4463–4478. [Google Scholar] [CrossRef] [Scilit]
- Ikotun, M.A.; Habyarimana, F.; Ezugwu, E.A. Cluster validity indices for automatic clustering: A comprehensive review. Heliyon 2025, 11, e41953. [Google Scholar] [CrossRef] [Scilit] [PubMed]
- Blasilli, G.; Kerrigan, D.; Bertini, E.; Santucci, G. Towards a visual perception-based analysis of clustering quality metrics. In Proceedings of the 2024 IEEE Visualization in Data Science (VDS), St. Pete Beach, FL, USA, 14 October 2024; pp. 15–24. [Google Scholar]
- Di Nuzzo, C. Advancing spectral clustering for categorical and mixed-type data: Insights and applications. Mathematics 2024, 12, 508. [Google Scholar] [CrossRef] [Scilit]
- Mbuga, F.; Tortora, C. Spectral clustering of mixed-type data. Stats 2022, 5, 1. [Google Scholar] [CrossRef] [Scilit]
- Cendana, M.; Kuo, R.-J. Categorical Data Clustering: A Bibliometric Analysis and Taxonomy. Mach. Learn. Knowl. Extr. 2024, 6, 1009–1054. [Google Scholar] [CrossRef] [Scilit]
- Aschenbruck, R.; Szepannek, G.; Wilhelm, A.F.X. Initialization strategies for clustering mixed-type data with the k-prototypes algorithm. Adv. Data Anal. Classif. 2025, 2025, 1–30. [Google Scholar] [CrossRef] [Scilit]
- Szepannek, G. Clustering large mixed-type data with ordinal variables. Adv. Data Anal. Classif. 2025, 19, 749–767. [Google Scholar] [CrossRef] [Scilit]
- Salton, G.; Buckley, C. Term-weighting approaches in automatic text retrieval. Inf. Process. Manag. 1988, 24, 513–523. [Google Scholar] [CrossRef] [Scilit]
- Devlin, J.; Chang, M.W.; Lee, K.; Toutanova, K. BERT: Pre-training of deep bidirectional transformers for language understanding. In Proceedings of the NAACL-HLT 2019, Minneapolis, MN, USA, 2–7 June 2019; pp. 4171–4186. [Google Scholar]
- Reimers, N.; Gurevych, I. Sentence-BERT: Sentence embeddings using Siamese BERT-networks. In Proceedings of the EMNLP-IJCNLP 2019, Hong Kong, China, 3–7 November 2019; pp. 3982–3992. [Google Scholar]
- Calinski, T.; Harabasz, J. A dendrite method for cluster analysis. Commun. Stat. 1974, 3, 1–27. [Google Scholar] [CrossRef] [Scilit]
- Miller, C.; Portlock, T.; Nyaga, D.M.; O’sUllivan, J.M. A review of model evaluation metrics for machine learning in genetics and genomics. Front. Bioinform. 2024, 4, 1457619. [Google Scholar] [CrossRef] [Scilit] [PubMed]
- Hikmat, S.H.; Karwan, J.; Mohmed, R.S. A semantics-based clustering approach for online laboratories using K-means and HAC algorithms. Mathematics 2023, 11, 548. [Google Scholar] [CrossRef] [Scilit]

Disclaimer/Publisher’s Note: The statements, opinions and data contained in all publications are solely those of the individual author(s) and contributor(s) and not of MDPI and/or the editor(s). MDPI and/or the editor(s) disclaim responsibility for any injury to people or property resulting from any ideas, methods, instructions or products referred to in the content. |
© 2026 by the authors. Licensee MDPI, Basel, Switzerland. This article is an open access article distributed under the terms and conditions of the Creative Commons Attribution (CC BY) license.