


Abstract
Glaucoma is a leading cause of irreversible blindness, and timely detection and monitoring are essential to prevent permanent visual loss. Artificial intelligence (AI) has shown strong potential for automated diagnosis, but progression prediction remains a more challenging and clinically significant task. This study proposes an explainable multimodal deep learning framework for both glaucoma detection and progression prediction using the Harvard Glaucoma Detection and Progression dataset. The framework integrates specific modality encoders for optical coherence tomography B-scans, retinal nerve fiber layer thickness (RNFLT) maps, and visual field (VF) features through a feature fusion module. For the glaucoma detection task, the multimodal model achieved near-perfect performance with an AUROC of 0.9989 and a sensitivity of 0.9944. For the more complex progression prediction task, the full-fusion model achieved an AUROC of 0.7836. Using an optimized validation threshold, the model provided a balanced clinical operating point with reasonable sensitivity and specificity. Ablation experiments revealed a complementary relationship between modalities; VF features provided the strongest standalone ranking signal, RNFLT maps contributed the highest specificity, and multimodal fusion yielded the best overall precision–recall performance, although not the highest AUROC. Gradient-weighted Class Activation Mapping analysis indicated that the model focused on clinically plausible localized retinal regions. These findings support explainable and multimodal AI for glaucoma progression-risk identification.
1. Introduction
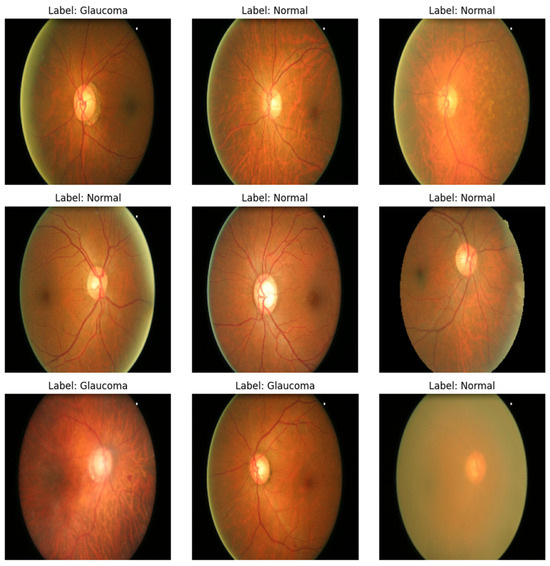
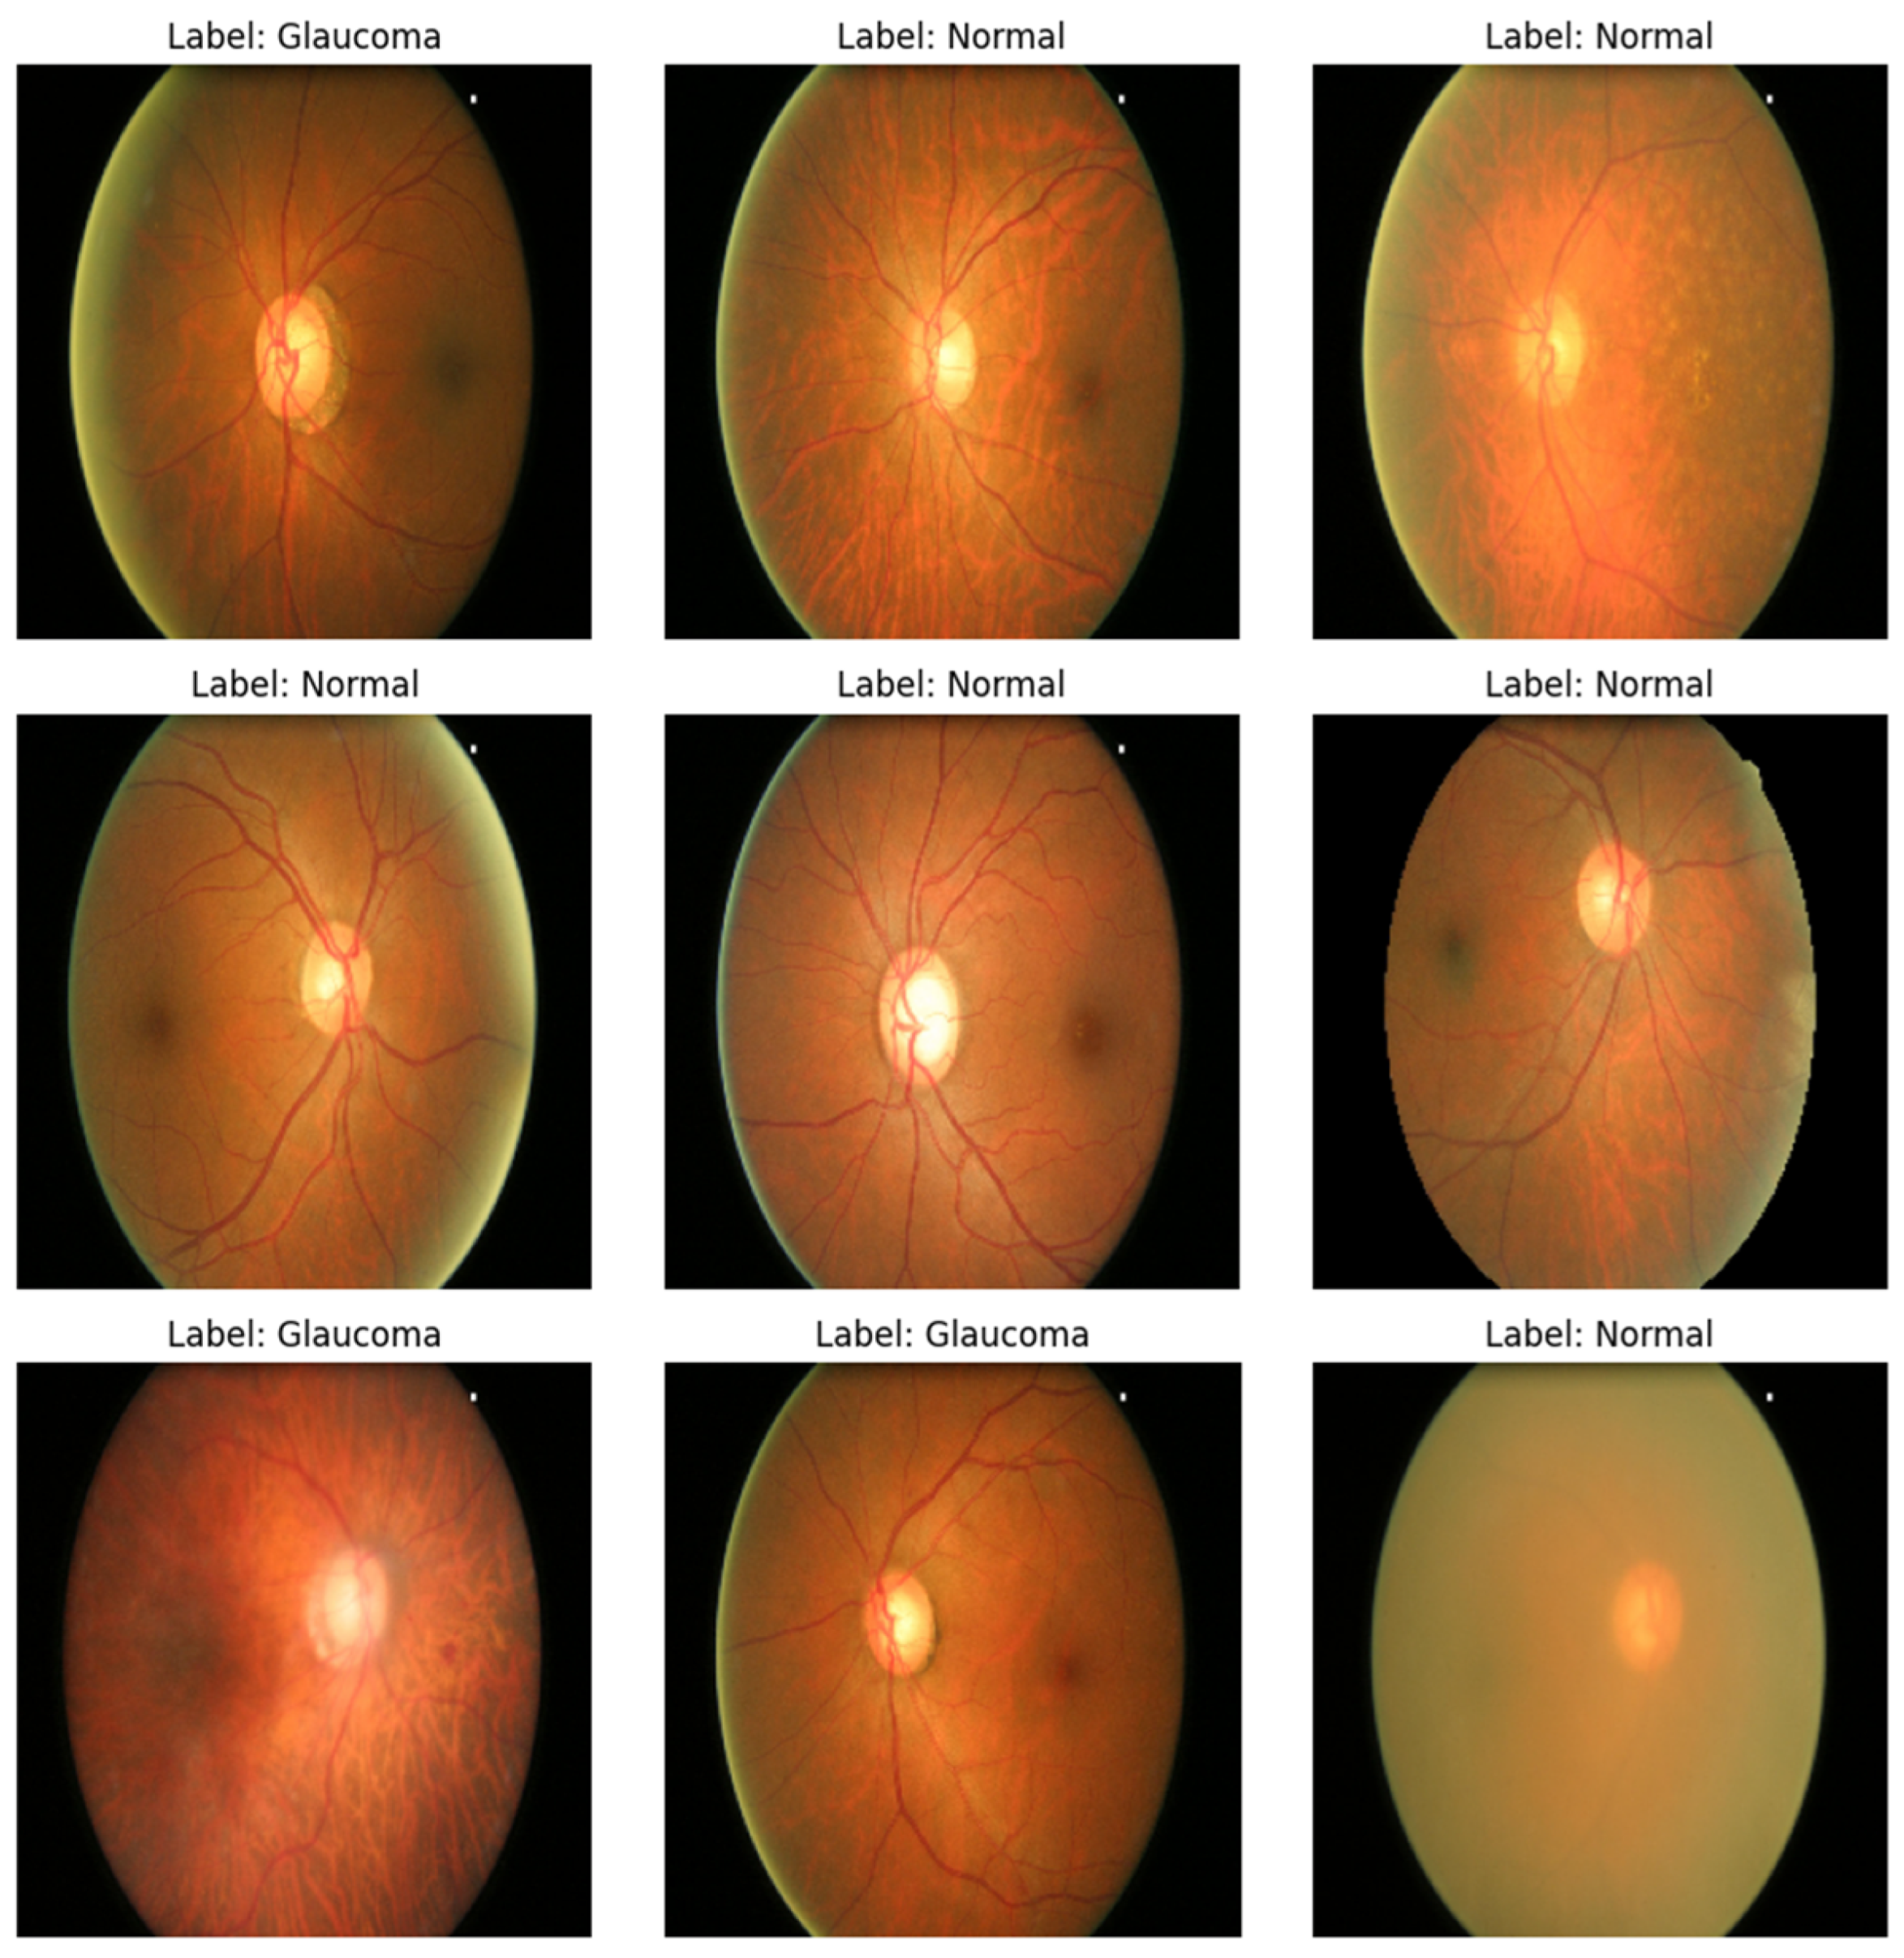
Glaucoma is a group of chronic eye diseases characterized by progressive optic neuropathy, which leads to irreversible vision loss [1,2]. It is the leading cause of permanent blindness worldwide, with an estimated 80 million people affected, and projections reaching 112 million by 2040 [3,4]. The disease progresses slowly and often remains asymptomatic until the advanced stages, when significant damage to the optic nerve head (ONH) and retinal nerve fiber layer (RNFL) has already occurred [1]. Accordingly, timely detection and continuous monitoring are essential for preserving vision and reducing long-term disability [5,6]. Figure 1 shows samples of healthy and glaucomatous retina eye scans.
Figure 1.
Samples of healthy and glaucomatous retina eye scans [7].
In current clinical practice, glaucoma assessment relies on a combination of structural and functional examinations [2]. Structural loss is typically quantified using Optical Coherence Tomography (OCT), which provides objective and high-resolution measurements of the RNFL and ONH morphology [1,8]. Functional degradation is monitored through Standard Automated Perimetry (SAP), which identifies areas of visual field (VF) sensitivity loss [1,8,9]. These inputs offer complementary sources of information, as structural changes in the retina often precede detectable functional impairment [9,10]. However, interpreting these multimodal data can be time-consuming, subjective, and highly dependent on specialized clinical expertise [2].
Advances in artificial intelligence (AI), particularly deep learning (DL), have shown considerable potential for automating ophthalmic analysis and supporting clinical decision-making [1,5]. Many studies have achieved near-perfect performance in glaucoma detection, particularly for the binary classification of an eye as healthy or glaucomatous; however, several critical gaps remain in the literature [11]. First, diagnostic classification alone does not address the more clinically important question of progression prediction, which identifies patients at higher risk of worsening who may require earlier intervention. Second, many existing models rely on single-modality inputs, even though glaucoma is a multimodal process involving both structural and functional change [10]. Finally, the black-box nature of many DL architectures remains a major challenge to clinical adoption, as practitioners require transparency to trust and verify model predictions.
Progression modeling represents a meaningful and relevant target for intelligent decision-support systems because it reflects real-world follow-up care. This task is considerably more challenging than simple detection due to the low frequency and subtle nature of progression events, as well as the inherent noise and variability in clinical data [12]. Multimodal learning offers a promising solution to these challenges by integrating different data sources, such as OCT B-scans, RNFLT maps, and VF features, to achieve more reliable and clinically informative risk estimates than any single modality could provide [10].
Building on these considerations, this work proposes an explainable multimodal DL framework for both glaucoma detection and progression prediction. Utilizing the Harvard Glaucoma Detection and Progression (Harvard-GDP) [13] benchmark dataset, an end-to-end architecture integrating structural imaging and functional perimetry data was implemented. An important contribution of this work is the use of explainability tools, such as Gradient-weighted Class Activation Mapping (Grad-CAM), to visualize the retinal regions that influence model predictions, thereby supporting clinical credibility and transparency [8]. Furthermore, threshold analyses and ablation experiments were conducted to quantify the specific contributions of each ocular modality and to identify the optimal operating points for both balanced clinical screening and high-sensitivity risk identification.
The primary contribution of this work is its focus on the clinically important task of progression risk modelling rather than simple diagnostic classification, achieved through an explainable multimodal framework. The specific novel contributions of this research include:
- Primary focus on progression prediction: Most existing AI research focuses on the binary detection of glaucoma, but this work addresses the gap of disease progression forecasting, identifying patients who are at higher risk of worsening and who require closer monitoring or earlier intervention;
- Integration of triple-modality data: Many studies rely on a single input, but this framework proposes an end-to-end architecture that integrates OCT B-scans (volumetric structural data), RNFLT maps (summarized structural data), and VF features (functional data);
- Clinical explainability (XAI): The work addresses the black-box limitation of deep learning by using Grad-CAM visualizations, allowing the model to highlight specific localized retinal regions, such as the peripapillary area, that affect its predictions, hence establishing clinical transparency and trust;
- Quantified modality contributions via an ablation study: The research provides a detailed analysis of how each ocular modality contributes to the final prediction, identifying a complementary relationship in which VF features provide high functional sensitivity, RNFLT maps offer a conservative structural signal, and the full-fusion model achieves the best overall precision–recall balance;
- Optimized clinical operating points: The work identifies and evaluates specific threshold operating points (e.g., a balanced F1-optimized threshold versus a high-sensitivity screening threshold), allowing the model to be tuned for different real-world clinical objectives;
- Benchmarking on Harvard-GDP: This study applies this multimodal and explainable approach to the Harvard-GDP dataset using the td_pointwise endpoint as the primary target for progression prediction.
2. Related Work
The literature relevant to this work spans five broad themes: epidemiology and clinical burden, structural biomarker analysis and imaging technology, deep learning for glaucoma detection and staging, structure-to-function prediction and multimodal progression modelling, and vision transformer architectures for retinal imaging. What follows is a thematic synthesis of key contributions in each area, together with an identification of the gaps that motivate the present work.
Epidemiology, disease burden, and progression metrics. Tham et al. [3] projected that glaucoma will affect approximately 112 million people worldwide by 2040, underscoring its scale as a global public health challenge. The personal burden associated with long-term disease is contextualized by Saunders et al. [14], who linked individual visual field progression rates to life expectancy and showed that a substantial proportion of patients attending specialist clinics are at risk of vision-impairing disability within their remaining lifetime. The role of intraocular pressure (IOP) as a modifiable risk factor has been established by Musch et al. [15], whose analysis of the Collaborative Initial Glaucoma Treatment Study (CIGTS) found that higher maximum IOP and greater pressure fluctuation were independently associated with long-term functional worsening. Despite these insights, measuring and defining progression itself remains methodologically contested. De Moraes et al. [16] reviewed both trend-based and event-based approaches to visual field progression, noting that each captures clinically distinct patterns of change but that no consensus definition currently exists, which is a gap that directly complicates AI model development and cross-study comparison. The challenge is further compounded in specific patient subgroups: Jonas et al. [17] showed that OCT-based structural assessments are less reliable in patients with high myopia, for whom the parapapillary delta zone may provide a more informative risk marker.
Structural biomarkers and imaging technology. OCT provides the primary evidence of glaucomatous nerve damage, but its utility is constrained by important measurement limitations. Wollstein et al. [18] identified a structural tipping point below which RNFL thinning correlates with accelerating functional loss, while also documenting a floor effect that renders RNFL thickness measurements uninformative in advanced disease. Scuderi et al. [10] investigated macular OCT parameters, finding that pattern-based indices (FLV and GLV) outperform simple mean thickness values for progression monitoring, while Mahmoudinezhad et al. [11] showed that the ganglion cell layer (GCL) and ganglion cell–inner plexiform layer complex (GCIPL) perform equivalently for early damage detection under current hardware. Moghimi et al. [19] extended this analysis to OCT angiography, finding that macular vessel density avoids the floor effect but offers a narrower dynamic range of measurable change. Geevarghese et al. [20] reviewed the broader evolution of OCT in automated glaucoma management, highlighting teleophthalmology and home OCT as promising but not yet fully adopted modalities. On the functional assessment side, Tiang et al. [21] demonstrated that browser-based perimetry can match the clinical standard HFA SITA-Faster in accuracy, opening pathways for accessible longitudinal monitoring outside specialist settings.
Deep learning for glaucoma detection and staging. Deep learning has achieved strong results for glaucoma detection from retinal images, though most work has concentrated on binary diagnostic classification. Christopher et al. [5] showed that convolutional models trained on OCT optic nerve head enface images can predict visual field damage severity with an AUROC of 0.87, substantially outperforming traditional RNFL thickness summaries. Akter et al. [2] applied ResNet-18 and VGG-16 to classify glaucoma stages from visual field images using the Mills criteria, achieving F1-scores above 96% on balanced datasets, though the models struggled to distinguish end-stage disease from minimal defects in some patients. Hussain et al. [4] extended detection work toward progression by combining deep learning with generative data augmentation, achieving an AUROC of approximately 0.74 on a private longitudinal dataset and highlighting the importance of addressing class imbalance in progression modelling. Mandal [1] addressed this directly through a semi-supervised CNN-LSTM framework trained on longitudinal OCT sequences with pseudo-progression labelling to handle noisy, imbalanced data. Together, these studies confirm that DL can approach or match expert performance for diagnostic classification, but that progression-focused modelling, where labels are rarer, noisier, and clinically more consequential, requires more targeted methodological development than detection alone.
Structure-to-function prediction and multimodal progression modelling. A growing body of work frames the structure-to-function relationship as a predictive modelling problem. Kim et al. [9] demonstrated that DL models can predict global VF indices directly from OCT parameters with clinically useful accuracy in earlier-stage disease, though performance degraded substantially in advanced glaucoma. Kim et al. [22] compared linear regression, LSTM, and Bi-GRU architectures for sector-level VF sensitivity prediction, finding marginal advantages for recurrent models but noting that the analysis was restricted to six predefined Garway-Heath sectors, potentially missing localised retinal changes. Park et al. [12] and Sriwatana et al. [8] both explored full VF prediction from OCT data; the latter showed that transformer-based encoders (DINO-ViT) outperform CNNs in predictive accuracy and produce more interpretable spatial attention, though imaging artefacts remained a source of spurious correlations. Pham et al. [23] proposed a multimodal encoder combining longitudinal structural data with functional inputs to predict future VF sensitivity, outperforming single-modality baselines in mean absolute error, while Kihara et al. [24] introduced a policy-network approach to select the most informative modality-specific prediction at each retinal location, achieving strong reconstruction accuracy in paracentral regions but degraded performance in high-myopia eyes.
Vision transformers and attention-based architectures. The self-attention mechanism at the core of vision transformers has generated substantial interest in ophthalmic imaging, where global spatial context is often diagnostically important. He et al. [25] established the residual learning (ResNet) framework that underpins many leading ophthalmic DL models, demonstrating that skip connections effectively mitigate degradation in deep networks and enabling robust transfer learning from large natural-image datasets. Comprehensive comparative reviews by Khan et al. [26] and Maurício et al. [27] consistently found that vision transformers (ViTs) capture global spatial relationships more effectively than CNNs but require substantially larger datasets to generalize, which is a concern particularly relevant for rare clinical tasks such as progression prediction. Wang et al. [28] applied a ViT to multi-label retinal disease classification from fundus images, outperforming CNN baselines on F1-score, while Yang et al. [29] showed that domain-specific pre-training using Masked Autoencoders (MAE) on retinal images substantially improves sensitivity for diabetic retinopathy classification compared to natural-image initialization, suggesting that self-supervised retinal pre-training is a promising direction for data-scarce ophthalmic tasks.
Despite this body of work, several important gaps persist. The absence of a consensus definition for visual field progression complicates model development and cross-study comparison. Structural imaging is increasingly limited in advanced disease owing to floor effects, and performance in patients with high myopia remains poor. While multimodal architectures show promise, the fusion of volumetric structural data with functional perimetry has received limited attention specifically for binary progression prediction, as opposed to continuous VF regression tasks. Furthermore, most published DL systems for glaucoma lack integrated explainability mechanisms, creating a barrier to clinical trust and adoption. The present work addresses these gaps by proposing an explainable, triple-modal framework evaluated on the publicly available Harvard-GDP benchmark for both glaucoma detection and progression prediction, with ablation analysis and Grad-CAM visualizations to support transparency.
3. Materials and Methods
3.1. Study Design
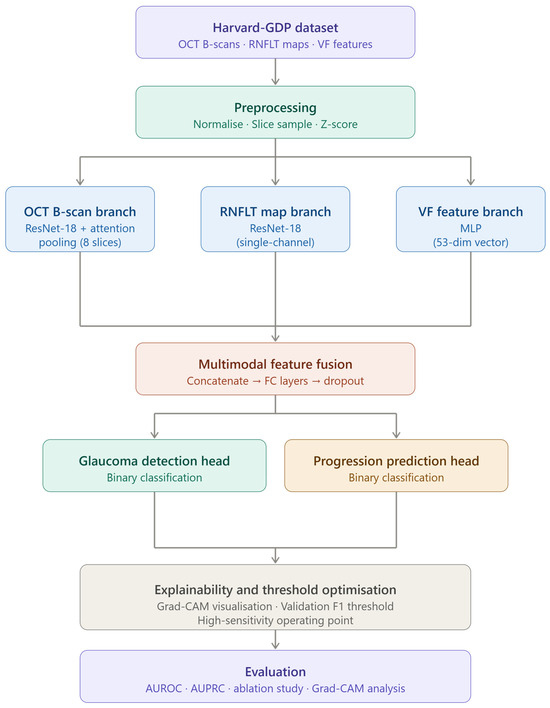
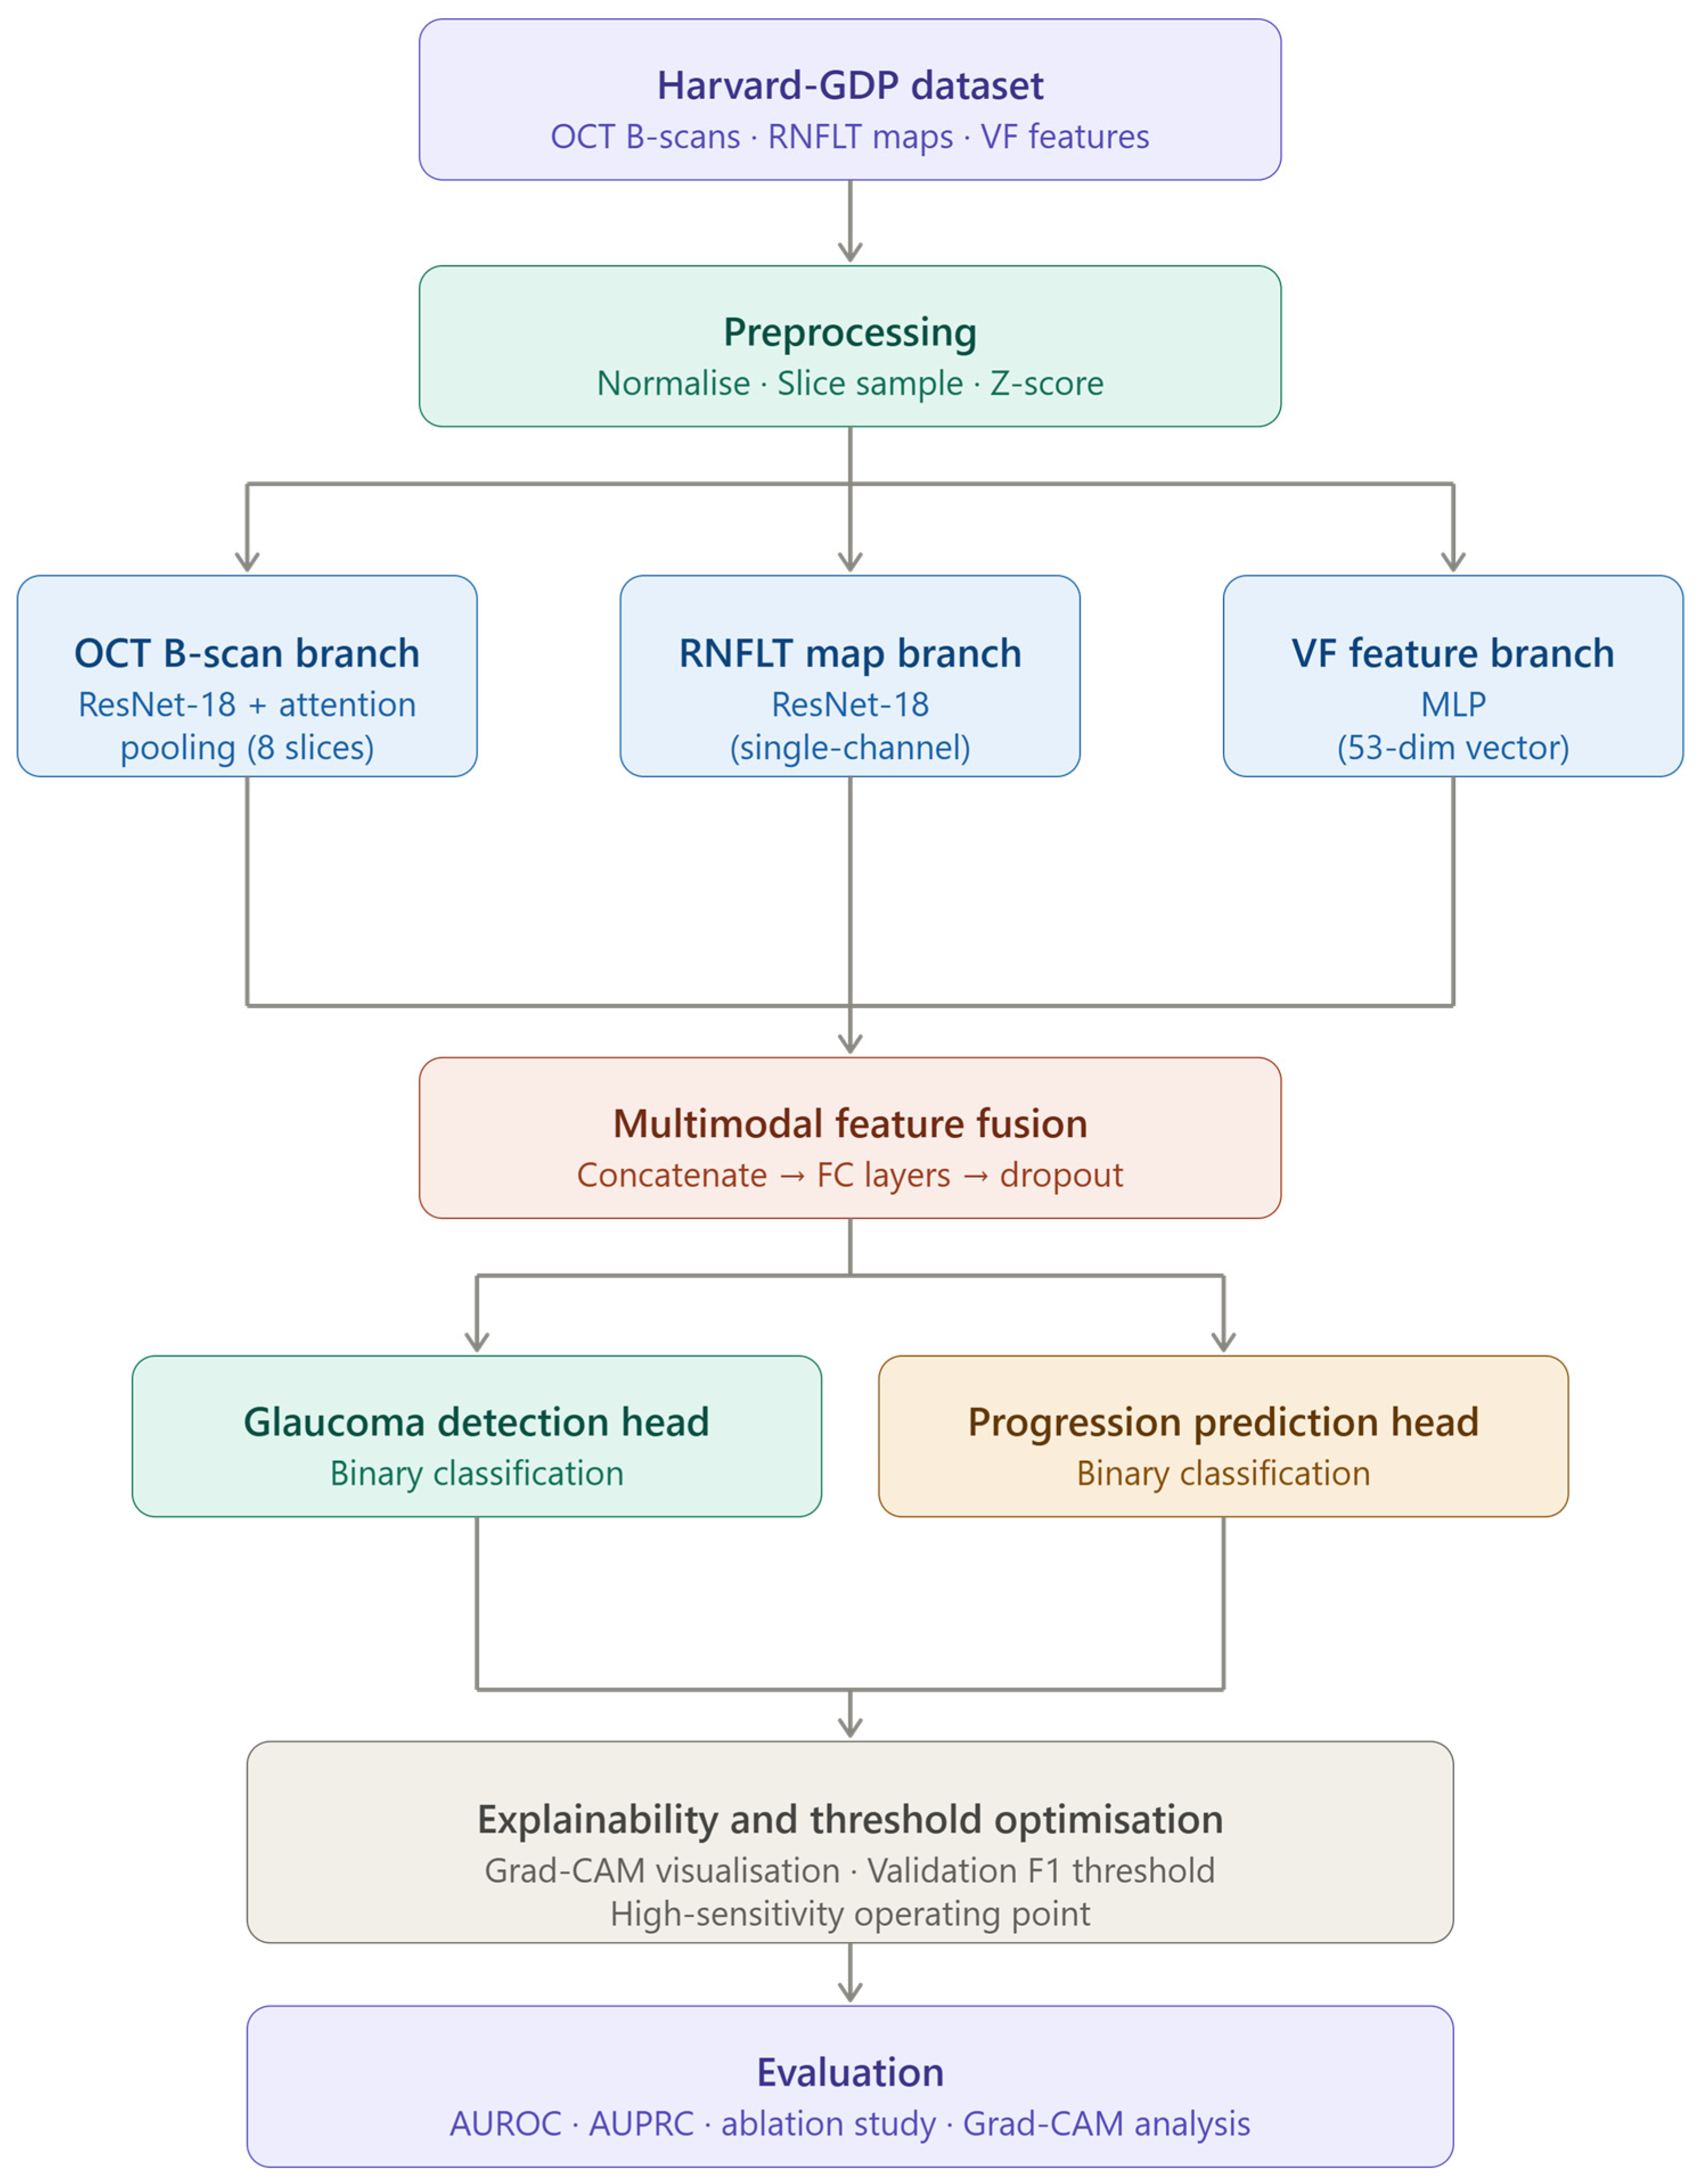
This study adopts a supervised DL approach to develop an explainable multimodal framework for glaucoma detection and progression prediction. The research is structured into two distinct tasks using the Harvard-GDP benchmark: binary glaucoma detection and progression prediction. The methodology integrates three distinct ocular sources, namely OCT B-scans, RNFLT maps, and VF features, through specific encoders and a feature fusion module. Performance is evaluated using standard dataset partitions, ablation experiments, threshold optimization, and Grad-CAM explainability analysis. Figure 2 illustrates the study design. The figure summarizes the implemented workflow, including Harvard-GDP data inputs, preprocessing, modality-specific encoders for OCT B-scans, RNFL thickness maps, and visual field features, multimodal fusion, task-specific prediction heads, and explainability outputs.
Figure 2.
Study design diagram.
The proposed framework was implemented using the PyTorch v2.0 deep learning library on Google Colab using Python v3.12. All experiments, including model training, ablation studies, and explainability analysis, were conducted using a consistent optimization pipeline to ensure the comparability of results across different modality configurations.
3.2. Dataset and Task Definitions
The study utilizes the publicly available Harvard-GDP dataset [13], which contains multimodal ophthalmic data indexed by unique sample filenames. For the glaucoma detection task, the dataset consists of 1000 samples with binary labels that indicate the presence or absence of the disease. For the progression prediction task, the study utilizes a subset of 500 labeled samples. The progression.td_pointwise endpoint was selected as the primary progression target because it provides a clinically meaningful label with a sufficient number of positive cases for reliable modeling.
3.3. Data Preprocessing
Specific preprocessing pipelines were developed for each data source to ensure compatibility with the DL architecture. OCT B-scan volumes were loaded as tensors of shape (200, 200, 300) and transposed to (300, 200, 200) to set the slice dimension as the leading axis; pixel intensities were normalized to the range (0, 1); and 8 slices were uniformly sampled across the 300 available grayscale slices to reduce computational cost while maintaining volumetric coverage. RNFL thickness maps (225 × 225 pixels) were standardized using z-score normalization per sample to reduce scale variability across different eyes while maintaining the relative regional thickness patterns required for detecting structural loss. VF features were generated by concatenating the scalar mean deviation (MD) with a 52-dimensional vector of total deviation (TD) values, resulting in a 53-dimensional functional feature vector.
3.4. Proposed Multimodal Framework
The proposed architecture consists of three modality-specific branches followed by a fusion network, as described below.
- OCT B-scan branch: Each of the 8 sampled slices is passed through a shared convolutional encoder based on a ResNet-18 backbone pretrained on ImageNet and modified for single-channel input. Slice embeddings are then aggregated using an attention-pooling module that learns to weight the most informative structural slices for the final prediction;
- RNFL branch: This branch utilizes a separate ResNet-18 encoder, also adapted for single-channel input, where the final convolutional features are globally pooled into a compact latent embedding of structural thickness;
- Visual field branch: Functional data is modeled using a multilayer perceptron (MLP) that processes the 53-dimensional VF vector into a compact functional embedding;
- Fusion and prediction: Embeddings from all active modalities are concatenated and passed through a fusion network of fully connected layers with nonlinear activations and dropout to prevent overfitting. The fused representation is then fed into a binary classification head for detection and a separate head for progression forecasting.
The visual field branch MLP comprised a single hidden layer of dimension 128, followed by a nonlinear activation. The fusion network used two fully connected layers with a hidden dimension of 256 and a dropout rate of 0.2 applied between layers. The complete full-fusion model, encompassing both ResNet-18 encoders, the attention-pooling module, the MLP branch, and the fusion network, contained approximately 22 million trainable parameters in total.
3.5. Data Splitting and Training Protocol
The study follows the official Harvard-GDP train/test partitions to ensure reproducible results. For progression prediction, the 300 training samples were further divided into 240 training and 60 validation cases using stratified sampling. Models were implemented in PyTorch and optimized using the AdamW optimizer with a learning rate of 3 × 10⁻⁴ and a weight decay of 1 × 10⁻⁴. Due to GPU memory constraints on Google Colab (NVIDIA T4, approximately 15 GB VRAM), the batch size was set to 2 for all experiments. Each OCT volume was represented by 8 uniformly sampled B-scan slices, and ResNet-18 was chosen as the backbone specifically because deeper architectures (e.g., ResNet-50 or ResNet-101) caused out-of-memory errors at this batch size.
All experiments, including the glaucoma detection model, the progression prediction model, and each modality configuration in the ablation study (VF-only, RNFLT-only, B-scan-only, and full fusion), were trained for a fixed number of 5 epochs to ensure consistent comparison across configurations under the available computational constraints. Model selection was performed exclusively by saving the checkpoint that achieved the highest AUROC on the internal validation set. To address the inherent class imbalance in progression modeling, where positive cases represented only approximately 9% of the test set, the training process used binary cross-entropy combined with a positive-class weighting term derived from the training data distribution. Importantly, threshold selection was performed solely on the validation set and was never adjusted using test-set outcomes, ensuring that the reported test results are unbiased evaluations. Each modality configuration reported in the ablation study was trained independently under identical hyperparameter settings.
3.6. Evaluation Metrics and Threshold Optimization
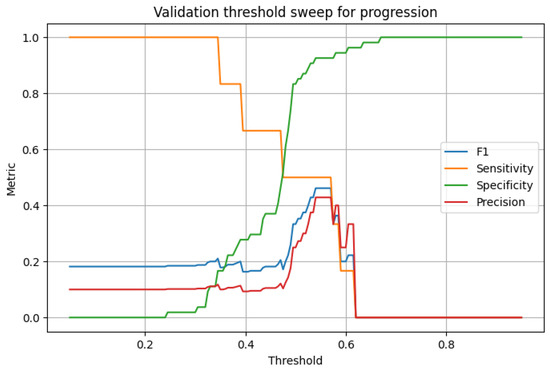
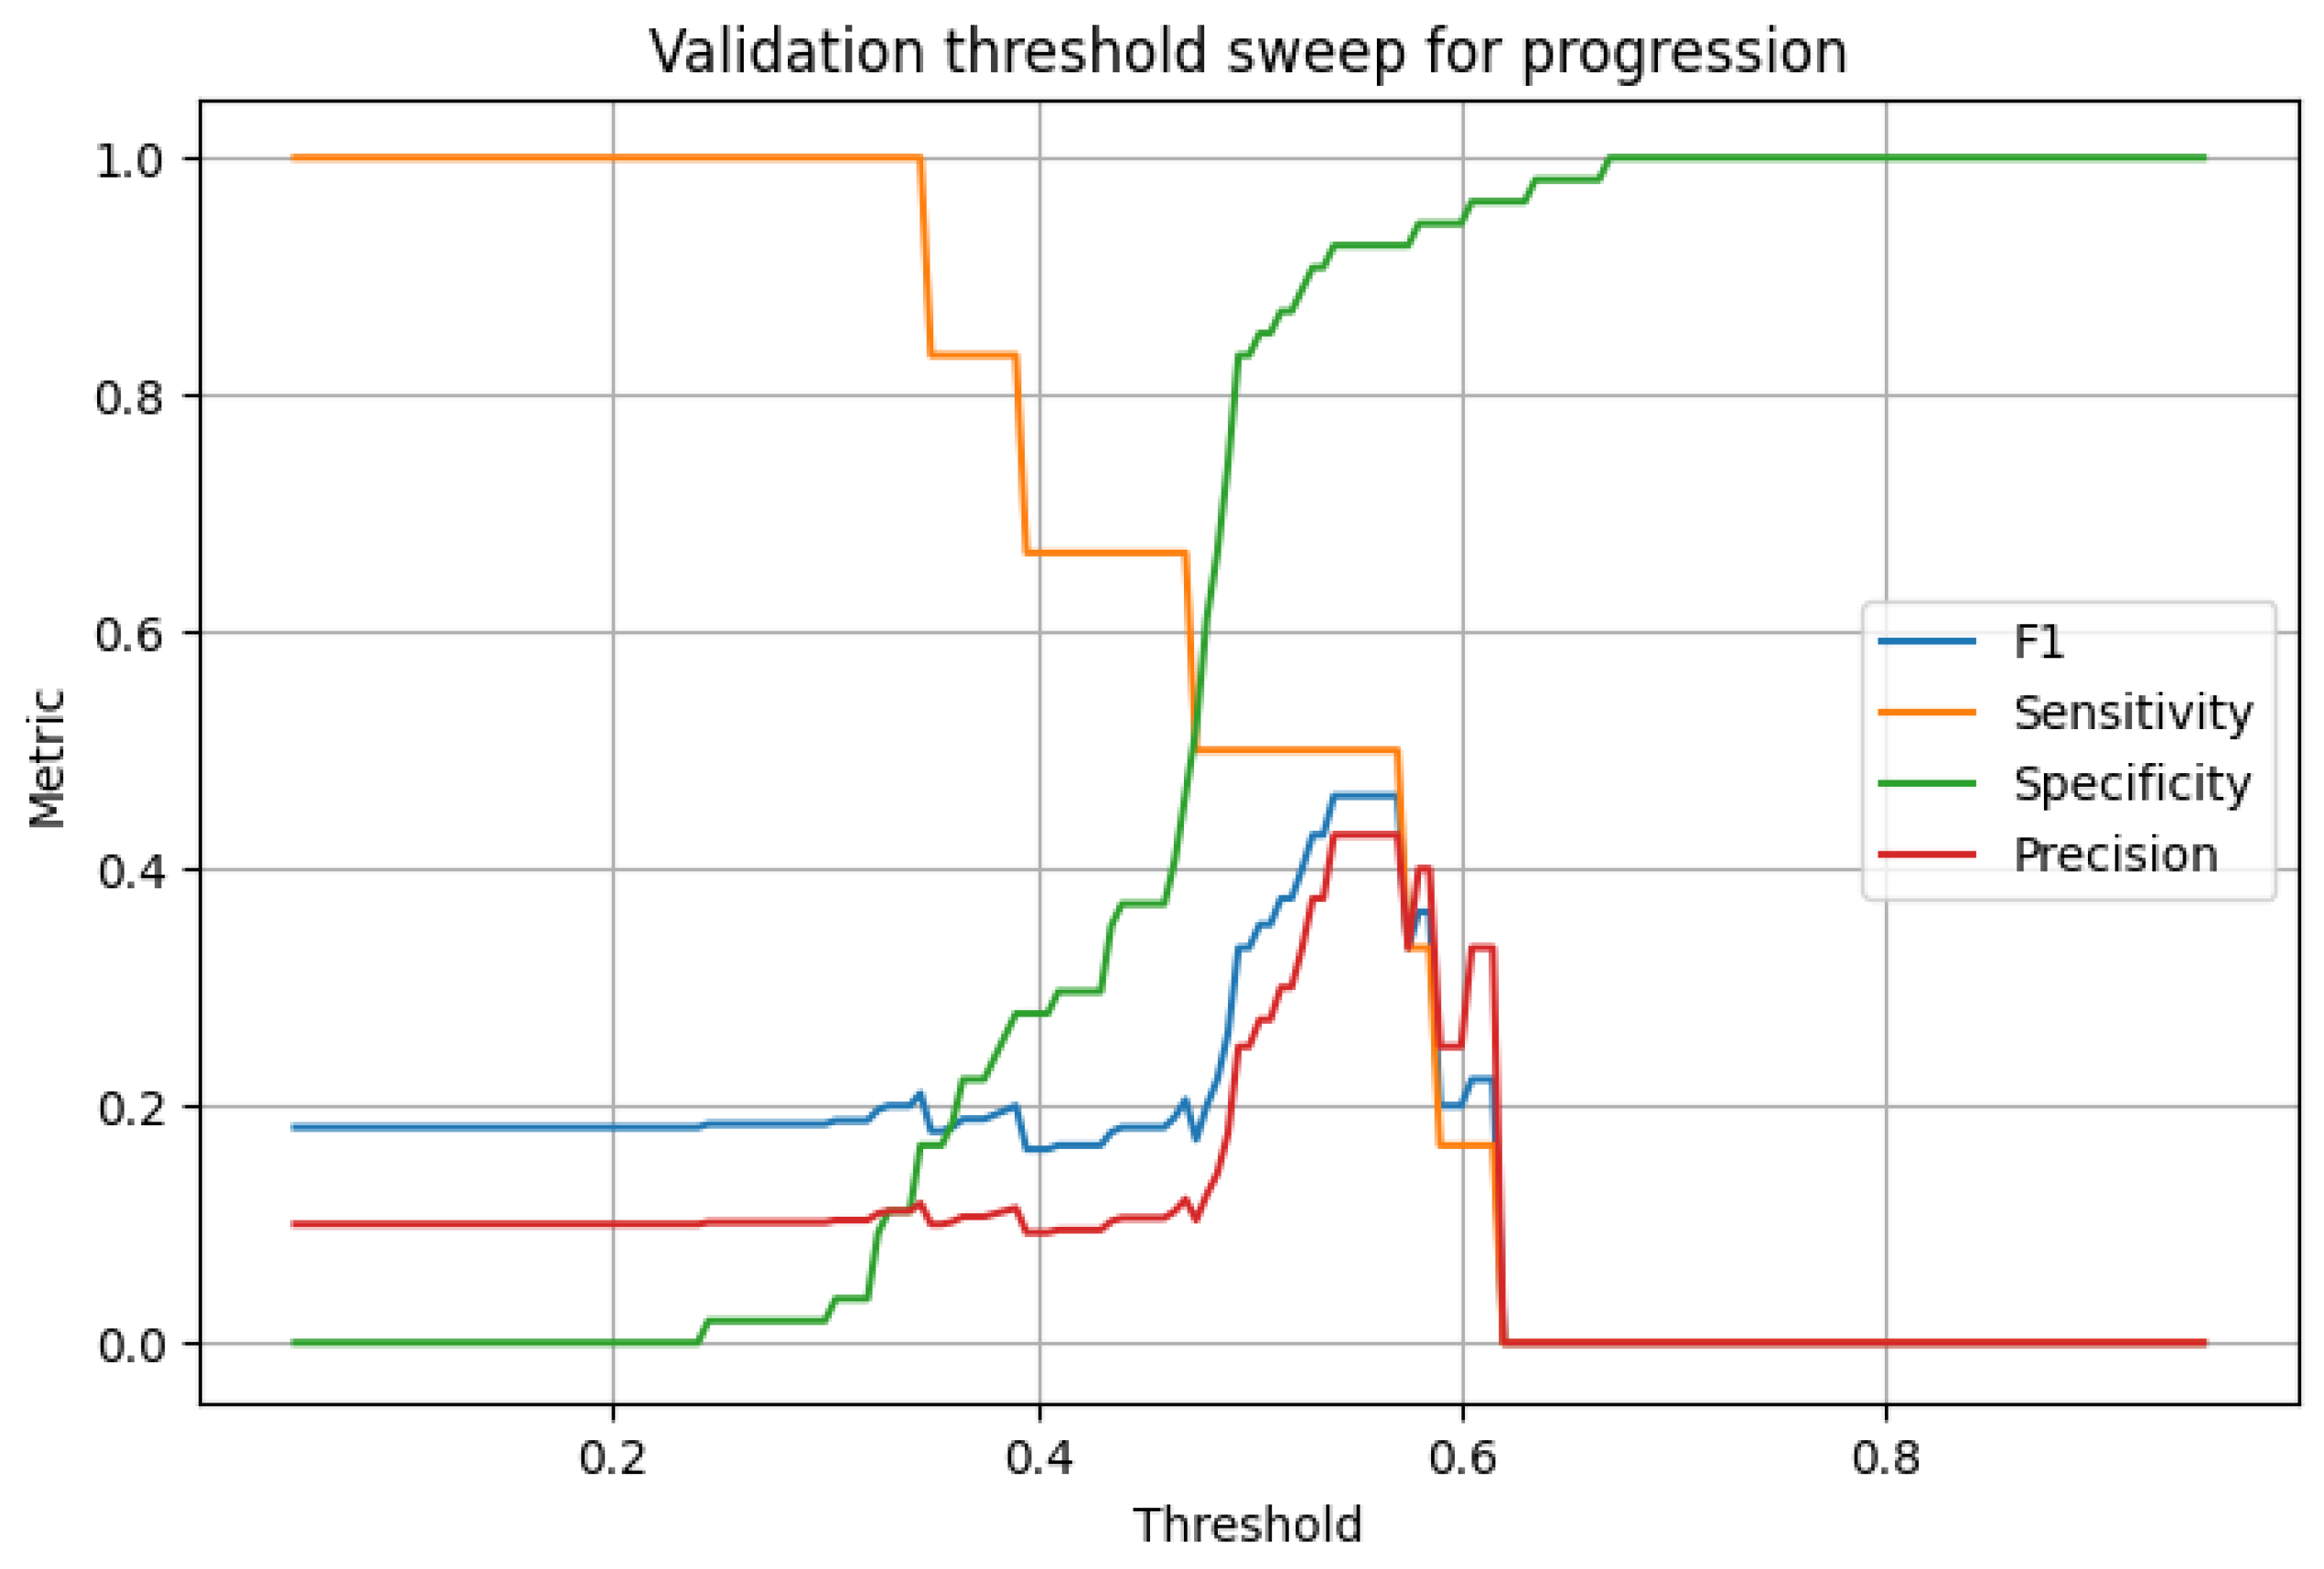
Model performance is measured using both threshold-independent and threshold-dependent metrics, with AUROC and AUPRC serving as the primary indicators. For the imbalanced progression task, AUPRC is considered particularly significant, as it measures performance relative to the prevalence baseline. A threshold sweep was performed on the validation set to identify two clinically relevant operating points: a validation F1 threshold for balanced performance and a high-sensitivity threshold for screening applications. A threshold of 0.54, selected by maximizing the F1-score on the validation set, was used to provide a balance between sensitivity and specificity, as shown in Figure 3; F1 and precision peak in the threshold range 0.52–0.56, where specificity is already high, while sensitivity begins dropping thereafter, supporting the choice of the 0.54 threshold. A second threshold of 0.391 was chosen to maintain a validation sensitivity of at least 0.80 for high-recall screening scenarios.
Figure 3.
Validation threshold selection for progression prediction.
3.7. Ablation and Explainability Analysis
An ablation study was conducted to quantify the relative predictive value of each modality, comparing VF-only, RNFLT-only, B-scan-only, and full-fusion configurations. Model interpretability was assessed using Grad-CAM visualizations applied to the final convolutional layers of the RNFL encoder and to the most relevant B-scan slice identified by the attention-pooling module. The resulting heatmaps were superimposed on the original images and analyzed for true positive, false positive, false negative, and true negative cases to verify whether the model relied on clinically plausible structural regions, such as the peripapillary area.
4. Results
4.1. Experimental Overview and Dataset Composition
The proposed framework was evaluated on two distinct tasks using the Harvard-GDP benchmark: glaucoma detection and progression prediction using the td_pointwise endpoint. Glaucoma detection was assessed on the official test split (n = 400) after training on a partition of 480 samples with 120 internal validation cases. For the more challenging progression prediction task, 500 labeled samples were utilized, with 240 for training, 60 for validation, and 200 for the final independent test set. Detailed dataset splits and case distributions are summarized in Table 1.
Table 1.
Harvard-GDP dataset composition and task-specific splits.
4.2. Glaucoma Detection Performance
The multimodal framework demonstrated near-perfect performance for glaucoma detection, achieving an AUROC and AUPRC of 0.9989 on the official test split. Using integrated structural and functional data, the model reached a sensitivity of 0.9944 and a specificity of 1.0000, with only one false negative recorded in the 400-sample test set. These findings confirm that the joint representation of OCT B-scans, RNFLT maps, and visual field features provides highly discriminative patterns for diagnostic classification. Full detection metrics are provided in Table 2.
Table 2.
Test set performance of the proposed multimodal model for glaucoma detection.
4.3. Progression Prediction Performance
Progression prediction proved to be a considerably more difficult task compared to the near-perfect detection results. On the test set, the full multimodal fusion model achieved an AUROC of 0.7836 and an AUPRC of 0.2989. At the default decision threshold (0.5), the model identified the majority of progressors with a sensitivity of 0.8333, although this was accompanied by a moderate specificity of 0.6758 and 59 false positives.
Given that the prevalence of positive progression in this dataset is approximately 9%, the achieved AUPRC of approximately 0.30 is significant, representing an improvement of 3.3 times over the random baseline. This suggests the model provides a meaningful discriminative capability for identifying patients at high risk of worsening. It should be noted that the AUROC reported here (0.7836) and the corresponding value in the ablation table (0.7930 for the full-fusion configuration) reflect results from two independent training runs. This small discrepancy is attributable to run-to-run variability arising from random weight initialization, mini-batch sampling with a batch size of 2, and stochastic gradient updates on a highly imbalanced dataset with only 47 positive progression cases. The values reported in this section are from the dedicated progression prediction run and represent the primary experimental results; the ablation table values reflect separately trained single-modality and fusion configurations run under identical hyperparameter settings for comparative purposes.
4.4. Threshold Optimization and Clinical Operating Points
To identify clinically actionable operating points, a threshold sweep was performed on the validation set. The threshold that maximized the validation F1-score was 0.54; when applied to the test set, this resulted in a more balanced profile with a sensitivity of 0.6111 and a specificity of 0.8077, reducing the number of false positives to 35. A threshold of 0.3911 was selected to prioritize screening; this achieved a sensitivity of 0.9444 but resulted in a substantial drop in specificity to 0.1703, generating 151 false positives out of 182 negative cases (a false-positive rate of 83%). The results for these operating points are detailed in Table 3, which illustrates the fundamental trade-off between identifying nearly all progressors and the resulting false-positive burden. The clinical implications of this trade-off are discussed in Section 5.1.
Table 3.
Test set performance of the proposed multimodal model for progression prediction using the td_pointwise endpoint.
4.5. Ablation Analysis
An ablation study was conducted to measure the relative contributions of each modality to the progression prediction task. VF-only achieved the highest standalone AUROC of 0.8074, indicating that functional features are the primary driver of ranking performance. RNFLT-only produced a slightly lower AUROC of 0.7817 but provided the highest specificity (0.8571) and precision (0.2571), reflecting a conservative structural predictor. Full fusion achieved the highest AUPRC of 0.3117, indicating that multimodal integration provides the best overall precision–recall balance for this imbalanced task. B-scan-only underperformed significantly, with an AUROC of 0.5617 and an AUPRC of 0.1128, suggesting that the simple slice-based representation was insufficient as a standalone signal in this implementation. These findings suggest that VF features contribute high sensitivity, RNFLT contributes specificity, and the fusion model balances these strengths. Detailed ablation results are summarized in Table 4. The reported values were obtained from independent training runs under the same overall experimental framework. Minor differences relative to the main progression experiment reflect run-to-run variability in a small and imbalanced dataset.
Table 4.
Ablation study for progression prediction across modality configurations.
4.6. Explainability Analysis
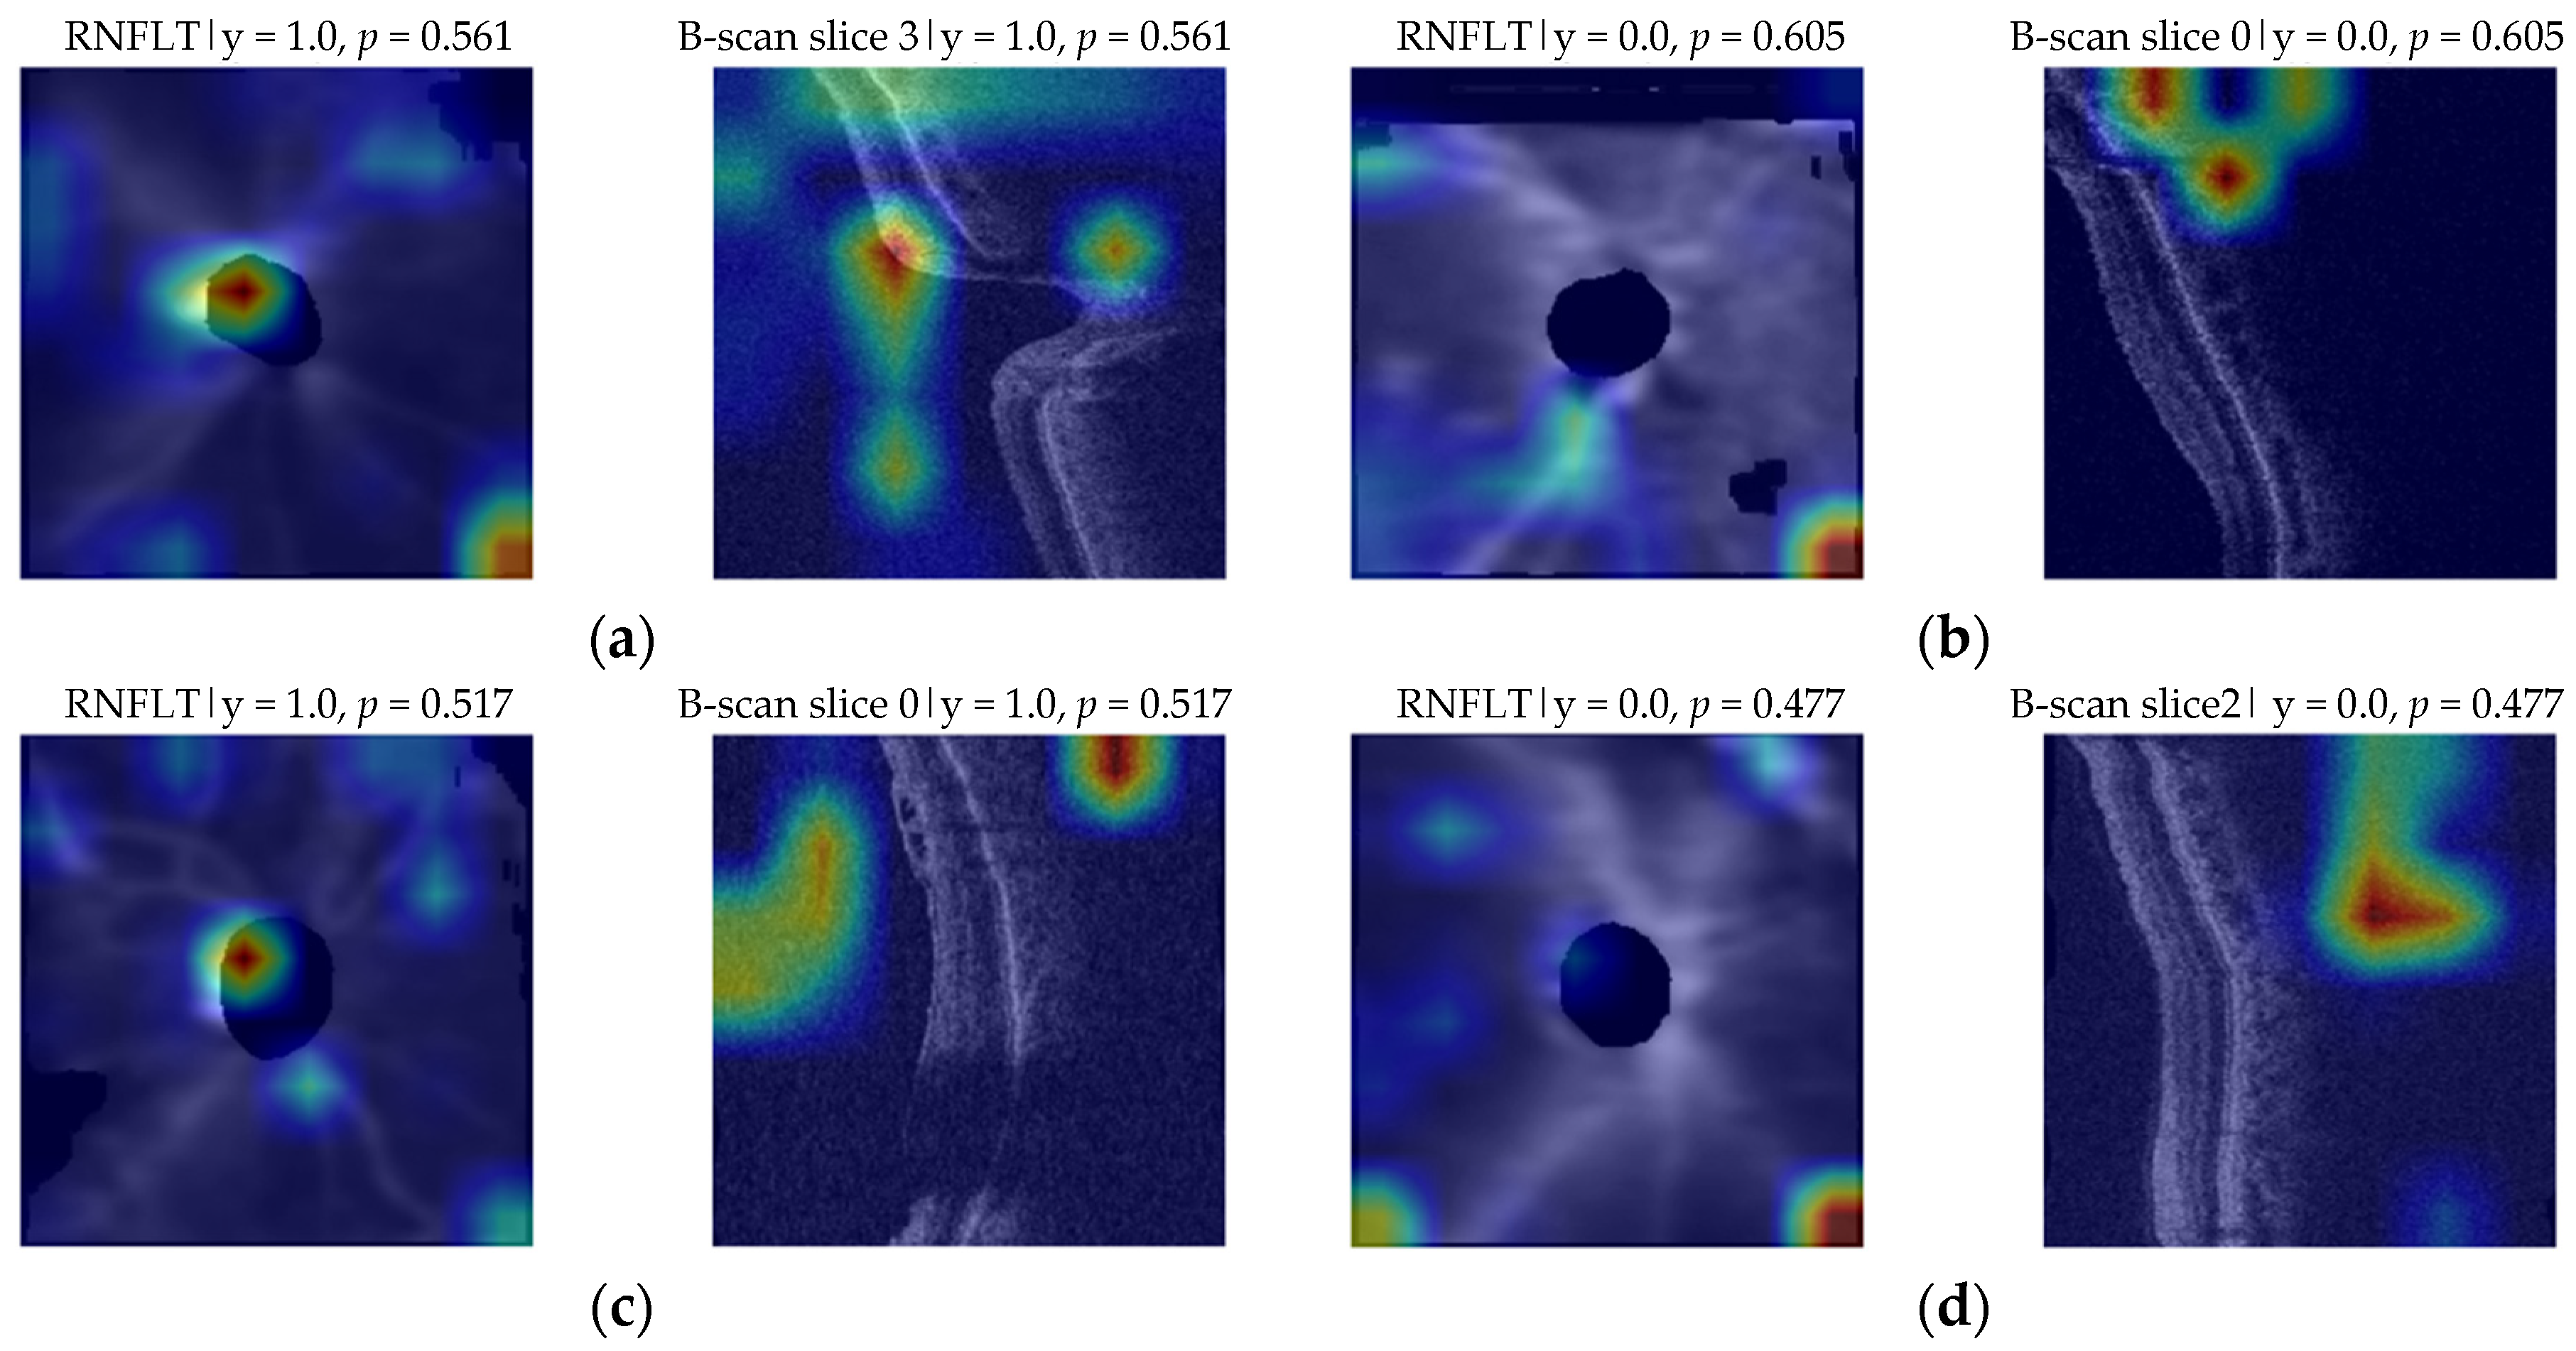
Grad-CAM visualizations were utilized to qualitatively explore the clinical plausibility of the model predictions. The following patterns were observed and are presented as preliminary, exploratory findings rather than confirmatory evidence:
- True positives demonstrated concentrated activation in localized peripapillary regions of the RNFL maps and focal structural emphasis in selected B-scan slices;
- False positives often exhibited more diffuse or peripheral activation patterns, including attention near image borders, suggesting sensitivity to ambiguous or artifactual features;
- False negatives frequently showed borderline predicted probabilities, implying that errors may be driven by threshold selection rather than a total failure of feature ranking;
- True negatives revealed a distinct pattern compared to the other outcomes, confirming that the model successfully discriminates stable eyes by failing to find the localized and concentrated structural degradation patterns associated with positive predictions.
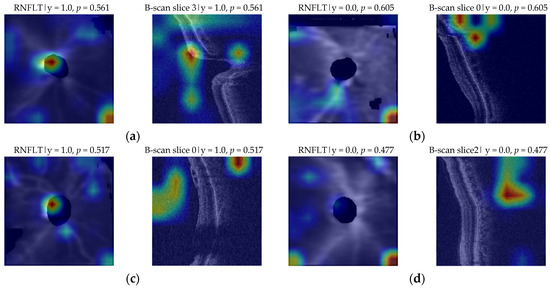
Figure 4 provides a sample of the Grad-CAM visualization results. Representative true positive (TP), false positive (FP), false negative (FN), and true negative (TN) examples are shown for progression prediction. For each case, the RNFL thickness map and the selected B-scan slice are overlaid with Grad-CAM heatmaps. These visualizations are qualitative and exploratory.
Figure 4.
Sample of Grad-CAM explainability results: (a) true positive (TP); (b) false positive (FP); (c) false negative (FN); (d) true negative (TN).
Overall, these qualitative observations suggest that the model may rely on clinically relevant structural cues, though formal quantitative localization analysis or expert-rating studies would be required to validate these patterns more rigorously. The results highlight specific areas for future refinement aimed at reducing false-positive triggers. Because the explainability analysis is qualitative, it should be interpreted as supportive rather than confirmatory evidence of model reasoning.
4.7. Comparison with Published Methods
Table 5 situates the proposed framework relative to representative published studies that address multimodal or deep learning–based glaucoma detection or progression prediction. Because existing methods use heterogeneous datasets, different tasks, and diverse evaluation metrics, direct numerical comparison is not straightforward; the table is therefore presented to contextualize the methodological scope of this work rather than to claim strict superiority.
Table 5.
Comparison of the proposed framework with representative multimodal and deep learning glaucoma prediction studies. N/R = not reported. Direct numerical comparison is limited by differences in datasets, tasks, and evaluation metrics; the table is intended to contextualize the methodological scope of this work.
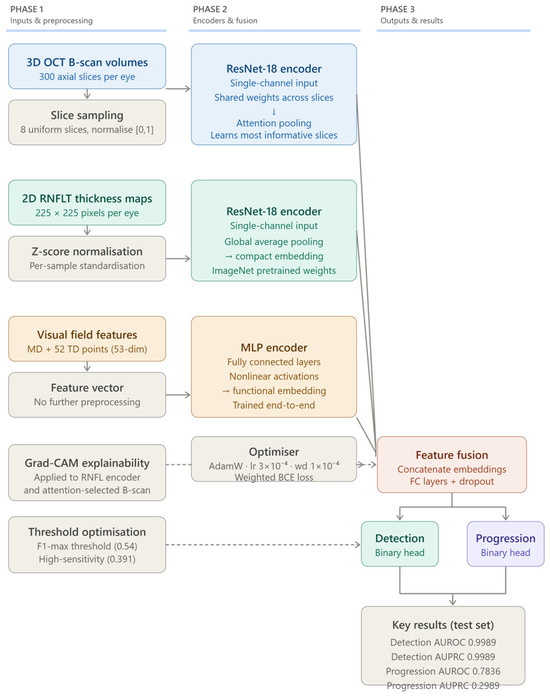
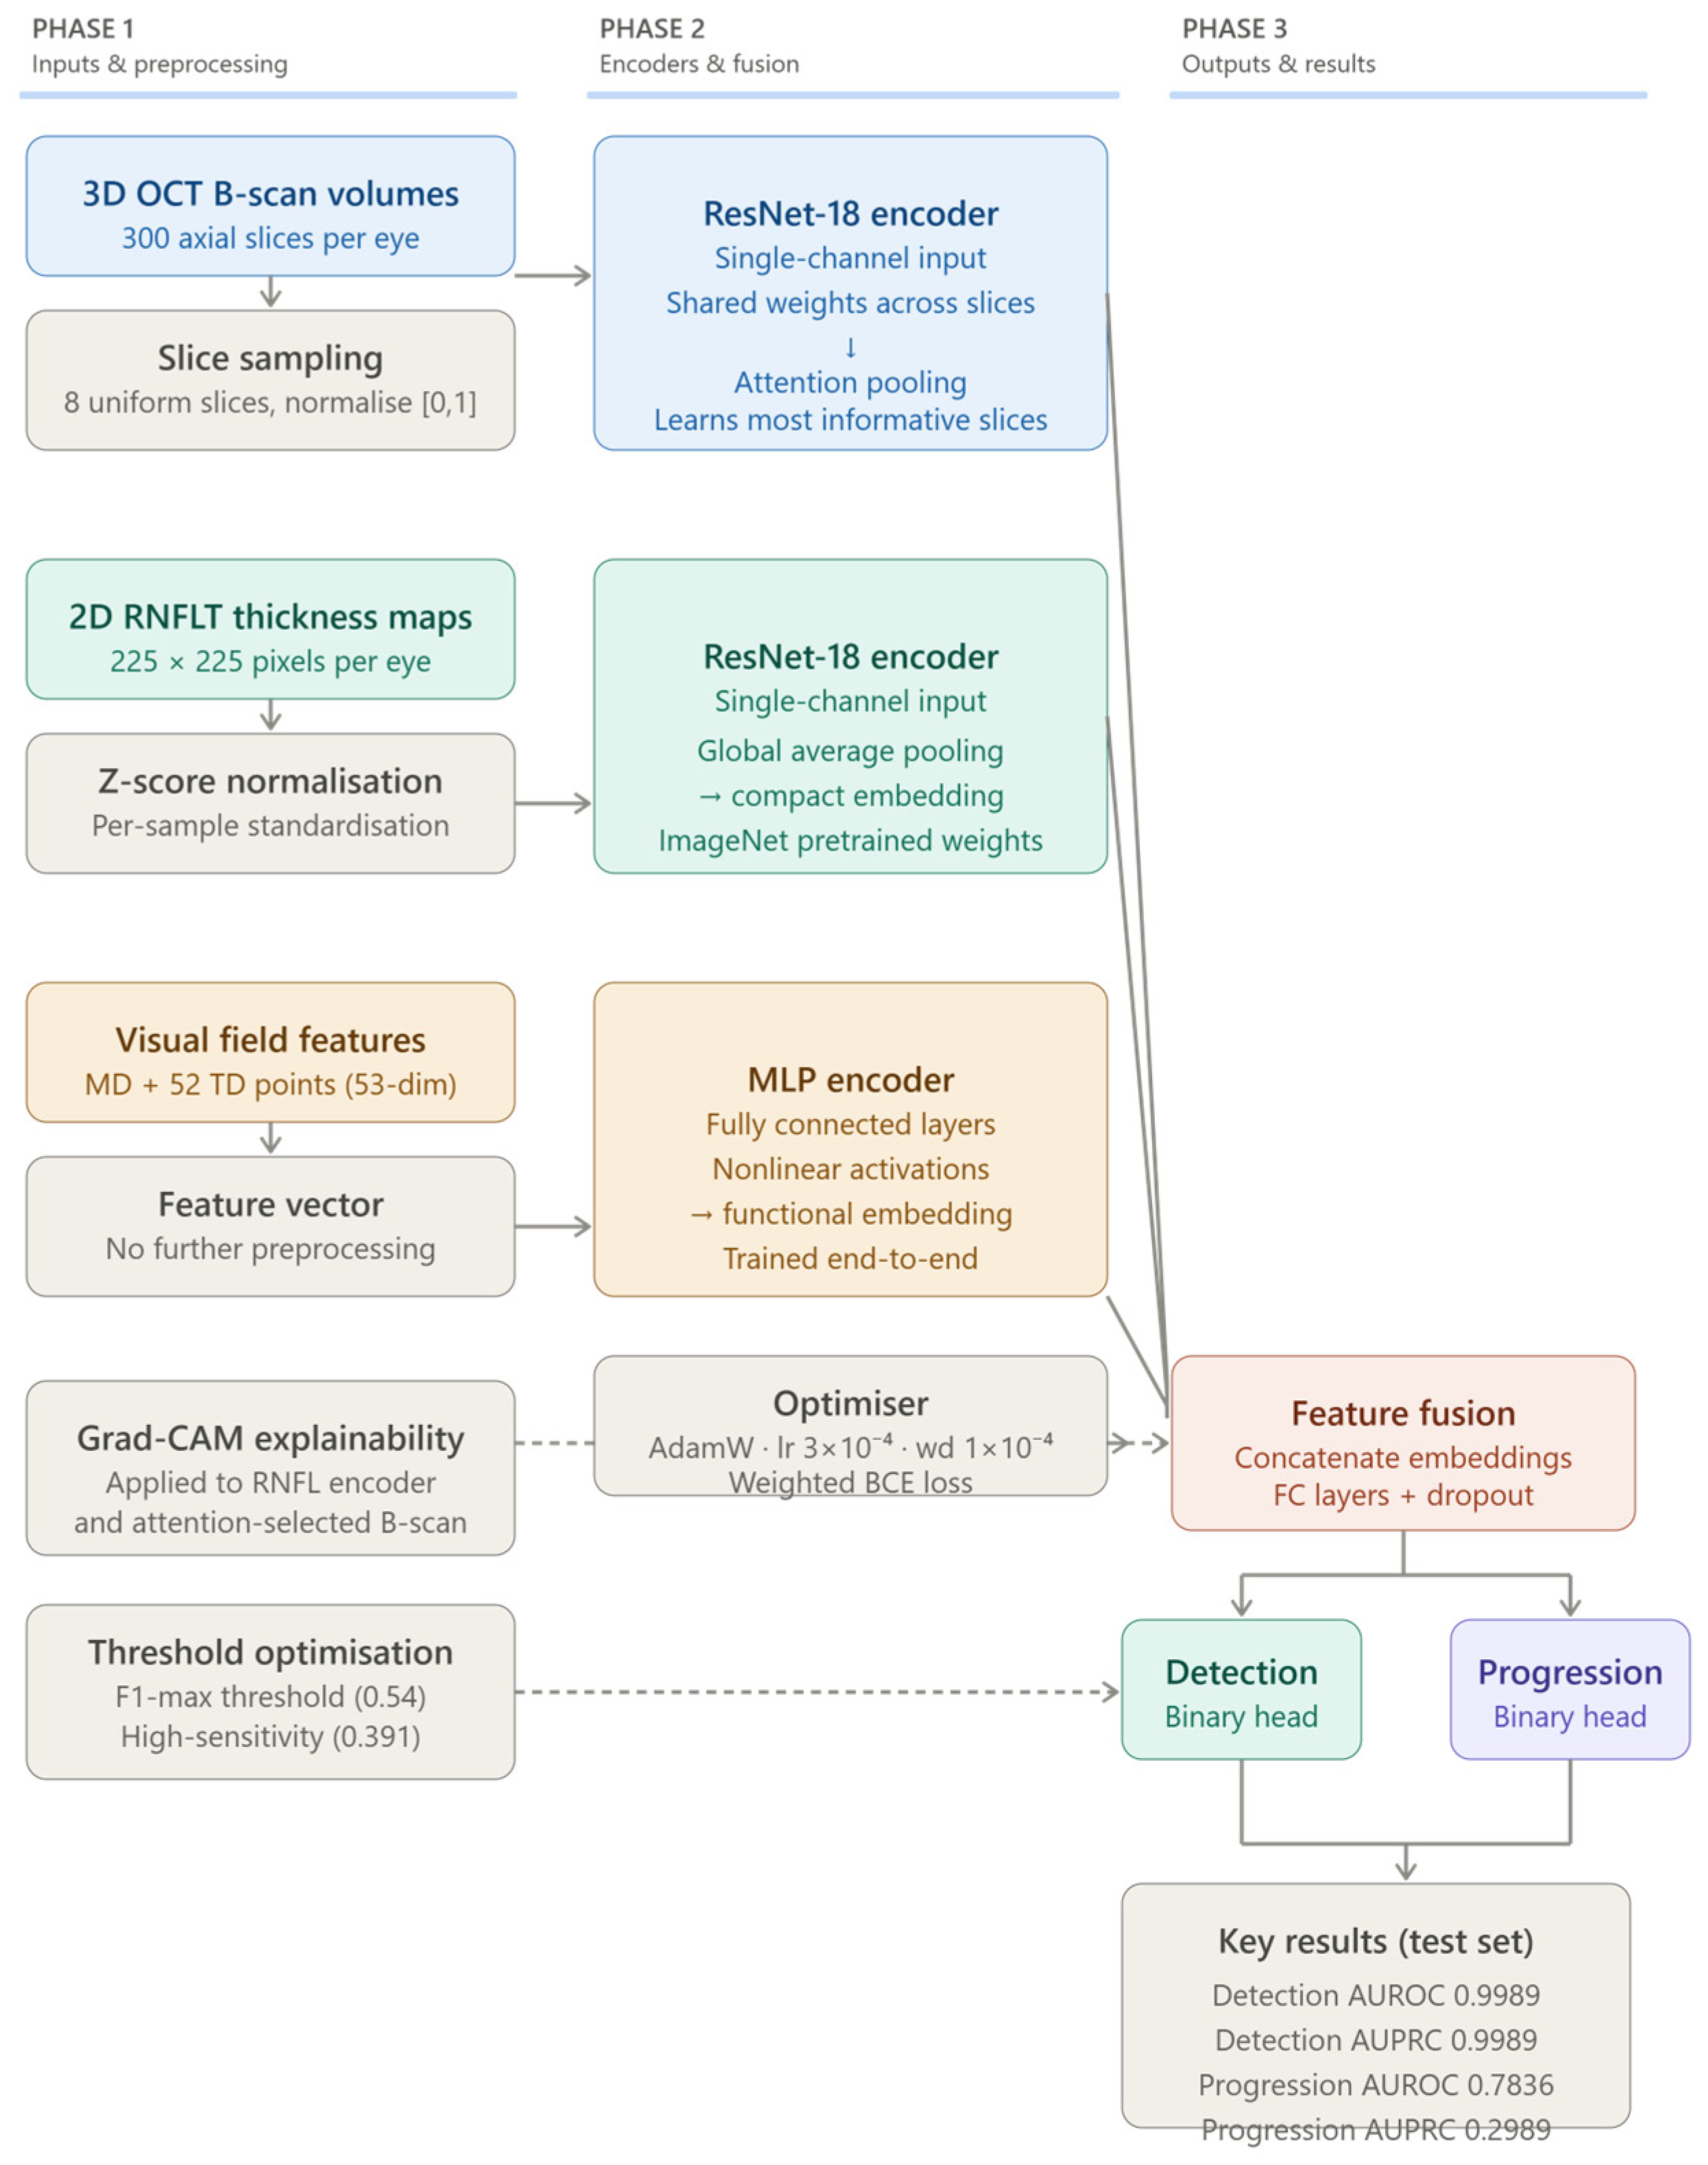
Figure 5 summarizes the system structure and key results. The figure provides a schematic summary of the implemented multimodal framework and the main reported performance trends. It is intended as a conceptual overview of the model structure and benchmark findings rather than as a separate experimental result.
Figure 5.
System structure and key results. Solid arrows denote the primary data and feature flow through the pipeline. Dashed arrows indicate post-hoc processes, Grad-CAM explainability and threshold optimization, applied after model training.
5. Discussion
The results reveal a stark contrast between the two tasks within the Harvard-GDP benchmark. Glaucoma detection was almost perfectly separable, with near-perfect discrimination (AUROC 0.9989). Progression prediction, however, was substantially more challenging and, accordingly, more clinically informative. The high detection performance confirms the technical effectiveness of the multimodal framework but suggests that diagnostic classification is a less challenging task in this dataset compared to the more clinically actionable goal of progression risk modeling.
5.1. Clinical Significance of Progression Prediction
For the progression prediction task, the full multimodal model achieved an AUROC of 0.7836 and an AUPRC of 0.2989. Given the low prevalence of progression events (9%), the precision–recall performance is particularly significant, representing a 3.3-fold improvement over the baseline. Threshold analysis further demonstrated that the model can be tuned to meet different clinical objectives: the balanced threshold (0.54) improved specificity (0.8077) and reduced false positives, while a high-sensitivity threshold (0.3911) captured nearly all progressors (0.9444 sensitivity) at the cost of a large number of false positives. This trade-off is highly relevant for clinical deployment, where the choice between screening, triage, or close monitoring depends on the specific priorities of the care setting. The clinical implications of a high false-positive rate deserve explicit consideration. At the high-sensitivity operating point, 151 out of 182 true-negative cases were incorrectly flagged as progressors. In a real clinical workflow, each false positive would likely trigger unnecessary follow-up appointments, additional diagnostic imaging, and in some cases anxiety for patients who receive an incorrect risk signal. This burden must be weighed against the benefit of detecting nearly all true progressors (17 of 18, sensitivity 0.9444). In practice, the most appropriate threshold would depend on the relative cost of a missed progressor versus an unnecessary referral in the target care setting. The balanced operating point (threshold 0.54), which reduced false positives to 35 while maintaining a sensitivity of 0.6111, may represent a more clinically viable default for a monitoring or triage tool, whereas the high-sensitivity threshold may be better suited to a first-pass screening context where subsequent confirmatory steps exist.
5.2. Modality Contributions and Ablation Insights
The ablation study provided critical insights into how different ocular modalities contribute to the prediction of disease worsening. VF features emerged as the strongest standalone predictor (AUROC 0.8074), which is clinically plausible, as functional deterioration is a direct marker of disease progression. RNFLT alone resulted in a lower AUROC but provided the highest specificity (0.8571) and precision (0.2571), acting as a conservative structural signal. Full multimodal fusion achieved the best overall AUPRC (0.3117), supporting the value of integrating functional and structural signals for progression risk stratification. However, an important nuance must be acknowledged: the VF-only model achieved a higher AUROC (0.8074) than the full-fusion model (0.7930), meaning that for the specific task of ranking patients by progression risk, functional data alone was slightly superior as a discriminator. This result should not be interpreted as evidence against multimodal integration; rather, it reflects the complementary nature of the modalities. Fusion improved AUPRC, the metric most sensitive to performance on the minority positive class, indicating that structural embeddings added precision for identifying confirmed progressors even when they did not improve overall ranking. The manuscript therefore avoids claiming that multimodal fusion is uniformly superior across all metrics; instead, VF features provide the strongest standalone ranking signal, RNFLT contributes specificity and precision, and their combination yields the best precision–recall balance, which is most clinically relevant for the imbalanced progression task. OCT B-scan performance was poor as a standalone branch (AUROC 0.5617), and several factors likely account for this result. First, the implementation processed individual 2D slices from an inherently 3D volumetric structure, discarding the inter-slice spatial relationships that encode optic nerve head topology and peripapillary atrophy patterns. Second, only 8 slices were uniformly sampled from 300 available, meaning that subtle localized structural changes may have been missed entirely if they were concentrated in unsampled regions. Third, the lightweight ResNet-18 backbone was operating on single-channel greyscale inputs without any temporal or longitudinal context, and no data augmentation was applied to address the small sample size. Fourth, and importantly, the attention-pooling module was trained end-to-end on a progression signal with only 47 positive cases, making it difficult for the module to learn reliable slice-importance weights under such severe imbalance. Together, these factors mean that the current B-scan branch is best understood as a proof-of-concept that establishes a lower bound on volumetric structural modelling, rather than a definitive assessment of OCT information content. More advanced approaches, such as 3D convolutional encoders, transformer-based volumetric aggregation, or longitudinal sequence modelling across multiple visits, are expected to substantially improve B-scan-derived progression prediction in future work.
5.3. Explainability and Model Trust
The Grad-CAM explainability analysis provided qualitative, exploratory evidence regarding the clinical plausibility of the model’s feature usage. True-positive cases tended to show concentrated activation in localized peripapillary regions, while false positives often showed more diffuse or peripheral attention patterns, suggesting possible sensitivity to ambiguous structural features or image artefacts. These findings are presented as preliminary observations and should not be interpreted as confirmatory evidence of clinical alignment. No quantitative localization metric or independent expert-rating analysis was performed, and future work should include such validation to substantiate these qualitative patterns. Nevertheless, the absence of obviously implausible activation patterns, such as systematic focus on non-retinal image borders or background noise, is an encouraging early sign that the model may be attending to diagnostically meaningful regions. Such visualizations remain a useful communication tool for establishing initial transparency with clinical stakeholders.
5.4. Challenges and Future Work
Several challenges of this study should be noted. The progression task involved a small number of positive cases, which contributed to some training instability and high sensitivity to threshold selection. Additionally, the study was limited to a single benchmark dataset (Harvard-GDP), and this represents a critical limitation that must be emphasized strongly. The Harvard-GDP dataset was collected under specific acquisition protocols, device settings, and patient demographics that may not reflect the heterogeneity of real-world glaucoma populations. Generalizability of the reported results cannot be assumed without external validation across different OCT devices (e.g., Heidelberg Spectralis, Topcon, Zeiss Cirrus), different visual field testing protocols and perimeters, different clinical sites with varying imaging quality standards, and ethnically and demographically diverse populations in whom glaucoma prevalence, presentation, and progression rates may differ substantially. The authors therefore caution that the results reported here should be interpreted as a proof-of-concept demonstration on a controlled benchmark, not as evidence of clinical readiness for deployment. The B-scan modeling strategy was intentionally made lightweight; future work should explore more advanced techniques, such as 3D convolutional modeling, transformer-based aggregation, or longitudinal sequence modeling, to better capture subtle volumetric structural changes over time. Finally, the scope of the experimental design and model optimization was substantially constrained by the GPU memory available on free Google Colab (NVIDIA T4, approximately 15 GB VRAM). This imposed several concrete limitations: (i) the batch size was restricted to 2, which increases gradient variance and may have reduced training stability, particularly for the minority progression class; (ii) only ResNet-18 was feasible as a backbone, as deeper architectures (ResNet-50 and above) caused out-of-memory errors at the required input resolution; (iii) the OCT branch processed only 8 sampled slices rather than the full 300-slice volume, limiting the volumetric information available to the model; and (iv) all modality configurations were trained for a conservative, fixed epoch budget to ensure that ablation runs remained comparable and completed within Colab session time limits. No early stopping was applied; instead, the best checkpoint by validation AUROC was retained. Future work should be conducted on high-performance computing (HPC) infrastructure to allow larger batch sizes, deeper backbones, full-volume OCT processing, and extended training schedules, all of which are expected to improve model performance.
In conclusion, these findings support the clinical potential of explainable multimodal AI for glaucoma progression-risk identification.
6. Conclusions
This study developed and evaluated an explainable multimodal deep learning framework for the dual tasks of glaucoma detection and progression prediction using the Harvard-GDP benchmark. The findings demonstrate that integrating structural ocular imaging with functional perimetry data provides a robust foundation for both highly accurate diagnostic classification and clinically meaningful progression risk estimation.
For the glaucoma detection task, the proposed multimodal model achieved near-perfect performance, with an AUROC of 0.9989 and a specificity of 1.0000, confirming that the joint representation of OCT and visual field data captures highly discriminative patterns for identifying the disease. However, the study highlights that progression prediction is a substantially more challenging and translationally relevant problem. For this task, the framework achieved an AUROC of 0.7836 and an AUPRC of 0.2989, representing an improvement of 3.3 times over the baseline progression prevalence.
A key contribution of this work is the insight gained from ablation analysis, which revealed a complementary relationship between modalities. Visual field features provided the strongest standalone ranking signal, the RNFL thickness maps contributed a more conservative structural signal with higher specificity, and the full multimodal fusion model resulted in the best overall precision–recall performance. Furthermore, threshold optimization demonstrated that model behavior can be tuned to meet different clinical needs, from balanced monitoring to high-sensitivity screening.
The integration of Grad-CAM explainability further supports the clinical utility of the framework by suggesting that the model attends to clinically plausible peripapillary regions for its predictions. The current slice-based B-scan implementation showed limitations, but these results point toward a promising future for multimodal AI in glaucoma care. Future research should prioritize external validation across diverse populations, OCT devices, visual field protocols, and clinical sites before any claims of clinical generalizability can be made. The development of advanced volumetric and longitudinal modelling strategies, including 3D convolutional encoders, transformer-based aggregation, and multi-visit sequence models, is also needed to better exploit the structural information available in OCT volumes. Implementation on high-performance computing infrastructure will be essential to enable these advances.
Author Contributions
Conceptualization, A.A.-A. and W.A.-N.; methodology, A.A.-A. and H.A.; software, H.A.; validation, A.A.-A., H.A. and W.A.-N.; formal analysis, H.A.; investigation, A.A.-A. and H.A.; resources, A.A.-A.; data curation, H.A.; writing—original draft preparation, A.A.-A. and H.A.; writing—review and editing, A.A.-A. and W.A.-N.; visualization, H.A.; supervision, A.A.-A. and W.A.-N.; project administration, A.A.-A. All authors have read and agreed to the published version of the manuscript.
Funding
This research received no external funding.
Data Availability Statement
The data used in this study are publicly available from the Harvard Glaucoma Detection and Progression (Harvard-GDP) dataset repository at https://github.com/Harvard-Ophthalmology-AI-Lab/Harvard-GDP (accessed on 23 February 2026).
Acknowledgments
The authors express their gratitude to the American University of Ras Al Khaimah, School of Engineering and Computing, for providing the time and support that facilitated the analysis and writing of this paper.
Conflicts of Interest
The authors declare no conflicts of interest.
Abbreviations
The following abbreviations are used in this manuscript:
| AI | Artificial Intelligence |
| AUPRC | Area Under the Precision–Recall Curve |
| AUROC | Area Under the Receiver Operating Characteristic Curve |
| DL | Deep Learning |
| Grad-CAM | Gradient-weighted Class Activation Mapping |
| MD | Mean Deviation |
| MLP | Multilayer Perceptron |
| OCT | Optical Coherence Tomography |
| ONH | Optic Nerve Head |
| RNFL | Retinal Nerve Fiber Layer |
| RNFLT | Retinal Nerve Fiber Layer Thickness |
| SAP | Standard Automated Perimetry |
| TD | Total Deviation |
| VF | Visual Field |
| XAI | Explainable Artificial Intelligence |
References
- Mandal, S. Deep Learning to Predict Glaucoma Progression Using Structural Changes in the Eye. Ph.D. Dissertation, Department of Electrical and Computer Engineering, Duke University, Durham, NC, USA, 2024. [Google Scholar]
- Akter, N.; Gordon, J.; Li, S.; Poon, M.; Perry, S.; Fletcher, J.; Chan, T.; White, A.; Roy, M. Glaucoma detection and staging from visual field images using machine learning techniques. PLoS ONE 2025, 20, e0316919. [Google Scholar] [CrossRef] [Scilit] [PubMed]
- Tham, Y.-C.; Li, X.; Wong, T.Y.; Quigley, H.A.; Aung, T.; Cheng, C.-Y. Global prevalence of glaucoma and projections of glaucoma burden through 2040: A systematic review and meta-analysis. Ophthalmology 2014, 121, 2081–2090. [Google Scholar] [CrossRef] [Scilit] [PubMed]
- Hussain, S.; Chua, J.; Wong, D.; Lo, J.; Kadziauskiene, A.; Asoklis, R.; Barbastathis, G.; Schmetterer, L.; Yong, L. Predicting glaucoma progression using deep learning framework guided by generative algorithm. Sci. Rep. 2023, 13, 19960. [Google Scholar] [CrossRef] [Scilit] [PubMed]
- Christopher, M.; Bowd, C.; Belghith, A.; Goldbaum, M.H.; Weinreb, R.N.; Fazio, M.A.; Girkin, C.A.; Liebmann, J.M.; Zangwill, L.M. Deep learning approaches predict glaucomatous visual field damage from optical coherence tomography optic nerve head enface images and retinal nerve fiber layer thickness maps. Ophthalmology 2020, 127, 346–356. [Google Scholar] [CrossRef] [Scilit] [PubMed]
- Yasuda, S.; Hasegawa, T.; Yoshimoto, S.; Sugisawa, K.; Ohno, M.; Shiotani, Y.; Teramatsu, R.; Iemura, H.; Shibata, Y.; Ohno-Matsui, K.; et al. Deep learning–based prediction of visual field mean deviation from numeric OCT data in glaucoma. J. Imaging Inform. Med. 2026. [Google Scholar] [CrossRef] [Scilit] [PubMed]
- Aranha, G.D.A.; Fernandes, R.A.S.; Morales, P.H.A. Deep transfer learning strategy to diagnose eye-related conditions and diseases: An approach based on low-quality fundus images. IEEE Access 2023, 11, 37403–37411. [Google Scholar] [CrossRef] [Scilit]
- Sriwatana, K.; Puttanawarut, C.; Suwan, Y.; Achakulvisut, T. Deep learning for glaucomatous structure-function correlation. Transl. Vis. Sci. Technol. 2025, 14, 22. [Google Scholar] [CrossRef] [Scilit] [PubMed]
- Kim, D.; Seo, S.B.; Park, S.J.; Cho, H.-K. Deep learning visual field global index prediction with optical coherence tomography parameters in glaucoma patients. Sci. Rep. 2023, 13, 18304. [Google Scholar] [CrossRef] [Scilit] [PubMed]
- Scuderi, G.; Fragiotta, S.; Scuderi, L.; Iodice, C.M.; Perdicchi, A. Ganglion cell complex analysis in glaucoma patients: What can it tell us? Eye Brain 2020, 12, 33–44. [Google Scholar] [CrossRef] [Scilit] [PubMed]
- Mahmoudinezhad, G.; Mohammadzadeh, V.; Martinyan, J.; Edalati, K.; Zhou, B.; Yalzadeh, D.; Amini, N.; Caprioli, J.; Nouri-Mahdavi, K. Comparison of ganglion cell layer and ganglion cell/inner plexiform layer measures for detection of early glaucoma. Ophthalmol. Glaucoma 2023, 6, 58–67. [Google Scholar] [CrossRef] [Scilit] [PubMed]
- Park, K.; Kim, J.; Lee, J. A deep learning approach to predict visual field using optical coherence tomography. PLoS ONE 2020, 15, e0234902. [Google Scholar] [CrossRef] [Scilit] [PubMed]
- Harvard Ophthalmology AI Lab. Harvard-GDP [Dataset]; GitHub: San Francisco, CA, USA, 2023; Available online: https://github.com/Harvard-Ophthalmology-AI-Lab/Harvard-GDP (accessed on 1 October 2025).
- Saunders, L.J.; Russell, R.A.; Kirwan, J.; McNaught, A.; Crabb, D.P. Examining visual field loss in patients in glaucoma clinics during their predicted remaining lifetime. Investig. Ophthalmol. Vis. Sci. 2014, 55, 102–109. [Google Scholar] [CrossRef] [Scilit]
- Musch, D.C.; Gillespie, B.W.; Niziol, L.M.; Lichter, P.R.; Varma, R. Intraocular pressure control and long-term visual field loss in the Collaborative Initial Glaucoma Treatment Study. Ophthalmology 2011, 118, 1766–1773. [Google Scholar] [CrossRef] [Scilit] [PubMed]
- De Moraes, C.G.; Liebmann, J.M.; Levin, L.A. Detection and measurement of visual field progression in glaucoma. Prog. Retin. Eye Res. 2017, 56, 107–147. [Google Scholar] [CrossRef] [Scilit] [PubMed]
- Jonas, J.B.; Weber, P.; Nagaoka, N.; Ohno-Matsui, K. Glaucoma in high myopia and parapapillary delta zone. PLoS ONE 2017, 12, e0175120. [Google Scholar] [CrossRef] [Scilit] [PubMed]
- Wollstein, G.; Kagemann, L.; Bilonick, R.A.; Ishikawa, H.; Folio, L.S.; Gabriele, M.L.; Ungar, A.K.; Duker, J.S.; Fujimoto, J.G.; Schuman, J.S. Retinal nerve fibre layer and visual function loss in glaucoma: The tipping point. Br. J. Ophthalmol. 2012, 96, 47–52. [Google Scholar] [CrossRef] [Scilit] [PubMed]
- Moghimi, S.; Bowd, C.; Zangwill, L.M.; Penteado, R.C.; Hasenstab, K.; Hou, H.; Ghahari, E.; Manalastas, P.I.C.; Proudfoot, J.; Weinreb, R.N. Measurement floors and dynamic ranges of OCT and OCT angiography in glaucoma. Ophthalmology 2019, 126, 980–988. [Google Scholar] [CrossRef] [Scilit] [PubMed]
- Geevarghese, A.; Wollstein, G.; Ishikawa, H.; Schuman, J.S. Optical coherence tomography and glaucoma. Annu. Rev. Vis. Sci. 2021, 7, 693–726. [Google Scholar] [CrossRef] [Scilit] [PubMed]
- Tiang, J.; Vingrys, A.J.; Lin, S.; Prea, S.M.; Moktar, A.A.; Bank, A.; Agar, A.; Kong, Y.X.G. Multi-centre comparison between device-independent web-browser perimetry (Melbourne Rapid Fields-web) and SITA-Faster for glaucoma. Front. Ophthalmol. 2025, 5, 1485950. [Google Scholar] [CrossRef] [Scilit]
- Kim, H.; Lee, J.; Moon, S.; Kim, S.; Kim, T.; Jin, S.W.; Kim, J.L.; Shin, J.; Lee, S.U.; Jang, G.; et al. Visual field prediction using a deep bidirectional gated recurrent unit network model. Sci. Rep. 2023, 13, 11154. [Google Scholar] [CrossRef] [Scilit] [PubMed]
- Pham, Q.T.M.; Han, J.C.; Park, D.Y.; Shin, J. Multimodal deep learning model of predicting future visual field for glaucoma patients. IEEE Access 2023, 11, 19049–19058. [Google Scholar] [CrossRef] [Scilit]
- Kihara, Y.; Montesano, G.; Chen, A.; Amerasinghe, N.; Dimitriou, C.; Jacob, A.; Chabi, A.; Crabb, D.P.; Lee, A.Y. Policy-driven, multimodal deep learning for predicting visual fields from the optic disc and optical coherence tomography imaging. Ophthalmology 2022, 129, 781–791. [Google Scholar] [CrossRef] [Scilit] [PubMed]
- He, K.; Zhang, X.; Ren, S.; Sun, J. Deep residual learning for image recognition. In Proceedings of the IEEE Conference on Computer Vision and Pattern Recognition, Las Vegas, NV, USA, 27–30 June 2016; pp. 770–778. [Google Scholar]
- Khan, S.; Naseer, M.; Hayat, M.; Zamir, S.W.; Khan, F.S.; Shah, M. Transformers in vision: A survey. ACM Comput. Surv. 2022, 54, 1–41. [Google Scholar] [CrossRef] [Scilit]
- Maurício, J.; Domingues, I.; Bernardino, J. Comparing vision transformers and convolutional neural networks for image classification: A literature review. Appl. Sci. 2023, 13, 5521. [Google Scholar] [CrossRef] [Scilit]
- Wang, D.; Lian, J.; Jiao, W. Multi-label classification of retinal disease via a novel vision transformer model. Front. Neurosci. 2024, 17, 1290803. [Google Scholar] [CrossRef] [Scilit] [PubMed]
- Yang, Y.; Cai, Z.; Qiu, S.; Xu, P. Vision transformer with masked autoencoders for referable diabetic retinopathy classification based on large-size retina image. PLoS ONE 2024, 19, e0299265. [Google Scholar] [CrossRef] [Scilit] [PubMed]

Disclaimer/Publisher’s Note: The statements, opinions and data contained in all publications are solely those of the individual author(s) and contributor(s) and not of MDPI and/or the editor(s). MDPI and/or the editor(s) disclaim responsibility for any injury to people or property resulting from any ideas, methods, instructions or products referred to in the content. |
© 2026 by the authors. Licensee MDPI, Basel, Switzerland. This article is an open access article distributed under the terms and conditions of the Creative Commons Attribution (CC BY) license.