Abstract
The centrifugal compressor is the heart that drives the operation of natural gas pipeline systems. Under low-throughput conditions, natural gas often returns back to the compressor through the surge control valve to increase the flow rate and avoid surge. However, how to reasonably determine the opening of the surge control valve is still an important problem in production. To predict the opening of the surge control valve in a centrifugal compressor, this work proposes a BP neural network optimized by the grey wolf optimizer (GWO). Five key parameters, including compressor shell vibration, power turbine speed, compressor inlet pressure, compressor outlet temperature, and gas turbine power, are determined to be key factors correlated to the opening of the surge control valve, and the relationships of these parameters are physically analyzed from a physical perspective. Compared with the other five parallel models, the GWO–BP method effectively optimizes the initial weights and thresholds of the neural network, reduces the probability of falling into a local optimum, and significantly improves prediction accuracy and stability. The root mean square error (RMSE), determination coefficient (R-square), and mean absolute error (MAE) of the GWO–BP model are all the best fit, and the predicted and actual openings of the surge control valve match well, with the average relative deviation being 4.65%, indicating that the GWO–BP model proposed in this paper has a good ability to predict the opening of surge control valves.
1. Introduction
Energy conservation and carbon reduction are not only important measures to deal with the energy crisis, but are critical ways to ensure energy security and to promote high-quality development. As the cleanest fossil fuel, natural gas has long been recognized as a promising option for reducing carbon emissions [1]. Large-scale transportation of natural gas is mainly achieved through pipelines, and the compressor is the “heart” that drives the normal operation of natural gas pipeline systems [2,3]. As high energy-consumption equipment, the potential of the compressor unit itself for energy saving and consumption reduction is quite limited. A feasible solution is to keep the compressor unit running in a high efficiency area. However, affected by downstream gas consumption and unified dispatching, the compressor is prone to surge when the number of operation units increases, the pipeline throughput decreases, or the compressor inlet and outlet pressures are limited [4]. Compressor surge is an unstable state that presents strong flow and pressure oscillations. It causes damage to compressor components, such as the thrust bearings, the dry gas seals, and the impellers, as well as the associated piping system. The stress and wear endured by these components will increase, which shortens the service life of the compressor and increases equipment maintenance costs and replacement frequency [5]. In worst-case scenarios, it even leads to fire and explosion accidents.
In compressor surge, the surge control valve would be opened when the working point on the operating characteristic curve approaches the surge control line, so that part of the natural gas returns to the compressor from the outlet to the inlet, which helps to increase the inlet natural gas flow rate to prevent surge [6]. When the pressure on the downstream pipeline network connected to the compressor is greater than the compressor outlet pressure, a backflow of natural gas can occur, and the surge control valve needs to be opened to increase the entrance pressure. If the opening is too small, it is unable to effectively alleviate the compressor surge; while excessive opening of surge control valve lowers the operating efficiency of the compressor unit [7,8,9].
To appropriately determine the opening of the surge control valve to avoid compressor surge, He et al. [10] proposed an RBF neural network with inlet flow as the input parameter for intelligent control of the centrifugal compressor surge control. It decreased the margin and backflow rate of the surge control line and improved the response speed and the economy of the compressor operation. Sheng et al. [11] presented a nonlinear predictive surge control method based on a flow estimator to address the hard constraint of the control variable and the impact of the actuator delay with dynamic uncertainty. The active/passive surge passive hybrid control strategy was verified to be effective to ensure the safe and stable operation of the compression system. Cortinovis et al. [12] presented a compressor surge control system based on model predictive control. It used the linear approximation of a nonlinear dynamic model to predict the compressor behavior and achieved the safe and efficient operation of the compressor station. From a perspective of improving hardware, Oh et al. [13] developed a short-cut graphical method to determine the recycle valve size in the surge control system. The dead time, actuation time, and opening types were considered. Dynamic simulations showed that this method could effectively and economically avoid compressor surge. Zhao et al. [14] focused on the effects of a self-recirculation casing treatment to improve the surge margin of the centrifugal compressor of aero-engines. The impact of the casing treatment on the surge trigger, surge cycles, and inlet acoustic characteristics were experimentally investigated.
Accurately predicting the opening is the basis and premise for scheduling the control schemes of surge control valves. However, current surge control research mainly focuses on the design of the control scheme and improvement of the hardware, while predicting the opening of surge control valve has been paid little attention. Moreover, the opening of the surge control valve is actually affected by various factors, including compressor rotational speed, power, and vibration, among other factors. Most of the works in this field, however, only take into account the flow rate, while other factors are ignored. Appropriately setting the opening of the surge control valve based on the operation condition of the compressor to improve working efficiency and to reduce energy consumption is a severe challenge faced by the management of a natural gas pipeline network. In response, this work comprehensively collects the operating parameters of the centrifugal compressor that are relevant to the opening of the surge control valve, and the Pearson correlation coefficient is used to obtain high correlation parameters. Given the strong nonlinear mapping capability of BP and the high optimization efficiency of the grey wolf optimizer (GWO), this work employs the GWO to optimize a BP neural network to predict the opening of the surge control valve. The proposed hybrid model achieves high prediction accuracy and excellent generalization capacity, which helps to set the opening of the surge control valve for low-flow natural gas pipelines to minimize gas backflow and to improve compressor efficiency.
The main contributions of this paper are as follows:
- (1)
- A GWO–BP hybrid model is proposed to predict the opening of the surge control valve for the centrifugal compressor. It utilizes the grey wolf algorithm to globally optimize the initial weights and thresholds of the BP neural network, and to further improve the prediction accuracy and convergence speed of the model.
- (2)
- Shell vibration, turbine speed, inlet pressure, outlet temperature, and gas turbine power are identified as the key features affecting the opening of the surge control valve. By combining the mechanism of surge, the influence laws of each parameter are revealed.
- (3)
- Verification based on actual operational data proves the advantage of the proposed model over SVM, decision tree, KNN, BP, and PSO-BP. The average relative deviation of GWO–BP prediction is only 4.65%, demonstrating high accuracy and engineering applicability of the GWO–BP hybrid model.
2. Background of the Problem
A compressor station of a natural gas transmission pipeline in South China is equipped with two sets of 30 MW compressor units driven by gas turbines. Figure 1 gives the process flow of the compressor area. It operates in a one-in-use, one-on-standby mode. Under normal circumstances, the surge control valve is completely closed. When the working point touches the surge line, the compressor unit surges and shuts down. When the working point approaches the surge control line, the surge control valve opens fully, accompanied by significant vibration of the compressor unit. When the high alarm threshold is reached, interlocking shutdown would be triggered. If the surge control valve is fully open for a long time, the outlet temperature of the compressor would rise continuously. To maintain stable operation of the compressor unit and to avoid the occurrence of surge events, the operating personnel manually open the surge control valve based on the distance between the working point and the surge control line. Sometimes the surge control valve is left open for extended periods due to the workload of the operators; thus, the compressor unit continues to operate in a state of high energy consumption and low efficiency.
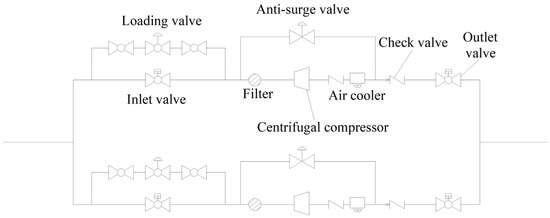
Figure 1.
Process flow diagram of the compressor area.
Since 2024, the compressor unit has been running in all-weather with a high load. The operation condition has long been deviating from design due to the overall influence of the process pipeline. On the premise that the inlet and outlet pressures meet the design requirements, the inlet flow rate of the compressor could reach the design only by opening the surge control valve. As shown in Table 1, the overall gas consumption of the compressor unit in 2024 is similar to that of previous years, but the cumulative delivery volume has decreased significantly from 5.204 billion cubic meters to 4.853 billion, which indicates a sharp decrease in compressor efficiency. As shown in Table 2, the average delivery volume of the compressor station in the third quarter of 2024 was much lower than the same period in 2023, falling from 878,300 m3 to 724,800 m3, while the outlet pressure was much higher than the same period in 2023, rising from 7.75 MPa to 8.30 MPa. The low flow rate and high outlet pressure conditions bring low operation efficiency and high energy consumption to the compressor station.

Table 1.
Energy consumption and throughput of the compressor unit at a compressor station in 2023 and 2024.
Table 2.
Detailed energy consumption and throughput of the compressor unit at a compressor station in the third quarter of 2023 and 2024.
The relationship of the surge control valve opening to compressor rotational speed and energy consumption is further analyzed. As shown in Figure 2, the variation trends of the fuel gas consumption and rotational speed of the compressor unit are basically the same. For a considerable period of time, the curves of these two parameters almost overlap each other. From 1 April to 7 April and from 11 April to 18 April, the average speed of the compressor was relatively stable. In these two periods, a larger opening of the surge control valve brings about greater gas consumption and lower delivery volume. Moreover, the opening of surge control valve is affected by various factors, such as compressor rotational speed, power, and fuel gas consumption, as well as inlet flow rate. However, most of the works in this field only consider the inlet flow rate as the basis for setting the opening of the surge control valve. Comprehensively considering the impact of multiple factors on the opening of the surge control valve is critically important to ensure the efficient and safe operation of the compressor unit.
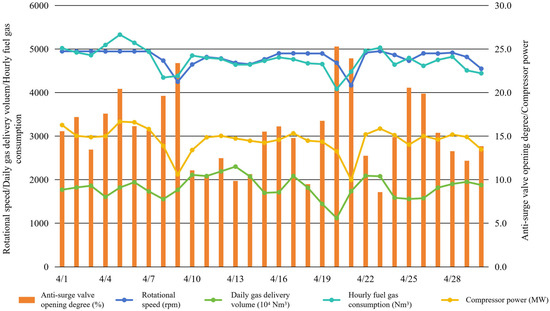
Figure 2.
Variation trends of surge control valve opening degree, average rotational speed, daily gas delivery volume, hourly fuel gas consumption, and compressor power at a compressor station in April, 2024.
3. Theoretical Basis
3.1. BP Neural Network
The backpropagation neural network (BP) is a multi-layer feedforward neural network with error backpropagation capability. It is widely used in prediction, classification, and recognition [15,16]. A BP neural network is mainly composed of the input layer, the hidden layer, and the output layer, which are connected by weights and thresholds. A standard neuron unit in the hidden layer of a neural network includes input and output variables, weights, and biases. Equation (1) describes how the output of a neuron is correlated to the input variables, as follows:
where is the weight vector, bj is the bias, f is the transfer function, , and yi are the input and output variables, respectively.
The BP neural network possesses strong adaptive, self-learning, and nonlinear approximation capabilities. Meanwhile, its learning rate is slow and it easily falls into local minima [17]. Therefore, the initial weights and thresholds are iteratively optimized by using the excellent global optimization ability and fast convergence of swarm intelligence algorithm.
3.2. Grey Wolf Optimizer (GWO)
The swarm intelligence algorithm is enlightened by the behaviors of biological groups (ant colonies, bird colonies, fish schools, etc.) in nature. It seeks the optimal solution by simulating the intelligent behaviors between individuals. The grey wolf optimizer (GWO) is a type of swarm intelligence algorithm that mimics the hierarchical division principle and communication mechanism of grey wolf populations during hunting [18]. The activities of grey wolves follow a strict hierarchy. The whole population is divided into alpha, beta, delta, and omega wolves, where the alpha wolf has supreme authority and is the manager of the pack; beta wolves assist the alpha to make decisions and to convey commands; delta wolves are mainly responsible for reconnaissance and pursuit, and follow the orders of the alpha and beta wolves; omega wolves rank the lowest and they directly execute siege orders against prey. In the GWO, the alpha wolf is taken as the optimal solution, beta wolves and delta wolves are suboptimal solutions, and omega wolves represent the remaining candidates.
To achieve the global optimal solution, it is necessary to determine the position of each individual after labor division for the different grades of grey wolves. Then, omega wolves are led by the alpha wolf, beta wolves, and delta wolves to hunt. This process can be expressed as follows:
where t is the current iteration number, Xp(t) is the prey position, X(t) is the grey wolf position, and A and C are coefficient vectors.
Location updating of the grey wolves is given by the following equation:
where , , and are the distance between candidate and optimal wolves after t iterations and , , and are position vectors of the alpha, beta, and delta wolves.
The direction of the wolf movement is as follows:
The location of the grey wolves after t + 1 iteration is as follows:
3.3. GWO–BP Model for Predicting Opening of Surge Control Valve
For a conventional BP neural network, the weights and biases are constantly adjusted and their initial values are empirically set, which increases calculation uncertainty and tends to fall into the local optimal. In response, the initial weight and bias of the neural network structure is optimized by using the GWO algorithm before training. The weights and biases are mapped to the positions of the grey wolves, and the alpha, beta, and delta wolves are generated, which facilitates updating the positions of the omega wolves. Then, by continuously conducting iteration and optimization, the convergence condition is satisfied. Finally, the output alpha wolf position is given as the optimal weight and bias.
The implementation flowchart of the GWO–BP model is showcased in Figure 3. Firstly, the fundamental data set is normalized and divided into training and test sets at a 9:1 ratio. Then, a single hidden layer neural network structure is built and the GWO algorithm is employed to optimize the weight and threshold. The mean square error (MSE) is taken as the adaptation function to calculate the fitness of each individual, and the best fitness is updated by comparing the newly obtained and current fitness. When the number of iteration reaches the maximum or the fitness reaches the best, iteration is ended and the optimal parameter combination is output. Finally, the prediction results are reversely normalized and compared with the simulation data.
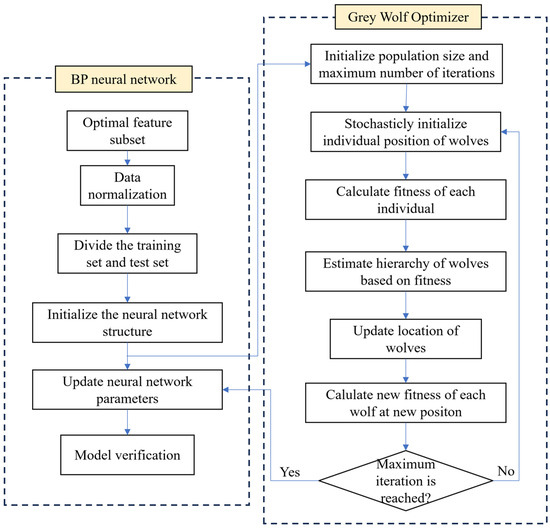
Figure 3.
Implementation process of the GWO–BP-based model for predicting the opening degree of the surge control valve.
4. Data Processing and Physical Analysis
4.1. Data Collection and Preprocessing
Twenty-two operating parameters of the centrifugal compressor are taken as the input layer variables of the GWO–BP model, including compressor shell vibration, combustion chamber shell vibration, power turbine shell vibration, inlet air temperature, compressor inlet pressure difference, fuel gas outlet pressure, accumulated fuel gas flow, fuel gas outlet temperature, power turbine speed, compressor inlet pressure, compressor power, gas temperature of the low pressure turbine, compressor inlet temperature, compressor outlet temperature, air cooler outlet temperature, non-driving end shaft vibration X and Y, compressor driving end shaft vibration X and Y, box temperature, and surge control valve operating point. These parameters are denoted as F1~F22, respectively. Opening of the surge control valve is the only node of the output layer, and it is denoted as F23. In this work, data used for model training and testing were collected from a compressor station of a natural gas transmission pipeline in South China, spanning from January 2023 to September 2024, with a total of 532 valid operational samples. To speed up the training process and to avoid numerical instability, all the data are normalized and the variables are converted to the range [−1, 1]. The normalization process can be expressed as follows:
where xn is the normalized parameter and xmax and xmin are the maximum and minimum values of the input array, respectively.
4.2. Feature Selection
The Pearson correlation coefficient is a measure of the linear correlation between variables X and Y. Its value range is [−1, 1], and it is generally expressed by rp, as follows:
where n is the size of the sample and X and Y are variables. If rp > 0, these two variables correlate to each other positively; if rp = 0, they are irrelevant; if rp < 0, they are negatively correlated: the larger the absolute value of rp, the stronger the correlation of these two variables.
The Pearson correlation coefficient is used to analyze the correlation between the characteristic variables. It is found that most of these variables are poorly correlated. The collinearity threshold is set at 0.7. If the Pearson correlation coefficient between two variables exceeds 0.7, they are taken as highly correlated. For example, the Pearson correlation coefficients between F1 and F2 and F4 and F5 are 0.92 and 0.95, respectively. To avoid adverse effects on model stability and prediction accuracy, the F2 and F5 variables were eliminated in the feature selection. Eventually, five features, including compressor shell vibration, power turbine speed, compressor inlet pressure, compressor outlet temperature, and gas turbine power, are retained. These features not only retain a high correlation to the target variable, but reduce the multicollinearity problem by removing repetitively highly correlated input variables, thus improving the interpretability and prediction accuracy of the model.
4.3. Physical Analysis of Key Parameters on Surge Control Valve Opening
4.3.1. Compressor Shell Vibration
Vibration of the compressor shell is a direct physical manifestation of flow instability of the internal gas; it is also a typical precursor to surge. It has a significant positive correlation with the opening of the surge control valve. When the compressor shows signs of surge before it occurs, the gas in the impeller passage undergoes non-steady flow, such as flow separation and vortex shedding. The resulting periodic pulsating vibration will be transmitted to the shell, causing an increase in vibration. The core function of the surge control valve is to return high-pressure gas from the outlet to the inlet by increasing the opening degree, thereby replenishing the effective inlet flow and reducing the actual pressure ratio. It allows the compressor to operate away from the anti-surge line and eliminates flow instability; thus, the compressor shell vibration is restrained. When shell vibration is within the normal threshold, it indicates that the flow field is stable and the risk of surge is low. The surge control valve only needs to maintain a small opening or can even be fully closed. It should be noted that vibration is a result parameter that reflects the risk of surge, while the opening degree is a regulatory parameter for suppressing vibration and avoiding surge. This correlation only applies to the vibration caused by flow field instability. If the vibration is caused by mechanical faults, such as imbalance of impeller or wear of bearings, adjusting the opening of the surge control valve will not have a damping effect on vibration.
4.3.2. Turbine Speed
Turbine speed is the key parameter that determines the effective flow rate and pressure ratio at the inlet of a centrifugal compressor. These two parameters follow the similarity law of centrifugal compressors and exhibit a significant negative correlation. As turbine speed increases, the suction and compressing capabilities of the impeller improve, resulting in an increase in the inlet flow rate and pressure ratio. The operating point moves away from the anti-surge line, reducing the risk of surge and decreasing the opening of the surge control valve. When the turbine speed decreases, the output power of the impeller decreases, causing a sudden drop in the effective inlet flow rate. Fluid flow separation is more likely to occur in the impeller passage, requiring a larger opening of the surge control valve. By allowing the outlet gas to flow back and replenish the inlet flow, the operating point returns to a safe range. The correlation between the turbine speed and the surge control valve opening is also constrained by the actual operating conditions. At low speed and low inlet pressure, a larger anti-surge opening is required. If an increase of the turbine speed is limited by the pressure of the downstream pipeline network, the reduction of the surge control valve opening will also decrease accordingly.
4.3.3. Inlet Pressure
According to compressor aerodynamic theory, the surge boundary is determined by the minimum mass flow rate at the impeller inlet, and the inlet pressure directly determines the gas density. When the pressure decreases, the density drops. If the volume flow rate remains unchanged, the mass flow rate will inevitably decline synchronously, causing the operating point to shift to the left relative to the surge boundary and the surge margin to drop sharply. To prevent entering the unstable zone, the anti-surge control system must increase the opening degree of the surge control valve to redirect some high-pressure gas back to the inlet, artificially supplementing the mass flow rate. In addition, the inlet pressure is also a common feedforward variable in the anti-surge control logic. Due to the much faster response of the pressure sensor compared to the flowmeter, when a rapid drop in inlet pressure is detected, the controller opens the valve in advance before the surge symptoms fully manifest, achieving an inhibitory intervention of surge.
4.3.4. Compressor Outlet Temperature
Increase in the outlet temperature of the centrifugal compressor usually indicates over-compression of the gas or increased internal energy loss. This increases the compressor’s work and decreases its efficiency. At the same time, the density of the high-temperature gas declines, resulting in a reduction in the actual mass flow rate, which may cause the operating point to approach the surge boundary. To prevent a surge, an incremental adjustment in the surge control valve opening is required; in order to increase the inlet flow rate, lower the outlet pressure and temperature, and thereby maintain the operation of the compressor within a stable and safe area.
4.3.5. Gas Turbine Power
The power of the gas turbine is a direct indicator of the energy input to the compressor. It affects the inlet flow rate and the outlet pressure ratio by altering the compression work, thereby regulating the opening of the surge control valve. When the power increases, the compression work, outlet pressure ratio, and effective flow rate all rises, thus the operating point moves away from the anti-surge line, reducing the risk of surge, and the surge control valve opening degree decreases. When the power decreases, the compression work is insufficient, and the flow rate and pressure ratio decrease. In this case, the opening of the valve needs to be increased to supplement the flow.
5. Model Performance
5.1. Performance Evaluation Indexes
A ten-fold cross-validation is used to verify the performance of the developed GWO–BP model in predicting the opening of the surge control valve of the centrifugal compressor. The root mean square error (RMSE), coefficient of determination (R-square), and mean absolute error (MAE) are employed as evaluation indexes. The RMSE represents the deviation between prediction and measurement: the smaller is the measurement, the higher the prediction accuracy of the model. R-square describes the goodness of model fit to the dependent variables. It ranges from 0 to 1 when the fitting performance ranges from poor to excellent. The MAE measures the average difference between predicted and actual output variables. RMSE, R-square, and MAE are mathematically given as follows [19]:
where n is sample size, Yiexp and Yipred are experiment and prediction, respectively, and is the average of the experimental data.
5.2. Parameter Configuration
Before training, the key hyperparameters of the GWO–BP model must be determined to ensure effective optimization and reliable prediction. For the BP neural network, a three-layer structure with a single hidden layer is adopted. The number of nodes in the input layer is set to five, corresponding to the five selected key features, while the output layer has one node representing the opening of the surge control valve. The number of hidden layer nodes is determined through trial and error, and 10 nodes are selected, as it yields the best balance between prediction accuracy and model complexity. The transfer function for the hidden layer is the hyperbolic tangent sigmoid function (tansig), and the linear function (purelin) is used for the output layer. The Levenberg–Marquardt algorithm (trainlm) is employed as the training function due to its fast convergence and robustness for function approximation problems. The learning rate is set to 0.01, the maximum number of training epochs is 1000, and the target mean square error is 0.0001. For the GWO algorithm, the population size (number of grey wolves) is set to 30, and the maximum number of iterations is set to 50, which provides a favorable trade-off between optimization effectiveness and computational cost.
5.3. Comparison of Prediction Performance of Different Models
Another five parallel control models are established to verify the ability of the GWO–SVM model to predict the opening of surge control valve of centrifugal compressor, including support vector machine (SVM), decision tree, K-nearest neighbor (KNN), conventional BP neural network, and a particle swarm optimization (PSO) improved BP neural network. Figure 4 shows the predictive performance of the six machine learning models on test sets and validation sets. Particularly, for the convenience of intuitive comparison, both the RMSE and MAE in Figure 4 are based on the corresponding index of the GWO–BP model, and the reciprocal of the original value is taken. It can be seen that SVM and decision tree perform poorly on all indexes, especially on the RMSE and MAE, which indicates that their data fitting ability is weak. The curve of the KNN algorithm is closer to the center, which means it performs better on all indexes. The conventional BP neural network performs well on the R-square and MAE index, but the RMSE is slightly higher. The PSO–BP model has an improved performance on all three indexes, and the RMSE and MAE are significantly reduced. The GWO–BP model shows the best performance, with all indexes close to the center, which proves its advantages over other parallel control models.
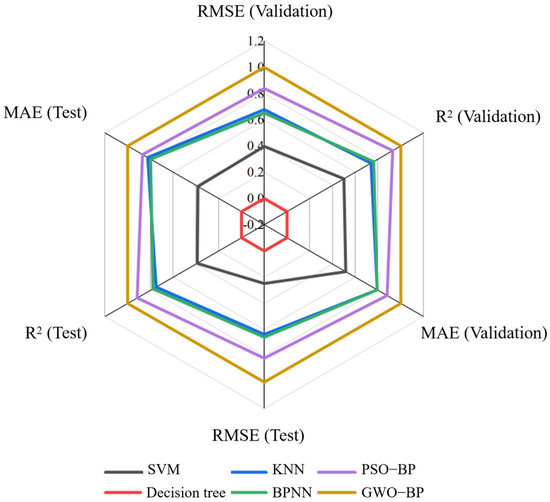
Figure 4.
Radar chart of evaluation indexes using different models.
5.4. Comparison Between Prediction and Measurement Using Different Models
The predicted and measured values of the above five parallel control models and the GWO–BP model are compared. The results are shown in Figure 5. The red diagonal line represents the ideal prediction where it perfectly equals the measured value: the closer the data points are to this line, the higher the model prediction accuracy. It can be seen that, for the SVM, decision tree, KNN, and conventional BP neural network, the data points are scattered relatively far around the diagonal line, indicating large prediction error. For the PSO–BP model, the data points are more concentrated near the diagonal line, indicating that the prediction accuracy of the model is improved by the PSO algorithm. As for the GWO–BP model, the data points are almost closely distributed along the diagonal line, indicating that the prediction error is minimal and the accuracy is the highest.
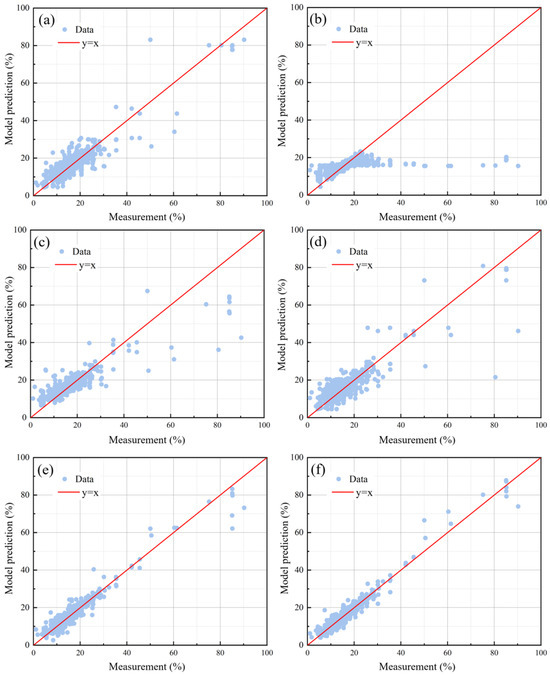
Figure 5.
Comparison of measured and model predicted opening degree of the surge control valve: (a) SVM, (b) decision tree, (c) integrating model, (d) BP, (e) PSO–BP, and (f) GWO–BP.
Figure 6 gives the error distribution of the above six models. It can be seen that SVM presents a relatively wide error distribution with a low peak value, which indicates that the error is scattered and the prediction accuracy and stability is slightly poor. The error concentration of the decision tree model is better than that of the SVM, but it also presents a wide distribution, indicating that its prediction ability for complex nonlinear relations is limited. The error distribution of the KNN algorithm is more concentrated with a narrow curve and a high peak. Thus, its prediction error is relatively low and its accuracy and robustness are better. As for the conventional BP neural network, it has a high peak near the zero error, but the distribution width is slightly larger than KNN, which shows that its error control ability is good, but there may still exist deviations that cannot be ignored. By comparison, the PSO–BP model gives improved accuracy and error control ability with a more concentrated error curve. As for the GWO–BP model, the curve concentrates the best to zero with a narrow distribution and a high peak. The average relative deviation between the predicted and measured openings of the surge control valve is only 4.65%.
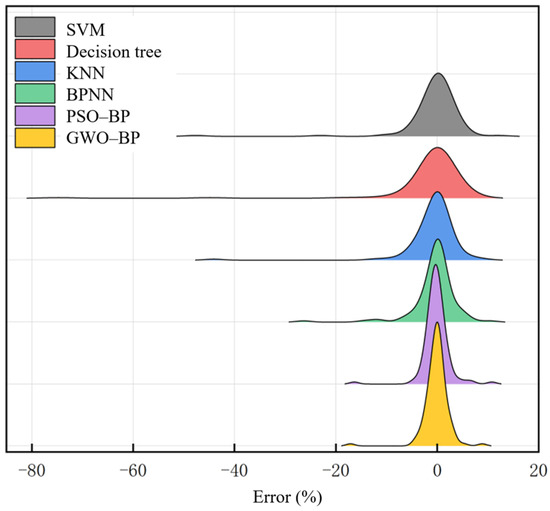
Figure 6.
Ridge diagram of the errors using different models.
6. Conclusions
In practice, setting the opening of the surge control valve in a centrifugal compressor mainly depends on the experience of the operators. If this critical parameter is too small, it is unable to alleviate surge of compressor; if the opening is too large, it lowers the operating efficiency as a significant proportion of natural gas is recirculated instead of being discharged the downstream of the pipeline system. To optimize the opening of surge control valves, this work proposes a GWO–BP model which uses the grey wolf algorithm (GWO) to optimize the initial weight and bias of a BP neural network structure. After data normalization, a Pearson correlation analysis is used to obtain 5 highly correlated parameters from 22 characteristic parameters. The relationship between the five key parameters, including compressor shell vibration, power turbine speed, compressor inlet pressure, compressor outlet temperature, and gas turbine power, is analyzed from a physical perspective. The performance of the GWO–BP model is evaluated based on 532 sets of operating data. The root mean square error (RMSE), determination coefficient (R-square), and mean absolute error (MAE) are used as evaluation indexes. It is found that, compared with the other five parallel control models, including support vector machine (SVM), decision tree, K-nearest neighbor (KNN), conventional BP neural network, and BP neural network based on particle swarm optimization (PSO–BP), the GWO–BP model developed in this work presents the largest R-square and the lowest RMSE and MAE. By comparing the predicted opening of the surge control valve to the measured value, it is found that the error distribution curve of the GWO–BP model is narrow, and the average relative deviation is only 4.65%, indicating that the developed model is capable of accurately predicting the opening of the surge control valve based on the operating parameters of the centrifugal compressor, which helps to formulate the control scheme of the surge control valves. Future research efforts will focus on the following aspects. First, the applicability of the proposed model will be further validated across different compressor stations and operating conditions to assess its generalization capability. Next, integration of the predictive model with anti-surge control systems should be explored to enable adaptive valve scheduling. Last, but not least, an investigation into online prediction of the opening degree of the compressor surge control valves is necessary to enable the real-time output of the prediction results. This would promote the transformation of the proposed model from offline verification to online application in actual industrial sites.
Author Contributions
Conceptualization, Q.S. and X.W.; Methodology, J.T.; Software, J.T. and W.L.; Formal analysis, W.L.; Resources, X.W.; Data curation, W.L.; Writing—original draft preparation, Q.S. and J.T.; Writing—review and editing, X.W. and W.L.; Supervision, X.W.; Funding acquisition, X.W. All authors have read and agreed to the published version of the manuscript.
Funding
This work was supported by PipeChina Guangxi Company Scientific Research Project (GXGS-AQWH202401).
Data Availability Statement
The raw data supporting the conclusions of this article will be made available by the authors upon request.
Conflicts of Interest
Authors Qingfeng Sun, Jinxin Tang and Xingguang Wu are employed by PipeChina Guangxi Company. They participated in data acquisition, engineering validation and manuscript writing. The role of the company was authentic field data and engineering validation. The remaining authors declare that the research was conducted in the absence of any commercial or financial relationships that could be construed as a potential conflict of interest.
Abbreviations
The following abbreviations are used in this manuscript:
| BP | Backpropagation neural network |
| GWO | Grey wolf optimizer |
| KNN | K-nearest neighbor |
| MAE | Mean absolute error |
| PSO | Particle swarm optimization |
| RMSE | Root mean square error |
| SVM | Support vector machine |
| UCS | Universal control system |
References
- Mignone, B.K.; Clarke, L.; Edmonds, J.A. Drivers and implications of alternative routes to fuels decarbonization in net-zero energy systems. Nat. Commun. 2024, 15, 3938. [Google Scholar] [CrossRef] [PubMed]
- Wu, F.; Jiang, J.; Peng, X. Influence of natural gas composition and operating conditions on the phase change of dry gas seals for pipeline compressors. Int. J. Heat Fluid Flow 2025, 115, 109832. [Google Scholar] [CrossRef]
- Qiu, R.; Zhang, H.; Wang, G. Green hydrogen-based energy storage service via power-to-gas technologies integrated with multi-energy microgrid. Appl. Energy 2023, 350, 121716. [Google Scholar] [CrossRef]
- Righi, M.; Pachidis, V.; Koenoezsy, L.; Giersch, T.; Schrape, S. Experimental validation of a three-dimensional through-flow model for high-speed compressor surge. Aerosp. Sci. Technol. 2022, 128, 107775. [Google Scholar] [CrossRef]
- Silvestri, P.; Marelli, S.; Usai, V. Experimental investigation on the dynamic response of a turbocharger centrifugal compressor in surge transitions. In Proceedings of the ASME Turbo Expo 2024: Turbomachinery Technical Conference and Exposition, London, UK, 24–28 June 2024; p. V009T18A006. [Google Scholar] [CrossRef]
- Alsuwian, T.; Amin, A.A.; Iqbal, M.S.; Maqsood, M.T. A review of anti-surge control systems of compressors and advanced fault-tolerant control techniques for integration perspective. Heliyon 2023, 9, e19557. [Google Scholar] [CrossRef] [PubMed]
- Shar, M.A.; Muhammad, M.B.; Mokhtar, A.A.B.; Soomro, M. Energy efficiency performance optimization and surge prediction of centrifugal gas compressor. In Proceedings of the 12th International Conference on Robotics, Vision, Signal Processing and Power Applications, Singapore, 30 March 2024; pp. 61–68. [Google Scholar] [CrossRef]
- Roudsari, N.R.; Ataei, M.; Koofigar, H.R.; Montazeri, A. A nonlinear disturbance observer for sliding mode control of surge in centrifugal compressors via TCV actuator. J. Process Control 2024, 139, 103227. [Google Scholar] [CrossRef]
- Yoon, J.W.; Wilailak, S.; Bae, J.E.; Lee, C.J.; Kim, I.W. Surge analysis in a centrifugal compressor using a dimensionless surge number. Chem. Eng. Res. Des. 2020, 164, 240–247. [Google Scholar] [CrossRef]
- He, S.; Xie, M.Y.; Tontiwachwuthikul, P.; Chan, P.; Li, J.F. Self-adapting anti-surge intelligence control and numerical simulation of centrifugal compressors based on RBF neural network. Energy Rep. 2022, 8, 2434–2447. [Google Scholar] [CrossRef]
- Sheng, H.L.; Chen, Q.; Zhang, J.; Zhang, T.H. A high-safety active/passive hybrid control approach for compressor surge based on nonlinear model predictive control. Chin. J. Aeronaut. 2023, 36, 396–412. [Google Scholar] [CrossRef]
- Cortinovis, A.; Pareschi, D.; Mercangoez, M.; Besselmann, T. Model predictive anti-surge control of centrifugal compressors with variable-speed drives. IFAC Proc. Vol. 2012, 45, 251–256. [Google Scholar] [CrossRef]
- Yutaek, O.; Lee, C.J.; Lim, Y.S. A short-cut graphical method for sizing of recycle valves in anti-Surge system considering time delay. J. Process Control 2017, 58, 23–32. [Google Scholar] [CrossRef]
- Zhao, B.; Zhou, T.; Yang, C. Experimental investigations on effects of the self-circulation casing treatment on acoustic and surge characteristics in a centrifugal compressor. Aerosp. Sci. Technol. 2022, 131, 108002. [Google Scholar] [CrossRef]
- Wang, Y.Q.; Shao, J.L.; Yang, F.; Zhu, Q.Z.; Zuo, M.Q. Optimization design of centrifugal pump cavitation performance based on the improved BP neural network algorithm. Measurement 2025, 245, 116553. [Google Scholar] [CrossRef]
- Yin, P.; Xie, L.; Zhang, H.; Li, W.; Wang, W. Modelling wax deposition of diesel in sequential transportation of product oil pipeline using optimized back propagation neural network. Can. J. Chem. Eng. 2024, 102, 1764–1776. [Google Scholar] [CrossRef]
- Jiang, J.; Xu, G.; Wang, H.; Yang, Z.; Sun, B.; Guan, C.; Feng, J.; Ma, Y.; Chen, X. High-accuracy road surface condition detection through multi-sensor information fusion based on WOA-BP neural network. Sensor. Actuat. A-Phys. 2024, 378, 115829. [Google Scholar] [CrossRef]
- Chen, Q.J.; Qu, H.; Liu, C.; Xu, X.G.; Wang, Y.; Liu, J.Q. Spontaneous coal combustion temperature prediction based on an improved grey wolf optimizer-gated recurrent unit model. Energy 2025, 314, 133980. [Google Scholar] [CrossRef]
- Chai, T.; Draxler, R.R. Root mean square error (RMSE) or mean absolute error (MAE)?–Arguments against avoiding RMSE in the literature. Geosci. Model Dev. 2014, 7, 1247–1250. [Google Scholar] [CrossRef]


Disclaimer/Publisher’s Note: The statements, opinions and data contained in all publications are solely those of the individual author(s) and contributor(s) and not of MDPI and/or the editor(s). MDPI and/or the editor(s) disclaim responsibility for any injury to people or property resulting from any ideas, methods, instructions or products referred to in the content. |
© 2026 by the authors. Licensee MDPI, Basel, Switzerland. This article is an open access article distributed under the terms and conditions of the Creative Commons Attribution (CC BY) license.