Article

FireVision: An Early Fire and Smoke Detection Platform Utilizing Mask R-CNN Deep Learning Inferences

by
Konstantina Spanoudaki
1,
Meropi Tsoumani
1,
Sotirios Kontogiannis
1,*,
Myrto Konstantinidou
2,
Ion Anastasios Karolos
3 and
George Kokkonis
4
1
Laboratory Team of Distributed Microcomputer Systems, Department of Mathematics, University of Ioannina, 45110 Ioannina, Greece
2
Systems Reliability and Industrial Safety Laboratory, Institute for Nuclear and Radiological Sciences, Energy, Technology and Safety, National Center for Scientific Research Demokritos, Ag. Paraskevi, 15341 Athens, Greece
3
School of Rural and Surveying Engineering, Aristotle University of Thessaloniki, 54124 Thessaloniki, Greece
4
Department of Information and Electronic Engineering, International Hellenic University, 57001 Thessaloniki, Greece
*
Author to whom correspondence should be addressed.
Algorithms 2026, 19(3), 169; https://doi.org/10.3390/a19030169
Submission received: 19 January 2026 / Revised: 13 February 2026 / Accepted: 21 February 2026 / Published: 24 February 2026
(This article belongs to the Special Issue AI Applications and Modern Industry)

Abstract

This paper presents FireVision, an innovative platform and model for real-time fire detection and monitoring. The platform utilizes automated drone flights to collect high-resolution imagery in both suburban and forested settings. Ensemble deep learning inference, based on Mask R-CNN weak learners, is employed to trigger alerts. Detection performance is further enhanced by integrating ResNet-50, ResNet-101, and ResNet-152 classifiers, which can be deployed in the cloud or on the drone’s edge co-processing units. Additionally, a fire criticality index is introduced, leveraging detection bounds and masks to assess the severity of fire events, alongside an automated drone path-planning algorithm for identifying critical fire incidents. Experiments were conducted using a supervised, mask-annotated dataset to evaluate model accuracy and inference speed across various cloud and edge computing configurations. Results indicate that ResNet-101 surpasses ResNet-50 by 5 to 12.5 percent in mAP@0.5 mask accuracy, with an 18 percent increase in inference time on the cloud and a 27 percent increase on the drone edge device GPU. In comparison, ResNet-152 achieves a 0.5 to 1.2 percent improvement in mAP@0.5 over ResNet-101, but its inference time is nine times slower in the cloud and 1.3 times slower on the GPU.

1. Introduction

Wildfires are one of the most significant challenges of the modern world, affecting various sectors, including the environment, economy, and public health [1,2]. Their occurrence has a profound impact on human health, as a variety of harmful substances are released into the atmosphere, including particulate matter ( PM 2.5 ), toxic pollutants, and volatile organic compounds, all of which have been linked to increased human sickness and mortality [3,4]. Additionally, wildfires devastate the environment, natural landscapes, resources, and infrastructure, resulting in substantial environmental and economic losses, as well as long-term effects on ecosystems and agricultural production [5]. In many instances, wildfires endanger buildings and entire communities, often leading to tragic loss of life, especially in wildland–urban interface areas [6,7]. The human factor significantly contributes to the escalation of this issue, as a considerable percentage of wildfires are caused by human negligence or improper practices [8]. Many of these disasters result from deficiencies in prevention efforts and misplanning, as well as technological challenges in continuously monitoring large areas. This pinpoints the urgent need for early detection and effective wildfire management strategies [9,10,11].
Numerous efforts have been made to address wildfire detection; however, recent studies confirm the need to transition from traditional sensor-based systems to approaches based on deep learning. These methods offer faster and more accurate detection, the ability to monitor and cover larger areas, and a reduced number of false alarms, which are often triggered in sensor-based systems by environmental factors such as humidity, dust, and exhaust gases [12,13]. Moreover, deep learning systems based on image or video data can operate effectively in real time, making them particularly suitable for large-scale early wildfire detection applications [9].
Approaches to wildfire detection using deep learning include image analysis and techniques such as image classification, object detection, and instance segmentation (pixel masking). Among the most widely used approaches are object detection [14] models, such as YOLO [15], as well as instance segmentation methods [16], such as Mask R-CNN [17]. Recent studies comparing the accuracy and speed of these models indicate that, although YOLO-based models outperform in terms of inference speed and are well-suited for real-time applications, instance segmentation methods such as Mask R-CNN achieve higher accuracy in detecting small-scale or structurally complex objects, providing more precise localization of fire regions [18,19]. Implementations of Mask R-CNN provided by the torchvision library [20] (ResNet-50 implementation only), community-contributed repositories of implementations [21], and high-performance instance segmentation frameworks like Detectron2 by Facebook AI [22] are open-source, accessible, and extensible tools for deploying these models in wildfire detection systems.
For this reason, and given that the present study focuses on early fire and smoke detection, the Mask R-CNN model was selected, as it enables accurate localization and detailed pixel-level segmentation of regions of interest. Specifically, this study compares three variants of Mask R-CNN that use Residual block classifiers. That is, it employs ResNet-50, ResNet-101, and ResNet-152 [23,24] as backbone networks for the proposed fire detection model, which differ in terms of architectural complexity. The evaluation focuses on both detection accuracy and model inference time.
Regarding the monitoring of smoke and fire incidents using dense sensor grids, a set of requirements must be met that include connectivity (ZigBee, Wi-Fi, NBIoT or LoRaWAN), sensing device autonomous operation (battery-operated and use of photovoltaic panels for charging even in dim light), accessibility to the installation location, maintenance, and cost (reliable low-cost sensors of minimum calibration effort). Depending on the placement density of autonomous sensing devices, a forest fire can be classified according to [25] into classes A–F, and by using LSTM and GRU models [26], either the fire event can be detected or its evolution can be locally predicted. Smoke incidents can be detected utilizing sensors that measure particulate matter ( PM 2.5 / PM 10 ), humidity, infrared, barometric pressure, and gases (CO, CO 2 , and volatile organic compounds—VOCs). In addition, for fire detection, temperature, heat, gas, flame, and Go-based sensors are used [27]. These sensors are low-cost, low-power, and suited for dense deployments, enabling continuous, near-real-time operations. For urban installations, sensory maintenance and proximity are feasible; however, in non-urban environments, particularly in forest environments, sensors’ autonomous operation, proximity, and maintenance are challenging and require significant human effort for drone-based sensing.
The effectiveness of early smoke or fire detection systems is also strongly influenced by sensor deployment strategies. It has been emphasized in [28,29] that optimal wireless sensor network (WSN) design is crucial for protecting forest areas and critical infrastructure, and simulations have demonstrated that optimized sensor placement can significantly reduce response time before a fire threatens critical infrastructure and can also complement vision-based detection systems. For industrial infrastructures and urban environments, false alarms caused by dust or vapor remain a significant challenge. To address this issue, a visual sensor that integrates hybrid deep learning sensing techniques was developed in [30]. This approach focuses on filtering environmental disturbances that visually resemble smoke, providing a reliable solution for safeguarding critical infrastructures.
Furthermore, the non-necessity of autonomous sensors in urban and industrial environments makes sensor deployments a key implementation candidate, with camera-based vision and object detection as complementary monitoring tools, specifically for ATEX (ATmosphères EXplosibles) environments and military installations, where the use of drones is strictly prohibited. Nevertheless, this is not the case in forest and non-urban environments, where most catastrophic, uncontrolled fire incidents occur. This paper focuses solely on this kind of environment for deploying the authors’ proposed architecture.
Focusing on remote sensing, NASA’s Fire Information for Resource Management System (FIRMS) system provides periodic fire detections derived from satellite imagery [31]. FIRMS primarily uses data from the MODIS sensors on the Terra and Aqua satellites and the VIIRS sensors on the Suomi NPP and NOAA-20 satellites. These instruments acquire thermal infrared imagery multiple times per day, enabling the detection of active fires based on thermal anomalies at spatial resolutions of approximately 1 km (MODIS) and 375 m (VIIRS), as well as burn area products [32]. Similarly, the European Forest Fire Information System (EFFIS) [33] uses the EU Sentinel-2,3 satellites for active fire detection by providing high-resolution optical imagery (10–20 m spatial resolution) through Multispectral Instruments (MSIs). Although Sentinel satellite instruments are not optimized for thermal anomaly detection, their fine-spatial-resolution multispectral capabilities are highly valuable for post-fire assessment, burned area mapping, and identification of fire scars and vegetation damage [34,35].
Satellite-based fire detection methods using multispectral and thermal sensors have also been explored, enabling large-scale monitoring [36,37]. However, they suffer from limited spatial resolution and sensitivity to environmental factors such as cloud coverage, often requiring substantial fire spread before reliable detection is possible [38]. Furthermore, they operate periodically rather than in close to real time for the acquisition of sensory imagery data outside the US [39]. Overall, robust vision-based fire segmentation at the pixel level remains an open and up-and-coming research area with significant potential for further advancement, particularly with the new hyperspectral image capabilities of new satellite launches [40], particularly in the EU [41].
Regarding automatic drone flights and edge intelligence, drones, specifically on the DJI Matrice platform, achieve these through the integration of onboard and payload-level computing with the DJI Manifold 3 embedded AI computer [42]. The Manifold 3 is based on the NVIDIA Jetson Orin NX architecture for real-time execution of deep learning models directly on the drones without reliance on cloud infrastructure. Therefore, it allows object detection and instance segmentation models for fire and smoke at the drone level with latencies on the order of milliseconds for object detection (specifically, YOLO models). In terms of flight coverage, the DJI Matrice 4TD operating within an automated dock-based deployment can achieve significant area surveillance both per flight and cumulatively, achieving a maximum flight time of approximately 54 min and an operational radius of up to 10 km. At altitudes around 100–120 m, an area of approximately 1.2 km 2 per frame can be covered, enabling rapid area scanning, while the zoom and thermal sensors allow targeted inspection of fire-detected anomalies [43]. When combined with automated recharging and alternating dock stations, near-continuous monitoring of large forested regions becomes feasible, effectively bridging the gap between local high-resolution sensing and persistent surveillance.
In this paper, the authors propose a low-cost architecture that uses cameras and automatically planned drone flights to monitor non-urban locations and forests for early detection of fire incidents. Their architecture is supported by a novel model called FireVision. The authors’ proposed model incorporates a two-layer Mask R-CNN approach: first for smoke detection, and then for fire detection events within the bounding boxes of smoke-detected and masked contours. A fire-expansion classification algorithm enhances the dual-layer approach, the fire criticality algorithm, which aims to quantify both the affected area and the fire intensity using a fire-to-smoke index, the fire criticality index. The comparison of the inference time of the proposed FireVision model is conducted across two distinct execution environments: (1) an edge computing device (NVIDIA Jetson nano [44]) with limited computational resources, included as an extension board co-processor on most commercial drones [45,46], and (2) a cloud computing Virtual Privacy Service (VPS) system with GPU processing capabilities. Therefore, it allows assessing the suitability of each inference environment across different deployment scenarios, including edge- and cloud-based inferences. This paper’s comparative analysis also examines the impact of distinct backbone selections on inference performance and the practical applicability of the Mask R-CNN deep learning model for early wildfire detection in real-world conditions.
The remainder of this paper is organized as follows: Section 2 focuses on related work in the field of fire and smoke detection; Section 3 describes the materials and methods used in this study and the authors’ model proposition and algorithmic process for fire detection called FireVision. Section 4 presents the FireVision experimental scenarios and reports the experimental results along with their discussion; and finally, Section 5 concludes this paper.

2. Related Work

In recent years, due to climate change and advances in remote sensing, the need for early fire detection has become increasingly critical. As a result, fire detection has attracted substantial research interest, particularly in the context of deep learning-based visual analysis. In this section, existing approaches are categorized into three main detection classes. These include fire and smoke detection approaches and bilateral approaches. Existing methods are organized by detection target and the underlying technologies employed. A comparative discussion highlights the capabilities and limitations of current approaches relative to the proposed FireVision detection process.

2.1. Smoke Detection

Since smoke typically appears before visible flames, smoke detection has become a critical component of early fire detection. For this reason, recent research has increasingly focused on developing smoke detection methods, including image detection of either deep learning techniques or wireless sensing systems using infrared, CO, CO 2 , and air particle concentration sensors.
Using RGB cameras and deep learning object detection models, one of the main challenges is the air-borne diffusion and the visually transparent nature of smoke. Early approaches, such as the DeepSmoke model [47] and the target-aware method [48], focused on distinguishing smoke-related features from static background information. However, deep learning models’ ability to learn from new data without losing previously acquired knowledge remains challenging. To address this limitation, transfer learning strategies combined with Learning without Forgetting (LwF) mechanisms have been explored, achieving a high classification accuracy of around 96.9% for smoke and fire images, while maintaining previously learned representations [49]. Reusing trained models on large datasets like ImageNet as a starting point for a new but related task (e.g., wildfire detection) allows leveraging existing knowledge to improve learning efficiency and performance, especially when labeled data is limited [50]. Furthermore, Learning without Forgetting (LwF) principles include mechanisms such as an incremental learning process that combines the standard detection loss for new classes with an appropriate loss function (distillation loss) that forces the model to produce similar responses for both old and new classes [51], similar to stranded LSTM models for sensory data inputs [52]. Additionally, selective knowledge transfer from the teacher (old model) to the student (new model) across classification and bounding box regression outputs may further alleviate forgetting [53].
The demand for real-time incident response has further driven the development of specialized architectures and edge computing approaches that balance detection accuracy and processing speed. A significant contribution in this area is presented in [54], where the authors utilize an optimized YOLOv5 model for fire detection in video streams. This is achieved by introducing architectural modifications, including dilated convolutions within the Spatial Pyramid Pooling (SPP) module of the YOLO model, which, in turn, significantly improve the detection of small targets, such as early fire sources or faint smoke occurrences, while maintaining high inference speeds. Moreover, to extend real-time detection capabilities, a transformer-based architecture is introduced in [55]. Unlike convolutional neural networks (CNNs), transformer model architectures excel at capturing long-range dependencies and contextual relationships in visual data. Therefore, the introduced Triplet Attention mechanisms refine feature representations and highlight cross-dimensional relations across spatial and channel dimensions. Additionally, the proposed architecture integrates a High-Selectivity Feature Pyramid Network (HS-FPN) for feature fusion. The HS-FPN improves upon standard feature pyramid networks by selectively integrating and refining features across different resolution levels, yielding richer, more discriminative representations across different image scales.

2.2. Fire Detection

Thermal imaging cameras play a critical role in forest fire detection systems by capturing infrared radiation to identify fire hotspots based on temperature, even in the presence of smoke or foliage. These cameras can detect temperature differences as small as 0.1 °C, enabling early identification of fires before flames become visible. By analyzing temperature anomalies, thermal sensors can differentiate between solar-heated surfaces and combustion zones, thereby minimizing false alarms caused by reflective materials or animal heat signatures. When integrated with RGB cameras on multi-spectral drone platforms, thermal data enables algorithmic cross-verification of visible smoke and elevated temperature profiles. Furthermore, wireless sensor networks (WSNs) comprising ground-based sensors may include acoustic sensors that detect the distinct low-frequency rumble of fire, as well as temperature, humidity, and infrared sensors across wide forested areas.
Focusing on the use of RGB images for fire detections, preliminary approaches utilizing convolutional neural networks, such as InceptionV3-type architectures, addressed the problem as a binary classification task (fire/smoke versus no fire/smoke), achieving satisfactory accuracy but without providing any spatial information regarding the location or extent of the fire [56]. Subsequently, research shifted toward object detection and instance segmentation approaches, achieving real-time or near-real-time performance. Regarding real-time object detection, there has been widespread adoption of YOLO-based models [57] as well as two-stage architectures such as RetinaNet, which uses focal loss to handle class imbalance and is effective in forest fire smoke recognition tasks [58], as well as the slower-inference but more accurate Faster R-CNN models or their fast mobileNet alternatives [59]. These methods enable fire localization through bounding boxes and support real-time operation in both outdoor and indoor environments [60,61]. The high-level characteristics and capabilities of object detection are presented in Table 1.
Nevertheless, object detection approaches remain limited, as bounding boxes do not accurately represent the spatial distribution of fire and often include significant non-fire regions. For this reason, a more suitable representation of fire extent may be achieved through instance-level or semantic segmentation models, which provide pixel-wise localization. Despite their potential, segmentation-based approaches, specifically instance segmentation models, remain largely underexplored. A representative example is the application of Mask R-CNN for fire segmentation. However, this method is limited to fire-only scenarios, as accurately modeling smoke at the pixel level remains particularly challenging in both inference and annotation terms. Furthermore, existing approaches rely on small-scale datasets and do not report standardized evaluation metrics such as Intersection over Union (IoU) or AP_mask, making objective comparison difficult [62].

2.3. Fire and Smoke Detection

Although standalone smoke or flame detection has demonstrated satisfactory performance, simultaneous detection leverages the complementary characteristics of the two phenomena. Smoke typically appears during the early stages of a fire, whereas flames are more visually salient under low-light conditions, making their combination particularly effective for early warning systems.
Recent studies have focused on comparing different versions of the YOLO algorithm, aiming to identify the optimal balance between accuracy and inference speed. An evaluation of YOLOv5 through YOLOv8, as well as YOLO-NAS, was conducted on the Foggia dataset [63]. The results indicated that YOLOv5, YOLOv7, and YOLOv8 achieve a well-balanced performance, while YOLO-NAS outperforms the others in terms of recall, reducing missed detections at the cost of lower precision. This finding is particularly significant for applications where minimizing false negatives is critical.
Extending the comparison to more recent architectures, recent research [64] examined YOLOv9, YOLOv10, and YOLOv11 for smoke and fire detection. The results highlighted YOLOv11n (nano version) as the most efficient solution, achieving high performance (precision 0.845, recall 0.801) with significantly lower computational cost, making it especially suitable for real-time applications and embedded systems. Moreover, a new lightweight detection model called FireNet was implemented in [65]. Firenet uses a single-stage detection process and a structure similar to YOLO-family detectors. It is an object detection model, not a mask model, achieving mAP@0.5 similar to YOLOv11n(nano) with a slight 1% improvement in inference speed.
To further enhance discrimination between smoke and flames, particularly when their visual characteristics (e.g., color and texture) are ambiguous or overlap, modifications to the core YOLO architectures have been proposed. The YOLOv11-DH3 model was introduced [66], in which traditional convolutions in the detection head are replaced with Deformable Convolutional Networks v3 (DCNv3). This approach improves the network’s adaptability to geometric deformations in flames, resulting in more accurate detection in dynamic environments.
The use of larger and more powerful YOLO models has also been investigated. It has been shown [57] that YOLOv11x (extra large) achieves outstanding performance (mAP@50 of 0.901). However, smoke detection remains more challenging than flame detection due to the high variability of smoke textures, often necessitating deeper, more computationally intensive networks.
Another significant challenge in simultaneous smoke and fire detection is the wide variation in object scale, particularly in drone-captured images, where small fire sources may coexist with large smoke plumes. To address this issue, an enhanced version of YOLOv8 incorporating attention mechanisms was proposed [67]. By replacing full convolutions with local convolutions in the C2F module and introducing Efficient Multi-scale Attention (EMA) and BiFormer mechanisms, a substantial accuracy improvement (93.57%) was achieved in complex forest environments.
Finally, research has also extended to the very early stages of fire ignition. The YOLO-DKM model [68] aims to detect not only flames and smoke but also sparks. By integrating the SKAttention mechanism into the backbone and employing dynamic convolutions (DSConv), the model enhances the detection of extremely small targets, providing a more comprehensive and timely early warning solution.

3. Materials and Methods

In this section, the authors present the proposed system architecture, the algorithms adopted for fire and smoke detection, and the metrics used to evaluate their performance.

3.1. Proposed FireVision System

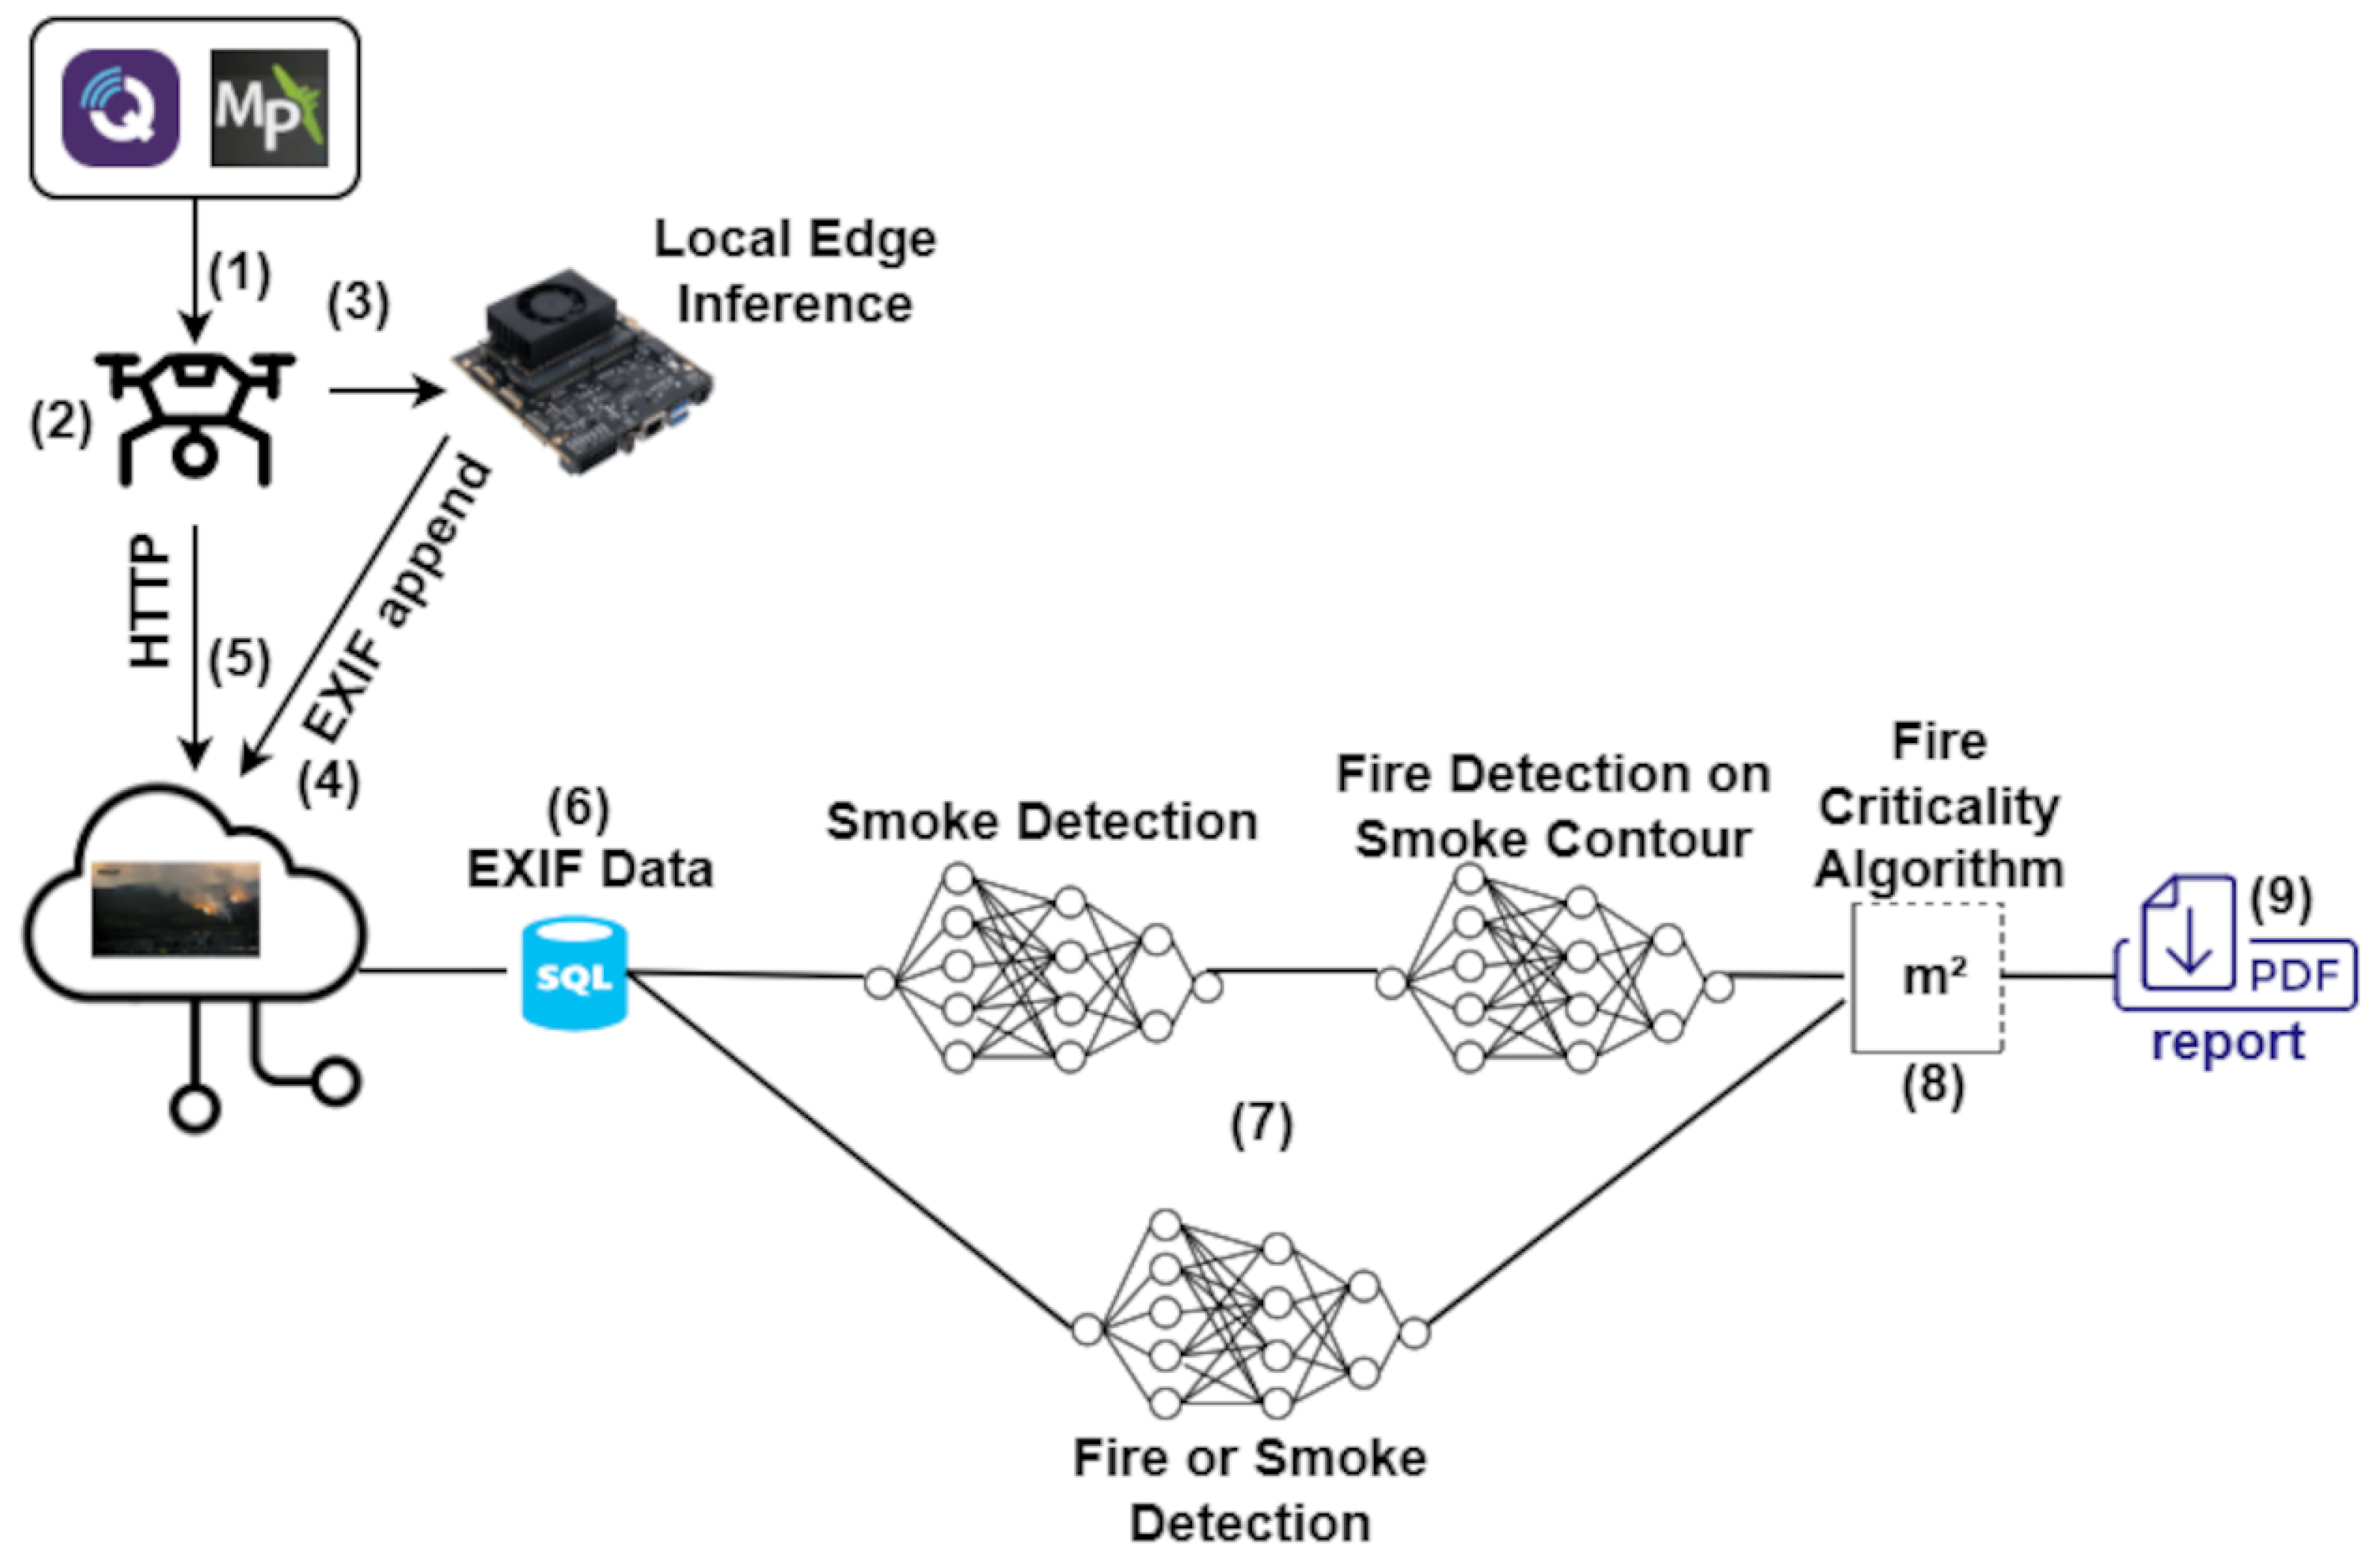
The authors propose an automated wildfire and smoke detection system based on deep learning models. The architecture is divided into three stages: Data collection, data processing, and final reporting, as shown in Figure 1.
Initially, drone flights are organized using COTS (Commercial Off-The-Shelf) software (see Figure 1 (1)), such as the ArduPilot Mission Planner version 1.3.83 [69], the Dronecode Foundation and Auterion maintained QGroundControl version 4.4 [70], the Dronecode foundation PX4 autopilot firmware version 1.15 and above [71] or the DJI bridge [72], implementing the MAVLink XML control protocol over TCP [73,74] (compatible with the mavlink-router daemon software version 4 application that collects and distributes MAVLink messages). For this enterprise setup, a static IP address is required for the LTE drone modem. In the FireVision cloud setup, this capability is provided via a private IP address via the cloud FireVision VPN service. These programs provide the capability for precise definition of geographic surveillance coordinates, ensuring the coverage of large and difficult-to-access areas during the drone flight (see Figure 1 (2)), where traditional surveillance methods fail to operate effectively, specifically in forests. The system provides real-time detection of fire and smoke objects, as well as instance segmentation. This capability is acquired using two alternative setup cases:
  • Drone edge inference: Processing is performed directly on the drone’s micro-processor (e.g., Jetson Nano [44,75,76], which has previously been put to the test by the authors [77]) (see Figure 1 (3)). The detection results, along with the EXIF position metadata, are then sent to the cloud (see Figure 1 (4)).
  • Cloud inference: Raw image data is sent in real time directly to the FireVision cloud (see Figure 1 (5)) for object detection and instance segmentation.
In both cases (drone or cloud inferences), the detection and processing steps are the same: (a) store image meta information of GPS coordinates (EXIF), (b) execute inferences for the Mask R-CNN smoke model, (c) execute inferences for the Mask R-CNN fire model, (d) from the detected contours and mask areas, calculate the fire criticality index using the fire stress algorithm, and (e) report back to the drone navigation process updated GPS monitoring coordinates, as instructed or not by the fire criticality and stress algorithm.
For each drone image capture following a predefined path-planning operation, the EXIF location data and detection information, along with the detected image, are stored in an SQL database (cloud case) or SQLite (edge case) (see Figure 1 (6)). This data storage is particularly significant for the drone-based detection case, for the extraction of flight information and its consecutive detection images for the process of reporting (see Figure 1 (9)).
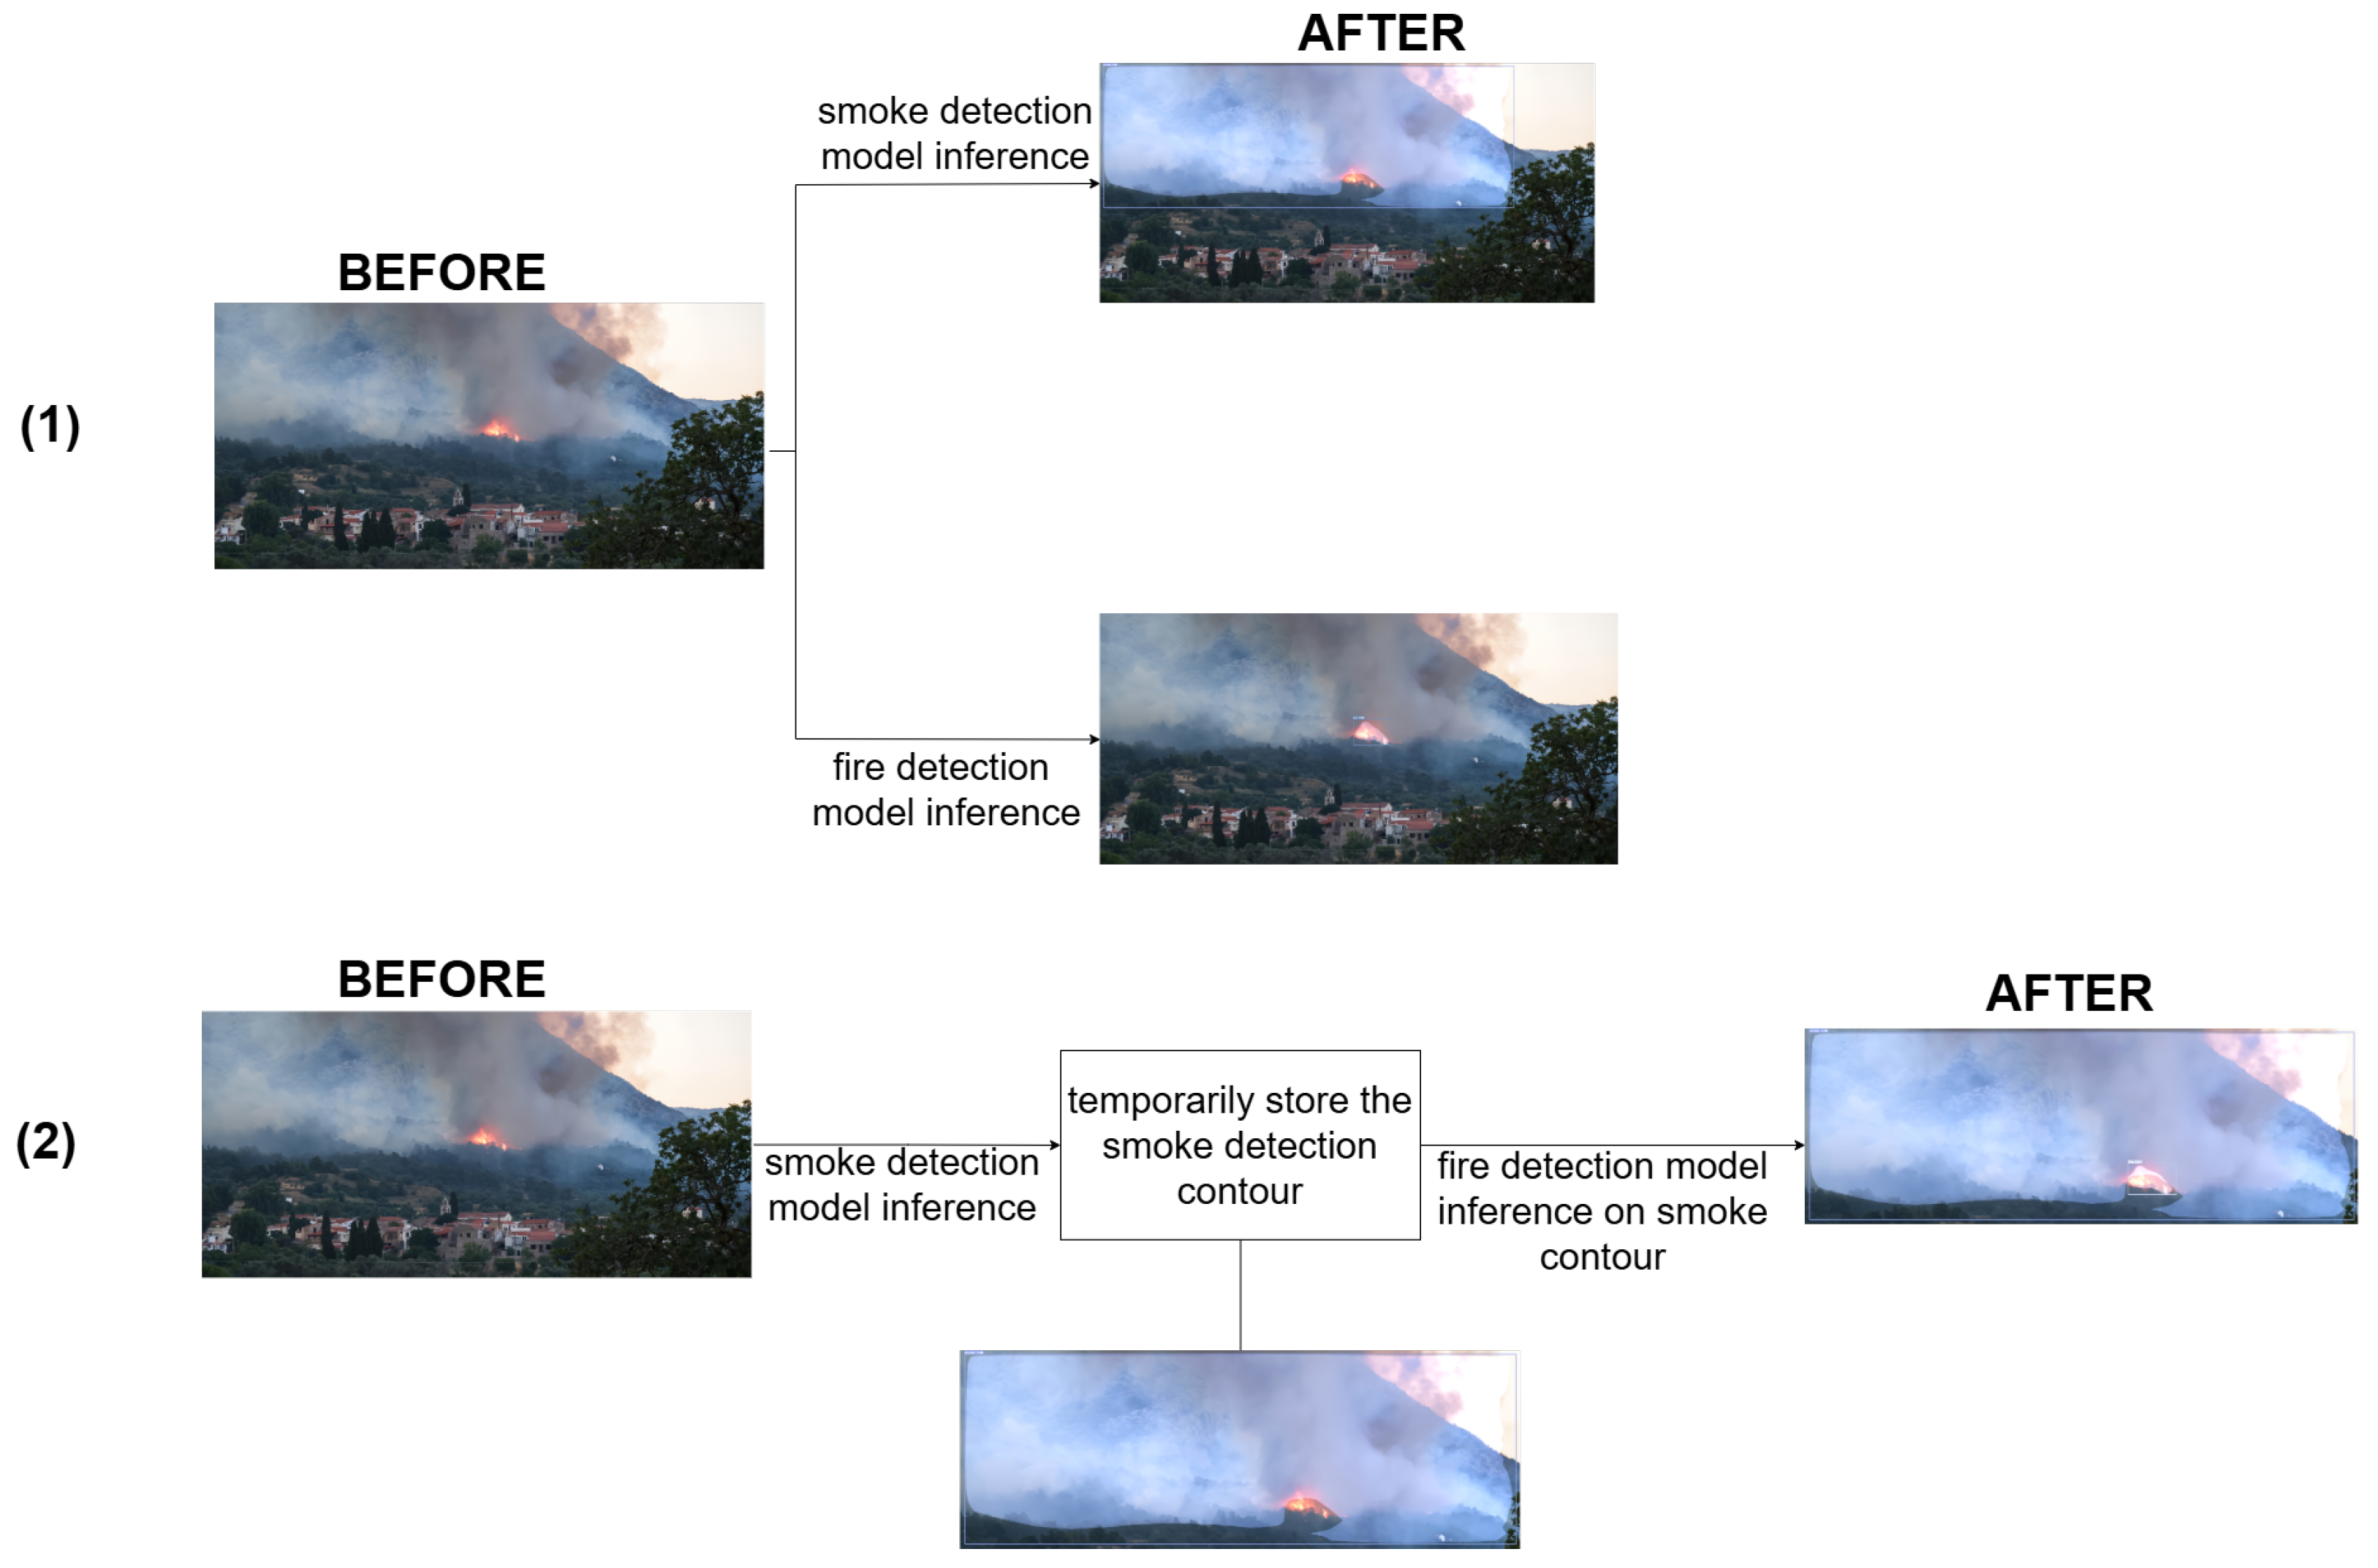
During the image processing stage, model inference can be performed using two distinct strategies, as illustrated (see Figure 1 (7)). The first option follows a sequential approach: smoke is detected first, and fire detection is subsequently performed within the extracted smoke contour. Alternatively, smoke and fire can be detected independently in parallel. The complete inference workflow is detailed in Figure 2. Through this process, precise boundaries and pixel-wise masks (instances) are generated. Additionally, bounding box dimensions and pixel areas are computed for both classes to calculate the fire criticality index (FCI) (see Section 3.4). The entire pipeline is designed to execute within a timeframe of 1–2 s.
Following detection and the FCI index calculation according to Section 3.4, the fire criticality–stress index algorithm is executed, updating the drone’s path-planning course (see Figure 1 (8)). Based on this algorithm, the final stage involves a set of alternate points of hierarchical routing that the drone must immediately follow. Those points are automatically calculated and added to a FIFO queue (Drone Flight Deviation Queue—DFDQ), either directly for the edge-computation case or indirectly as an HTTP response to a previous image HTTP request for the cloud case. That is, If the drone detects an FCI value or the mean FCI value of a polygon route is considered above a threshold value, as calculated by the fire criticality–stress algorithm at the end of a closed circular loop. Moreover, if a new path-planning update is required to be provided to the drone, the “update-pathplan” key value is encoded in the EXIF metadata dictionary of the captured drone image as a binary value 0 or 1.
The drone’s MAVLink positioning and control channel uses 4G/5G via the MAVLink router messaging service, which is instantiated over TCP port 5760. The infrastructure, coverage, and system are mainly managed and monitored by the flight control software. The DFDQ’s commands for drone path plan deviations are automatically appended to the original flight plan queue as a priority execution plan. Then the original flight resumes. If, however, the drone’s battery is below 12%, the return-to-base process initiates, altering the drone’s path plan and forcing it to return to base.
Finally, the FireVision system dashboard is capable of exporting a detailed report in PDF format (see Figure 1 (9)) for easier understanding and official documentation. This can be performed either in close to real time for cloud inferences, post-processing for inferences, or after the drone acquires the relevant data. The following section provides a detailed description of the FireVision detection model.

3.2. FireVision Detection Model

The authors propose a new deep learning algorithm for computer vision-based fire and smoke detection systems called the FireVision model. The core problem identified is that smoke often envelops or contains fire in real-world scenarios, leading to significant visual overlap between these classes during detection. This spatial co-occurrence leads to increased classification errors, as the model struggles to distinguish between overlapping fire and smoke regions, thereby elevating the overall loss function that guides the model’s training. The increased loss reflects both misclassifications and reduced confidence in predictions at the intersection of fire and smoke, presenting a fundamental obstacle for single-model approaches that attempt to detect both cases simultaneously. To address this challenge, the researchers adopted a specialized architectural approach inspired by prior work on the cooperation of multiple sequential deep learning models [50]. Given that fire is often contained within smoke, the overlap between the two objects significantly increases the classification loss, leading to a substantial increase in the overall loss. Consequently, the authors developed two distinct models, one exclusively for smoke detection and another specifically for fire detection, effectively decomposing the FireVision process into two stages. Figure 2 illustrates the FireVision detection approach.
The FireVision implementation utilizes separate detection models and a two-stage strategy, one dedicated to smoke detection and another to fire detection. This architectural decision effectively transforms a multi-class detection problem into: 1. either two parallel detection tasks of fire and smoke or 2. sequential detection tasks, initiating the smoke detection and, on the detected smoke contours above a confidence level, initiating the fire detection model. This way, the FireVision model improves precision by eliminating intra-class confusion while maintaining the ability to detect both fire and smoke in a scene through a sequential ensemble learning process. This is the preferred aggregated process for forest fires, since, according to [78], single-class instance detectors may outperform multi-class ones by at least 15%, which is considered statistically significant. Nevertheless, both detection types are supported by the system.
The FireVision implementation models for fire and smoke in this design use Mask R-CNN for detection, with different ResNets for classification (ResNet-50, -101, and -152). The classifier model selection for the FPN depends on the drone capabilities in terms of GPU installed, co-processor RAM for the edge computing case. For the cloud case it depends on the inference time and network delay for the object detection results to reach the drone and perform appropriate actions, which is considered real-time-critical with execution times no more than 2 s for the inference. This study compares three different ResNet architectures (namely ResNet-50, ResNet-101, and ResNet-152 variants). Each architecture must be instantiated twice (once for fire detection and once for smoke detection). The evaluation framework requires assessing six distinct models in total. This doubled evaluation burden highlights both the increased resource requirements of the FireVision approach and the comprehensive nature of the experimental design, which aims to determine not only whether separate models improve detection but also which ResNet variant performs best for each specific detection task.

3.3. Performance Metrics and Loss Functions Used

This section presents the evaluation metrics and loss functions employed to analyze the training behavior of the proposed model and to assess its detection and segmentation performance. The metrics used in this study were selected based on commonly adopted definitions in the literature [79,80,81]. The examined precision (accuracy) metrics are presented in Table 2, while the loss measures are presented in Table 3.
Let B p and B g denote the predicted and ground-truth bounding boxes, respectively. The bounding box Intersection over Union (IoU) is defined in Equation (1).
IoU box ( B p , B g ) = | B p B g | | B p B g | .
Although instance segmentation networks such as Mask R-CNN operate on color images, and segmentation accuracy is evaluated on binary object masks. For each detected instance, the network predicts a probability map M ^ ( x , y ) [ 0 ,   1 ] , which is converted into a binary mask M p ( x , y ) using a threshold of 0.5:
M p ( x , y ) = 1 , M ^ ( x , y ) 0.5 , 0 , otherwise .
The ground-truth annotation is also represented as a binary mask M g ( x , y ) 0 , 1 . The mask Intersection over Union (mask IoU) is then defined as shown in Equation (3).
IoU mask ( M p , M g ) = | M p M g | | M p M g |
According to the COCO evaluation protocol, the default metric for bounding box-based object detection is the mean Average Precision ( m A P box ), with its formal definition given in Equation (4). However, the authors also employ the mask mean Average Precision ( m A P mask ) metric to obtain a more accurate assessment of instance-level performance. For this purpose, the established mask mAP metric provided by the COCO evaluation framework is used, defined as shown in Equation (5).
m A P box = 1 C c = 1 C A P c box .
m A P mask = 1 C c = 1 C A P c mask .
In Equations (4) and (5), A P c box and A P c mask accordingly denote the Average Precision for class C, computed from the precision–recall curve using Intersection over Union (IoU) for matching predicted and ground-truth instances. In this study, the authors report bounding box (Bbox) and mask mAP@0.5, corresponding to an IoU threshold of 0.5, where a prediction is considered a true positive if IoU ( M p , M g ) 0.5 . The variable C denotes the number of object classes (fire and smoke), while the background class is excluded from evaluation, following standard practice.
Given the distinct visual characteristics of smoke and fire, detection performance often varies significantly between the two classes; a standard mean could mask a critical failure in one class if the other performs well. To address this, we aggregate the individual mAP scores using a weighted harmonic mean, as shown in Equation (6). This choice is grounded in recent evaluation methodologies [82], which demonstrate that harmonic-based metrics impose a stricter penalty on performance disparity than arithmetic averages. By adopting this logic, our unified metric m A P a g g ensures that a high score is achievable only when the model demonstrates robust detection capabilities across both hazard types.
m A P a g g = ( w f + w s ) · m A P f · m A P s w f · m A P s + w s · m A P f .
where m A P f and m A P s denote the mAP@0.5 scores for fire and smoke, respectively, and w f , w s represent the task-specific weights (typically set to a value of one for balanced evaluation).
The total loss metric used in the experimental scenarios is a cumulative sum of all losses, as shown in Equation (7).
L t o t a l = L c l s + L b o x + L m a s k + L o b j + L r p n
where L c l s is the classification loss for object category prediction, L b o x is the bounding box regression loss, L o b j is the objectness loss of the Region Proposal Network, L r p n is the RPN bounding box regression loss, and L m a s k is the pixel-wise mask instance segmentation loss [81].
Frames Per Second (FPS) measures the system’s computational performance. In this study, FPS is calculated as the inverse of the total inference time needed for smoke Mask R-CNN detections, followed by fire Mask R-CNN detections, on a single still image from a drone-mounted camera. For cloud inferences, the measurement input images have a spatial resolution of 5472 by 3648 pixels (20 MegaPixels (MP)), which corresponds to an uncompressed RGB tensor with 8-bit channel depth, approximately 57.1 MB of RAW and 6 to 8 MB of JPEG-compressed images for data transmission. For edge computing inferences, images have been downscaled to 1280 × 768 px to preserve real-time inference performance, since image tiling is not used. For 1 MP images, the raw size is typically around 3 MB (250–900 KB JPEG-compressed). If the total time to process one image through both Mask R-CNN models is T total seconds, then the FPS is defined as in Equation (8):
FPS = 1 T total = 1 T latency + T smoke + T fire
where T smoke and T fire are the inference times for the smoke and fire Mask R-CNN models, respectively. The parameter T latency is exclusive to cloud-based inference scenarios and does not apply to edge detection. It represents the overhead required to upload compressed fire and smoke imagery to the cloud. For a typical 8 MB JPEG transmission over 4G/LTE networks, this latency is estimated to range between 3 and 6 s per image. The approximation used for cloud uploads in this case is the worst-case one and therefore T latency 12 s for both smoke and fire images.

3.4. Fire Criticality–Stress Algorithm

Upon object detection using the FireVision model, the proposed fire criticality–stress algorithm provides a measure of both the severity of the fire event from the acquired images and its expansion, expressed in the event area coverage, derived from the drone’s GPS lat-lon values, direct or indirect, as stored in each image’s extended information (EXIF). The criticality of a fire–smoke event is expressed by the fire criticality index value (FCI). The criticality index is an aggregative metric that accounts for both fire and smoke detections as independent contours detected and masked (instance-pixel-segmented) by the FireVision model, with the base area being the original image acquired by the drone.
Let an input image of width W and height H have a total pixel area of A I = W · H (drone original image). Let us assume a set of detected smoke contours indexed by i and fire contours indexed by j. For each smoke detection, let A b , i s denote the bounding box area of smoke detections and A m , i s the corresponding Mask R-CNN smoke mask area in pixels. Similarly, for each fire detection, let A b , j f be the bounding box area for fire detections and A m , j f the fire mask area. All areas are expressed in pixel units. The total detected smoke and fire mask areas are computed using Equation (9) and are defined as follows:
A m s = i A m , i s , A m f = j A m , j f
Similarly, the corresponding total bounding box areas enclosing the contour masks for smoke contours A b , i s and fire contours A b , j f are computed using Equation (10).
A b s = i A b , i s , A b f = j A b , j f
Then the normalized image coverages of smoke C s and fire C f are defined using Equation (11).
C s = A m s A I , C f = A m f A I
The authors assume that the normalized smoke and fire coverages satisfy the constraints of Equation (12).
C s < 1 , C f < 1
If the values are greater than or equal to one, it implies either overlapping contours, duplicated detections, or erroneous mask predictions. If either condition is violated, an iterative correction procedure is applied, in which the largest contour (by mask area) associated with each detection is removed. However, a typical filtering rule is to remove all contours whose area is above 30–70% of the total image area in px 2 . This is an expression from dataset experimentation: the smaller the accepted area sizes of the detected contours, the more accurate the detections. The coverage terms C s and C f are then recomputed after each removal step until the constraints in Equation (12) are satisfied, ensuring physically consistent and non-overlapping spatial extents for both smoke and fire detections. Then, to quantify how densely the detected regions are filled by the corresponding masks, density (fill ratio) terms are introduced and calculated using Equation (13):
D s = A m s A b s + ϵ D f = A m f A b f + ϵ
where ϵ 10 6 , a small positive constant preventing division by zero. The overall fire event criticality is quantified using the Fire Criticality Index (FCI), as defined by Equation (14):
FCI = 100 α C f D f + β C s D s + γ C f C s ,
where C f and C s denote the normalized-over-the-image fire and smoke coverages, D f and D s are the corresponding mask density terms, and α , β , and γ are non-negative weighting coefficients. In this formulation, α > β is assumed to reflect the dominant contribution of active fire relative to smoke, while the coefficient γ modulates the interaction between fire and smoke presence. Indicative values that can be used are α = 0.7 , β = 0.25 , and γ = 0.05 , which significantly prioritize fire extent and yield smaller contour areas for fire relative to smoke, while still accounting for smoke propagation and co-occurrence effects. Values that were used in this work are α = 0.7 , β = 0.3 , and γ = 0 . The co-occurrence effects are considered when FireVision is applied to fire detection contours inside smoke-detected contours. In case of parallel smoke and fire detections on the original drone image, only α and β coefficients are used.
The γ parameter in the fire criticality index (FCI) is necessary because it captures the nonlinear interaction between fire and smoke coverage, which cannot be represented by the purely additive terms α C f D f and β C s D s . The first two terms quantify fire and smoke contributions independently, assuming that total criticality is simply the sum of their individual effects. However, in real fire dynamics, the simultaneous presence of flames and smoke indicates active combustion, sustained heat release, and a higher probability of spatial expansion. Thus, the combined occurrence of fire and smoke represents a synergistic phenomenon in which the overall severity exceeds the linear sum of the components. The interaction term γ C f C s introduces this second-order coupling effect, increasing the index only when both fire and smoke are present, while remaining zero if either component is absent.
Mathematically, the inclusion of γ enhances the expressive power of the index by transforming it from a linear model into a quadratic one with interaction sensitivity. This improves the discriminative capability between isolated fire detections and coupled fire–smoke events, which typically correspond to more advanced or escalating scenarios. Operationally, this distinction is critical for adaptive drone-based exploration, as co-occurrence may justify more aggressive area-expansion assessment or higher alert levels. Without γ , the FCI would treat independent and interacting detections similarly, potentially underestimating the severity of dynamically evolving fire events.
The weighting coefficients are not arbitrary tuning parameters, but rather physically motivated scaling factors that reflect the relative contributions of fire and smoke. The assumption that α > β follows directly from combustion physics and operational risk assessment, where an active flame is a more immediate and hazardous condition than smoke alone. The interaction coefficient γ captures co-occurrence effects, introduces nonlinearity, and is activated only when fire and smoke are simultaneously present, modeling escalation behavior.
Equation (14) provides a normalized index FCI [ 0 ,   100 ] that is invariant to image resolution and directly comparable across scenes. For example, a small but dense fire occupying 5 % of the image ( C f = 0.05 , D f 0.9 ) with limited smoke ( C s = 0.02 , D s 0.5 ) results in a low-to-moderate criticality value, typically FCI < 20 . In contrast, a large-scale event with widespread flames ( C f > 0.2 ) and dense smoke coverage ( C s > 0.3 ), both exhibiting high compactness, produces FCI values exceeding 60, indicating a highly critical fire scenario. This scaling allows the proposed index to distinguish between incipient, developing, and severe fire events in a physically interpretable manner.
A criticality threshold T t h < 3–5% is used to signify the onset of a fire event. During an automated drone image-acquisition mission along a predefined GPS trajectory from point A to point B, the fire criticality index (FCI) is assessed at the initial anchor A. If F C I ( A ) T t h , a secondary exploration mode is triggered. This mode initiates a spiral flight pattern centered at point A to estimate the spatial extent of the affected area in physical units ( m 2 or km 2 ). This process constitutes a core component of the fire criticality algorithm, facilitating adaptive, event-driven area-expansion assessment. When the threshold is exceeded, the drone temporarily deviates from its nominal path. It follows a piecewise square-spiral trajectory among the predefined straight-line flight trajectory from point A to point B, separated by a Euclidean distance d A B . The spiral motion is executed through sequential displacements toward the north, east, south, and west, forming closed square-polygonal coverage regions in polar latitude–longitude coordinates relative to A. The initial spiral step, which determines both the square edge and the forward distance step towards the direction of B, is defined by Equation (15):
R 0 = R d s = d A B k , k N , k 2 ,
where k is a user-defined control coefficient parameter. The value of k may either: (a) be a fixed value R d s , following a fixed-step square-spiral motion policy, or (b) follow an adaptive increase policy starting with a high value of k, let k 0 = 16 , which is decreased by a value of one after each full drone square-polygon revolution and forward move (multiplicative increase of R d s spiral steps). This is a step length increase-only policy for each step i distance R i s , k = k i , i = 1 n , using Equation (15) and R 0 as a starting step point. Then i N , 2 k i < k 0 , monotonically increase each step’s length R i s .
Each spiral revolution i consists of a pattern of four directional moves (north, west, south, and east), forming a coverage square used for new image acquisitions, detections, and FCI re-evaluations, each time the drone reaches a vertex. If the criticality at a square polygon vertex falls below T t h , the spiral exploration is terminated and the drone resumes its nominal flight toward point B. Otherwise, the spiral step R d s is repeated, either fixed in length or multiplicatively increased, to refine the estimate of the affected area until the termination condition is met. The exact quantity R d s is used both as the radial extent of the spiral square around the current anchor and as the forward step length along the A B direction.
For example, a drone flies at an altitude h m above ground, and the nominal mission segment has assigned flight position anchors A B separated by distance d A B = 10 km . If the FCI is above the threshold in A, then the spiral descent towards B initiates with a spiral step of the same value for both (i) the spiral-square edge length and (ii) the forward advance distance towards B. This step value is calculated using Equation (16):
R i s = d A B k i , k 0 = 16 , i = 1 n
where k i is a selected fixed value for the fixed-length update policy. For the adaptive update policy, the control parameter k i value is reduced after each completed spiral revolution and forward move so that k i = k i 1 1 . This way, it is guaranteed that the spiral motion is strictly upscaling (i.e., the next step length is always larger than the previous one). Therefore R i s > R i 1 s is enforced, together with the remaining-distance calculation for i = n to B, d n r e m R i 1 s , where d A B n r e m is the remaining distance from A to B: d A B n r e m = d A B i = 0 n 1 d A B k i . Since an increasing-step policy can become infeasible near the end of the A B segment (when d A B n r e m becomes small), we introduce the termination condition close to point B; let it occur at i = n :
If d A B i = n r e m < R i + 1 s = d A B k i + 1 terminate spiral exploration and resume nominal flight to B .
If the termination condition occurs, then a final spiral revolution may occur one last time, using a predefined control parameter Δ (fixed value). If this parameter Δ added to d A B i = n r e m increases by an amount significant enough to overcome the limitation imposed by Equation (17), then a last square spiral occurs without forward stepping, based on Equation (18).
R i + 1 s = min d i = n r e m + Δ , R i + 1 s , with : d i = n r e m = d A B i = 0 n R i , R i + 1 s = d A B k i + 1
If d i r e m + Δ R i s , then we perform one last square surveillance before moving to point B using Equation (19).
k i + 1 = k i 1 , R i + 1 s = min d i = n r e m + Δ k i + 1 , A B k i + 1
Equation (19) ensures that for the square-spiral revolution i = n , R n + 1 s R n s , and therefore Equation (17)’s condition is fulfilled. It also guarantees safe progression toward B, since δ is used only once and prevents Δ from driving the drone beyond B by not implementing the forward step. The algorithm, upon completing the n + 1 square-spiral surveillance, will not exceed the remaining A B forward and then return directly to B.
Each spiral square revolution i generates a closed coverage polygon shape (Cartesian coordinate square shape), formed by four directional checkpoints (north, east, south, and west) located at a radial distance R i from the current location anchor. The resulting polygon is a square box whose edges are both equal to R i . Therefore, the area of the polygon generated at the n-th revolution is given by Equation (20).
A n p o l y = ( R n ) ( R n ) 2 = R n 2 [ m 2 ] .
Assume a drone flies at an altitude h = 100 m on a nominal segment from anchor A to anchor B with d A B = 10 km and detects a fire incident. Let us assume it is configured to respond using a fixed-length spiral increase and a fixed control parameter k = 8 . Then the step is a constant value R s = d A B k = 1250 m , and Δ = 0 . Thus, the drone reaches B exactly after 8 forward steps (revolutions). Let d i r e m be the remaining distance before executing step R i s and d 0 r e m = d A B . The fixed-step sequence is
R e v ( i ) k R i s ( m ) = d A B k d i r e m  (m) A i ( km 2 )
08125087501.562
18125075001.562
28125062501.562
38125050001.562
48125037501.562
58125025001.562
68125012501.562
78125001.562
Therefore, the mission segment terminates at B after n = 7 (eight square revolutions in total). For the same flight, the adaptive increase policy is performed using Equations (16)–(19), with Δ = 250 m. It initiates with k 0 = 16 so that R 0 = d A B k 0 = 625 m. After completing the n revolution, we compute the remaining distance d n r e m = d A B i = 0 n R i s if the termination condition d n + 1 rem R n s holds. Then the drone performs a final step R n + 1 s = d n + 1 r e m and returns to B exactly. Otherwise, the next admissible step is selected by
R n + 1 = min d n r e m + Δ , R n + 1 , Δ = 250 m
and mapped to an integer via Equation (19). The resulting sequence until reaching B is
R e v ( i ) k n R i s ( m ) = d A B k d i r e m  (m) A i ( km 2 )
016625.09375.00.39
115666.78708.30.44
214714.37994.00.51
313769.27224.80.59
412833.36391.50.69
511909.15482.40.82
6101000.04482.41.0
791111.13371.31.23
881250.02121.31.56
971428.6692.71.77
1061666.6 692.7 + 250 = 942.7 , direct B -
Having a value of Δ = 250 m , the i = 10 revolution yields k i 1 = 6 = 100000 6 = 1666.6 m . Therefore, the drone will not perform a final tenth revolution and will return to B.
The fixed-step policy ( k = 8 ) provides uniform spatial sampling along the trajectory from A to B. This results in identical coverage polygons at each revolution, with a constant area of A n = 1.562 km 2 . This consistency builds trust in systematic scanning and offers clarity in scenarios where fire spread is assumed to be spatially homogeneous. However, this fixed policy does not adjust its spatial resolution based on the event’s primary occurrence. This could lead to redundant or excessive coverage in low-risk areas.
In contrast, the adaptive incremental policy dynamically increases the spiral radius and forward step in response to sustained critical conditions of the first fire detection event. This results in progressively larger coverage polygons, ranging from 0.39 km 2 to 1.77 km 2 in the given example. This approach enables rapid expansion of the surveyed area when severe fire conditions persist, while still allowing detailed inspection near the initial triggering location and its neighborhood. Therefore, the adaptive policy strikes a better balance between local detail and large-scale coverage, making it more suitable for real-time fire-front mapping and area expansion estimation. Additionally, in both cases, the explicit termination rule ensures safe, finite convergence to the destination anchor B, thereby enhancing operational robustness during autonomous missions.


3.5. Dataset and Data Annotation Process

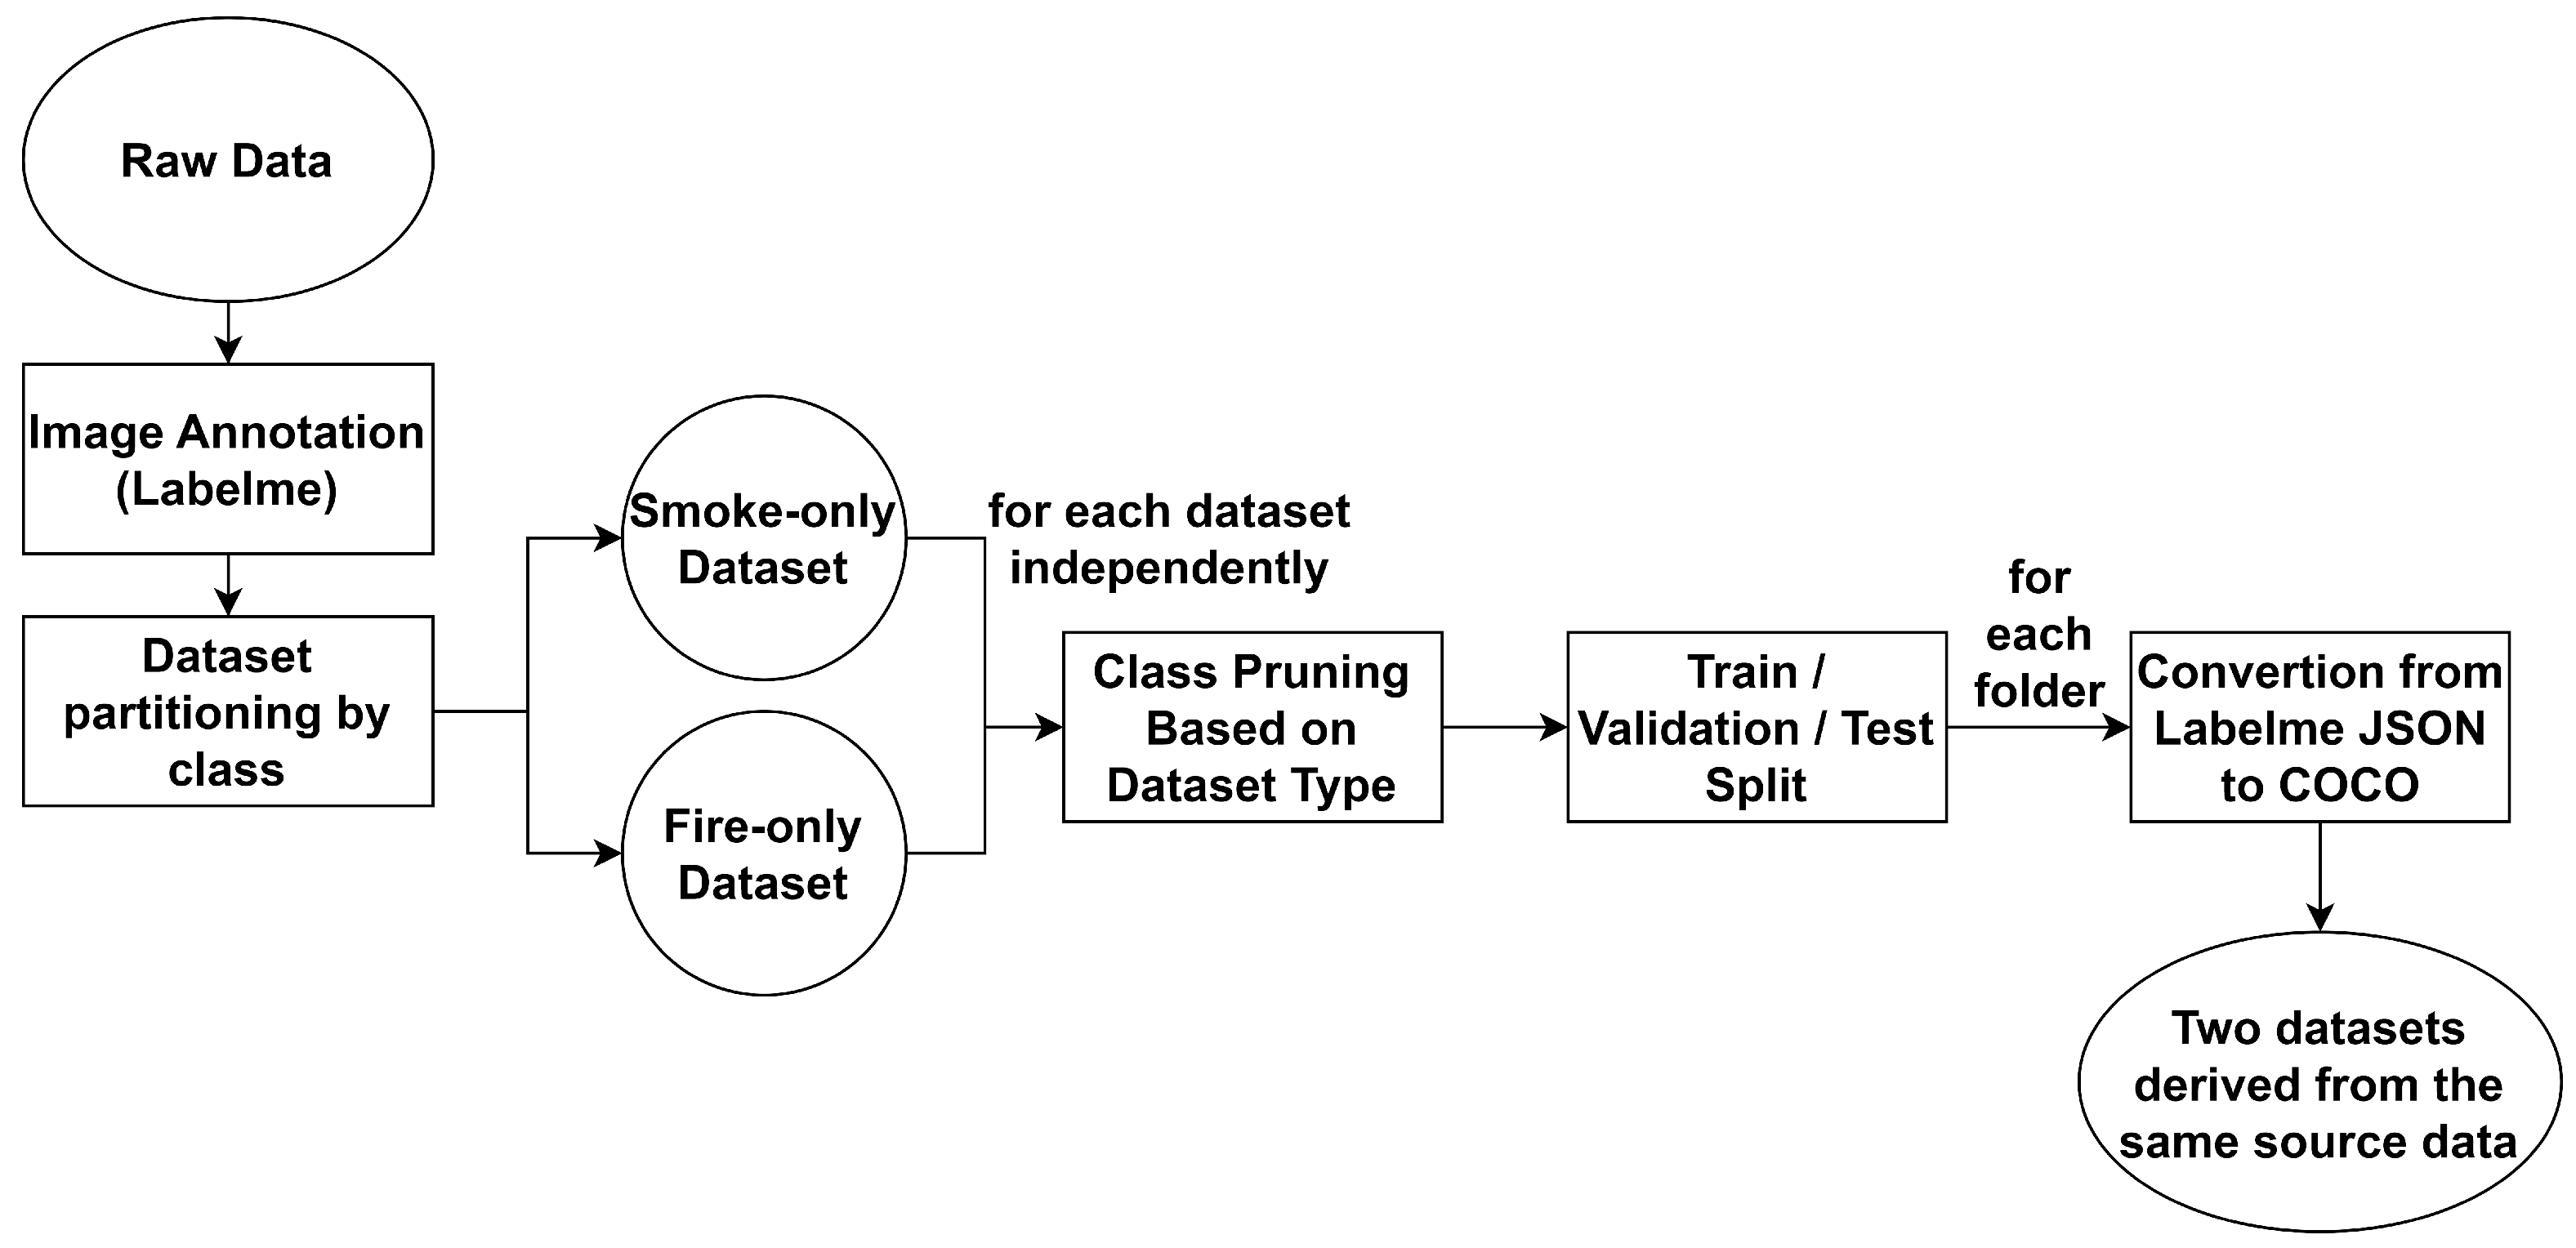
The data used in this study were obtained from the dataset presented in [83]. This dataset was originally annotated in the YOLO format and could not be used directly in the FireVision training process. For this reason, pixel-level image mask annotations were performed. Using the existing annotations as an initial reference, the images were first categorized into object and no-object classes to facilitate detection, particularly when an object appears very faint or occupies a very small spatial extent within the image. Subsequently, for images known to contain an object of interest, manual annotation was carried out using the LabelMe annotation tool [84]. The overall annotation and dataset preparation workflow is illustrated in Figure 3.
After completing the annotation process for all images containing objects, the dataset was split into two distinct subsets, one for smoke detection and one for fire detection, each used to train two separate models, as described previously. Following this separation, the non-relevant class was removed from each subset to ensure that the resulting datasets contained exclusively smoke or fire samples, respectively. Each dataset was then divided into training, validation, and test sets, with 70% allocated to training and the remaining 30% split evenly between validation and testing. The corresponding JSON annotation files were included in each split.
Finally, the LabelMe annotation files were converted to the COCO format, which is the annotation standard adopted in this work. Through this process, two task-specific datasets were derived from the original dataset, each tailored to one of the two detection models.

4. Experimental Scenarios

Three experiments were performed on the FireVision-implemented models and path-planning algorithm during a fire-critical event. Experimental scenario I aims to evaluate the segmentation accuracy of arbitrary detections from FireVision models and ResNet-50, ResNet-101, and ResNet-152 classifiers for fire and smoke, respectively, using mask mAP@0.5 and total loss metrics, as described in Section 3.3.
Experimental scenario II involved the use of a drone co-processing GPU delivered by a companion computer unit to provide edge inferences, as simulated by a Jetson Nano device [45,46,76]. The NVIDIA Jetson Nano is a low-power embedded artificial intelligence platform designed for edge-based deep learning and computer vision applications. This device features a quad-core ARM Cortex-A57 central processing unit (CPU) operating at up to 1.43 GHz and 4 GB of LPDDR4 system memory, shared between the CPU and the graphics processing unit (GPU). The integrated GPU, based on the 128-core NVIDIA Maxwell architecture, delivers up to 472 GFLOPS of computational performance, enabling real-time execution and approximately 25.6 GB/s of memory bandwidth to facilitate high-throughput image processing and neural network inference [44,75]. For cloud computing inferences, Oracle Cloud Infrastructure (OCI) was used with a minimal VM configuration of 12 x86-64 CPU cores and 16GB of memory [85].
Finally, experimental scenario III provides a proof of concept for the FCI metric, offering inference examples and real FCI values from images in the testing evaluation dataset. It also illustrates the two proposed flight policies that are triggered in the event of a fire incident. The following subsections present the authors’ experimental results for the aforementioned scenarios I, II, and III accordingly.

4.1. Experimental Scenario I Results

The architectural choice of a ResNet backbone over lighter alternatives is deliberate and supported by the authors’ previous research [59], as shown in Table 2, where YOLOv8 models achieved mAP@0.5 values around 0.94 for object detection. In contrast, ResNet models outperformed YOLO, offering mAP@0.5 values of 0.994–0.995. Furthermore, in comparative experiments reported in [59], it was also observed that YOLOv8-sm models offered superior inference speeds for edge detection, yet were still outperformed by MobileNetv3 detectors by at least 5% in terms of mAP@0.5.
In the context of early fire detection, instance segmentation often yields small, subtle targets (incipient fire spots and smoke plumes). Therefore, maximizing detection precision is paramount. However, recent benchmarks on fire detection models provided by [86], Table 3, explicitly show that Mask R-CNN underachieves for smoke instance detection compared to the latest YOLOv8-seg/YOLOv11-seg, with mAP@0.5 values around 5% lower (this is also mentioned in [78] with a percentage around 6.12%). Moreover, for fire detection, as also mentioned in [86], Mask R-CNN outperforms the YOLOv8-seg and YOLOv11-seg models by around 1.85–0.65% in mAP@0.5. This is also a strong indication that both Mask R-CNN and recent YOLO models achieve statistically indistinguishable mAP@0.5 mask accuracies, casting doubt on the notion of a slight advantage of Mask R-CNN with ResNet classifiers over YOLO, which contradicts the findings on object detection mAP@0.5 values reported in [59]. Still, even this marginal but critical advantage of Mask R-CNN in fire detections (small objects) in terms of mAP@0.5 mask accuracy better aligns with our safety-critical objective, where reliable identification of ignition points is favored over second-level edge-computation latencies to achieve more detailed inference results. Furthermore, YOLO models deliver substantial inference speed gains, as also mentioned in all studies [59,78,86]. The YOLOv8/v11-seg mAP findings, as presented in the recent literature, are considered by the authors to be statistically marginal or even superficial and require further robust investigation, set as future work by the authors.
In this experimental scenario I, the training process was assigned a maximum of 100 training epochs, with an initial learning rate of 0.005, dynamically adjusted by a CosineAnnealingLR scheduler. Specifically, the learning rate was gradually decreased to 10 6 over the first 50 epochs and held constant thereafter. The batch size was set to 16 for all training cases, resulting in more stable metric behavior. The dataset was partitioned and processed following the procedure described in Section 3.5. Table 4 presents the mask mAP@0.5 and bounding box results for the fire and smoke models, as well as the total loss, classification loss, and mask loss values accordingly.
Evaluation metrics (see Table 4) indicate that ResNet-152 outperforms both ResNet-50 and ResNet-101 in terms of total loss and mAP@0.5. Specifically, for smoke detection models, ResNet-101 reduces the total loss of ResNet-50 by 3.25%, and ResNet-152 achieves an 11.9% reduction compared to ResNet-50. Additionally, the total loss of ResNet-152 is approximately 2% lower than that of ResNet-101. In terms of mask mAP@0.5, ResNet-101 achieves a 12.54% improvement over ResNet-50. However, ResNet-152 achieves only a 0.46% increase relative to ResNet-101, suggesting that performance gains are approaching saturation.
Similarly, for the fire detection model, the total loss decreases by 10.2% from ResNet-50 to ResNet-101 and by 12.5% from ResNet-50 to ResNet-152. For Mask mAP@0.5 values, a 5.13% increase is observed for ResNet-101 compared to ResNet-50, while the accuracy gain between ResNet-152 and ResNet-101 is only 1.16%. Overall, while ResNet-101 exhibits a clear performance advantage over ResNet-50, the incremental gains of ResNet-152 remain limited, especially given its substantially higher computational cost. Although the fire mask mAP@0.5 of 0.41 may seem modest relative to smoke detection, this value should be considered in light of the dataset’s characteristics and the distribution of object scales. Fire instances in our dataset are notably smaller, thinner, and more irregular than smoke regions, which imposes stricter IoU matching requirements for instance segmentation.
To provide a more comprehensive comparison, the authors selected a recent related study from the literature. The authors of [87], in Table 6 of their manuscript, report a bbox mAP@0.5 of 0.71 and an instance segmentation mask mAP@0.5 of 0.64 for the Mask R-CNN model with a ResNet-50 backbone on large images. Given that the FireVision models for smoke achieve a bounding box mAP@0.5 of 0.73 and a mask mAP@0.5 of 0.57, the results are comparable. For the FireVision models for fire, the results are 0.41 for the mask mAP@0.5 and 0.57 for the bounding box mAP@0.5. This is a limitation of the dataset: fire mask annotations are smaller than smoke annotations. This, of course, leads to significantly lower values of mask mAP@0.5, around 35% lower than the best class results for large objects. The authors note this as a limitation of their annotated dataset, which will be addressed by either enriching it with additional fire images or by super-resolution of existing fire images to provide larger annotated fire contours. Nevertheless, in [87], the comparison using small images indicates ResNet-50 mask mAP@0.5 value results of 0.107 and bounding box mAP@0.5 value results of 0.143, which are at least 70% smaller than the FireVision fire model’s mAP@0.5 values for detection of bounding boxes and masks, respectively, for small objects.
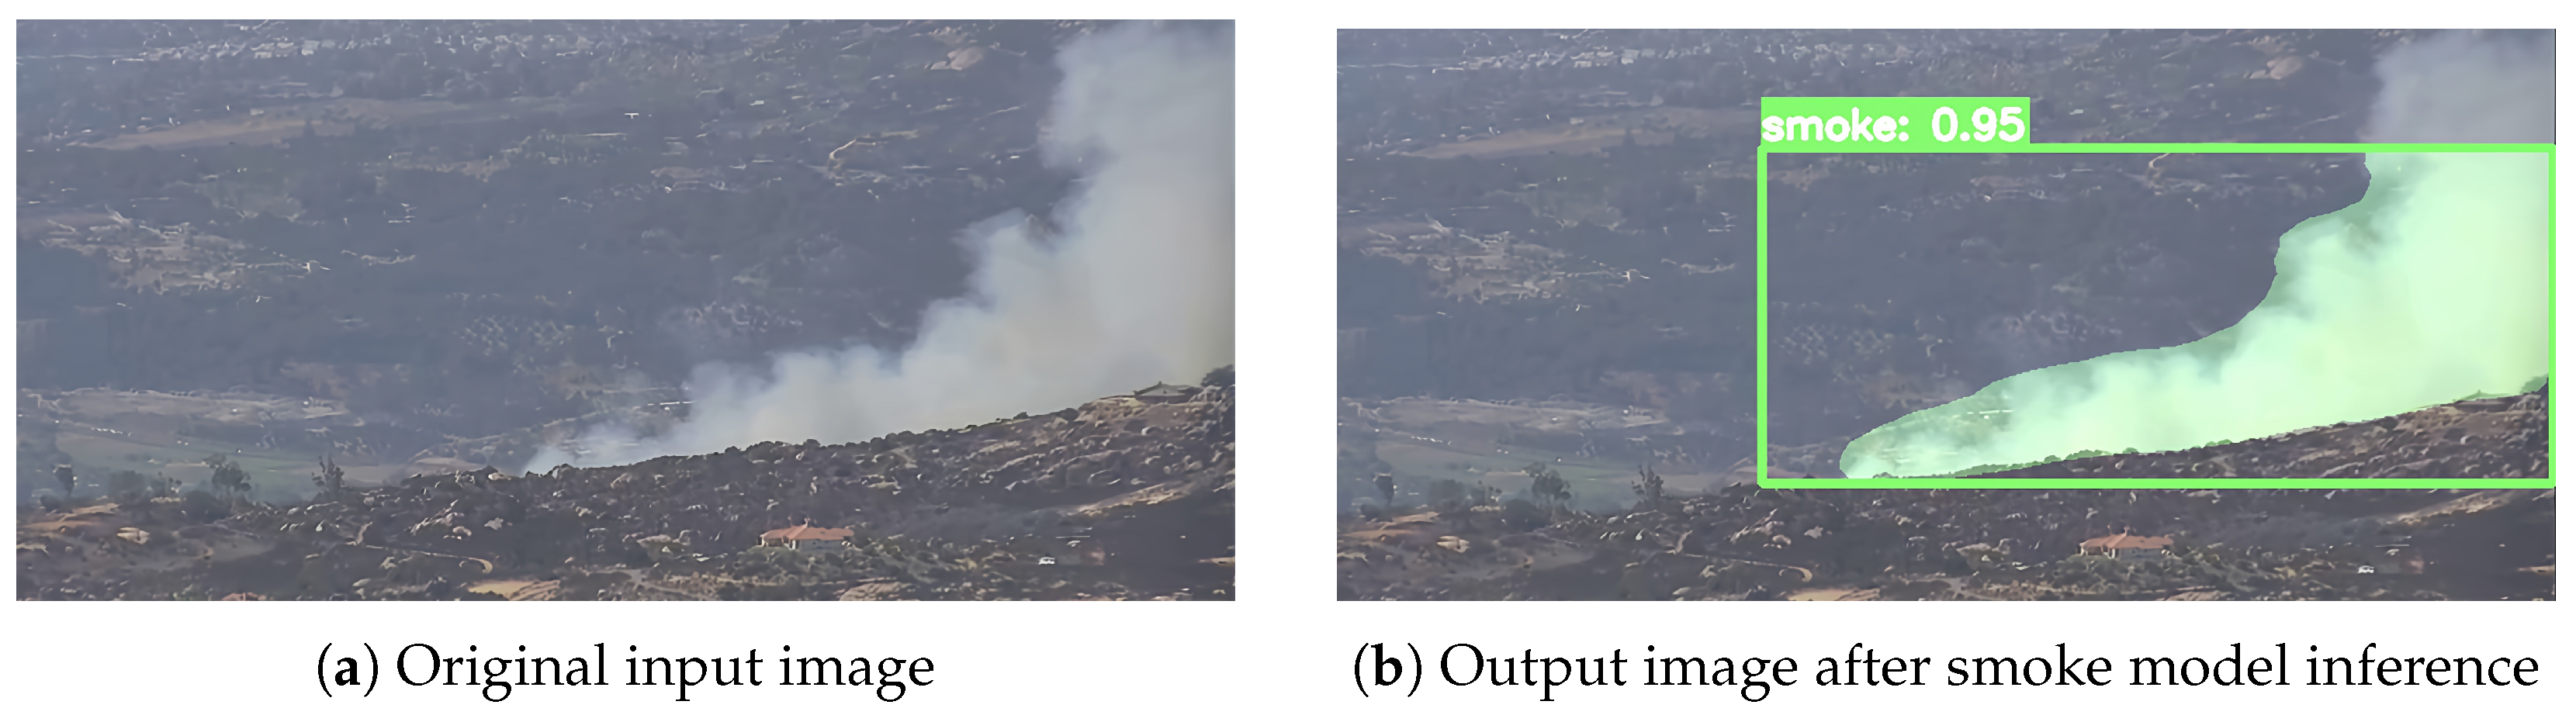
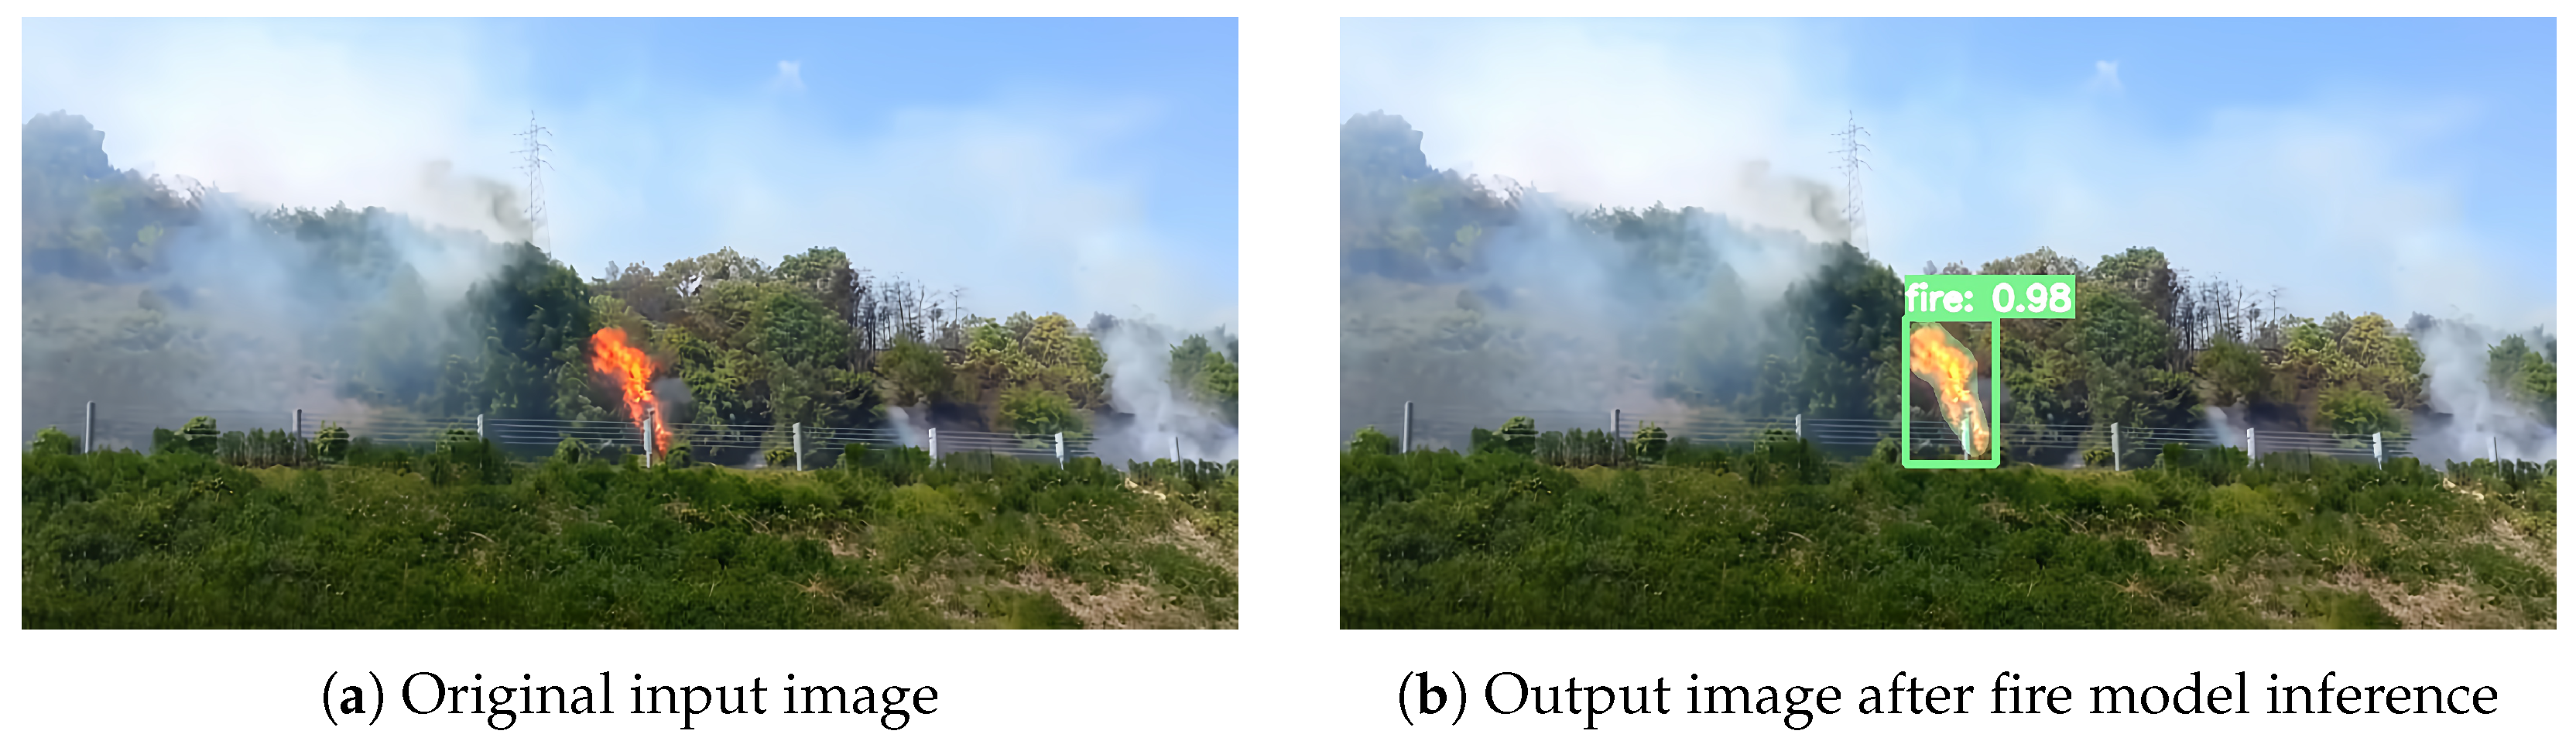
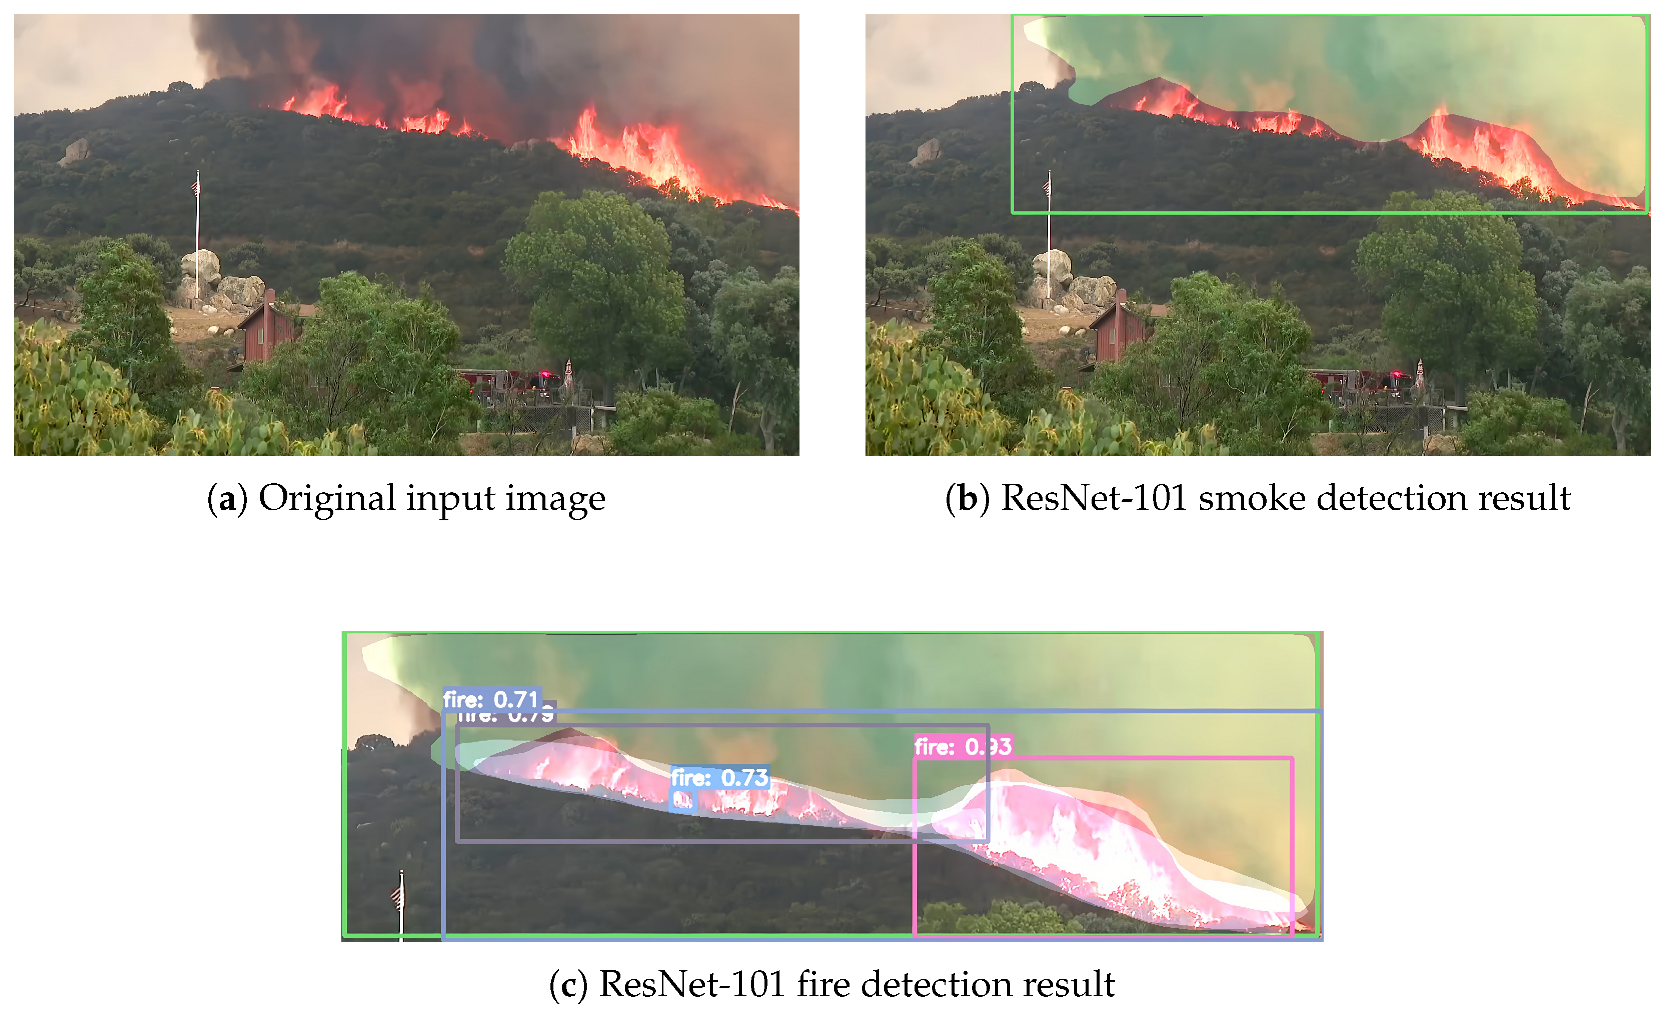
The authors present several inference examples. Figure 4 illustrates a smoke detection case event. Figure 4a illustrates the original image, while Figure 4b illustrates the detected smoke contour with a 95% confidence level. Similarly, Figure 5 presents a fire detection event. Figure 5a is the original input image, while in Figure 5b, the presence of fire with 98% confidence has been detected using the original image. Lastly, Figure 6 demonstrates a sequential smoke-fire detection process. Here, Figure 6a shows the original image, and Figure 6b illustrates the initial smoke detection (93% confidence), with a green bounding box and pixel segmentation. Then Figure 6c depicts the subsequent fire detection within the smoke contour, achieving a confidence level above 70%. All detected contours, including overlapping ones, are used to calculate the Fire Criticality Index.

4.2. Experimental Scenario II Results

Experimental scenario II evaluates the cloud and edge instance segmentation inferences of the smoke and fire models. The examined process includes images that present a single contour of smoke detection, followed by a single contour of fire detection. To present the worst-case scenario for edge and cloud computations, the two separate detections apply to the original images. The inference image sizes for cloud inferences are set to high-resolution 20 MP images (5472 × 3648). The inference image sizes for cloud inference are 1280 × 768, close to 1 MP (300–900 KB JPEG), to preserve real-time drone inference capabilities.
Furthermore, using the same image for 10 MP (cloud) and 1 MP (edge) detections, the FCI calculations are shown. It should be noted that, due to the memory limitations of the NVIDIA Jetson Nano device, experiments could not be conducted using the same image resolution as in Experimental Scenario Section 4.1. For this reason, additional benchmark experiments were conducted to examine whether image resolution has a significant impact on the results.
Using the pre-trained models from Scenario Section 4.1, a similar experimental setup was employed to evaluate the edge performance of the models on the NVIDIA Jetson Nano GPU, in comparison to the performance of the cloud VM. The inference time measurements, the FCI calculation time, and the memory usage for each model are summarized in Table 5.
According to the results of the total inference time of smoke and fire detection and memory usage reported in Table 5 for both cloud and edge deployment scenarios, several important observations can be drawn. More specifically, in the cloud-based detection scenario, the transition from ResNet-50 to ResNet-101 results in a mean 18.75% increase in inference time, whereas ResNet-152 requires approximately 9x longer inference times than ResNet-101. In contrast, for edge-based detections, the inference time increases by 27.3% from ResNet-50 to ResNet-101 and by approximately 29% from ResNet-101 to ResNet-152. As a result, edge-based fire and smoke detection can no longer be considered real-time, but rather near-real-time, making data transmission to the cloud more efficient than performing inference locally on the drone’s co-processing unit.
Furthermore, in the cloud-based detection scenario for high-resolution images (20 MP), the models’ memory consumption reaches particularly high levels, necessitating a reduction in image quality for edge inference, given that the available edge GPU system memory is limited to less than 4 GB. Moreover, for the ResNet-152 backbone, edge inference on super-resolution images is not feasible because the memory requirements exceed the available co-processing unit system memory.
In Table 6, the smoke concentration ( C f , see Equation (11)) and the smoke density ( D f , see Equation (13)) measures are evaluated, using the best-performing cases in terms of the execution time of ResNet-50 and ResNet-101. The results are presented for 1 MP (1280 × 768) and 10 MP (5732 × 3648) images accordingly. The purpose of this evaluation is to estimate detection differences using the same model on images of different resolutions. Therefore, the smoke model is applied to the same image originally captured at 5732 × 3648 px and then downscaled to 1280 × 768 px to avoid high memory utilization during inference of high-resolution images (above 3000 MB), which can lead to memory exhaustion on the drone’s edge computing device.
Focusing on the ResNet-50 and ResNet-101 models for cloud and edge model inferences, and concentration and density measure calculated values for each case, it is obvious that high-resolution images do not offer significant changes as expected for these metrics, since the denominator for both measures is the image pixel area for the concentration and the bounding box area for the density measure, which also proportionally decrease on image downscaling. Furthermore, the lost pixel area information does not trigger different FCI measure responses when inferred from low-resolution images down to 1280 × 768 px. Nevertheless, using ResNet-101 instead of ResNet-50 increases the density measure by 30% and, significantly, the concentration measure across all image resolutions examined.

4.3. Experimental Scenario III Results

Scenario III assesses simulated drone flights as an illustrative example recorded on the map and presents map-derived results concerning the flight simulation process based on data from the drone’s GPS receiver when a fire event is detected. Additionally, it reports the coverage areas of the various proposed automated path policies, which are activated following predetermined flight interruptions triggered by increased FCI values.
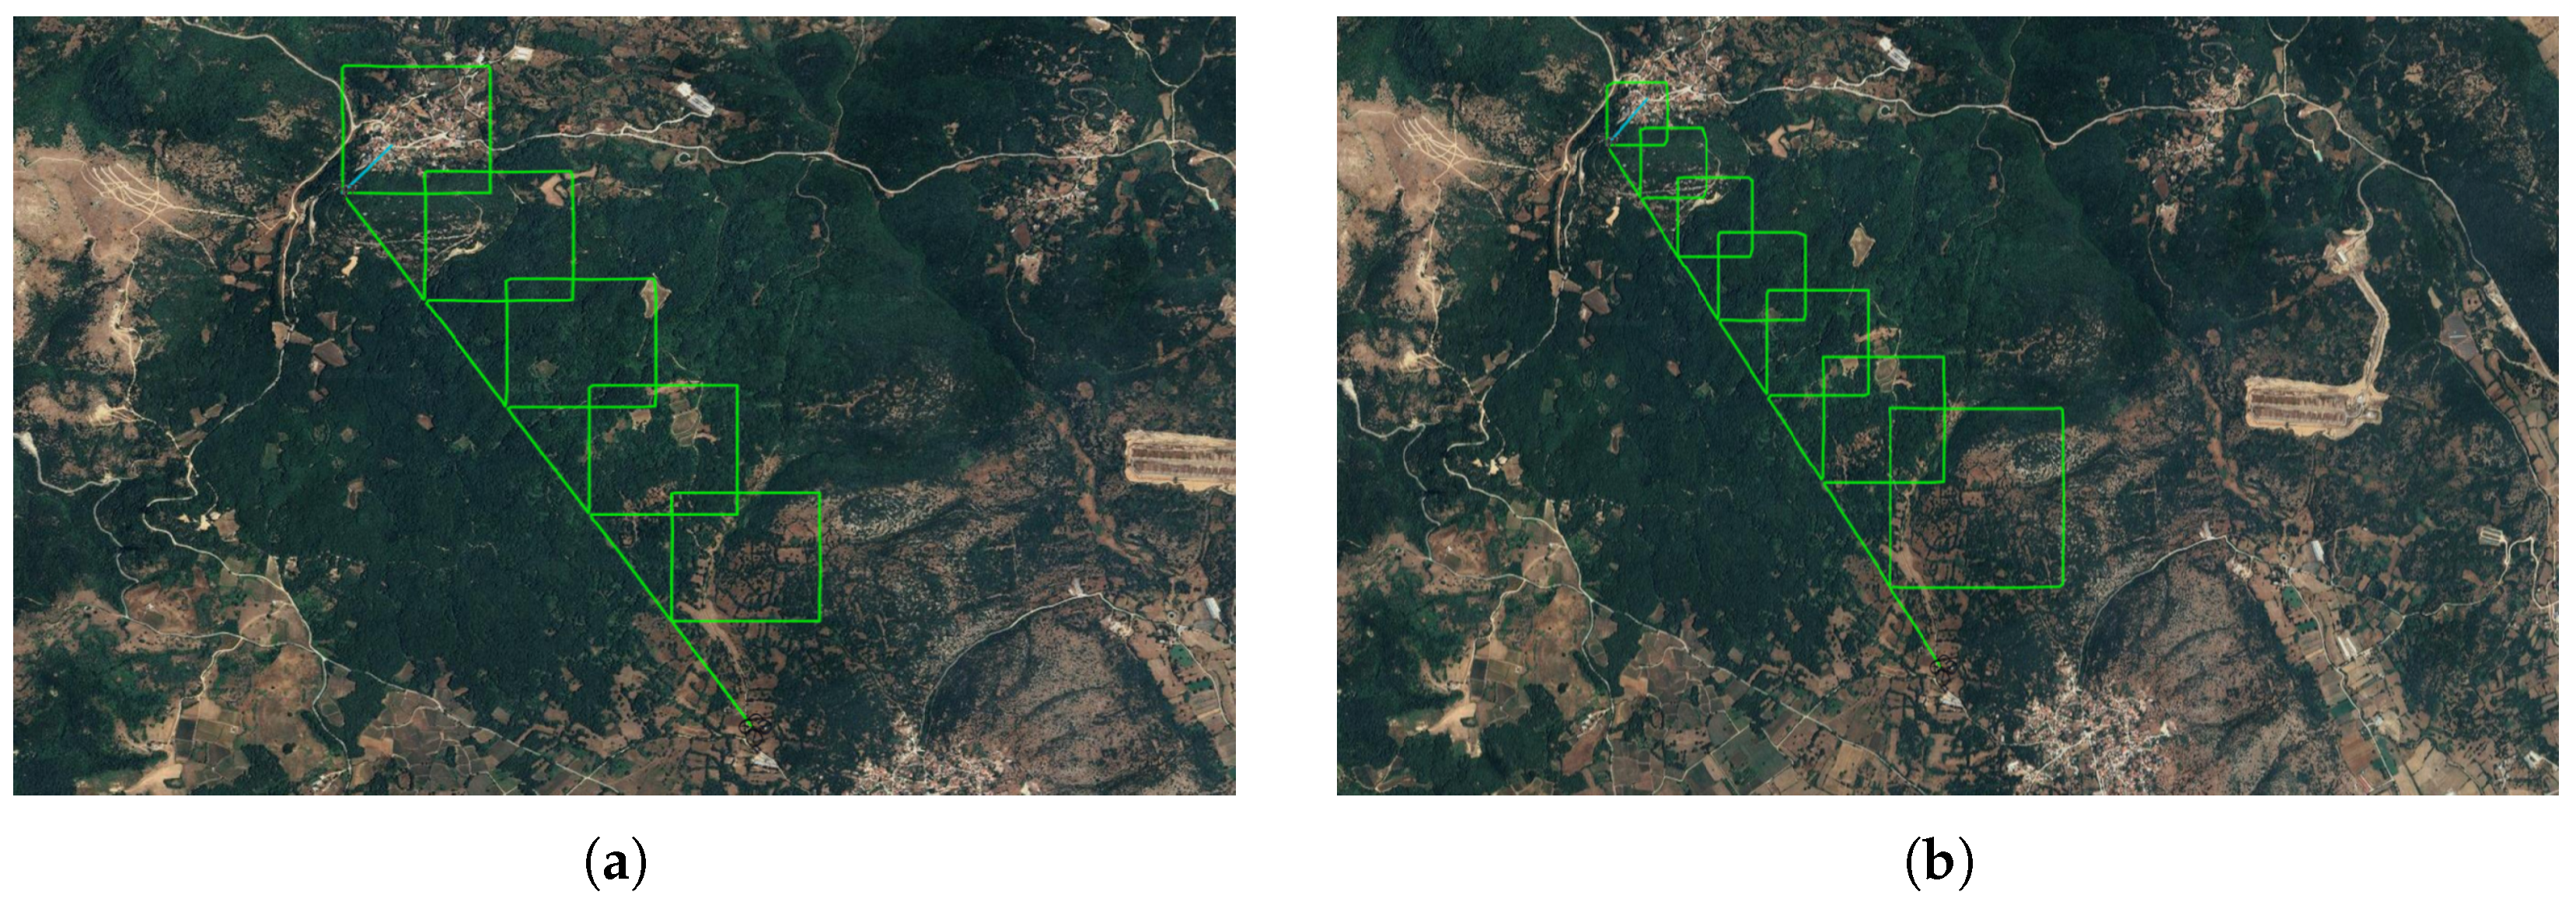
After an FCI event occurred during the drone’s predetermined flight from point A to B, the fire criticality–stress index algorithm initiated a secondary exploration phase utilizing a square-spiral path-planning strategy. Two surveillance policies were evaluated in simulation, (i) fixed-step spiral expansion and (ii) adaptive incremental-step spiral expansion, as shown in Figure 7. In the simulated mission, the drone departed from its home base H, reached waypoint A (lat = 39.805232, lon = 20.659988), and was programmed to proceed to waypoint B (lat = 39.783158, lon = 20.679147). The straight-line distance between A and B was A B = 2950.27 m . The simulation environment replicated real-time drone communication using a MAVLink router service on TCP ports 5760 and 5761, which enabled bidirectional command exchange and telemetry acquisition [74]. The flight trajectory and spiral expansion patterns were displayed using a custom Google Maps-based graphical interface for monitoring and validation.
The fire notification event was initiated at waypoint A when the computed FCI value surpassed the predefined threshold of 0.5 . Upon activation, the simulated drone deviated from its nominal linear trajectory and entered an event-driven exploration mode. Under the fixed-step policy (see Figure 7a), the drone executes a square spiral with constant edge-length increments, thereby systematically expanding coverage and maintaining a uniform spatial sampling density. In contrast, the adaptive incremental-step policy (see Figure 7b) dynamically adjusts the spiral edge length in response to changes in FCI values, permitting larger expansions when criticality remained high and smaller refinements as threshold conditions were approached. This simulation-based comparison facilitated the evaluation of coverage efficiency, responsiveness, and spatial localization accuracy under controlled and reproducible mission conditions prior to real-world deployment.
For the fixed-step spiral motion, the parameter used was k = 5, which led to a fixed step of 590 m ( Δ = 0 ) . The fixed motion results are presented in Table 7.
The total coverage area of the fixed-step motion is 1.75 km 2 , and the flight coverage in meters that the drone actually covered was 14,750.2 m. For the adaptive incremental-step spiral motion, the parameter used was k 0 = 10, which led to an R 0 step value of 290 m. The δ = 250 m was also used in this experiment. The motion results are presented in Table 8.
The total coverage area of the adaptive increase step motion was 1.64 km 2 , and the drone flight coverage in meters was 15,732.9 m.
The fixed-step square-spiral policy uses a constant square edge of 590 m, resulting in a very regular, predictable scanning pattern. As shown in Table 7, each step covers the same ground footprint, so the total covered area grows linearly with the number of squares. The cumulative flight distance required to achieve this coverage is 14.75 km, which is relatively efficient because each meter flown contributes almost uniformly to new terrain being scanned. This regularity also simplifies mission planning and battery budgeting, since both coverage growth and energy consumption per step are constant and easy to predict.
In contrast, the adaptive incremental-step policy starts with smaller squares and gradually increases the square edge length as the drone approaches point B. This strategy allows denser inspection near the start of the fire incident and progressively coarser coverage farther along the path. However, as seen in Table 8, this adaptivity comes at the cost of efficiency: although the drone flies a longer total distance (15.73 km, about 1 km more than the fixed policy), it covers a smaller total area (1.64 km 2 ). Therefore, for applications where maximizing surveyed area per unit of flight distance is the primary objective, such as wide-area wildfire monitoring, the fixed-step spiral is the better policy. The adaptive policy is advantageous only when non-uniform spatial resolution is required, for example, when higher inspection density is needed near the starting region or during first-time event occurrence, as indicated by the FCI index values.

5. Conclusions

The authors propose a system of automated flights combined with deep learning Mask R-CNN models with ResNet backbones, named FireVision. The implementation employs two main models: one for fire detection and one for smoke detection. These models can be arbitrarily used either in parallel or sequentially. Furthermore, the system uses indicator measures of fire and smoke phenomena that account for their concentration and density, expressed as image pixels. Combining these two metrics yields a new metric, the fire criticality index (FCI). When the FCI exceeds a predefined threshold, it triggers a modification of the automated flight path using the proposed fire criticality index–stress algorithm. This algorithm aims to estimate the actual surface area of such a critical event, which is subsequently georeferenced to the GPS coordinates of polygon survey areas, and to provide automated, close-neighbourhood surveillance, which is significant for the appearance and evolution of a fire incident.
Experiments with the FireVision deep learning models were conducted in two deployment scenarios: edge inference using drone co-processing units and cloud inference. Various ResNet backbones, including ResNet-50, ResNet-101, and ResNet-152, were evaluated after training on a mask-annotated dataset of 12,000 images, comprising 8500 smoke images and 4200 fire images. Results indicate that the ResNet-101 model achieves the highest mask mAP@0.5 at inference time, making it the preferred model for cloud-based inference in the FireVision system. For edge-based inference, the ResNet-50 model achieves lower inference time and adequate mAP values compared to the existing literature. Although ResNet-101 is expected to provide 3–5% higher accuracy, it requires 27% more inference time, which may be prohibitive in near-real-time applications.
Consequently, ResNet-50 is recommended for edge inference, while ResNet-101 is more suitable for precise cloud inferences on high-resolution images, resulting in a notable increase in the FCI index during event detection. Study limitations include the drone’s battery life and suboptimal mask mAP performance of the fire detection model, particularly for fire spot detections and small-object identification, due to the use of tile-based approaches and super-resolution. Future research will also fine-tune the automated path-planning process, specifically the adaptive one, by accounting for sensory measurements from the surveillance area environment, including wind information from nearby meteorological stations, to further improve spiral path precision. The authors also note that future work will include additional experimentation with YOLOv8 and v11-seg models, specifically for edge deployment, aiming for mAP results similar to or even better than those of the mask R-CNN ResNet models.

Author Contributions

Conceptualization, S.K. and G.K.; methodology, S.K. and G.K.; software, K.S.; validation, K.S., M.T., S.K., I.A.K. and M.K.; formal analysis, K.S. and M.T.; investigation, K.S. and M.T.; resources, S.K., I.A.K. and M.K.; data curation, K.S. and M.T.; writing—original draft preparation, K.S. and M.T.; review and editing, S.K., I.A.K. and M.K.; visualization, K.S. and M.T.; supervision, S.K., I.A.K. and M.K.; project administration, K.S., M.T. and S.K. All authors have read and agreed to the published version of the manuscript.

Funding

This research received no external funding.

Institutional Review Board Statement

Not applicable.

Informed Consent Statement

Not applicable.

Data Availability Statement

Part of the annotated dataset created by the authors and used in this paper to train the deep learning object detection models is available online at [88].

Acknowledgments

The authors would like to thank Eleftheria Gramozi, Effrosyni Fotiadou, Ioannis Kostakis, Theofanis Ioannou, Christina Loukakou, Theofilos Loukas, and Anna Maria Sidiropoulou for their valuable contribution to the dataset annotation process.

Conflicts of Interest

The authors declare no conflicts of interest.

Abbreviations

The following abbreviations are used in this manuscript:
ASApplication Server
CNNConvolutional Neural Network
CPUCentral Processing Unit
EXIFExchangeable Image File Format
FPNFeature Pyramid Network
GPSGlobal Positioning System
R-CNNRegions with CNN features
RPNRegion Proposal Network
UAVUnoccupied Aerial Vehicle
UIUser Interface
VMVirtual Machine
YOLOYou Only Look Once object detection algorithm

References

  1. Xu, R.; Yu, P.; Abramson, M.J.; Johnston, F.H.; Samet, J.M.; Bell, M.L.; Haines, A.; Ebi, K.L.; Li, S.; Guo, Y. Wildfires, Global Climate Change, and Human Health. N. Engl. J. Med. 2020, 383, 2173–2181. [Google Scholar] [CrossRef]
  2. Bayham, J.; Yoder, J.K.; Champ, P.A.; Calkin, D.E. The Economics of Wildfire in the United States. Annu. Rev. Resour. Econ. 2022, 14, 379–401. [Google Scholar] [CrossRef]
  3. Rizzo, L.V.; Rizzo, M.C.F.V. Wildfire smoke and health impacts: A narrative review. J. Pediatr. 2025, 101, S56–S64. [Google Scholar] [CrossRef] [PubMed]
  4. Aguilera, R.; Corringham, T.; Gershunov, A.; Benmarhnia, T. Wildfire smoke impacts respiratory health more than fine particles from other sources: Observational evidence from Southern California. Nat. Commun. 2021, 12, 1493. [Google Scholar] [CrossRef] [PubMed]
  5. Pinzon, N.; Galt, R.E.; Roche, L.M.; Schohr, T.; Shobe, B.; Koundinya, V.; Brimm, K.; Powell, J. Farming and ranching through wildfire: Producers’ critical role in fire risk management and emergency response. Calif. Agric. 2025, 79, 9–18. [Google Scholar] [CrossRef]
  6. Wilner, L.B.; Piepmeier, L.; Gordon, M.; Steiger, B.B.; Northrop, A.J.; McBrien, H.; Shea, B.; Meltzer, G.Y.; Bedi, N.S.; Blake, E.M.; et al. Two and a half decades of United States wildfire burn zone disaster data, 2000–2025. Sci. Data 2025, 12, 1948. [Google Scholar] [CrossRef]
  7. Modaresi Rad, A.; Abatzoglou, J.T.; Kreitler, J.; Alizadeh, M.R.; AghaKouchak, A.; Hudyma, N.; Nauslar, N.J.; Sadegh, M. Human and infrastructure exposure to large wildfires in the United States. Nat. Sustain. 2023, 6, 1343–1351. [Google Scholar] [CrossRef]
  8. Balch, J.K.; Bradley, B.A.; Abatzoglou, J.T.; Nagy, R.C.; Fusco, E.J.; Mahood, A.L. Human-started wildfires expand the fire niche across human-modified landscapes. Proc. Natl. Acad. Sci. USA 2017, 114, 2946–2951. [Google Scholar] [CrossRef]
  9. Tzoumas, G.; Pitonakova, L.; Salinas, L.; Scales, C.; Richardson, T.; Hauert, S. Wildfire detection in large-scale environments using force-based control for swarms of UAVs. Swarm Intell. 2023, 17, 89–115. [Google Scholar] [CrossRef]
  10. Goldammer, J.G.; Mitsopoulos, I.; Byambasuren, O.; Sheldon, P. Defence of Villages, Farms and Other Rural Assets Against Wildfires: Guidelines for Rural Populations, Local Communities and Municipality Leaders. Technical Report/Wildfire Protection Guidelines, Global Fire Monitoring Center (GFMC), on Behalf of the European and Mediterranean Major Hazards Agreement (EUR-OPA), Council of Europe, 2013. [Distributed by the Hellenic Ministry of Climate Crisis and Civil Protection]. Available online: https://gfmc.online/manag/Village-Rural-Assets-Wildfire-Defense-Guidelines-2013-ENG-web.pdf (accessed on 10 April 2023).
  11. Edgeley, C.M.; Evans, A.M.; Devenport, S.E.; Kohler, G.; Zamudio, Z.M.; DeGrandpre, W.D. Preventing Human-Caused Wildfire Ignitions on Public Lands: A Review of Best Practices. For. Sci. 2025, 71, 493–521. [Google Scholar] [CrossRef]
  12. Barmpoutis, P.; Papaioannou, P.; Dimitropoulos, K.; Grammalidis, N.; Barmpoutis, P.; Papaioannou, P.; Dimitropoulos, K.; Grammalidis, N. A Review on Early Forest Fire Detection Systems Using Optical Remote Sensing. Sensors 2020, 20, 6442. [Google Scholar] [CrossRef]
  13. Bugarić, M.; Krstinic, D.; Šeric, L.; Stipanicev, D.; Bugaric, M.; Krstinic, D.; Seric, L.; Stipanicev, D. Current Trends in Wildfire Detection, Monitoring and Surveillance. Fire 2025, 8, 356. [Google Scholar] [CrossRef]
  14. Kaur, R.; Singh, S. A comprehensive review of object detection with deep learning. Digit. Signal Process. 2023, 132, 103812. [Google Scholar] [CrossRef]
  15. Bochkovskiy, A.; Wang, C.Y.; Liao, H.Y.M. YOLOv4: Optimal Speed and Accuracy of Object Detection. arXiv 2020, arXiv:2004.10934. [Google Scholar] [CrossRef]
  16. Gu, W.; Bai, S.; Kong, L. A review on 2D instance segmentation based on deep neural networks. Image Vis. Comput. 2022, 120, 104401. [Google Scholar] [CrossRef]
  17. He, K.; Gkioxari, G.; Dollar, P.; Girshick, R. Mask R-CNN. IEEE Trans. Pattern Anal. Mach. Intell. 2020, 42, 386–397. [Google Scholar] [CrossRef] [PubMed]
  18. Vasconcelos, R.N.; Rocha, W.J.S.F.; Costa, D.P.; Duverger, S.G.; Santana, M.M.M.d.; Cambui, E.C.B.; Ferreira-Ferreira, J.; Oliveira, M.; Barbosa, L.d.S.; Cordeiro, C.L.; et al. Fire Detection with Deep Learning: A Comprehensive Review. Land 2024, 13, 1696. [Google Scholar] [CrossRef]
  19. Cetinkaya, I.; Catmabacak, E.D.; Ozturk, E. Detection of Fractured Endodontic Instruments in Periapical Radiographs: A Comparative Study of YOLOv8 and Mask R-CNN. Diagnostics 2025, 15, 653. [Google Scholar] [CrossRef] [PubMed]
  20. PyTorch Contributors. Mask R-CNN—Torchvision Models Documentation. 2023. Available online: https://pytorch.org/vision/stable/models/generated/torchvision.models.detection.maskrcnn_resnet50_fpn.html (accessed on 5 September 2024).
  21. MultimodalLearning. PyTorch Implementation of Mask R-CNN. 2023. Available online: https://github.com/multimodallearning/pytorch-mask-rcnn (accessed on 5 September 2024).
  22. Research, F.A. Detectron2: A PyTorch-based Modular Object Detection Library. 2019. Available online: https://github.com/facebookresearch/detectron2 (accessed on 5 September 2024).
  23. Yu, H. A Detailed Introduction to ResNet and Its Implementation in PyTorch, 2022. Available online: https://medium.com/@freshtechyy/a-detailed-introduction-to-resnet-and-its-implementation-in-pytorch-744b13c8074a (accessed on 13 March 2023).
  24. He, K.; Zhang, X.; Ren, S.; Sun, J. Deep Residual Learning for Image Recognition. In 2016 IEEE Conference on Computer Vision and Pattern Recognition (CVPR); IEEE: New York, NY, USA, 2016; pp. 770–778. [Google Scholar] [CrossRef]
  25. Saleh, A.; Zulkifley, M.A.; Harun, H.H.; Gaudreault, F.; Davison, I.; Spraggon, M. Forest fire surveillance systems: A review of deep learning methods. Heliyon 2023, 10, e23127. [Google Scholar] [CrossRef]
  26. Kim, Y.; Heo, Y.; Jin, B.; Bae, Y. Real-Time Fire Classification Models Based on Deep Learning for Building an Intelligent Multi-Sensor System. Fire 2024, 7, 329. [Google Scholar] [CrossRef]
  27. Khan, F.; Xu, Z.; Sun, J.; Khan, F.M.; Ahmed, A.; Zhao, Y. Recent Advances in Sensors for Fire Detection. Sensors 2022, 22, 3310. [Google Scholar] [CrossRef]
  28. Gomez-Gonzalez, J.L.; Marcoulaki, E.; Cantizano, A.; Konstantinidou, M.; Caro, R.; Castro, M. Simulated fire observables as indicators for optimizing wireless sensor networks in wildfire risk monitoring. Ecol. Indic. 2025, 175, 113509. [Google Scholar] [CrossRef]
  29. Gomez-Gonzalez, J.L.; Marcoulaki, E.; Cantizano, A.; Konstantinidou, M.; Caro, R.; Castro, M. Design of Optimal Wireless Sensor Networks for Enhanced Wildfire Risk Mitigation at Wildland–Human Interfaces. In Proceedings of the 35th European Safety and Reliability Conference (ESREL 2025) and the 33rd Society for Risk Analysis Europe Conference (SRA-E 2025), Stavanger, Norway, 15–19 June 2025; pp. 3259–3265. [Google Scholar] [CrossRef]
  30. Carletti, V.; Greco, A.; Saggese, A.; Vento, B. A Smart Visual Sensor for Smoke Detection Based on Deep Neural Networks. Sensors 2024, 24, 4519. [Google Scholar] [CrossRef]
  31. NASA EOSDIS. Fire Information for Resource Management System (FIRMS). 2025. Available online: https://firms.modaps.eosdis.nasa.gov (accessed on 10 September 2023).
  32. Giglio, L.; Boschetti, L.; Roy, D.P.; Hall, J.V.; Zubkova, M.; Humber, M.; Huang, H.; Oles, V. The NASA VIIRS burned area product, global validation, and intercomparison with the NASA MODIS burned area product. Remote Sens. Environ. 2025, 331, 115006. [Google Scholar] [CrossRef]
  33. European Commission; Joint Research Centre (JRC). European Forest Fire Information System (EFFIS). 2025. Available online: https://effis.emergency.copernicus.eu (accessed on 10 April 2025).
  34. Xu, W.; Wooster, M.J. Sentinel-3 SLSTR active fire (AF) detection and FRP daytime product—Algorithm description and global intercomparison to MODIS, VIIRS and landsat AF data. Sci. Remote Sens. 2023, 7, 100087. [Google Scholar] [CrossRef]
  35. Liu, P.; Liu, Y.; Guo, X.; Zhao, W.; Wu, H.; Xu, W. Burned area detection and mapping using time series Sentinel-2 multispectral images. Remote Sens. Environ. 2023, 296, 113753. [Google Scholar] [CrossRef]
  36. Pereira, G.H.d.A.; Fusioka, A.M.; Nassu, B.T.; Minetto, R. Active Fire Detection in Landsat-8 Imagery: A Large-Scale Dataset and a Deep-Learning Study. arXiv 2021, arXiv:2101.03409. [Google Scholar]
  37. Schroeder, W.; Oliva, P.; Giglio, L.; Csiszar, I.A. The New VIIRS 375 m active fire detection data product: Algorithm description and initial assessment. Remote Sens. Environ. 2014, 143, 85–96. [Google Scholar] [CrossRef]
  38. Jahagirdar, A.; Sathe, N.; Thorat, S.; Saxena, S. Fire detection in nano-satellite imagery using Mask R-CNN. Int. J. Signal Imaging Syst. Eng. 2024, 13, 19–26. [Google Scholar] [CrossRef]
  39. Ghali, R.; Akhloufi, M.A. Deep Learning Approaches for Wildland Fires Using Satellite Remote Sensing Data: Detection, Mapping, and Prediction. Fire 2023, 6, 192. [Google Scholar] [CrossRef]
  40. Mani, A.; Chen, X.; Gorbachev, S.; Yan, J.; Dixit, A.; Sun, Y.; Yan, Z.; Wu, J.; Deng, J.; Jiang, X.; et al. A Comprehensive Hyperspectral Image Dataset for Forest Fire Detection and Classification. Sci. Data 2025, 13, 92. [Google Scholar] [CrossRef]
  41. European Space Agency (ESA); European Commission. Copernicus Hyperspectral Imaging Mission for the Environment (CHIME). 2025. Available online: https://www.eoportal.org/satellite-missions/chime-copernicus (accessed on 3 December 2025).
  42. DJI Enterprise. DJI Manifold 3 User Manual. 2025. Available online: https://dl.djicdn.com/downloads/Manifold_3/20250828/Manifold_3_User_Manual_v1.2_en.pdf (accessed on 10 April 2025).
  43. DJI Enterprise. DJI Dock 3 and Matrice 4TD Specifications. 2025. Available online: https://enterprise.dji.com/dock-3/specs (accessed on 10 April 2025).
  44. NVIDIA Corporation. NVIDIA Jetson Nano: Embedded AI Edge Computing Module. 2019. Available online: https://developer.nvidia.com/embedded/jetson-nano (accessed on 30 March 2022).
  45. PX4. Companion Computers|PX4 User Guide. Available online: https://docs.px4.io/main/en/companion_computer/ (accessed on 20 February 2025).
  46. DJI Developer. Jetson Nano Quick Start—Payload SDK (PSDK). Available online: https://developer.dji.com/doc/payload-sdk-tutorial/en/quick-start/quick-guide/jetson-nano.html (accessed on 30 April 2025).
  47. Khan, S.; Khan, M.; Hussain, T.; Ser, J.D.; Cuzzolin, F.; Bhattacharyya, S.; Akhtar, Z.; de Albuquerque, V.H.C. DeepSmoke: Deep learning model for smoke detection and segmentation in outdoor environments. Expert Syst. Appl. 2021, 182, 115125. [Google Scholar] [CrossRef]
  48. Zhao, Y.; Zhang, H.; Zhang, X.; Chen, X. Fire smoke detection based on target-awareness and depthwise convolutions. Multimed. Tools Appl. 2021, 80, 27407–27421. [Google Scholar] [CrossRef]
  49. Sathishkumar, V.E.; Cho, J.; Subramanian, M.; Naren, O.S. Forest fire and smoke detection using deep learning-based learning without forgetting. Fire Ecol. 2023, 19, 9. [Google Scholar] [CrossRef]
  50. Sisias, G.; Konstantinidou, M.; Kontogiannis, S. Deep Learning Process and Application for the Detection of Dangerous Goods Passing through Motorway Tunnels. Algorithms 2022, 15, 370. [Google Scholar] [CrossRef]
  51. Shmelkov, K.; Schmid, C.; Alahari, K. Incremental Learning of Object Detectors without Catastrophic Forgetting. In 2017 IEEE International Conference on Computer Vision (ICCV); IEEE: New York, NY, USA, 2017; pp. 3400–3409. [Google Scholar] [CrossRef]
  52. Kontogiannis, S.; Kokkonis, G.; Pikridas, C. Proposed Long Short-Term Memory Model Utilizing Multiple Strands for Enhanced Forecasting and Classification of Sensory Measurements. Mathematics 2025, 13, 1263. [Google Scholar] [CrossRef]
  53. Peng, C.; Zhao, K.; Maksoud, S.; Li, M.; Lovell, B.C. SID: Incremental Learning for Anchor-Free Object Detection via Selective and Inter-Related Distillation. arXiv 2020, arXiv:2012.15439. [Google Scholar] [CrossRef]
  54. Wang, Z.; Wu, L.; Li, T.; Shi, P. A Smoke Detection Model Based on Improved YOLOv5. Mathematics 2022, 10, 1190. [Google Scholar] [CrossRef]
  55. Yang, L.; Cheng, Y.; Xu, F.; Li, B.; Li, X. Real-Time Smoke Detection in Surveillance Videos Using an Enhanced RT-DETR Framework with Triplet Attention and HS-FPN. Fire 2024, 7, 387. [Google Scholar] [CrossRef]
  56. Govil, K.; Welch, M.L.; Ball, J.T.; Pennypacker, C.R. Preliminary Results from a Wildfire Detection System Using Deep Learning on Remote Camera Images. Remote Sens. 2020, 12, 166. [Google Scholar] [CrossRef]
  57. He, L.; Zhou, Y.; Liu, L.; Zhang, Y.; Ma, J. Research and application of deep learning object detection methods for forest fire smoke recognition. Sci. Rep. 2025, 15, 16328. [Google Scholar] [CrossRef]
  58. Lin, T.Y.; Goyal, P.; Girshick, R.; He, K.; Dollar, P. Focal Loss for Dense Object Detection. In 2017 IEEE International Conference on Computer Vision (ICCV); IEEE: New York, NY, USA, 2017; pp. 2980–2988. [Google Scholar] [CrossRef]
  59. Kontogiannis, S.; Konstantinidou, M.; Tsioukas, V.; Pikridas, C. A Cloud-Based Deep Learning Framework for Downy Mildew Detection in Viticulture Using Real-Time Image Acquisition from Embedded Devices and Drones. Information 2024, 15, 178. [Google Scholar] [CrossRef]
  60. Talaat, F.M.; ZainEldin, H. An improved fire detection approach based on YOLO-v8 for smart cities. Neural Comput. Applic. 2023, 35, 20939–20954. [Google Scholar] [CrossRef]
  61. Guede-Fernández, F.; Martins, L.; Almeida, R.V.d.; Gamboa, H.; Vieira, P. A Deep Learning Based Object Identification System for Forest Fire Detection. Fire 2021, 4, 75. [Google Scholar] [CrossRef]
  62. Begum, S.R.; Datta, Y.S.; Manoj, M.S.V. MASK R-CNN for fire detection. Int. Res. J. Comput. Sci. 2021, 8, 145–151. [Google Scholar] [CrossRef]
  63. Casas, E.; Ramos, L.; Bendek, E.; Rivas, F. Assessing the Effectiveness of YOLO Architectures for Smoke and Wildfire Detection. IEEE Access 2023, 11, 96554–96583. [Google Scholar] [CrossRef]
  64. Alkhammash, E.H. A Comparative Analysis of YOLOv9, YOLOv10, YOLOv11 for Smoke and Fire Detection. Fire 2025, 8, 26. [Google Scholar] [CrossRef]
  65. He, Y.; Sahma, A.; He, X.; Wu, R.; Zhang, R. FireNet: A Lightweight and Efficient Multi-Scenario Fire Object Detector. Remote Sens. 2024, 16, 4112. [Google Scholar] [CrossRef]
  66. Xue, Z.; Kong, L.; Wu, H.; Chen, J. Fire and Smoke Detection Based on Improved YOLOV11. IEEE Access 2025, 13, 73022–73040. [Google Scholar] [CrossRef]
  67. Zhu, W.; Niu, S.; Yue, J.; Zhou, Y. Multiscale wildfire and smoke detection in complex drone forest environments based on YOLOv8. Sci. Rep. 2025, 15, 2399. [Google Scholar] [CrossRef]
  68. Shang, L.; Hu, X.; Huang, Z.; Zhang, Q.; Zhang, Z.; Li, X.; Chang, Y. YOLO-DKM: A Flame and Spark Detection Algorithm Based on Deep Learning. IEEE Access 2025, 13, 117687–117699. [Google Scholar] [CrossRef]
  69. ArduPilot Development Team. Mission Planner. 2025. Available online: https://ardupilot.org/planner/ (accessed on 22 October 2024).
  70. QGroundControl Project. QGroundControl: Drone Control Software. 2023. Available online: https://qgroundcontrol.com/ (accessed on 9 September 2024).
  71. Meier, L.; Honegger, D.; Pollefeys, M. PX4: A node-based multithreaded open source robotics framework for deeply embedded platforms. In 2015 IEEE International Conference on Robotics and Automation (ICRA); IEEE: New York, NY, USA, 2015; pp. 6235–6240. [Google Scholar] [CrossRef]
  72. Christof, T. DJI Wi-Fi Protocol Reverse Engineering. Master’s Thesis, Johannes Kepler University Linz, Linz, Austria, 2021. Available online: https://epub.jku.at/obvulihs/content/titleinfo/6966648?lang=en (accessed on 19 January 2026).
  73. Koubaa, A.; Allouch, A.; Alajlan, M.; Javed, Y.; Belghith, A.; Khalgui, M. Micro Air Vehicle Link (MAVLink) in a Nutshell: A Survey. arXiv 2019, arXiv:1906.10641. [Google Scholar] [CrossRef]
  74. MAVLink Contributors. MAVLink Developer Guide. MAVLink Project, 2025. Available online: https://mavlink.io/en/ (accessed on 10 March 2022).
  75. Swaminathan, T.P.; Silver, C.; Akilan, T. Benchmarking Deep Learning Models on NVIDIA Jetson Nano for Real-Time Systems: An Empirical Investigation. arXiv 2024, arXiv:2406.17749. [Google Scholar] [CrossRef]
  76. Hakani, R.; Rawat, A. Edge Computing-Driven Real-Time Drone Detection Using YOLOv9 and NVIDIA Jetson Nano. Drones 2024, 8, 680. [Google Scholar] [CrossRef]
  77. Voudiotis, G.; Kontogiannis, S.; Pikridas, C. Proposed Smart Monitoring System for the Detection of Bee Swarming. Inventions 2021, 6, 87. [Google Scholar] [CrossRef]
  78. Sapkota, R.; Ahmed, D.; Karkee, M. Comparing YOLOv8 and Mask R-CNN for instance segmentation in complex orchard environments. Artif. Intell. Agric. 2024, 13, 84–99. [Google Scholar] [CrossRef]
  79. Salari, A.; Djavadifar, A.; Liu, X.; Najjaran, H. Object recognition datasets and challenges: A review. Neurocomputing 2022, 495, 129–152. [Google Scholar] [CrossRef]
  80. Lin, T.Y.; Maire, M.; Belongie, S.; Hays, J.; Perona, P.; Ramanan, D.; Dollár, P.; Zitnick, C.L. Microsoft COCO: Common Objects in Context. In Proceedings of the European Conference on Computer Vision (ECCV); Springer: Berlin/Heidelberg, Germany, 2014; pp. 740–755. [Google Scholar] [CrossRef]
  81. Terven, J.; Cordova-Esparza, D.M.; Romero-González, J.A.; Ramírez-Pedraza, A.; Chávez-Urbiola, E.A. A comprehensive survey of loss functions and metrics in deep learning. Artif. Intell. Rev. 2025, 58, 195. [Google Scholar] [CrossRef]
  82. Aguilar-Ruiz, J.S. Prevalence-Insensitive Evaluation of Diagnostic Systems Under Class Imbalance: The Harmonic Mean of Per-Class Sensitivity. Mathematics 2025, 13, 3956. [Google Scholar] [CrossRef]
  83. de Venancio, P.V.A.B.; Lisboa, A.C.; Barbosa, A.V. An automatic fire detection system based on deep convolutional neural networks for low-power, resource-constrained devices. Neural Comput. Appl. 2022, 34, 15349–15368. [Google Scholar] [CrossRef]
  84. Wada, K. Labelme: Image Mask Annotation Tool, 2025. Available online: https://zenodo.org/records/5711226 (accessed on 15 March 2023).
  85. Oracle Cloud Infrastructure Documentation. Compute Shapes in Oracle Cloud Infrastructure, 2024. Available online: https://docs.oracle.com/en-us/iaas/Content/home.htm (accessed on 10 March 2024).
  86. Kwon, H.; Choi, S.; Woo, W.; Jung, H. Evaluating Segmentation-Based Deep Learning Models for Real-Time Electric Vehicle Fire Detection. Fire 2025, 8, 66. [Google Scholar] [CrossRef]
  87. Choi, S.; Song, Y.; Jung, H. Study on Improving Detection Performance of Wildfire and Non-Fire Events Early Using Swin Transformer. IEEE Access 2025, 13, 46824–46837. [Google Scholar] [CrossRef]
  88. Microcomputer Systems Laboratory Team. Pixel Annotated Dataset for Smoke and Fire Events. 2025. Available online: https://sensors.math.uoi.gr:3002/MCSL_Team/FireAI (accessed on 12 November 2025).
Figure 1. FireVision high-level architecture.
Algorithms 19 00169 g001
Figure 2. Two-stage fire and smoke detection algorithm.
Algorithms 19 00169 g002
Figure 3. Annotation and dataset preparation workflow.
Algorithms 19 00169 g003
Figure 4. Mask R-CNN ResNet-101 smoke model inference example.
Algorithms 19 00169 g004
Figure 5. Mask R-CNN ResNet-101 fire model inference example.
Algorithms 19 00169 g005
Figure 6. ResNet-101 sequential detection example: (a) Original drone input image, (b) smoke detection and its associated contour bounding box, including instance segmentation, and (c) fire detection contours inside the smoke contour box of (b), and their associated instance segmentation mask values.
Algorithms 19 00169 g006
Figure 7. Example illustration of the automatic drone maneuvers, as indicated by the fire criticality algorithm in case of a fire detection event. (a) Fire criticality–stress algorithm simulation—deviation of the original drone course in case of a fire incident using a fixed-step policy. (b) Fire criticality–stress algorithm simulation—deviation of the original drone course in case of a fire incident using an adaptive incremental-step policy.
Algorithms 19 00169 g007
Table 1. Comparison table of deep learning object detection model architectures.
ModelArchitecture TypeSpeed (FPS)Accuracy (mAP)Real-Time Suitability/Notes
RetinaNetOne-stage detector with focal lossMediumHighBalances accuracy and speed; effective for class-imbalanced tasks
Faster R-CNN (MobileNet)Two-stage with lightweight backbone (MobileNet)Medium–HighMediumSlower than YOLO but more accurate than other mobile detectors
Faster R-CNN (ResNet)Two-stageMedium–LowMediumSlower than YOLO but more accurate than other detectors
YOLO (v5/v8/v11/v26)One-stage end-to-end detectionHighMedium–LowOptimized for real time; widely used in wildfire detection
SSDOne-stage with default boxes (anchors)HighLowSimpler and faster than RetinaNet but slightly lower accuracy
Transformers
(e.g., DETR)
Attention-based (encoder–decoder)LowHighHigh accuracy and global reasoning but slower inference; not yet optimal for real-time edge deployment
Table 2. Precision metrics used in the proposed FireVision model experimentation.
Metric/LossDescription
mIoU|IoUIoU quantifies the overlap between the predicted and ground-truth masks to evaluate localization at the pixel level or bounding box overlaps accordingly
Mask|Bbox mAPAverage Precision is computed at a fixed mIoU threshold of 0.5, reflecting detection performance under a more lenient instance segmentation criterion than COCO mask AP 0.5 0.95 . It matches predicted masks to ground-truth masks using mask IoU. It differs from mAP@0.5 Bbox, used by Faster-RCNN algorithms, which utilizes the bounding box IoU criterion
Table 3. Loss functions monitored in the proposed FireVision model experimentation.
Metric/LossDescription
Classification LossCross-entropy loss quantifying the discrepancy between the predicted class probability distribution and the ground-truth distribution
Bounding Box Regression LossSmooth L1 loss measuring discrepancies between predicted and ground-truth bounding box locations
Mask LossPixel-wise binary cross-entropy loss evaluating segmentation accuracy of predicted masks for positive region proposals
Objectness LossBinary cross-entropy loss used by the Region Proposal Network to distinguish object regions from background
RPN Bounding Box LossSmooth L1 loss applied to refine anchor-based bounding box predictions generated by the RPN
Total LossThe sum of all classification, localization, and mask R-CNN related loss components (see Equation (7))
Table 4. Validation loss and mAP@0.5 of ResNet backbones for smoke and fire detections.
Smoke Detection ModelFire Detection Model
Measure ResNet-50 ResNet-101 ResNet-152 ResNet-50 ResNet-101 ResNet-152
Total Loss0.5960.5750.5251.0300.9250.901
Mask Loss0.3800.3660.3120.4350.4010.386
Classification Loss0.0770.0500.0420.1560.0960.089
Mask mAP@0.50.5740.6460.6490.4090.4300.435
Mask m A P a g g 0.4770.5160.520.4770.5160.52
Bbox mAP@0.50.730.770.7850.570.600.61
Table 5. Two-stage detection inferences, FCI time, memory usage, and FPS of ResNet-50, ResNet-101, and ResNet-152.
Backbone ModelLoad & Inference Time (s)FCI Calculation Time (s)Memory Usage (MB)FPS
CloudResNet-50 (5732 × 3648 px)4.00.022555.10.062
CloudResNet-101 (5732 × 3648 px)4.750.033132.30.059
CloudResNet-152 (5732 × 3648 px)44.60.886575.60.017
EdgeResNet-50 (1280 × 768 px)70.422.161036.90.014
EdgeResNet-101 (1280 × 768 px)89.642.191210.20.011
EdgeResNet-152 (1280 × 768 px)116.482.31818.50.008
Table 6. Smoke density and concentrations of ResNet-50 and ResNet-101 models using 10 MP and 1 MP images.
Backbone ModelSmoke DensitySmoke Concentration
ResNet-50 (5732 × 3648 px)0.670.02
ResNet-50 (1280 × 768 px)0.660.02
ResNet-101 (5732 × 3648 px)0.850.14
ResNet-101 (1280 × 768 px)0.830.14
Table 7. Square-spiral drone moves. The square edge is of fixed length.
StepRemaining to B (m)Area ( km 2 )Flight Coverage (m)
02950.20.34812950
12360.10.34815900
21770.10.34818850
31180.10.348111,800
4590.230.348114,750.2
Table 8. Adaptive square-spiral drone moves. The square edge length R is adaptively increased.
StepRemaining to B (m) R i s (m)Area ( km 2 )Drone Flight Coverage (m)
02950.2295.00.08701475
12655.1327.80.10753114
22327.3368.80.13604958
31958.6421.50.17777066
41537.1491.70.24189524
51045.4590.00.348112,474
6307.9737.50543915,424
----15,732.9
Disclaimer/Publisher’s Note: The statements, opinions and data contained in all publications are solely those of the individual author(s) and contributor(s) and not of MDPI and/or the editor(s). MDPI and/or the editor(s) disclaim responsibility for any injury to people or property resulting from any ideas, methods, instructions or products referred to in the content.