


Abstract
With the aim of mitigating the impact of wind power integration and source-load-side uncertainties on an integrated energy system, we initially employed the Monte Carlo simulation in this study to randomly generate multiple wind power output/load scenarios in accordance with probability distribution functions. Additionally, we proposed a two-stage optimization method. In the first stage of our study, an enhanced African vulture optimization algorithm was applied to perform multi-objective optimization targeting fuel cost and carbon emissions across various scenarios, thereby solving the Pareto frontier to obtain multiple candidate solutions. In the study’s second stage, comprehensively considering fuel cost, carbon emission, and wind power penetration rate, evidential reasoning was utilized to determine the optimal operation strategy among the candidates. Finally, a combined heat and power system composed of the IEEE 30-bus system and a 32-node heating network was simulated. The results demonstrate that this decision-making approach can effectively reflect the merits of candidate solutions, thus validating the feasibility of the designed research methodology.
1. Introduction
As a result of proposals of “carbon peak” and “carbon neutrality”, reducing the level of carbon emissions and promoting the consumption of renewable energy have become urgent problems to be solved in the world today, especially when factoring in the issue of costs. An integrated energy system centered on cogeneration has changed the previous mode of planning and operation associated with traditional systems with only a single form of energy, and it has realized the collaborative planning of energy subsystems, improved energy efficiency, reduced costs, and reduced carbon emissions [1]. Therefore, the optimal dispatch of an integrated energy system conducive to a core “low-carbon economy” has become a research hotspot in the field.
In integrated energy system optimization, researchers mainly focus on the economic, environmental, and energy utilization benefits of system operation, an effort that involves multi-objective optimization of the system [1,2]. The multi-objective optimization problem of an integrated energy system requires the simultaneous optimization of multiple objectives, and it is usually impossible to find a unique solution that optimizes all the objectives at once [3]. However, there may only be one final operation strategy for this system; thus, it is necessary to appropriately decide on an optimal solution [4,5]. At present, most researchers focus on intelligent algorithm research that ensures the convergence of the Pareto frontier, but less attention has been paid to research on decision-making methods [6]. Most of the decision-making methods currently used are based on simple fuzzy decisions or the discrepancy between the best and worst solutions [7]. Therefore, the study of multi-objective optimization decision-making for integrated energy systems is of great value [8].
The output of wind power grid-connected units in the integrated energy system is subject to significant uncertainty due to wind speed, and the fluctuation of the load side is considerable. This greatly complicates system operation optimization [9,10,11,12]. When solving the multi-objective optimization problem, using appropriate methods accounting for wind speed and load-side uncertainties is important [7]. Globally, robust optimization and stochastic optimization are mainly utilized to reduce system uncertainties. The authors of Ref. [13] proposed a day-ahead microgrid energy management framework with the demand response aggregator as the intermediate coordinator. The scheduling strategy to maximize the social welfare of the microgrid system considered end-user privacy and the uncertainties of renewable energy. In Ref. [14], a two-stage stochastic model was proposed for the optimization of energy storage system operation to mitigate uncertainties associated with price and the impact of energy storage charging and discharging. However, the robust optimization used in the above research must consider the range of uncertainties, yet it only considers the system’s optimal control strategy in the worst-case scenario. The resulting optimization is too conservative to ensure economic operation of the system [15].
In summary, the deep coupling of energy subsystems provides a new direction for effectively alleviating energy shortages, but the increasing proportion of distributed renewable energy generation units poses great challenges to the optimization of system operation. In order to reduce system uncertainties [9], we propose a two-stage optimization method. When solving multi-objective optimization problems, it is also crucial to adopt appropriate decision-making methods to consider uncertainties and select the optimal operating plan for the system [7].
In this paper, we study the two-stage optimization method for an integrated energy system. Firstly, Monte Carlo simulation is used to mitigate uncertainties associated with the source and load sides. In the first stage of our study, the enhanced African vulture optimization algorithm was used to optimize fuel cost and carbon emissions across multiple objectives and obtain multiple candidate solutions for the system’s daily scheduling and operation. In the study’s second stage, evidential reasoning was used to select the optimal operating scenario for the current system.
The primary originality of this study lies in the integration of an enhanced multi-objective optimization algorithm with the evidential reasoning (ER) approach within a two-stage decision-making framework, specifically designed to address the uncertainties in integrated energy systems (IES).
To clarify, the novelty is two-fold:
Methodological Integration (Primary Novelty): We propose a novel two-stage optimization framework that bridges multi-objective metaheuristic optimization with evidential reasoning. While these methods exist independently, their combination in this specific context is innovative.
Stage 1: We employ an Enhanced African Vulture Optimization Algorithm (E-AVOA). While the basic AVOA is established, we have introduced specific enhancements to improve its performance in solving complex, non-convex IES dispatch problems.
Stage 2: We introduce Evidential Reasoning (ER) to rank the Pareto-optimal solutions. Unlike traditional methods that rely solely on distance metrics (e.g., Euclidean distance) for selecting the “best” compromise solution, the ER approach allows for a more comprehensive evaluation by aggregating qualitative and quantitative criteria (such as fuel cost, carbon emissions, and wind power penetration rate) under uncertainty. This provides decision-makers with a more robust and intuitive strategy.
Handling Uncertainty: The framework is specifically tailored to mitigate the impact of source-load-side uncertainties. By utilizing Monte Carlo simulation to generate scenarios based on probability distribution functions, we ensure the optimization results are robust against the randomness and volatility of wind power and loads.
2. Two-Stage Optimization Method for Integrated Energy System
For convenience, the meanings of symbols are defined in Table 1.
Table 1.
Meaning of symbols.
2.1. Structure of the Integrated Energy System
In a comprehensive energy system, energy input includes the upper-level power grid; wind power conversion equipment includes cogeneration units and gas boilers; and energy storage equipment includes batteries and thermal storage tanks, which together meet the electrical and thermal load requirements of the system.
There are two operating modes for an integrated energy system: the “heat exchange” mode and the “electric heat exchange” mode. In the former mode, the system prioritizes meeting the heat load demand, generating heat while supplying electrical load and compensating for shortfalls with other power generation equipment; this relies on heat load to determine power generation during system operation. The latter mode prioritizes meeting electrical load demands, generating electricity while supplying heat to the thermal load and supplementing shortfalls with other heat-generating equipment; this relies on the electrical load to determine the heat generated during system operation. The power load in the integrated energy system structure adopted in this paper can be supplied by the higher-level power grid as well as wind turbines and cogeneration units, while the heat load can only be supplied by the cogeneration units inside the system and cannot obtain heat from outside the system. Therefore, the operation mode of “heat determines electricity” is adopted.
2.2. Two-Stage Optimization Method
2.2.1. Two-Stage Optimization Framework
In this paper, to address the impact of wind power grid-connected model and source load-side uncertainties on the system, we used a Monte Carlo simulation to randomly generate multiple wind power output scenarios according to probability distribution functions, weakening the influence of uncertainties. On this basis, we propose a two-stage optimization method: in the first stage, multi-scenario wind power output is taken as the input, while considering the randomness of the load, and an enhanced African vulture optimization algorithm is adopted. Moreover, multi-objective optimization is carried out with fuel cost and carbon emissions as the objectives of each scenario, solving the Pareto boundary and obtaining multiple candidate solutions. In the second stage, considering the fuel cost, carbon emissions, and wind power penetration rate, evidential reasoning is used to select the optimal solution from the candidate solutions as the final operation strategy of the system.
2.2.2. Objective Functions and Constraints
In the optimization model of the integrated energy system established in this paper, the first stage solves the multi-objective optimization problem, which is established in the form of the model shown below:
and are the state and control variables in the system, respectively, with the following parameters:
where ensures non-singular buses of the Jacobi matrix in the tidal current calculation.
Objective Function
To account for economic and environmental protection of the integrated energy system when optimizing operation while also reducing the impact of uncertainties on the system associated with the source and load sides, we select the fuel cost expectation of a number of randomly generated scenarios as well as the carbon emission expectation of the system to optimize the system with the two objectives in mind; this is able to satisfy the system’s basic requirements for the above performances.
The first optimization objective is fuel cost, which is formulated as follows:
The fuel cost of the system is related to the active output of the unit, and the authors of previous studies have revealed that the quadratic simulation is more in line with the actual operation; its functional expression is shown below [16]:
The second optimization objective is carbon emissions, and its specific formula is basically the same as that for the fuel cost and, thus, will not be repeated here; it is expressed as follows:
The third optimization objective is the wind power penetration rate, the proportion of the total power emitted by the turbines to the electrical energy required by the system; it is expressed as follows:
Constraint Conditions
From the perspective of stable operation of the system, the control variables in the optimization process must satisfy certain equation constraints and inequality constraints. Among them, the equation constraints include the active and reactive power balance of the power system, the expressions of which are shown below:
The inequality constraints include the upper and lower constraints on the active and reactive power of the generator, on the reactive power emitted by the reactive power source, and on the regulation range of the transformer ratio, with the following expressions:
Treatment of Uncertainties
- Monte Carlo simulation
The basic steps of combining Monte Carlo simulation with an integrated energy system include (1) modeling the uncertainties of wind power output and load and determining the probability density functions of both; (2) generating a random sequence of wind speed and load based on the probability density function determined in the previous step and substituting the random sequence into the system model to obtain the corresponding target values of the system; and (3) determining the sample size for generating a certain number of scenarios and calculating the target value for each scenario.
The utilization of distribution theories and the Monte Carlo simulation in Section 2 is necessitated by the fundamental nature of power and energy systems, which are inherently filled with various uncontrollable and stochastic factors (such as renewable generation intermittency and load fluctuations).
Specifically, distribution theories are used to describe the statistical characteristics of these uncertain variables, providing a mathematical representation of their probability density. Meanwhile, the Monte Carlo simulation is used to simulate the actual occurrence process of these variables over time, allowing for the generation of numerous realistic scenarios.
This combined approach is currently the standard practice in power system analysis. As demonstrated in [17], this methodology is widely adopted to handle the complexity and uncertainty of modern energy systems effectively.
- Wind power integration
The output of wind turbines is determined by real-time wind speed; therefore, it has significant uncertainty. The Weibull two-parameter curve can fit the actual wind speed distribution well. Based on the distribution curve, the average and effective values of wind energy density can be quickly found. The expression of its probability density function is
where denotes the shape parameter and represents the scale parameter, which are two parameters of the Weibull distribution; is the actual wind speed at the second bus with the wind turbine installed. In this paper, k is set to 2, at which point the probability distribution of wind speed approximates the Rayleigh distribution, and the wind speed is always greater than zero, which is consistent with the actual situation.
- Load model
In this paper, the load is assumed to follow a Gaussian distribution with a probability density distribution function:
where is the actual power of the load on the jth bus; is the load expectations; and is the standard deviation of the load.
3. Enhanced African Vulture Optimization Algorithm Based on Multi-Objective Optimization
African Vulture Optimization Algorithm
The African vulture optimization algorithm (AVOA) is a novel intelligent optimization algorithm proposed by Abdollahzadeh in 2021. This algorithm considers food as the optimal solution and seeks the optimal solution by simulating the foraging behavior of vultures. This optimization algorithm consists of five stages, namely identifying the best vulture in any group, vulture hunger rate, exploration, development, and exploitation. The specific implementation process of the African vulture optimization algorithm can be found in Ref. [18].
The African vulture optimization algorithm is a single-objective optimization algorithm. In practical situations, system optimization is usually multi-objective. For example, in this paper, the first stage of system optimization has two objectives: fuel cost and carbon emission. Therefore, traditional optimization algorithms for African vultures need to be improved.
Enhanced African Vulture Optimization Algorithm
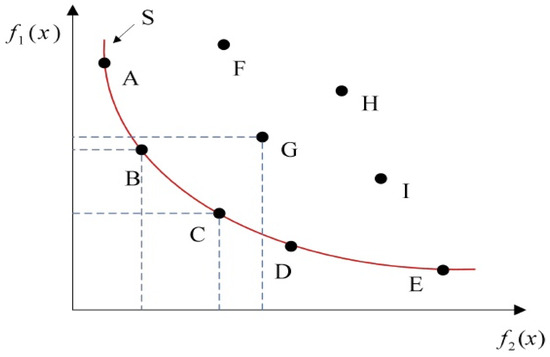
The enhanced African vulture optimization algorithm is based on the Pareto optimal solution, and we must understand the dominance and non-dominance relationship. In order to facilitate understanding, the minimization problem is illustrated as an example, two objectives and are selected for optimization and have been solved by the algorithm, as shown in Figure 1, and A~I is the set of solutions obtained.
Figure 1.
Set of solutions to multi-objective optimization problems.
From this figure, we can see that both objective values corresponding to solution B are better than those corresponding to solution G. Then, B is said to dominate G or G is dominated by B on and , and similarly, D dominates I. For solution B and solution C, one objective component of solution B is better than that of solution C, but solution C is better than that of solution B for the other objective component, and then, there is a non-dominance relationship between solution B and solution C. That is to say, the two solutions are unable to compare the superiority and inferiority of all objectives simultaneously. If X1 dominates X2 and X1 is not dominated by any other solution, then X1 is said to be a non-dominated solution, which is also called a Pareto solution, and the plane composed of all Pareto solutions is called a Pareto front, such as the curve S in the figure.
In the multi-objective optimization of an integrated energy system, multiple candidate solutions can be obtained using the enhanced African vulture optimization algorithm, and the optimal solution space can be generated by using the dominant and non-dominant relationships among the candidate solutions.
4. Information Fusion Method Based on Evidential Reasoning
In the multi-objective optimization of an integrated energy system, only multiple candidate solutions can be obtained through the enhanced African vulture optimization algorithm. In order to select the final system operation strategy, a comprehensive evaluation of the candidate solutions must be conducted to determine the advantages and disadvantages of each candidate solution. In the second stage, fuel cost, wind power penetration rate, and carbon emission are selected as evaluation indicators, and information fusion methods are used for decision-making. The main methods used for information fusion are the weighted average method, the Kalman filter method, evidential reasoning, etc. Among them, due to the excellent performance of evidential reasoning in dealing with multi-attribute decision-making problems that involve both subjective uncertainties and qualitative indicators, evidential reasoning was used in this study.
4.1. Treatment of Uncertainties
Multi-attribute analysis, a preparatory effort preceding evidential reasoning, requires determining the set of evaluation metrics, the set of candidate solutions, and the evaluation level. The evaluation metrics are used to measure the goodness of the candidate solutions, and their mathematical expressions are
where is the ith evaluation metric, i.e., the properties of the candidate solution. Each indicator has a corresponding weight , representing the importance that decision makers attach to different evaluation indicators, and the weight satisfies the following conditions:
The set of candidate solutions is composed of those obtained after the multi-objective optimization algorithm has solved the system, and the mathematical expression is
Evaluation grades are used to describe the degree of goodness of the candidate solution; generally, the grades are not related to each other and can be expressed as “very poor”, “poor”, “general “, “good”, “very good”, and so on, as follows:
When evaluating the candidate solutions, the decision maker must assess the confidence level of each solution at different evaluation levels under different evaluation metrics, i.e., the decision maker gives a specific value to indicate the decision maker’s level of support for the given proposition based on the sometimes ambiguous and sometimes confusing feeling and understanding of the available set of evidence, which can be described as the following set:
where is the confidence level of at evaluation level corresponding to the ith evaluation indicator, while needs to satisfy the following conditions:
reflects the decision maker’s understanding of the ith evaluation indicator: if its value is equal to 0, it means that the decision maker cannot interpret the evaluation indicator; if its value is equal to 1, it means that the decision maker can fully interpret the indicator; and if the value is between 0 and 1, it means that the decision maker’s interpretation has uncertainties.
4.2. Convergence of Multiple Pieces of Evidence
In the multi-attribute analysis, the confidence level is evaluated for individual evaluation indexes, and the confidence level corresponding to each evaluation level is combined to form a confidence assessment vector. Since there are L evaluation indexes, each candidate solution can obtain L confidence assessment vectors. In order to enable the decision maker to select the optimal solution intuitively, it is necessary to perform a comprehensive evaluation of each solution on each index, i.e., the L evidence is fused to obtain a comprehensive confidence assessment vector.
Based on the confidence level obtained in the previous step and the corresponding weights of each evaluation indicator, the basic confidence level can be obtained:
Considering that decision makers do not fully understand the indicators and that there are uncertainties in the assessment process, there is a need to solve for the underlying plausibility of uncertainties:
In order to facilitate the subsequent fusion of evidence, the underlying plausibility of uncertainties is divided into two components, and , which are expressed as follows:
In order to obtain the total basic confidence level, the (i + 1)th total basic confidence level needs to be recursively inferred from the ith total basic confidence level , where is the fusion of confidence vectors on the first i metrics. The specific recursive formula is then
where is the total uncertainties’ basic confidence, obtained by fusing the uncertainties’ basic confidence for the first i indicators, which can be similarly divided into two parts, and , with the specific expression
with , , and , where is
where .
After the above recursion, the total confidence vector, as well as the total uncertainty confidence for each candidate solution at different evaluation levels, can be obtained.
where is the candidate program; is the total confidence level of the candidate program on the nth evaluation index; and is the total uncertainty confidence level of the candidate program on the kth evaluation index. Their formulas are
4.3. Utility Analysis
Although the confidence vector obtained through the above steps can be roughly used to determine the advantages and disadvantages of the candidate programs, the decision maker cannot determine the final program from the intuitive value; for this reason, we need to use the utility analysis method to convert the confidence vector into the corresponding utility value and compare the utility value of each program to determine the optimal solution, in which a greater utility value of the solution indicates that the solution’s comprehensive performance is better.
The formula for solving the utility value is as follows:
where is the utility value corresponding to the nth evaluation level , with a higher evaluation level indicating a higher utility value, i.e., .
Due to the existence of uncertainties in the decision maker’s understanding, the utility value alone cannot provide a complete assessment of the advantages and disadvantages of the candidate solution; therefore, a calculation of the utility value is also required to consider the total uncertainty confidence level, and the maximum utility value and the minimum utility value must be calculated so as to find the average utility value; the solution formula is as follows:
Ultimately, the average utility value is used as a measure of the candidate solutions, and finally, the candidate solution corresponding to the maximum average utility value is selected as the final operation strategy of the system.
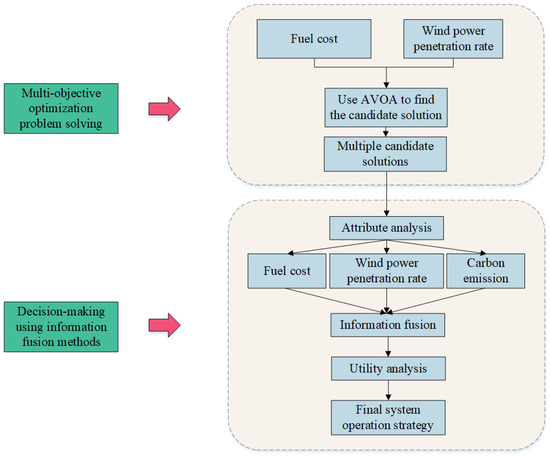
The control flowchart is shown in Figure 2.
Figure 2.
The control flowchart.
5. Example Analysis
5.1. System Setup
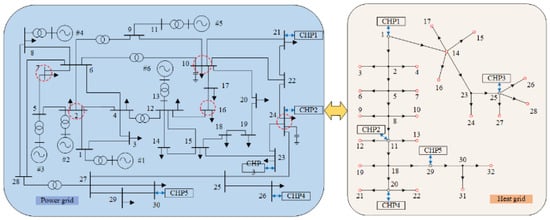
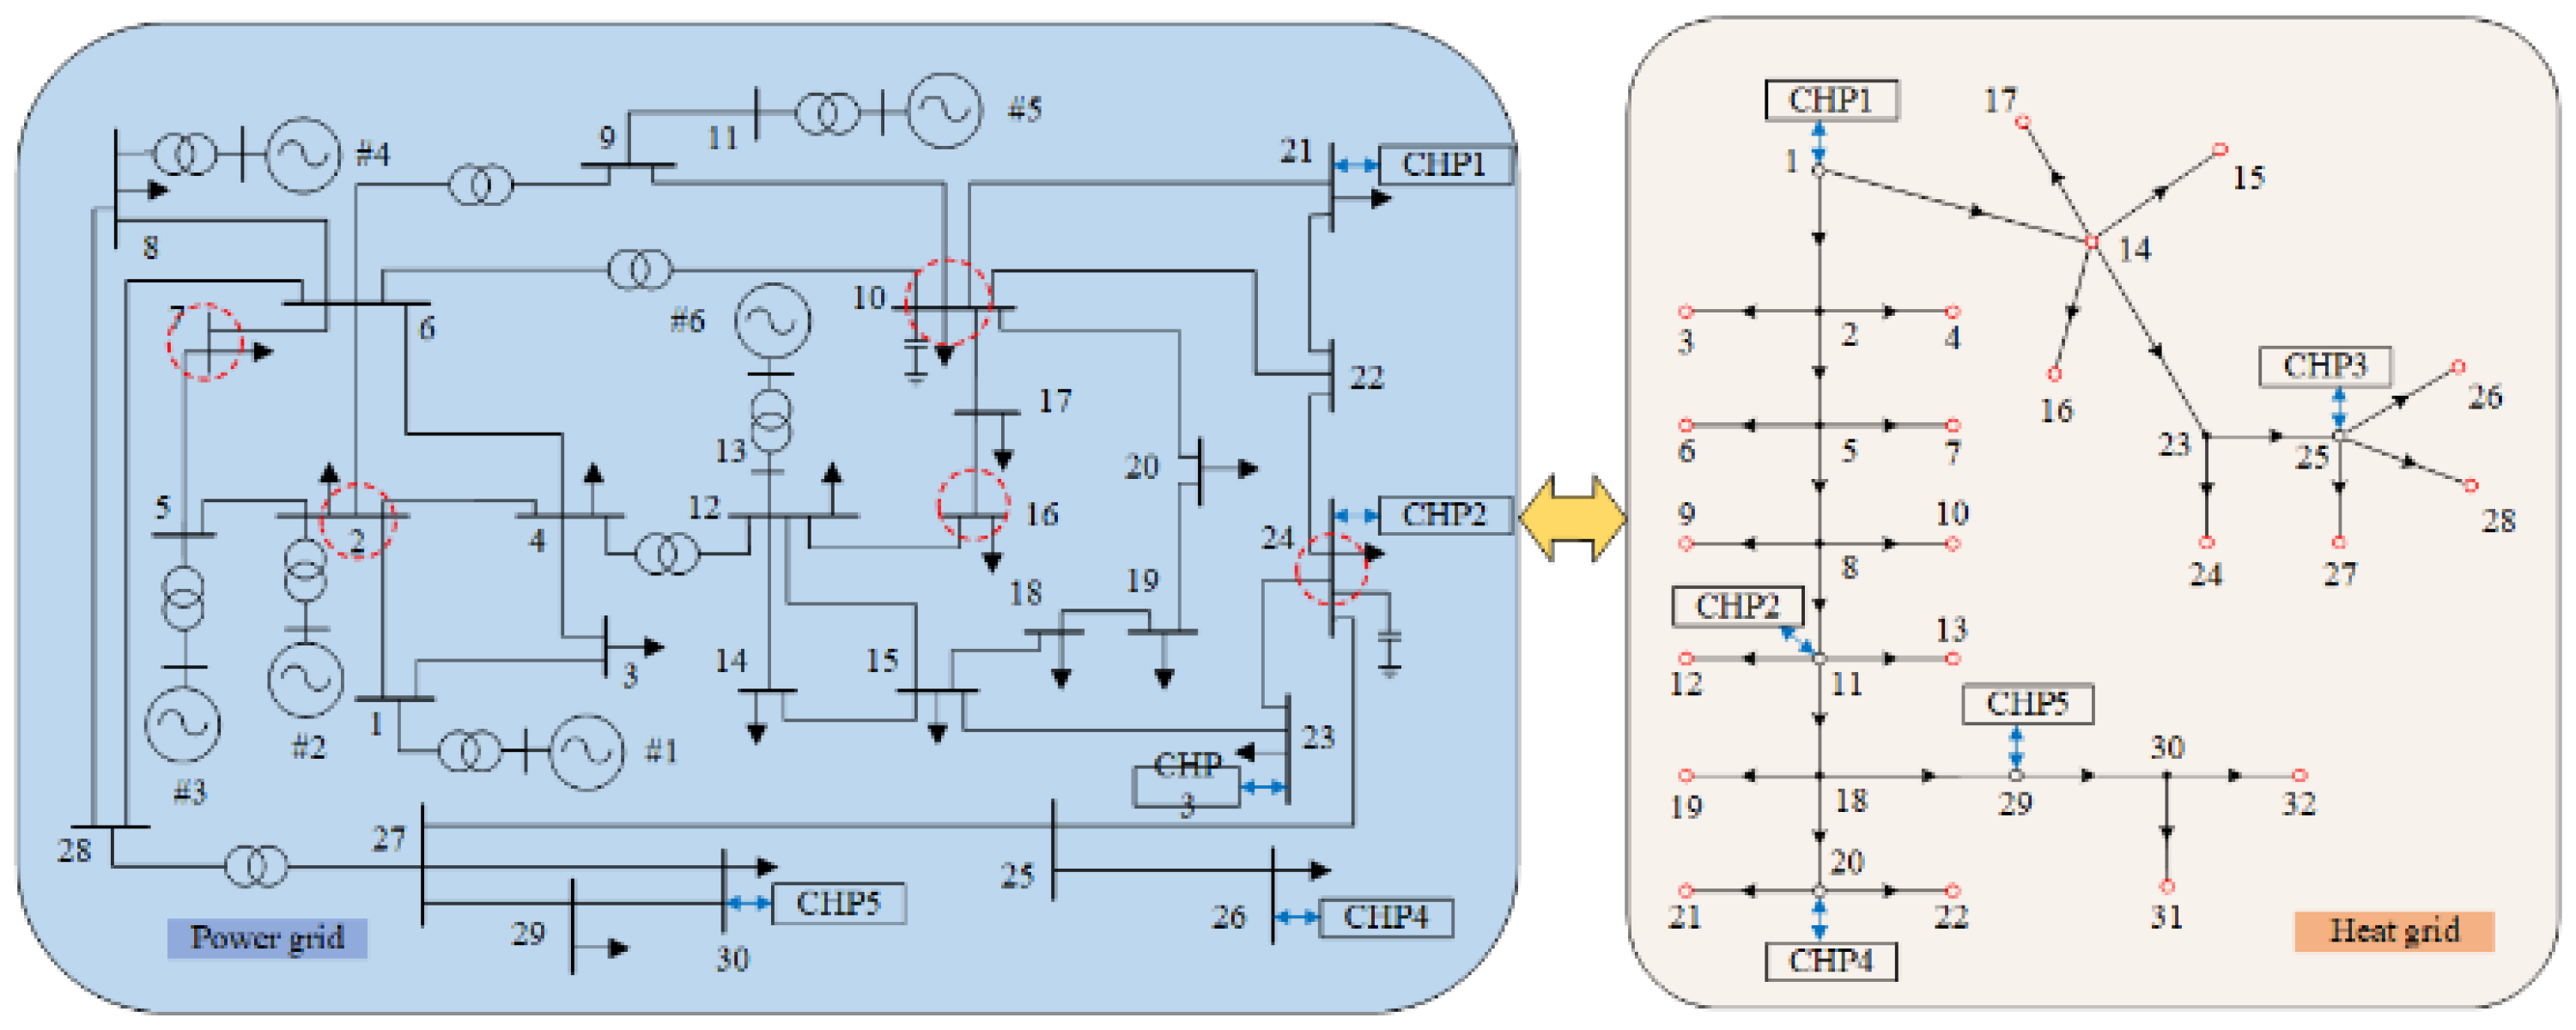
To verify the effectiveness of the method proposed in this paper, algorithm simulations were conducted on a combined heat and power system consisting of an IEEE 30-bus system and a 32-node heating network. The model was constructed on the MATLAB (MATLAB R2023b) tool platform, and the system structure is shown in Figure 3.
Figure 3.
Structure of combined heating and power system.
The power system contains 30 nodes, 6 generating units, and 40 branch circuits. A total of 6 units are connected to nodes 1, 2, 4, 5, 11, and 13, and the wind turbine generator system is connected to five nodes: 2, 7, 10, 16, and 24. The rated power of each wind turbine generator system is 2MW; the rated wind speed is 12.5 m/s, with a cut-in wind speed of 4 m/s and cut-out wind speed of 20 m/s. The number of wind turbines at each node and the parameters of the Weibull distribution are shown in Table 2. Considering the volatility of the load side, the loads on the five nodes of 3, 7, 17, 21, and 24 are selected for randomization in the calculation example, and the specific parameters are shown in Table 3. The power system and the heating system are coupled together through five combined heating and power systems, and to simplify the calculation, it is stipulated that the heat load of the system is constant; the active power output from the combined heating and power system is also constant.
Table 2.
Number of wind turbines and Weibull distribution parameters.
Table 3.
Parameters of random loads.
In the first stage of the multi-objective optimization problem, due to the existence of constraints on fuel cost and carbon emission, these two functions are used as the optimization objective, and the wind power penetration rate is used as the evaluation index in the second stage to decide on the final operation solution. In this case, the parameters of generator fuel cost as well as carbon emissions are shown in Table 4.
Table 4.
Parameters of random loads.
5.2. Analysis of Results
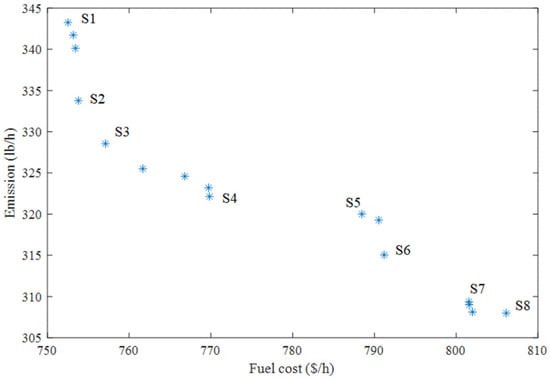
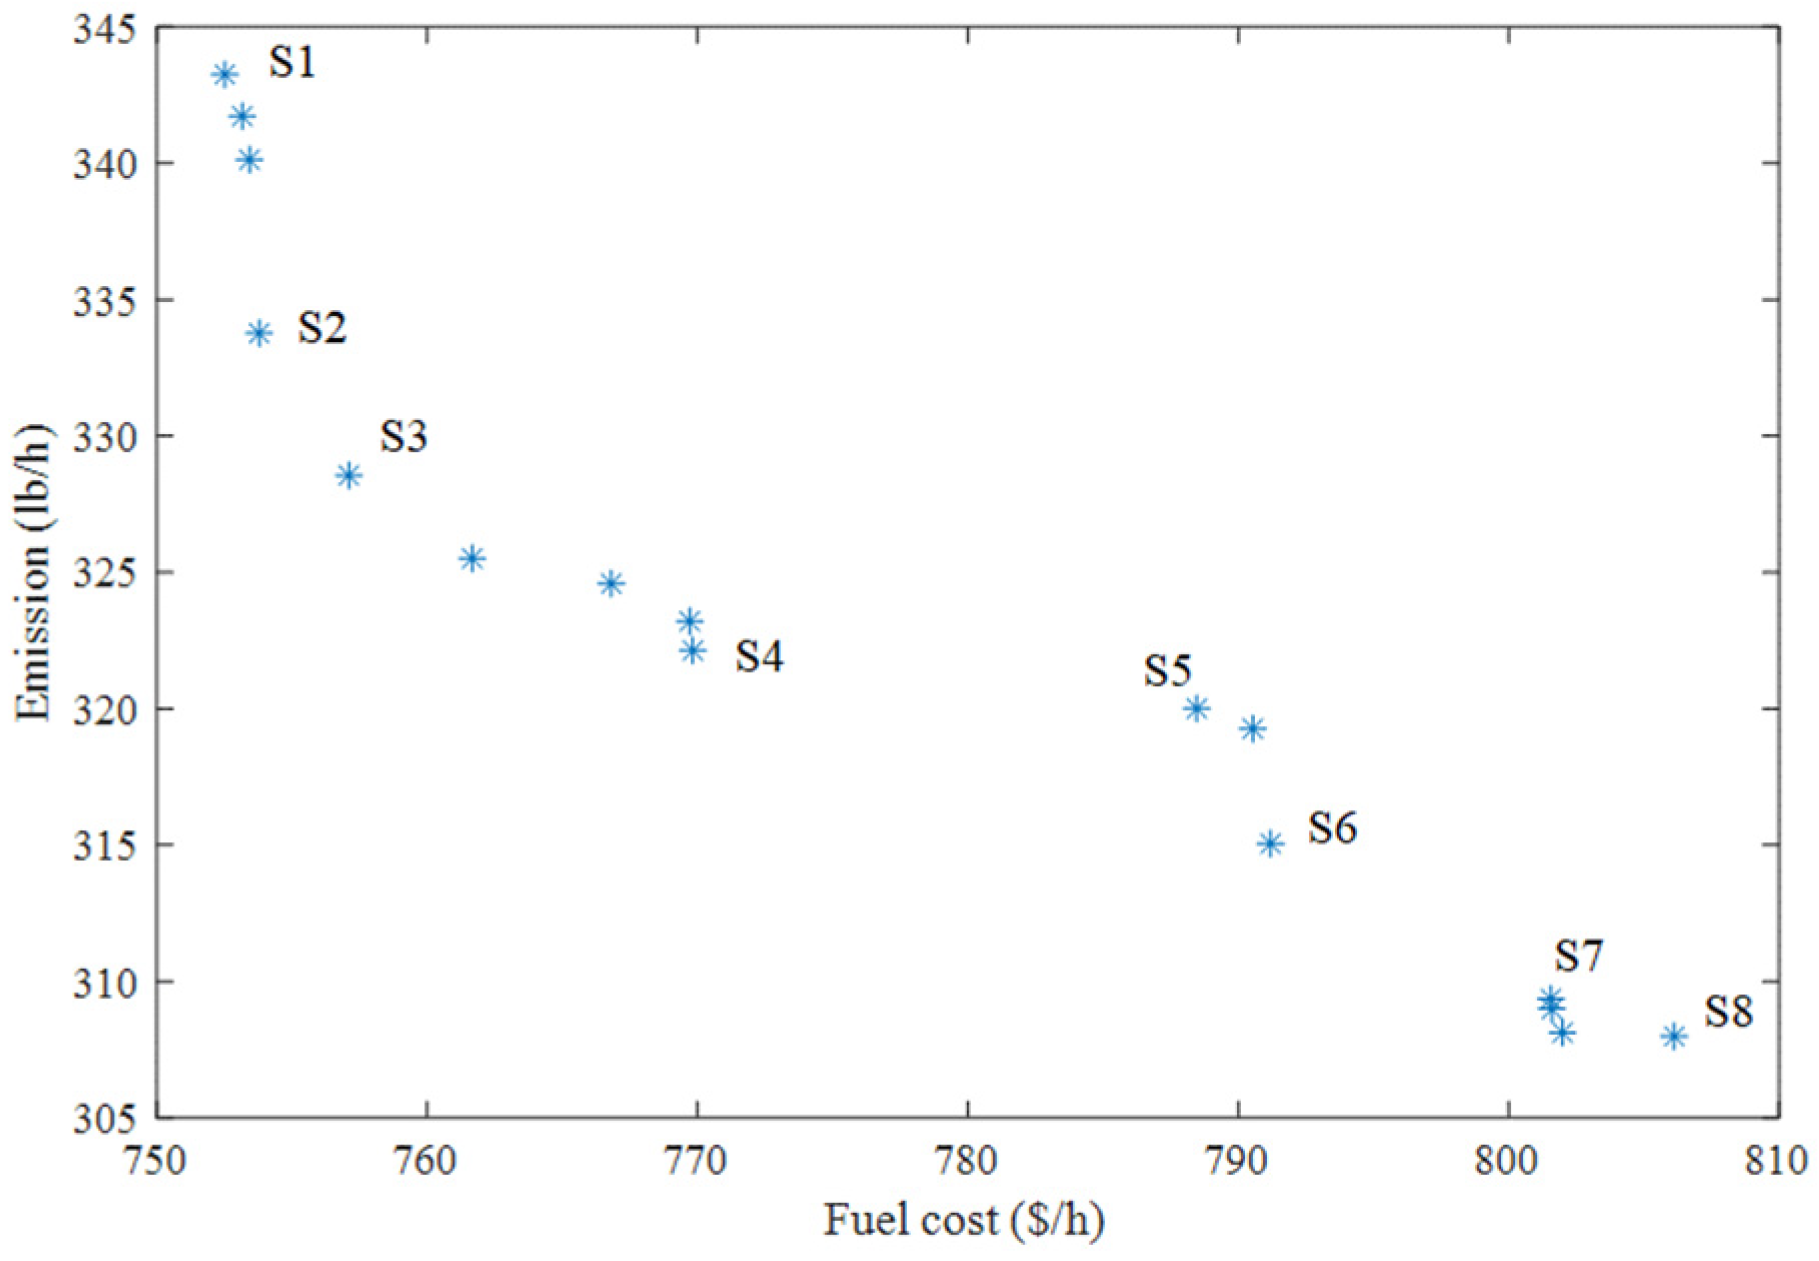
The Pareto boundary obtained from multi-objective optimization solutions using the enhanced African vulture optimization algorithm is shown in Figure 4.
Figure 4.
Optimized Pareto boundary solution.
From this figure, it can be seen that as fuel cost decreases, carbon emissions increase accordingly, and there is a constrained relationship between the two. Among them, S1~S8 are eight candidate scenarios selected as the system operation strategy, and the corresponding system configurations for these eight scenarios are shown in Table 5.
Table 5.
System configuration corresponding to scenarios.
In the real-time phase, assuming that the wind speeds in the area where the fan is located are 10.3 m/s, 7.5 m/s, 8.6 m/s, 3.7 m/s, and 9.5 m/s, the target values corresponding to the eight system candidate solutions are shown in Table 6. In order to select the final running plan among the eight candidate solutions, it is necessary to use evidential reasoning to comprehensively evaluate each candidate solution. Considering that investors place greater emphasis on the economic benefits of system operation, the weight coefficients for fuel cost, carbon emission, and wind power penetration rate are set to 0.5, 0.4, and 0.1, respectively. In addition, six evaluation levels were set for the system, namely “very poor”, “poor”, “general “, “good”, “very good”, and “uncertain”. In order to avoid losing generality, each indicator corresponding to uncertainty was set to 0.1, and the confidence evaluation of each solution’s evaluation level in different evaluation indicators is shown in Table 7.
Table 6.
Target values corresponding to candidate solutions.
Table 7.
Attribute evaluation of candidate solutions.
In order to obtain a comprehensive evaluation of each candidate project in terms of evaluation indicators, it is necessary to use evidential reasoning for information fusion. The comprehensive evaluation results obtained are shown in Table 8.
Table 8.
The confidence level of the candidate scenario.
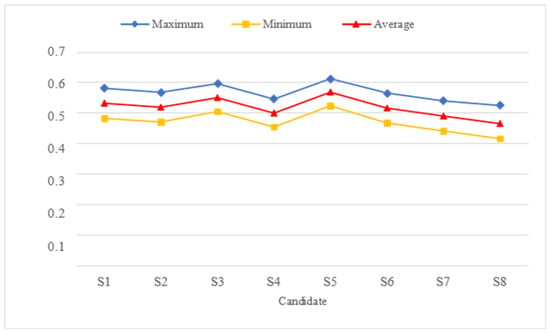
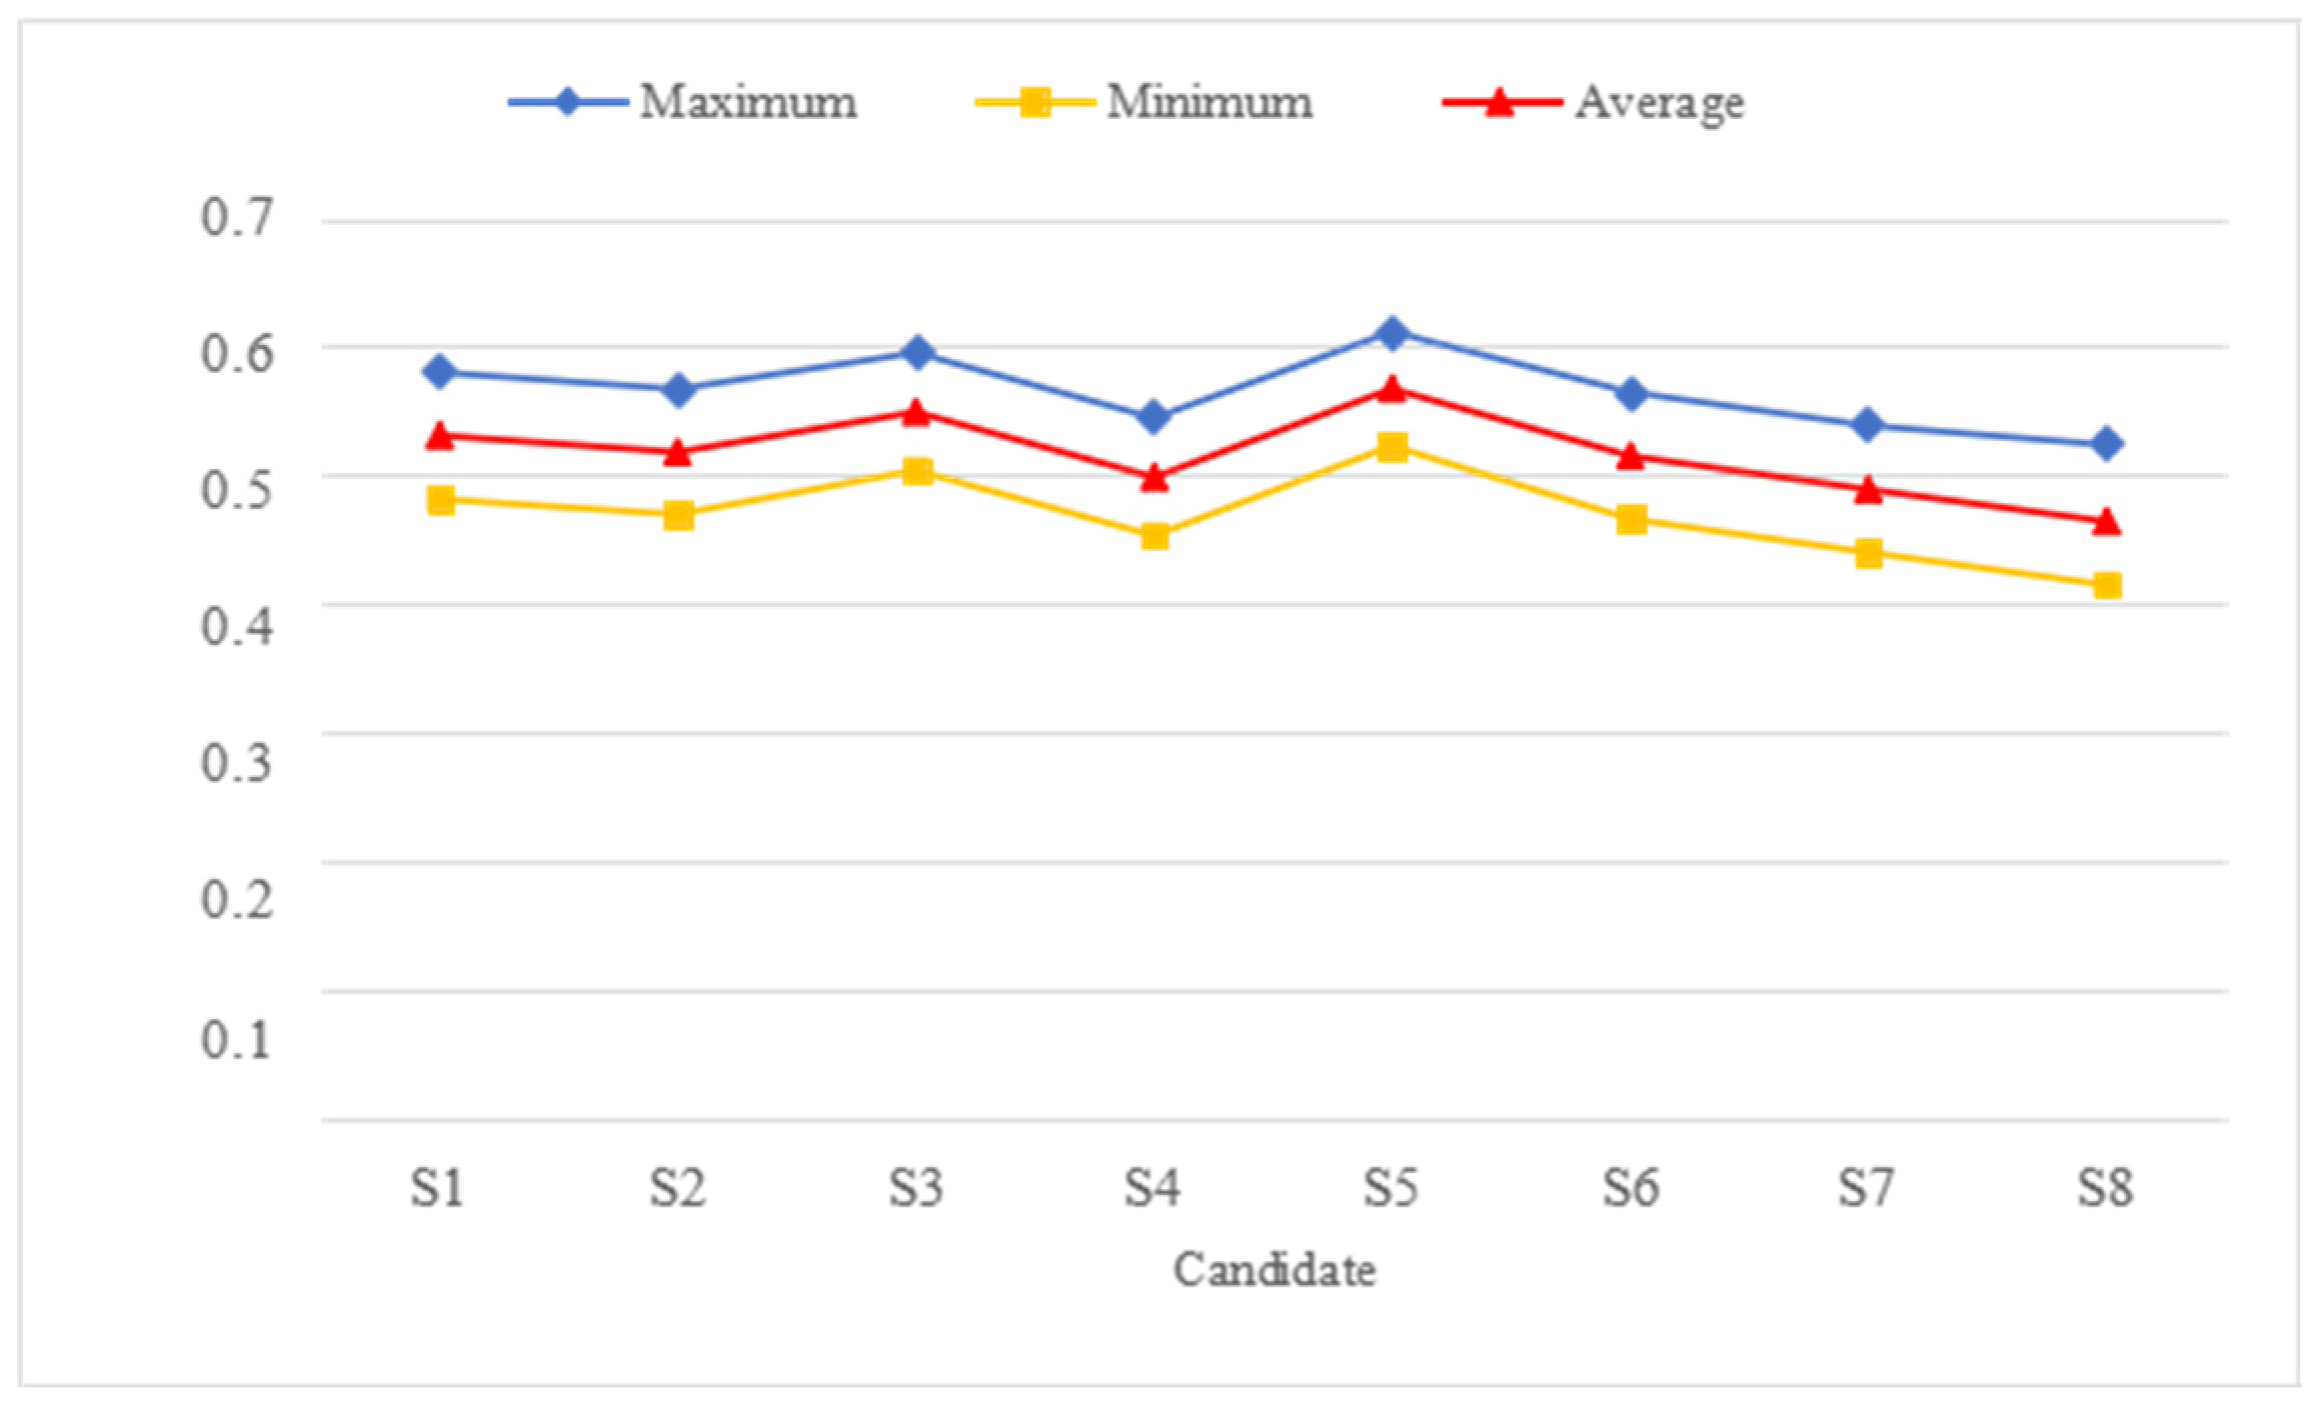
The table still does not intuitively reflect the advantages and disadvantages of each candidate solution. Therefore, we need to use utility analysis methods to find the maximum and minimum utility values of each solution in order to find the average utility value. The higher the evaluation level, the higher the corresponding utility value. In this example, the utility values corresponding to the five evaluation levels, except for “uncertain”, are 0, 0.25, 0.5, 0.75, and 1. The utility values of all solutions are shown in Table 9 and Figure 5 presents the optimal operating strategy for the system.
Table 9.
Scenario utility value.
Figure 5.
Line graph of utility value of the solutions.
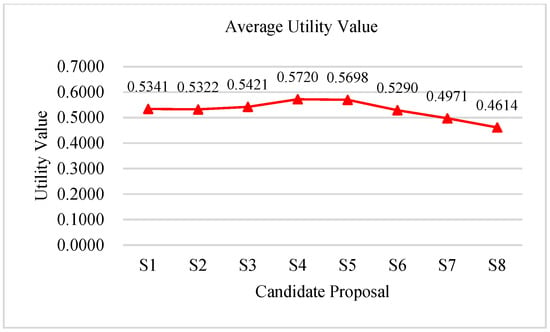
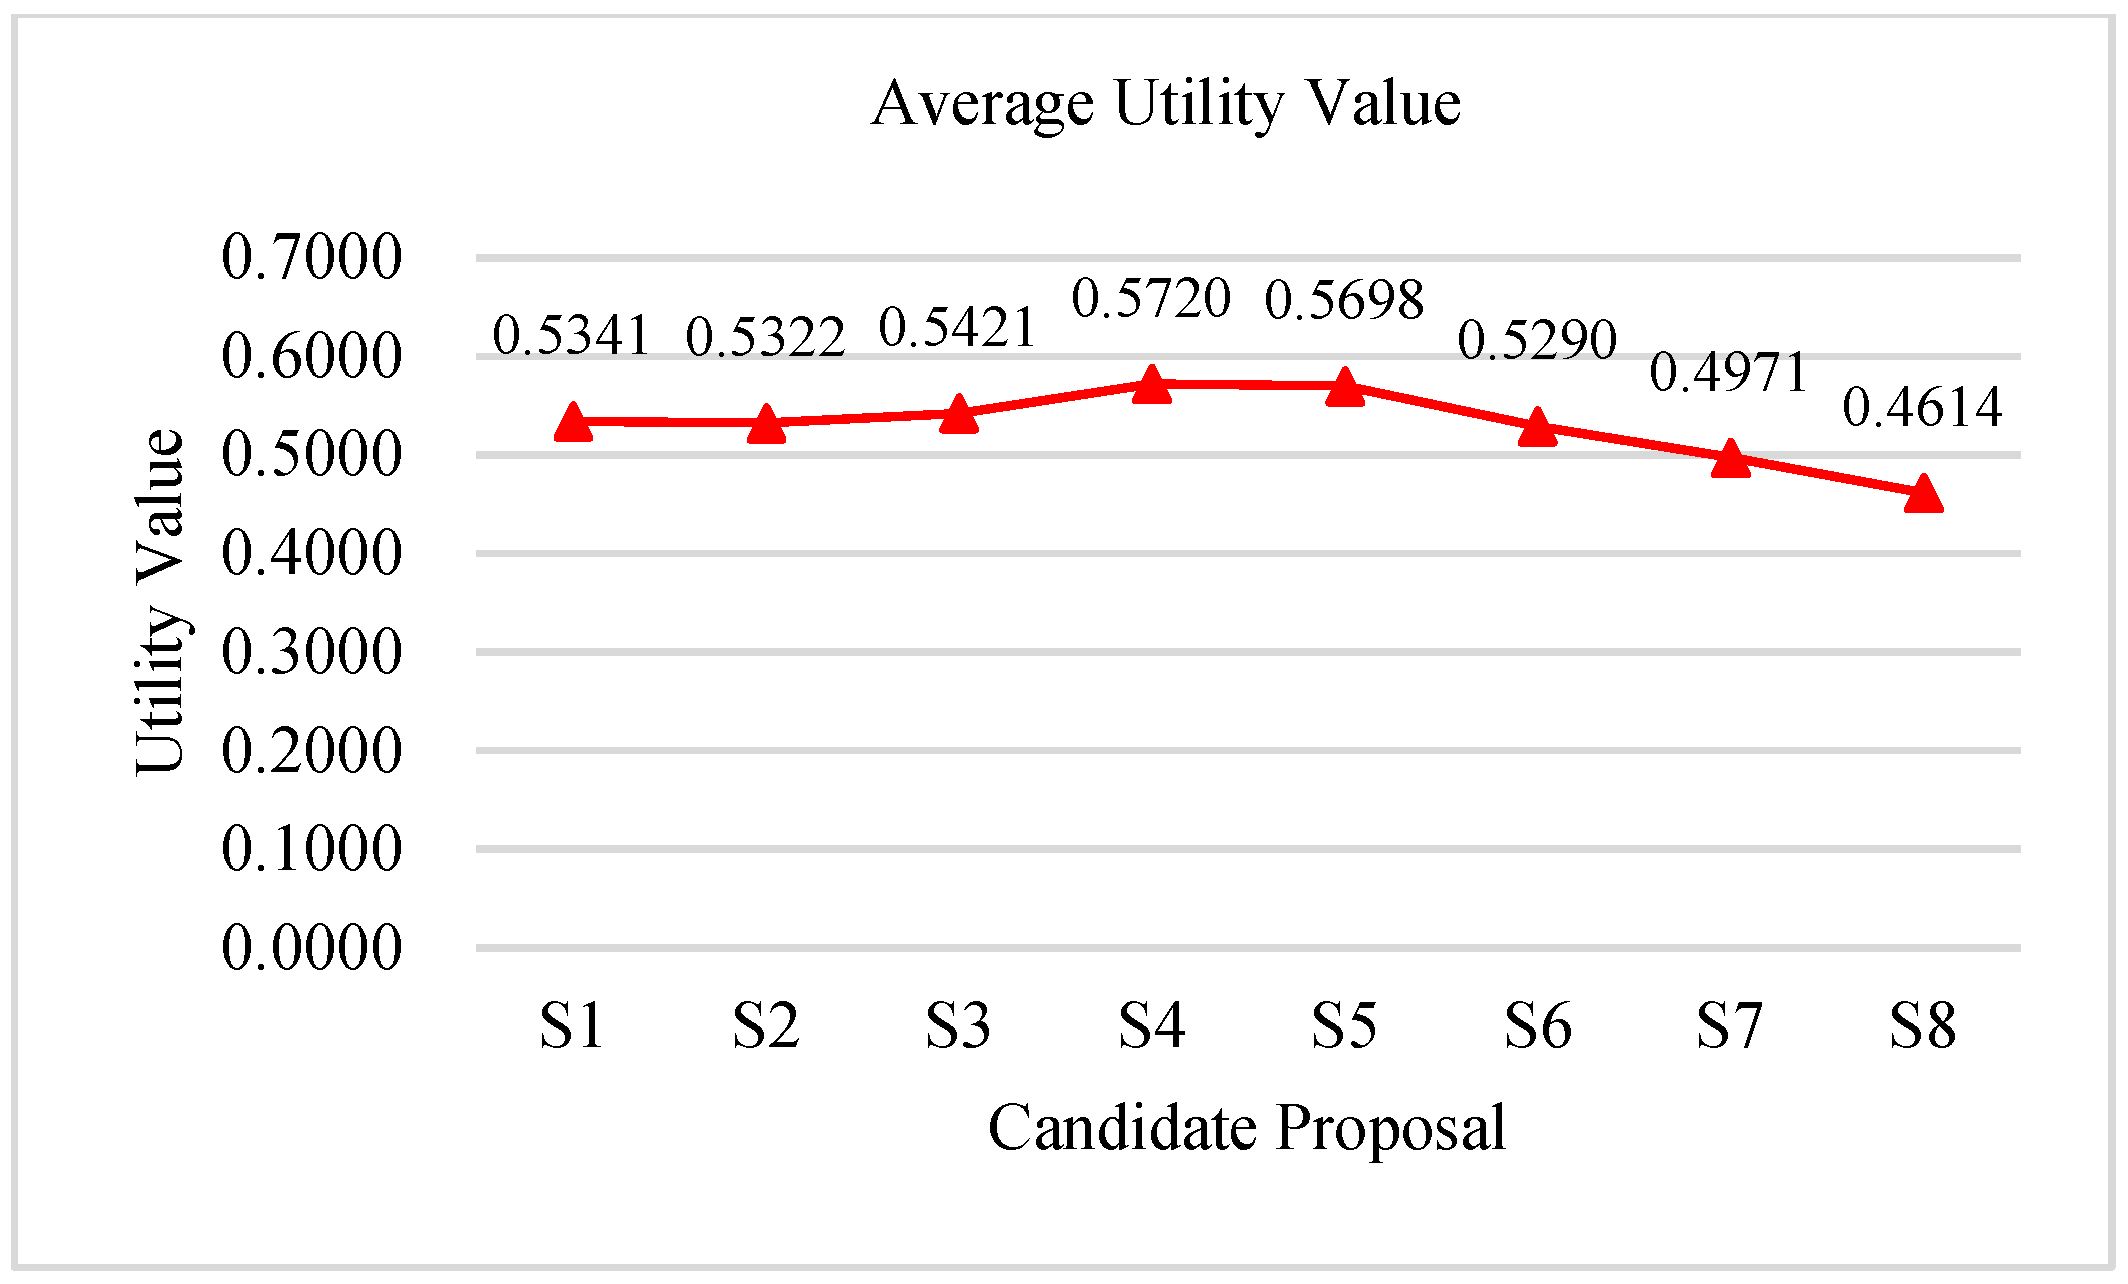
When the real-time wind speed changes, that is, the wind speed in the area where each fan is located changes to 9.1 m/s, 4.4 m/s, 6.3 m/s, 5.2 m/s, and 11 m/s, the corresponding utility values for each scenario will also change. The average utility value is shown in Figure 6.
Figure 6.
Average utility value after wind speed change.
From Figure 6, it can be seen that S4 has the highest average utility value, and S4 is chosen as the final operating strategy for the system. When the wind speed changes, the operation plan of the system changes accordingly, indicating that this optimization method can adjust the unit output according to real-time wind speed, which verifies the feasibility and effectiveness of the research method in this paper.
6. Conclusions
Currently, the global promotion of integrated energy systems (IES) is in full swing, yet the stable operation of such systems is severely challenged by the inherent randomness and volatility of renewable energy generation and user-side load consumption. This study proposes a two-stage optimization approach to mitigate the adverse effects of these uncertainties, thereby ensuring the IES operates in an economical, environmentally sustainable, and efficient manner.
Numerical results demonstrate that the proposed optimization framework effectively weakens the impact of uncertainties through the rational determination of probability density distributions for wind power output and load fluctuations. By combining the enhanced African vulture optimization algorithm (EAVOA) and evidential reasoning, the study efficiently obtains multiple candidate solutions and identifies the optimal operational scheme with intuitive and reliable results. These findings not only provide clear decision-making support for practitioners but also verify the superior comprehensive performance of the proposed method in IES operation optimization. In summary, the research outcomes offer valuable insights for improving the stability and operational quality of integrated energy systems amid uncertain operating conditions.
Author Contributions
Conceptualization, Q.S.; methodology, C.Z.; software, C.Z.; formal analysis, Q.S. All authors have read and agreed to the published version of the manuscript.
Funding
This work was supported in part by the Science and Technology Research Project of Henan Province, China (Grant No. 252102211073); the Research and Practice Project on Higher Education Teaching Reform of Henan Province, China (Grant No. 2024SJGLX0557); the College Youth Backbone Teacher Fund of Henan Province, China (Grant No. 2023GGJS182); the College Model Course and Teaching Team of Henan Province, China (Grant No. Jiao-Gao [2023] 431); the Special Research Project on Smart Teaching in Undergraduate Universities of Henan Province, China (Grant No. Jiao-Gao [2023] 334); the Open Project of Henan Key Laboratory of Cable Advanced Materials and Intelligent Manufacturing, China (Grant No. CAMIM202505); the Education informatization research project of Jiangsu Province, China (Grant No. 2021JSETKT062); the Natural Science Foundation of the Higher Education Institutions of Jiangsu Province, China (Grant No. 22KJB510026); the Major Project of Philosophy and Social Sciences Research in Jiangsu Universities (Grant No. 2024SJZD125); and Jiangsu Province’s Education Science “14th Five Year Plan” 2024 Annual Project (B b/2024/01/127).
Data Availability Statement
The original contributions presented in this study are included in the article. Further inquiries can be directed to the corresponding author.
Acknowledgments
The authors have reviewed and edited the output and take full responsibility for the content of this publication.
Conflicts of Interest
The authors declare no conflicts of interest. The funders had no role in the design of this study; in the collection, analyses, or interpretation of data; in the writing of the manuscript; or in the decision to publish the results.
References
- Liu, N.; Tan, L.; Sun, H.; Zhou, Z.; Guo, B. Bilevel heat-electricity energy sharing for integrated energy systems with energy hubs and prosumers. IEEE Trans. Ind. Inform. 2022, 15, 3754–3765. [Google Scholar] [CrossRef] [Scilit]
- Xia, M.; Zhou, Q.; Sykulski, J.; Yang, S.; Ma, Y. A multi-objective topology optimization methodology based on pareto optimal min-cut. IEEE Trans. Magn. 2020, 56, 7510505. [Google Scholar] [CrossRef] [Scilit]
- Shan, X.; Zhang, X.; Tse, C.K. Identifying sets of critical components that affect the resilience of power networks. IEEE Trans. Circuits Syst. II Express Briefs 2022, 69, 4859–4863. [Google Scholar] [CrossRef] [Scilit]
- Fahdzyana, C.A.; Salazar, M.; Donkers, M.C.F.; Hofman, T. Decomposition-based integrated optimal electric powertrain design. IEEE Trans. Veh. Technol. 2022, 71, 6044–6058. [Google Scholar] [CrossRef] [Scilit]
- Li, W.; Yao, X.; Zhang, T.; Wang, R.; Wang, L. Hierarchy ranking method for multimodal multiobjective optimization with local Pareto fronts. IEEE Trans. Evol. Comput. 2023, 27, 98–110. [Google Scholar] [CrossRef] [Scilit]
- Tanabe, R.; Ishibuchi, H. A framework to handle multimodal multiobjective optimization in decomposition-based evolutionary algorithms. IEEE Trans. Evol. Comput. 2020, 24, 720–734. [Google Scholar] [CrossRef] [Scilit]
- Herrera-Viedma, E.; Palomares, I.; Li, C.; Cabrerizo, F.J.; Dong, Y.; Chiclana, F. Revisiting fuzzy and linguistic decision making: Scenarios and challenges for making wiser decisions in a better way. IEEE Trans. Syst. Man Cybern. Syst. 2021, 51, 191–208. [Google Scholar] [CrossRef] [Scilit]
- Dy, B.; Ibrahim, N.; Poorthuis, A.; Joyce, S. Improving visualization design for effective multi-Objective decision making. IEEE Trans. Vis. Comput. Graph. 2022, 28, 3405–3416. [Google Scholar] [CrossRef] [Scilit]
- Yu, A.; Li, Z.; Liu, P. Rural integrated energy system based on bibliometric analysis: A review of recent progress. Processes 2024, 12, 176. [Google Scholar] [CrossRef] [Scilit]
- Jiang, W.; Qi, R.; Xu, S.; Hashimoto, S. Real-time simulation system for small scale regional integrated energy systems. Energies 2024, 17, 3211. [Google Scholar] [CrossRef] [Scilit]
- Chen, H.; Wang, S.; Yu, Y.; Guo, Y.; Jin, L.; Jia, X.; Liu, K.; Zhang, X. Low-carbon operation strategy of park-level integrated energy system with firefly algorithm. Appl. Sci. 2024, 14, 5433. [Google Scholar] [CrossRef] [Scilit]
- Wang, L.; Hou, C.; Ye, B.; Wang, X.; Yin, C.; Cong, H. Optimal operation analysis of integrated community energy system considering the uncertainty of demand response. IEEE Trans. Power Syst. 2021, 36, 3681–3691. [Google Scholar] [CrossRef] [Scilit]
- Yuan, Z.; Li, P.; Li, Z.; Xia, J. Data-driven risk-adjusted robust energy management for microgrids integrating demand response aggregator and renewable energies. IEEE Trans. Smart Grid 2023, 14, 365–377. [Google Scholar] [CrossRef] [Scilit]
- Kim, H.J.; Sioshansi, R.; Conejo, A.J. Benefits of stochastic optimization for scheduling energy storage in wholesale electricity markets. J. Mod. Power Syst. Clean Energy 2021, 9, 181–189. [Google Scholar] [CrossRef] [Scilit]
- Zhao, Z.; Guo, J.; Guo, X.; Lai, C.S.; Yang, P.; Lai, L.L. Distributed robust model predictive control-based energy management strategy for islanded multi-microgrids considering uncertainty. IEEE Trans. Smart Grid 2022, 13, 2107–2120. [Google Scholar] [CrossRef] [Scilit]
- Omri, M.; Jooshaki, M.; Abbaspour, A.; Fotuhi-Firuzabad, M. Modeling Microgrids for Analytical Distribution System Reliability Evaluation. IEEE Trans. Power Syst. 2024, 39, 6319–6331. [Google Scholar] [CrossRef] [Scilit]
- Abdollahzadeh, B.; Gharehchopogh, F.S.; Mirjalili, S. African vultures optimization algorithm: A new nature-inspired metaheuristic algorithm for global optimization problems. Comput. Ind. Eng. 2021, 158, 107408–107444. [Google Scholar] [CrossRef] [Scilit]
- Wang, T.; Li, Q.; Qiu, Y.; Chen, W.; Breaz, E.; Ravey, A. Power Optimization Distribution Method for Fuel Cell System Cluster Comprehensively Considering System Economy. IEEE Trans. Ind. Electron. 2022, 69, 12898–12911. [Google Scholar] [CrossRef] [Scilit]

Disclaimer/Publisher’s Note: The statements, opinions and data contained in all publications are solely those of the individual author(s) and contributor(s) and not of MDPI and/or the editor(s). MDPI and/or the editor(s) disclaim responsibility for any injury to people or property resulting from any ideas, methods, instructions or products referred to in the content. |
© 2026 by the authors. Licensee MDPI, Basel, Switzerland. This article is an open access article distributed under the terms and conditions of the Creative Commons Attribution (CC BY) license.