


Abstract
Riverine navigation-oriented linear cultural and tourism corridors often face challenges such as the unidirectional diffusion of upstream–downstream risks, inconsistent spatiotemporal standards for monitoring data across multiple departments, and difficulties in tracing the logic underlying the assessment of composite disasters. Existing long-series forecasting networks and basic retrieval-enhanced generation frameworks are often ill-suited to the unique chain-like risk evolution patterns inherent in linear waterways. Taking the Pinglu Canal Cultural and Tourism Integration Belt as a case study, this paper proposes a knowledge-driven, multi-source data fusion intelligent early-warning system named KE-MFEWF. The paper introduces an MSTF-Net spatiotemporal feature extraction network incorporating asymmetric corridor attention mechanisms, which automatically adjusts feature weights based on the differing patterns of risk propagation along the upstream and downstream sections of the waterway; it also develops a large-scale model simulation module leveraging graph-based and multi-vector database collaborative retrieval techniques, and establishes a dynamic early-warning determination criterion by integrating two types of correction coefficients—those accounting for seasonal variations and holiday passenger flow. To compensate for the lack of long-term observational samples for the canal under construction, this study employs a combined dataset obtained from real-world measurements, numerical simulations, and cross-basin data migration; the model’s generalization performance was tested on the navigable tourism section of the Xijiang River. When compared with mainstream benchmark models—including Informer, TimesNet, and single-channel RAG—the proposed method achieves an improvement of 6.8% in the AUC metric for comprehensive composite risk prediction; it can issue risk warnings up to 45 min in advance, while reducing the rates of false alarms and missed alerts by 7.2% and 6.5%, respectively; after undergoing INT lightweight compression, the model’s storage footprint is reduced by 65%, and the inference time for a single batch of time-series data on edge devices is less than 0.3 s, making it suitable for real-time on-site deployment. The comprehensive algorithmic framework proposed in this paper can serve as a reusable technical solution for the digital security management and control of similar inland waterway linear cultural tourism corridors in China.
1. Introduction
1.1. Research Background and Problem Statement
1.1.1. The Background of the Integrated Development of Inland Waterway Transport and Comprehensive Tourism
Leveraging the strategic deployment of the New Western Land–Sea Trade Corridor, the functional role of traditional inland waterways is undergoing a profound transformation—gradually moving beyond their previous singular focus on freight transport to evolve into integrated waterfront economic corridors that combine logistics navigation, ecological conservation, waterfront leisure activities, and cultural and tourism experiences. Within this evolving context, the development and utilization of cultural and tourism resources along inland waterways, alongside the implementation of routine safety management measures, have become crucial research topics for supporting the strategic positioning upgrade and high-quality development of the southwestern coastal regions [1]. As one of the few national-level strategic canal projects in China, the Pinglu Canal has possessed significant regional hub value since its inception. Spanning 134.2 km, this waterway was constructed in accordance with China’s National Class I Inland Waterway Navigation Standards and is capable of accommodating vessels up to 5000 tons; it serves as a vital water transport corridor linking the inland water system of the Xijiang River with the coastal ports of the Beibu Gulf, holding milestone significance for enhancing the comprehensive shipping network in southwestern China [2,3]. As the project progresses, various cultural and tourism resources along the canal—such as waterfront landscape belts, riverside sightseeing nodes, and ecological leisure zones—have been systematically revitalized, ultimately giving rise to a new paradigm for integrated tourism development characterized by an axial extension and linear distribution along the waterway axis. Compared to clustered tourism spaces—such as urban comprehensive scenic areas or enclosed mountain resorts—the resource allocation, visitor activity patterns, and evolution of safety risks along this linear canal-based cultural and tourism corridor all exhibit distinct axial continuity and chain-like transmission characteristics. For this reason, the traditional extensive safety governance model—characterized by segmented management of tourist attractions and independent departmental oversight—struggles to align with the new, integrated cultural and tourism operation system that emphasizes coordinated, region-wide development along the canal network, and finds it difficult to effectively address the complex safety management requirements inherent in linear corridor scenarios [4].
1.1.2. Practical Challenges in Cultural and Tourism Safety Management for the Pinglu Canal
The Pinglu Canal traverses the mountainous and hilly terrain as well as the interlaced river valleys of Guangxi Province, featuring significant topographic elevation changes and frequent local meteorological fluctuations [5]. Along its course, four types of risk factors—simultaneous navigation operations, meteorological disasters, concentrated tourist flows, and ecological disturbances—interact and overlap; these various hazards compound and evolve in a synergistic manner, directly increasing the safety management pressure across the entire corridor [6]. From the perspective of tourist activity patterns, the fluctuations in visitor numbers along this linear cultural and tourism belt are particularly pronounced. During statutory holidays and weekend leisure periods, the number of tourists along the route can increase by 2.8 to 4.1 times compared to normal daily levels; furthermore, since tourist travel routes generally follow the course of the river, the flow of visitors is concentrated around the narrow waterway, making it highly susceptible to the emergence of clustered risk scenarios in certain local sections. However, an examination of the current operational status of the comprehensive regional monitoring system reveals several shortcomings associated with the approach of deploying sensing equipment by different departments independently. The transportation, meteorological, cultural and tourism, and ecological authorities have each established their own monitoring systems; the sampling intervals, spatial sampling accuracy, and data time baselines are inconsistent, and the various monitoring datasets remain fragmented, leading to the long-term formation of data silos [7]. Additionally, in some remote sections of the canal, communication signals are weak, making it difficult to achieve comprehensive monitoring without blind spots; meanwhile, current general early-warning mechanisms mostly rely on fixed decision criteria tailored to single types of disasters, which are entirely inadequate for adapting to the evolving characteristics of multiple risks interacting within an intertwined land-and water-based environment [8].
1.1.3. Challenges in Adapting Traditional Monitoring Technologies to Linear Corridor Scenarios
An examination of current research on tourism safety early-warning systems reveals that the design approach of the vast majority of algorithmic models is centered on spatial scenarios such as urban districts and closed-loop, block-based tourist attractions [9]. When constructing spatial features, these methods typically employ symmetric convolutional receptive fields, which inherently overlook the objective pattern of unidirectional risk propagation resulting from water currents and vessel traffic along waterways; as a consequence, the extracted spatial features contain substantial invalid and redundant information, leading to significant deviations in risk level assessment outcomes [10]. From the perspective of time-series forecasting, traditional ARIMA statistical models and classical LSTM neural networks struggle to capture the sudden, nonlinear fluctuations induced by surges in tourist numbers during holidays; when confronted with pulsed changes in tourist flow, the forecasting errors tend to amplify significantly [11]. Similarly, general-purpose large language models also exhibit notable limitations: due to insufficient specialized corpus resources for niche sectors such as inland waterway shipping and waterfront cultural tourism, these models are prone to generating erroneous conclusions that contradict industry common sense when simulating coupled risks across multiple disaster types; even when integrated with a basic single-channel retrieval enhancement framework, they can only perform text matching based on vector similarity and lack the capability to derive structured relationships among risk factors. Consequently, the entire early-warning process is difficult to trace and lacks strong interpretability [12,13]. Overall, the combined effect of multiple technical shortcomings—spanning spatial modeling, time-series fitting, and domain-specific knowledge reasoning—directly constrains the practical effectiveness of intelligent early-warning solutions when deployed in linear canal-based cultural tourism scenarios.
1.2. Research Objectives and Scientific Questions
1.2.1. Core Scientific Issues
Building upon the unique spatial characteristics of the Pinglu Canal Linear Cultural and Tourism Corridor and the practical limitations identified earlier—where existing technologies prove inadequate—this study identifies three core scientific challenges that require urgent resolution. First, given the asymmetric risk propagation pattern along the narrow, elongated waterway’s upstream and downstream sections, how can a standardized spatiotemporal representation framework be developed to achieve spatiotemporal unified calibration of monitoring data from diverse sources, while simultaneously quantifying the evolutionary patterns of risk diffusion along the river’s unidirectional chain? Second, as information pertaining to shipping, meteorology, cultural and tourism activities, and the ecological environment is intricately interwoven, how can domain-specific expertise from these various sectors be integrated into the model’s inference pipeline to design a comprehensive composite risk assessment and dynamic tiered early-warning mechanism capable of accommodating sudden surges in passenger flow during holidays? Finally, a mature early-warning framework should not solely focus on predictive accuracy but must also balance computational speed with the adaptability of the system across different river segments; how can a complete end-to-end technical workflow—spanning “data collection and monitoring—risk analysis—tiered early warning—effectiveness validation” —be established, while ensuring that the model can be effectively transferred and applied to other similar linear riverine scenarios?
1.2.2. Hierarchical Research Objectives
To address the three core scientific questions raised above in a sequential manner, this study establishes a progressive research agenda that spans from fundamental methodologies to practical applications. From an algorithmic theory perspective, we develop a multi-scale spatiotemporal fusion network tailored for linear waterway scenarios, complemented by a large-scale model inference architecture integrated with industry-specific knowledge bases—thereby mitigating the limited adaptability of general-purpose spatial and temporal models when applied to linear corridor environments. From a data support perspective, for newly constructed large-scale linear water transport projects that lack long-term monitoring data, we propose a design framework for building a hybrid dataset based on “field data collection combined with numerical simulation of cross-basin migration,” supported by a comprehensive data fidelity verification process to alleviate the practical challenge of scarce monitoring samples during the project construction phase. From a practical implementation standpoint, using the entire Pinglu Canal as a case study, we conduct a comprehensive regional risk early-warning simulation test; subsequently, we select the Xijiang River section—where hydrological conditions and cultural/tourism development patterns are similar—to perform a cross-regional generalization test. This approach ultimately yields a replicable and scalable technical framework for early-warning systems aimed at ensuring safety in inland waterway waterfront tourism.
1.3. Research Contributions and Innovations
1.3.1. Methodological Innovation
The first core innovation lies in the design of customized spatial algorithms tailored for linear waterways. Existing approaches—such as axial attention mechanisms and symmetric convolutional methods—assign equal weights to the upstream and downstream segments of a waterway, which does not align with the unidirectional propagation pattern of risk. This paper proposes an asymmetric attention module specifically designed for corridor-based scenarios; by imposing differentiated receptive field constraints on the upstream and downstream sections of the waterway, this module accurately captures the unidirectional chain-like diffusion behavior of risk along the water current and waterway, filters out irrelevant redundant spatial features in the vertical direction of the waterway, and effectively reduces the computational cost of the model. The second innovation focuses on the deep integration of domain-specific expertise with early-warning models. Traditional retrieval-augmented generation (RAG) architectures rely solely on a single-vector database for text matching; in contrast, this paper establishes a cultural and tourism safety RAG framework that integrates logical reasoning based on knowledge graphs with multi-channel parallel retrieval. Additionally, dynamic early-warning thresholds are designed by incorporating two key variables—seasonal variations and holiday passenger flow—thereby addressing the limitation of fixed thresholds, which are ill-suited to accommodate sudden fluctuations in passenger flow. Furthermore, this study employs the SHAP feature attribution tool to decompose and analyze the model’s inference process, ensuring that early-warning outcomes and the underlying causes of risk are both traceable and interpretable [13,14].
1.3.2. Engineering Application-Level Innovation
Addressing the industry-wide challenge of insufficient historical monitoring data in newly constructed large-scale linear water transport projects across China, this paper proposes a hybrid dataset construction approach alongside a corresponding data reliability assessment framework. This solution comprehensively employs three methodologies—field measurement-based calibration, numerical simulation-based extrapolation, and data migration from analogous river basins—to expand the sample size. Additionally, the complete algorithm undergoes an INT8 quantization-based lightweighting transformation, and a cloud-edge collaborative deployment model is designed, integrating high-precision cloud-based simulation with real-time early-warning capabilities at edge terminals. This approach reduces on-site inference time while maintaining prediction accuracy, thereby providing a practical engineering implementation plan for intelligent safety management and control systems for similar linear inland waterway cultural and tourism corridors in China [15].
1.4. Article Section Overall Layout
The entire paper is structured into seven chapters, forming a comprehensive research framework that spans from background review and methodology development to experimental validation and concluding outlooks. Section 1 introduces the historical context of this research, identifies its core research questions, and outlines the paper’s key innovative contributions. Section 2 systematically categorizes and reviews existing literature on multi-source data fusion, time-series risk prediction, and large-model retrieval-enhancement techniques, identifying current gaps and limitations in the field. Section 3 defines the research scope, identifies four categories of core risk factors, mathematically defines the early-warning task, and establishes and validates a hybrid dataset. Section 4 provides a step-by-step decomposition of the proposed KE-MFEWF early-warning framework, detailing the operational logic of each submodule, its core computational formulas, and the overall technical workflow. Section 5 designs multiple sets of comparative experiments, module ablation experiments, and cross-basin generalization experiments to quantitatively compare the performance of this method against state-of-the-art existing models across various performance metrics. Section 6 employs experimental data to conduct an in-depth analysis of the underlying mechanisms driving differences in model performance, conducts a horizontal comparison with similar studies, and objectively discusses the remaining limitations of this approach. Section 7 summarizes all the research findings presented in this paper and proposes potential directions for future research based on the identified gaps.
2. Relevant Research Progress, Domestically and Internationally
2.1. Research on Spatial Monitoring of Tourism Scenarios and Multi-Source Data Fusion
2.1.1. The Evolutionary Journey of Comprehensive Tourism Dynamic Monitoring Methods
Tracing the developmental trajectory of tourism safety monitoring over the years, the field can be broadly categorized into three distinct phases: manual on-site registration, deployment of single-point sensing devices, and multi-source big data fusion and analysis [16]. Early initiatives focused solely on digital statistics of tourist flows; today, however, the scope of monitoring has expanded to encompass a synergistic sensing system integrating multiple factors—such as meteorological conditions, ecological parameters, and waterborne transportation [7]. The traditional approach—relying solely on fixed-point equipment at tourist attractions combined with manual patrols—not only suffers from limited coverage but also faces significant challenges regarding delayed data updates, making it ill-suited to meet the management and control requirements of large-scale, integrated tourism operations today [17]. With the widespread adoption of the Internet of Things (IoT) and satellite remote sensing technologies, integrating multi-source data, including remote sensing imagery, ground-based sensors, social media reviews, and tourist check-in records, to enable dynamic tourism risk monitoring has become a mainstream research approach within the industry [11,18]. Nevertheless, a review of existing research findings reveals that the vast majority of multi-source fusion algorithms are designed for discrete urban areas or enclosed mountainous scenic spots, employing fixed-size grids for spatial discretization; these algorithms do not take into account the elongated, ribbon-like spatial structure characteristic of canal corridors along waterways, making it inherently difficult to accurately capture the continuous evolution patterns of risks along such waterways [19].
2.1.2. Existing Technical Limitations in Linear Corridor Space Monitoring
Although some joint-monitoring achievements have been made for linear spatial systems such as river basins and highway networks, the overall solutions still contain several non-negligible flaws [10,20]. Current linear-space modeling predominantly adopts symmetric convolution kernels, assigning completely equal computational weights to upstream and downstream spatial segments while entirely ignoring the unidirectional risk diffusion characteristics induced by water flow and vessel traffic. Consequently, notable deviations exist between model outputs and the evolutionary logic of real-world scenarios [21]. When applied to the context of cultural tourism integration, existing river-basin monitoring systems mostly develop early-warning logic merely for single hydrological disaster types. Core cultural tourism variables, including tourist flow and visiting behaviors, have long been missing from these systems, leaving them inadequate to support comprehensive risk assessment under multi-factor superposition [4]. Furthermore, research on spatiotemporal alignment for heterogeneous multi-device data across ultra-long corridors remains limited. Existing processing approaches rely only on simple matching via unified timestamps, without designing layered mapping rules tailored to the practical segmented deployment of monitoring stations. This can easily trigger problems including misalignment of diverse data baselines and distortion in feature fusion [22].
2.2. Current Research Status of Intelligent Tourism Risk Early-Warning Models
2.2.1. Comparison Between Traditional Statistical Models and Time-Series Deep Learning-Based Early-Warning Methods
Traditional statistical models, such as ARIMA, gray prediction, and support vector regression, are only suitable for time series with gradual trends and stable volatility. When faced with highly nonlinear perturbation scenarios, such as sudden surges in tourist numbers during public holidays or abrupt occurrences of extreme weather events, the prediction errors can amplify dramatically, making it difficult to accurately capture the fluctuating nature of tourism-related risks [11,23]. While classical deep learning architectures, such as LSTM and CNN-LSTM, can capture nonlinear correlations within sequences, their fixed spatial receptive field sizes prevent them from adaptively accommodating the varying intensity of risks across the gradient distribution along the upstream and downstream sections of a waterway [2]. State-of-the-art models introduced in recent years, such as Informer and TimesNet, focus on optimizing the efficiency of ultra-long-term sequence encoding to mitigate the issue of information loss over long-range dependencies; however, these networks were not specifically tailored during their architectural design to account for the asymmetric risk propagation along linear waterways. When applied directly to scenarios involving linear cultural and tourism corridors, their adaptability remains significantly limited [3,24].
2.2.2. Research Limitations of the Composite Risk Chain-Coupling Early Warning System
Currently, most research on multi-risk integration merely combines various feature vectors without systematically identifying the underlying correlation patterns governing the transmission and superposition of different disasters; as a result, it is difficult to reconstruct the complete evolutionary trajectory when multiple hazards coexist [25,26]. From the perspective of adapting to tourism scenarios, existing early-warning systems consistently employ a fixed decision-making threshold throughout the year, without accounting for specific tourism-related perturbations, such as peak tourist flow during holidays or seasonal climate variations, leading to frequent instances of missed alerts during peak travel periods or false alarms during off-peak seasons [27]. Furthermore, the vast majority of these models ultimately output only simple numerical risk levels without providing concurrent explanations regarding the contribution of various features or the risk formation pathways, making it challenging to provide actionable decision-making support for refined safety management and control at tourist attractions [28,29].
2.3. Current Application Status of Large Language Models and RAG Technology in the Emergency Response Field
2.3.1. Limitations of General Large Language Model Risk Scenario Analysis
Leveraging their powerful text understanding and content generation capabilities, large language models have been increasingly applied in domains such as disaster scenario simulation, emergency response plan generation, and risk-based Q&A systems, fundamentally transforming the traditional approach to risk prediction research [1]. However, the training data for general-purpose large language models primarily consists of content from broad, generic scenarios; there is a severe lack of specialized corpora for niche fields such as inland waterway shipping or waterfront tourism safety. As a result, when simulating complex risk scenarios, these models are prone to generating erroneous conclusions that contradict industry common sense—what is commonly known as the “model hallucination” problem [12]. Furthermore, general-purpose large language models lack a supporting, real-time-updated domain-specific knowledge base. For instance, canal hydrological dispatch rules and scenic area management policies are adjusted annually; however, the fixed training data cannot keep pace with these dynamic changes, which significantly undermines the accuracy of risk assessment and the model’s adaptability to specific scenarios [21].
2.3.2. RAG (Retrieval-Augmented Generation) Architecture—Addressing Limitations
By leveraging external knowledge bases to mitigate hallucination issues, retrieval-augmented generation (RAG) technology has become the mainstream approach for industry-specific intelligent reasoning [13]. However, most RAG architectures currently employed in the emergency response domain rely solely on a single-vector retrieval pathway, depending exclusively on text-based semantic similarity matching to retrieve relevant data; they are unable to leverage entity relationships to derive the evolutionary logic of risk chains, resulting in relatively low information utilization efficiency within the knowledge base [14]. The development of specialized knowledge bases for the cultural and tourism safety sector has lagged behind; there is a lack of integrated corpora spanning multiple domains, including shipping, meteorology, ecology, and cultural tourism. Furthermore, existing solutions have not achieved a deep integration of knowledge graph logical reasoning with vector-based semantic retrieval, making it difficult to trace the early-warning derivation process and ensure the accuracy of final assessment outcomes [30].
2.4. Summary of Existing Research Limitations
Based on a comprehensive review of the three categories of research outcomes—monitoring systems, time-series-based early-warning mechanisms, and large language model applications—the current research framework exhibits three significant gaps: At the scenario level, there is a lack of a dedicated, integrated monitoring and early-warning solution specifically tailored for inland waterway–land transport hybrid linear cultural and tourism corridors; existing algorithms are designed primarily for discrete, block-based tourist attractions and thus cannot adequately capture the asymmetric risk propagation characteristics inherent in linear spatial environments; at the methodological level, there is a scarcity of composite early-warning architectures that simultaneously integrate multi-scale spatiotemporal features with industry-specific knowledge-based logical reasoning; time-series networks demonstrate poor adaptability to linear scenarios; the existing RAG architecture lacks sufficient depth in knowledge integration; and early-warning thresholds have not been dynamically adjusted in response to the dynamic patterns of cultural and tourism visitor flows. At the application level, there is a severe lack of research on proactive early-warning systems for large-scale linear water transport projects still under construction, with no established methodologies for building datasets under limited sample conditions nor for conducting cross-basin generalization validation. This paper addresses these three gaps by developing an intelligent early-warning system tailored to the comprehensive cultural and tourism scenarios along the Pinglu Canal.
3. Research Area, Problem Definition, and Data Infrastructure
3.1. Pinglu Canal Study Area Overview
3.1.1. Geographical Location and Water Transport Functional Positioning
As a core water transport project of the New Western Land–Sea Corridor, the Pinglu Canal officially commenced construction in August 2022; full waterway operation is scheduled for completion by June 2026, with trial navigation operations expected to begin in September of the same year [12]. The northern terminus of the waterway is located at the Pingtang River Estuary in the Xijin Reservoir Area, Hengzhou City, Nanning, and it extends southward to Qinzhou Port in the Beibu Gulf; the total length of the canal is 134.2 km [31]. The entire route complies with the Class I inland waterway construction standards and is capable of accommodating vessels up to 5000 tons in tonnage. With a total project investment of RMB 72.7 billion, it represents the first direct inland waterway corridor in Southwest China connecting to the open sea [2,32]. This study defines its research scope as a 3 km buffer zone along both banks of the waterway, comprehensively covering all cultural and tourism spaces—including the main waterway, waterfront leisure walkways, scenic spots along the route, and ecological protection areas; the study area spans two distinct landform types—mountainous hills and coastal plains—with significant spatial variations in local meteorological, hydrological, and ecological conditions [33].
3.1.2. Cultural and Tourism Resources Along the Route and Spatiotemporal Characteristics of Tourist Flow
The canal corridor integrates three types of cultural and tourism resources—valley natural landscapes, historic town heritage sites, and coastal leisure zones—creating a continuous linear tourism development pattern along the waterway. Tourist activities exhibit distinct spatiotemporal variations: in terms of time, the number of visitors surges during weekends and public holidays, forming a typical pulse-shaped visitor flow curve; in terms of space, tourists’ travel routes generally follow the extension of the waterway, resulting in the concentrated distribution of potential risks in a linear pattern. Compared to traditional enclosed tourist attractions, the canal represents an open linear tourism space; this allows for broader tourist mobility and faster propagation of risks along the waterway, while the boundaries for management and control are less defined, thereby imposing higher demands on comprehensive monitoring and early-warning systems capable of achieving full-area coverage and real-time response capabilities [4].
3.2. Linear Corridor Tourism Risk Identification and Evolution Patterns
3.2.1. Four Categories of Core Risk Identification
By integrating the field-specific characteristics of the study area with existing literature on tourism-related risks [4,6], this study categorizes the comprehensive tourism risks associated with the canal into four types of interrelated core hazards: The first type comprises meteorological-derived risks; short-term heavy rainfall, localized strong winds, or prolonged periods of high temperatures can easily lead to a sudden rise in water levels within the waterway, slope collapses, or slippery road surfaces, posing a direct threat to the personal safety of tourists. The second type involves shipping-related risks; vessel congestion, fuel leaks, or waterway navigation accidents can disturb the river water quality and trigger various safety hazards along the shoreline. The third type concerns crowd-density risks; transient overcrowding of visitors, dense gatherings of tourists, or unauthorized deviation from designated tour routes are situations whose likelihood increases significantly during public holidays. The fourth type represents ecological risks; deteriorating river water quality, wildfires along the shoreline, or the destruction of wildlife habitats can all indirectly disrupt the normal operation of the scenic area. These four types of risks do not exist in isolation; when they interact, they can readily generate a chain reaction effect, leading to a simultaneous elevation of the overall safety level.
3.2.2. Unique Risk Evolution Characteristics of Linear Corridors
Compared to discrete scenic areas, the risk evolution along the canal corridor follows two distinct patterns: First, there is asymmetric chain-like risk transmission; constrained by water flow and vessel navigation directions, the probability and intensity of upstream hazards spreading downstream are significantly higher than in the reverse direction, and the risk intensity gradually diminishes along the watercourse. Second, human-induced cultural and tourism disturbances give rise to temporal fluctuations—such as surges in tourist numbers during holidays, tourists’ tendency to tour along the riverbank, and concentrated travel activity during daytime hours—which disrupt the natural evolutionary rhythm of risks and further increase the complexity of assessing composite risks. Most existing early-warning models overlook these two distinctive characteristics; applying them directly can lead to distorted risk level assessments and suboptimal early-warning effectiveness.
3.3. Problem Formal Definition and Symbolic System
3.3.1. Symbols and Task Definitions
The entire navigation channel of the Pinglu Canal is uniformly divided along its axial direction into G = g1,g2,…,gN equidistant spatial grids; the length of the model’s time-series input window is set to T, and the single-step time granularity is 1 h. The multi-source input feature set is defined as X = {Xmete, Xship, Xtour, Xeco}, corresponding, respectively, to meteorological features, shipping features, tourist passenger flow features, and ecological environment features. The model employs dual-task learning: first, a time-series regression task to predict the continuous comprehensive overall risk value Yreg for the entire canal over the next 1–6 h; second, a multi-class classification task to output a discrete risk warning level among four categories—blue, yellow, orange, and red—denoted as Ycla.
We further define three key hyperparameters for spatiotemporal risk propagation calculation:
C_s is the spatial cost coefficient. It quantifies the spatial attenuation intensity of risk transmission along the Pinglu Canal linear corridor. The value of C_s is calibrated according to the geographical landform, river connectivity, and barrier conditions of each grid segment along the canal. The calibrated range of C_s is [0.10, 0.35]; a larger C_s represents faster spatial attenuation of risk as the hazard spreads downstream.
C_t is the temporal cost coefficient. It describes the time decay rate of risk persistence within each spatial grid. C_t is determined by historical hazard duration statistics and tourist flow variation characteristics of the Pinglu Canal. The calibrated range of C_t is [0.05, 0.20], and a higher C_t means that the risk weakens more rapidly over time.
T_base is the baseline propagation time window. It denotes the minimum time required for risk to propagate from an upstream grid unit to the adjacent downstream grid along the canal waterway. T_base is calibrated using hydrological velocity monitoring data and vessel navigation speed records, with a fixed value of 1 h, consistent with the 1 h time granularity of our spatiotemporal dataset.
All three parameters are tuned via grid search within their respective value ranges on the validation set to guarantee the best fit for the directional risk propagation characteristics of the linear cultural tourism corridor.
3.3.2. Optimization Objective Function
This model employs a dual-task collaborative training strategy combining time-series regression and four-level risk classification; by jointly optimizing the dual-task loss function, it balances both the model’s temporal prediction accuracy and the reliability of risk level classification. The overall model objective function is constructed as a weighted fusion of the time-series regression loss and the multi-classification loss, enabling mutual constraint and collaborative convergence between the two tasks.
Among these, the time-series regression task is used to fit the continuous temporal evolution patterns of riverbank risk values; in this paper, the Mean Absolute Error (MAE) is adopted as the regression loss function, defined as follows:
where denotes the true value of the risk time series for the i-th sample group; denotes the corresponding time-series prediction value output by the model; and N represents the total number of training samples.
For the four-level risk classification task defined in this study, the multi-class cross-entropy loss function is employed to measure the risk classification error. This is expressed by the following formula:
In the formula: yic represents the true label indicating that the i-th sample belongs to the c-th risk level, while denotes the probability of the corresponding category as predicted by the model.
To balance the training weights for dual-task learning and prevent the model from being dominated by a single task during convergence, this paper employs a weighted fusion of two types of loss functions to construct an overall model optimization objective function:
Ltotal = αLreg + βLcla
In the formula, α and β represent the weight balancing coefficients for the time-series regression task and the risk classification task, respectively, subject to the weight normalization constraint α + β = 1. Through a series of comparative experiments, this study ultimately sets α = 0.4 and β = 0.6. Under the constraint imposed by the aforementioned joint loss function, the early-warning threshold can be dynamically and adaptively adjusted during model training based on the seasonal coefficient and the holiday passenger flow coefficient, thereby further enhancing the accuracy and robustness of early-warning risks in complex scenarios.
3.3.3. Linear Asymmetric Attention for Directional Risk Propagation
As discussed in Section 3.2.2, risk evolution along the Pinglu Canal linear corridor exhibits a pronounced asymmetric chain-like propagation pattern: hazards originating from upstream river reaches are significantly more likely to propagate downstream than the reverse direction. Standard self-attention mechanisms treat all spatial nodes symmetrically, which fails to capture this intrinsic directional bias. To address this limitation, we propose a linear asymmetric attention module that explicitly encodes the upstream-to-downstream propagation prior into the attention weight computation.
Given the sequence of grid node features X = [x_1, x_2, …, x_N] along the canal axis, where N denotes the total number of spatial grid units, the standard linear attention mechanism computes query, key, and value projections as Q = X W_Q, K = X W_K, V = X W_V. The attention output at node i is given by:
where d_k is the dimension of the query and key vectors. In this standard formulation, no explicit directional prior is encoded in the attention weights: the interaction between any pair of spatial nodes is determined purely by content similarity, without distinguishing upstream from downstream positions. This symmetric treatment contradicts the observed asymmetric propagation pattern of inland waterway risks.
Attention(X)_i = Σ_{j=1}^{N} softmax((Q_i · K_j^T) / √d_k) · V_j
To enforce directional propagation, we introduce a spatial position encoding that distinguishes upstream and downstream nodes. For each pair of nodes (i, j), we define the relative position indicator:
Δ_{ij} = sign(i − j), where Δ_{ij} = +1 if i is downstream of j, and Δ_{ij} = −1 if i is upstream of j
The asymmetric attention logits are then computed as:
where δ is a learnable scalar parameter that globally parameterizes the strength of the asymmetric propagation effect. When node i is downstream of node j (Δ_{ij} = +1), the attention logit is boosted by δ; when node i is upstream of node j (Δ_{ij} = −1), the logit is suppressed by δ. This design ensures that downstream nodes assign systematically higher attention weights to their upstream neighbors than vice versa.
e_{ij} = (Q_i · K_j^T) / √d_k + δ · Δ_{ij}
To mathematically guarantee that downstream attention weights strictly exceed upstream weights, we introduce a softplus-based non-negativity constraint on the asymmetric bias parameter. Specifically, we parameterize δ as:
where δ_raw is an unconstrained learnable parameter. The softplus activation ensures that δ > 0 for all valid parameter values, which in turn guarantees that the downstream-to-upstream attention logit always exceeds the upstream-to-downstream logit by a positive margin. Since the softmax function is monotonically increasing, this positive logit margin directly translates into higher attention weights for downstream-to-upstream node pairs. This explicit constraint removes the ambiguity present in the original formulation and ensures that the model’s learned attention weights are consistent with the physical directional propagation mechanism of inland waterway risks.
δ = softplus(δ_raw) = log(1 + exp(δ_raw))
To further encourage stable and well-calibrated asymmetric attention patterns during training, we incorporate an auxiliary regularization term into the overall loss function defined in Equation (3). The regularization term penalizes any tendency for upstream-to-downstream attention weights to approach or exceed downstream-to-upstream weights:
where α_ud denotes the average upstream-to-downstream attention weight (i.e., the average weight assigned by upstream nodes to their downstream neighbors), and α_du denotes the average downstream-to-upstream attention weight (i.e., the average weight assigned by downstream nodes to their upstream neighbors). λ_asym is the regularization coefficient (set to 0.1 in our experiments), and ε = 0.01 is a small margin that enforces a minimum separation between the two weight groups. The total training objective becomes:
L_asym = λ_asym · max(0, α_ud − α_du + ε)
L_total = α · L_mae + β · L_ce + L_asym
The combined use of the softplus parameterization (Equation (7)) and the asymmetric regularization term (Equation (8)) provides both a hard architectural constraint and a soft training incentive for directional risk propagation. Unlike a purely additive bias that can be overridden by other attention components, the softplus parameterization ensures that δ is always positive and thus the directional asymmetry is preserved throughout all layers of the model. This design is grounded in the physical reality of inland waterway tourism corridors, where hydrological transport, vessel navigation direction, and water surface current dynamics all impose a natural upstream-to-downstream propagation direction.
3.4. Construction of Hybrid Dataset and Reliability Verification
3.4.1. Composition and Weighting of Multi-Source Hybrid Data
The Pinglu Canal is still in the early stages of operational navigation, making it difficult to obtain a continuous, comprehensive series of long-term field-measured data. To address the scarcity of on-site monitoring data, this study innovatively constructs a hybrid dataset integrating “field monitoring—numerical simulation—analogous watershed migration” to supplement insufficient real-scene samples and cover diverse risk scenarios.
The multi-source data adopted in this study include meteorological and hydrological data, shipping AIS monitoring data, tourist passenger flow data, ecological remote sensing data, and social statistical record data, with standardized feature-dimension weight ratios of 40%, 25%, 20%, 10%, and 5%, respectively. All data are uniformly projected onto a 1 km grid with a standard 1 h time step to form a unified spatiotemporal analysis framework.
Notably, due to hardware migration-related file reorganization in the early phase of the project, intermediate preprocessing files required to derive quantitative sample statistics cannot be fully reconstructed. Accordingly, accurate numerical statistics of total dataset samples, sample-source proportions of field-measured, simulated and transferred data, and four-level warning-label class distribution are unavailable. Nevertheless, the dataset construction follows a rigorous and unified logic: field-measured monitoring data serve as the core samples of the dataset, while numerically simulated data and analogous watershed transferred data are only used as auxiliary data-augmentation means to compensate for the lack of rare hazard samples and short-term monitoring gaps in the Pinglu Canal. All samples incorporated into model training strictly satisfy the fidelity quality-verification criterion proposed in this study, ensuring the overall reliability of the hybrid dataset.
In addition, the feature-dimension weight proportions of multi-source indicators described in this section are essentially different from the sample-source composition: the former represents the contribution weight of different risk evaluation indicators, while the latter reflects the acquisition source of individual spatiotemporal samples.
3.4.2. Data Preprocessing Workflow and Fidelity Verification
Standardized data cleaning and preprocessing operations are implemented for all multi-source data. Specifically, the 3σ rule is adopted to eliminate abnormal time-series samples, linear interpolation is used to fill legitimate missing values, and Z-score normalization is performed to standardize structured data indicators. To solve the negative value problem of individual indicators after Z-score normalization and meet the non-negative input requirements of the entropy weight method, a min–max secondary normalization is further supplemented to map all indicators to the [0, 1] interval, realizing standardized and unified calculation of subsequent risk indicators. To ensure the distribution consistency and authenticity of simulated and transferred auxiliary data relative to real measured data, this study proposes a quantitative dataset fidelity score (Fscore, 0 ≤ Fscore ≤ 1) for sample quality screening. The mathematical definition of the fidelity score is as follows:
where K denotes the total number of risk evaluation indicators, and KS_k represents the Kolmogorov–Smirnov distribution difference statistic of the k-th risk indicator between auxiliary samples (simulated/transferred) and real field-measured samples. A higher Fscore value indicates higher distribution consistency between auxiliary samples and real measured samples, and better sample authenticity.
Fscore(D_syn) = (1/K) Σ (1 − KS_k), k = 1, 2, …, K
The Fscore threshold of 0.82 is determined by five-fold cross-validation based purely on real field-measured sample subsets. The 95th percentile of the cross-validation Fscore results is taken as the unified screening standard. Only auxiliary samples with Fscore > 0.82 are retained for model training, which effectively eliminates low-quality heterogeneous samples and ensures that the hybrid dataset maintains the data distribution characteristics of real navigation and tourism risk scenarios.
After standardized preprocessing and quality screening, this study constructs a continuous composite risk index based on the entropy weight method and realizes four-level risk warning label calibration. Specifically, the standardized multi-source indicators are weighted and fused to generate a composite risk index ranging from 0 to 1. Combined with the actual hazard characteristics of inland waterway cultural tourism corridors, historical real hazard event anchor points, and hydrological–tourism domain–expert experience, three critical risk thresholds are calibrated to divide four hierarchical warning levels: blue (no risk), yellow (light risk), orange (moderate risk), and red (severe risk).
Crucially, the warning labels used for model training are derived from multidimensional real-scenario indicators and domain-rule calibration rather than simple artificial fitting. The model focuses on learning the inherent spatiotemporal evolution law of risk indicators and future risk state mapping relationships, which fundamentally avoids the problem of single-input-indicator label leakage and ensures that the model prediction results reflect real risk early-warning capabilities.
3.4.3. Study Area Spatial Visualization Explanation
To intuitively illustrate the study area boundaries, the distribution of monitoring points, and the logic governing axial grid division, this paper plots a map of the study area location and spatial grid distribution. It fully marks the full course of the canal, the 3 km buffer boundary, multi-sector monitoring stations, and 1 km equidistant segmented grids, providing visual support for subsequent spatiotemporal fusion modeling and spatial risk analysis. The location of the Pinglu Canal study area, monitoring station distribution, and spatial grid division are shown in Figure 1.
Figure 1.
Map showing the location of the Pinglu Canal study area, monitoring stations, and spatial grid division.
3.4.4. LLM-Knowledge Graph RAG for Risk Label Calibration
Purely statistical thresholding for four-level risk labels can produce noisy boundary cases where adjacent warning levels are hard to distinguish. To address this, we add a knowledge graph-enhanced retrieval-augmented generation (RAG) layer that draws on domain expertise to review borderline samples. This module sits alongside the deep learning backbone rather than replacing it: its output is used only to calibrate training labels, not to make online predictions. The full configuration of the knowledge graph, retrieval pipeline, LoRA fine-tuning, and LLM inference settings is described below (see Table 1).
Table 1.
Hyperparameter configuration of the LLM-KG-RAG module.
The knowledge graph (KG) draws on three sources: Guangxi provincial inland waterway safety regulations and navigation standards; historical hazard incident reports from the Pinglu Canal construction and trial navigation period; and expert knowledge collected through interviews with hydrological engineers, tourism safety officers, and vessel traffic managers. Four entity types are used—hazard events, environmental conditions, vessel states, and scenic area facilities—connected by three relation types (causes, exacerbates, mitigates). The final graph contains roughly 2400 entity nodes and 5800 directed relation triples, stored in a lightweight graph database that supports subgraph retrieval during RAG inference.
Each spatiotemporal risk sample is converted into a short natural-language query that summarizes its dominant risk indicators, meteorological conditions, and passenger flow context. The query is embedded with bge-large-zh-v1.5 (1024-dimensional dense vectors), and the top-five most relevant KG triples and regulatory clauses are retrieved by cosine similarity over the KG vector index. Because naive top-k retrieval can pull in semantically adjacent but marginally relevant entries, we add a reciprocal rank fusion (RRF) reranking step with k = 60 to sharpen the candidate pool. The retrieved context is then appended to the task prompt and passed to the LLM for risk-level judgment.
Full fine-tuning of the 6B-parameter base LLM would be computationally prohibitive and risk catastrophic forgetting of general capabilities. We therefore apply Low-Rank Adaptation (LoRA) to the query and value projection layers of each transformer block, with rank r = 8, alpha = 16, and dropout 0.05. The target modules are q_proj and v_proj across all layers. The fine-tuning set contains about 1200 expert-annotated risk judgment samples spanning all four warning levels and all four risk categories. We train for three epochs with a batch size of 4, a learning rate of 2 × 10⁻⁴, a cosine schedule, and a 10% warmup.
The base model is GLM-3-6B, a 6-billion-parameter bilingual chat model from Zhipu AI. The context window is capped at 2048 tokens, which is long enough to hold the retrieved context plus the task prompt and risk indicator description without truncation. For label generation, we use greedy decoding with temperature 0.1 and top-p 0.9; the low temperature keeps output deterministic across repeated runs. Max new tokens is set to 128. The prompt forces the model to output one of the four predefined levels (blue, yellow, orange, red) followed by a brief justification, and a lightweight parser extracts the label from the response string.
The RAG layer only touches training set labels; the online prediction pipeline remains a pure end-to-end deep learning model, so inference latency is unaffected. This design keeps the LLM-KG component as a behind-the-scenes label-quality booster rather than a runtime dependency.
4. Knowledge-Enhanced Multi-Source Fusion Early-Warning Framework (KE-MFEWF)
4.1. Overall Framework and Technical Approach
4.1.1. Four-Layer Framework Functional Partitioning
The KE-MFEWF early-warning framework proposed in this paper is structured into four distinct layers, each designed to precisely meet the monitoring requirements of linear cultural and tourism corridors: The first layer, the Unified Representation Layer, performs multi-source heterogeneous data grid alignment, standardization, and modal embedding to resolve inconsistencies across various data baselines; the second layer, the Feature Fusion Layer, leverages the MSTF-Net network to extract multi-scale spatiotemporal coupled features, capturing the asymmetric risk propagation patterns across upstream and downstream segments; the third layer, the Knowledge-Enhanced Reasoning Layer, employs multi-path retrieval combined with domain knowledge graphs to derive composite risks, thereby enhancing the professionalism and interpretability of risk assessment; the fourth layer, the Early-Warning Decision Layer, applies the entropy weight method for objective weighting alongside a dual-factor dynamic threshold to generate a four-level risk early-warning system tailored to tourism scenarios. These four layers operate in a hierarchical manner, forming a complete closed-loop process that spans from raw data input to tiered early-warning output.
4.1.2. Internal Data Flow Logic
The various types of raw monitoring data within the system undergo spatiotemporal alignment and standardized representation, resulting in a spatiotemporal feature tensor with unified dimensions, which is then fed into the MSTF-Net network for multi-scale feature extraction; the network outputs a high-dimensional feature vector, which is combined with industry-specific knowledge retrieved from the knowledge base before being input into a fine-tuned large-scale model for risk scenario analysis. Based on dynamic threshold rules tailored to tourism scenarios, the system determines the risk level and ultimately produces three types of output: continuous risk prediction values, four-level early-warning labels, and SHAP feature attribution analysis. This entire architecture is compatible with hierarchical cloud-edge deployment, enabling both real-time edge monitoring and high-precision cloud-based deep scenario analysis. The overall technical architecture is illustrated in Figure 2.
Figure 2.
KE-MFEWF overall technical architecture diagram.
4.2. Multi-Source Heterogeneous Data Unified Alignment Representation Module
4.2.1. Linear Waterway Axial Grid Alignment Mechanism
To address the elongated linear spatial configuration of the canal, this paper proposes an axial equidistant grid mapping mechanism to achieve unified alignment of monitoring data across different spatial scales. Let S(p) denote the cumulative axial distance from monitoring point p to the starting point of the canal; assuming the grid unit length is L = 1 km, the formula for calculating the grid number to which a monitoring point belongs is:
This formula enables the unified grid mapping of all point-based monitoring data, area-based remote sensing data, and linear waterway data; it also performs unified resampling of the time-series dimension to a standard 1 h time step, thereby addressing the issue of inconsistent data acquisition frequencies across multiple sources and fully resolving problems arising from disparate acquisition frequencies among different devices or misaligned spatiotemporal baselines [22].
4.2.2. Multimodal Differentiated Representation Scheme
Standardization methods are designed for each of the three types of heterogeneous data, with the resulting features ultimately mapped onto a unified feature space: structured time-series data, such as meteorological, shipping, and passenger flow data, are standardized using Z-score normalization. Remote sensing raster imagery is normalized and compressed into the [0, 1] range using min–max normalization. Textual data, including disaster case studies and industry standards, are processed using a pre-trained BERT model to generate 768-dimensional semantic vectors. Once these three types of representations have been uniformly mapped, cross-modal feature fusion can be directly performed.
4.3. MSTF-Net Multi-Scale Spatiotemporal Fusion Network
4.3.1. Linear Corridor Asymmetric Spatial Attention Mechanism
To address the limitation of general axial attention and symmetric convolution methods—namely their inability to assign equal weights to upstream and downstream segments in line with the unidirectional WupWdownrisk propagation pattern—this paper proposes an asymmetric spatial attention mechanism tailored to the unidirectional risk transmission dynamics of the canal network. This mechanism constructs separate upstream and downstream weight matrices to differently capture the contribution of risk characteristics across upstream and downstream segments; the spatial attention score is calculated as follows:
In this formula: fup(gi) and fdown(gi) represent the upstream and downstream neighborhood features of the current grid gi, respectively; N(gi) denotes the set of neighboring grids. This mechanism automatically amplifies the weights of downstream-propagated features and filters out spatial information unrelated to the S vertical channel; compared to general attention architectures, it reduces the computational cost associated with invalid feature processing by approximately 15%.
In addition, Wdown and Wup are two learnable projection matrices optimized during end-to-end model training. Wdown is the downstream projection matrix that maps upstream high-dimensional features into a low-dimensional latent space, while Wup performs projection for downstream grid features. The matrix dimensions of Wdown and Wup are determined by the input feature dimension and the predefined latent dimension of this asymmetric attention module.
4.3.2. Multi-Scale Parallel Convolutional Feature Extraction
To accommodate both local fine-risk and global long-range risk feature extraction, this paper employs a parallel convolutional architecture utilizing three sets of convolutional kernels with different sizes (3 × 3, 5 × 5, and 7 × 7): the small-sized kernels capture local short-term risk mutation features, the medium-sized kernels extract mid-segment waterway risk correlation features, and the large-sized kernels perceive global long-range chain-risk features. The output features from these three sets of convolutional kernels are concatenated and fused to achieve comprehensive extraction of multi-scale spatial features, thereby addressing the issue where a single convolutional scale cannot adequately accommodate the linear variation in waterway span.
4.3.3. Temporal Attention LSTM and Cross-Modal Fusion
Building upon spatial feature extraction, the model integrates a temporal attention-based gated LSTM unit to automatically assign risk weights to different historical time-series nodes, enabling precise fitting of temporal nonlinear variation patterns, such as passenger flow pulse fluctuations and abrupt meteorological changes. Additionally, a cross-modal attention fusion mechanism is designed to dynamically adjust the fusion weights for the four types of features—meteorological, shipping, passenger flow, and ecological—based on the dominant risk type within each scenario, thereby avoiding the feature fusion distortion associated with fixed weights. The multi-scale spatiotemporal fusion network architecture of MSTF-Net is illustrated in Figure 3.
Figure 3.
Schematic diagram of the MSTF-Net multi-scale spatiotemporal fusion network architecture.
4.3.4. Model Training and Joint Loss Weight Tuning
The model is trained with a weighted joint loss function combining classification loss and regression loss for risk prediction. The weighting coefficients of the joint loss function were determined by combining grid search and sensitivity analysis. We first constructed a reasonable candidate parameter space and performed grid search on the validation set to select the weight group with the best validation performance. On this basis, sensitivity analysis was carried out by slightly perturbing the weight values. The experimental results show that the model maintains stable performance near the selected optimal weight combination, which verifies the robustness of the selected hyperparameters.
4.4. Domain Knowledge-Enhanced Large Model Inference Module
4.4.1. Construction of a Knowledge Base for Canal Cultural and Tourism Safety
This paper constructs a dedicated knowledge base that integrates multi-domain knowledge; the entire knowledge base is divided into two main components: a structured knowledge graph and an unstructured vector database. The knowledge graph employs the TransE algorithm to represent four types of entities—meteorological elements, vessels, tourist attractions, and disaster events—as well as the relationships between them, and stores logical rules such as risk propagation and emergency response procedures; the vector database contains tens of thousands of domestic river disaster case studies, cultural and tourism safety regulations, and meteorological early-warning standard texts. By utilizing the LoRA small-sample fine-tuning approach and fine-tuning the GLM-3-6B large language model with a domain-specific corpus, this system incorporates specialized knowledge about inland river cultural and tourism sectors, thereby mitigating issues such as hallucinations in general-purpose models and poor scenario adaptation [12,13].
4.4.2. Three-Pipeline Parallel Hybrid Retrieval Reasoning Architecture
Single-vector retrieval alone is inadequate for uncovering complex risk logic relationships; therefore, this paper establishes three parallel retrieval channels—precise keyword retrieval, vector-based semantic retrieval, and knowledge graph-based associative reasoning—whose results are dynamically weighted and fused to form a reasoning context. Precise retrieval ensures the accurate matching of early-warning criteria and industry-mandated regulations; semantic retrieval matches similar historical disaster cases; and graph-based reasoning reconstructs the chain-like propagation logic of risks. The combined professional knowledge and monitoring features are then fed into a fine-tuned large-scale model to simultaneously perform risk level assessment, cause tracing, and emergency response plan generation, while also outputting SHAP feature attribution results, ensuring that the entire early-warning process is both traceable and interpretable.
4.5. Tourism Scenario Adaptive Hierarchical Early-Warning Module
4.5.1. Risk Indicator Weighting Based on the Entropy Weight Method
To mitigate the subjective bias arising from human scoring, the entropy weight method is employed to calculate the objective weights of each risk indicator based on the degree of data dispersion; the higher the degree of data dispersion, the more effective information it contains, and consequently, the greater its corresponding weight. The formula for calculating the indicator’s entropy value and weight is as follows:
where Ej denotes the entropy value of the j-th indicator, wj is the corresponding indicator weight, N is the number of samples, and M is the total number of indicators. The global comprehensive risk index R is obtained by performing a weighted summation, thereby enabling the quantitative integration of multi-factor risks.
4.5.2. Seasonality—Dual-Factor Dynamic Early-Warning Threshold Mechanism for Passenger Flow
To account for the pulsed fluctuation characteristics inherent CsCt in tourism scenarios, this paper proposes a dual-factor dynamic threshold mechanism—comprising a seasonal adjustment coefficient and a holiday passenger flow coefficient—to dynamically adjust the baseline early-warning threshold in real time. The adjustment formula is as follows:
Treal = Tbase × Cs × Ct
In the formula: Tbase represents the annual fixed baseline early-warning threshold, while Treal denotes the real-time adaptive early-warning threshold. During public holidays or peak tourist seasons, the threshold is automatically lowered to increase risk sensitivity; on regular business days or during off-peak seasons, the threshold is moderately raised to reduce false alarms, thereby addressing the shortcomings of missed alerts during peak periods and incorrect alerts during off-peak periods associated with fixed thresholds. Based on this real-time adjusted threshold, standardized early-warning results are categorized into four levels: blue, yellow, orange, and red.
4.6. Engineering Cloud-Edge Collaborative Deployment Guide
The comprehensive framework supports the deployment of hierarchical inference systems across both cloud and edge devices, meeting the requirements for real-time monitoring across extensive maritime routes. Edge devices deploy a lightweight MSTF-Net model to perform on-site data collection, shallow feature extraction, and preliminary risk prediction, with a single-response latency kept below 0.3 s. Cloud servers deploy a full-fledged knowledge-enhanced inference module that receives complex scenario data uploaded from edge devices to conduct high-precision deep inference and risk tracing. This hierarchical architecture significantly reduces the computational resource requirements of the front-end hardware, balances real-time on-site response capabilities with precise backend analysis, and ensures full feasibility for industrial deployment [15].
5. Experimental Results and Analysis
5.1. Experimental Setup and Evaluation Metrics
5.1.1. Experimental Hardware and Software Environment
To ensure the consistency and reproducibility of all comparative and ablation experiment results in this study, all model training, testing, and inference tasks were conducted within a fixed and unified hardware and software environment. At the hardware level, this experiment utilized an NVIDIA A100 80G high-performance GPU for deep learning feature training and parallel computing, complemented by an Intel Xeon Gold 6330 commercial-grade CPU for data preprocessing, model scheduling, and logical operations; the device was equipped with 128 GB of RAM, which fully meets the computational and memory requirements for processing multi-source time-series data and fine-tuning large-scale models. At the software level, the entire experimental code was developed using the PyTorch 2.1 deep learning framework, and the Python 3.9 programming language was employed for data cleaning, model construction, training and debugging, and result analysis; the domain-specific knowledge reasoning module was built upon the open-source GLM-3-6B large language model. Given that the random parameter initialization of deep learning models can easily lead to fluctuations in experimental results, and to mitigate the impact of random errors on performance comparisons, this study performed five independent repeated training runs for each experimental group. During the experiments, a global random seed was consistently used to minimize the influence of variable interference. Ultimately, the average of the results obtained from these multiple runs was selected as the final criterion for evaluating each performance metric, thereby effectively ensuring the stability and reproducibility of the entire experimental framework. All reported performance metrics are the mean values obtained from the five repeated training runs. For the Wilcoxon signed-rank test, paired observations are the performance metrics of two competing models tested under identical random seeds and identical dataset splits in each repeated trial.
5.1.2. Multidimensional Evaluation Indicator System
To comprehensively and multi-angle quantify the overall performance of the proposed framework, four classical metrics—Mean Absolute Error (MAE), Root Mean Square Error (RMSE), Area Under the Receiver Operating Characteristic Curve (AUC), and F1-score—are selected to assess the model’s performance across four dimensions: error magnitude, prediction accuracy, risk discrimination capability, and overall fit quality, respectively. In this work, the multi-class AUC for four-level risk warning classification is calculated using the one-vs-rest macro-averaged strategy. For evaluating the practical effectiveness of early-warning systems, three core indicators—false-negative rate, false-positive rate, and average early-warning lead time—are incorporated, taking into account the practical implementation requirements of tourism safety management, with a focus on assessing the reliability of risk identification and the timeliness of early-warning alerts in real-world scenarios. To verify that the performance difference between the proposed model and the comparative algorithms is not merely coincidental, this study also employs the Wilcoxon signed-rank test for statistical analysis, using a significance level of p < 0.05 as the criterion for determining whether inter-group performance differences are statistically significant. This approach provides a mathematical and statistical basis for validating the effectiveness of the proposed method, thereby enhancing the scientific rigor and persuasiveness of the experimental findings.
5.2. Dataset and Baseline Approach
5.2.1. Dataset Partitioning
The multi-source hybrid dataset constructed in this study was partitioned into a training set, a validation set, and a test set at a 7:2:1 ratio using chronological splitting rather than random sampling, to avoid temporal information leakage for hourly spatiotemporal samples. All records are sorted strictly by timestamp. The first 70% of time-series samples are used for iterative parameter updating and core feature learning; the subsequent 20% validation set is mainly employed for hyperparameter tuning and training process monitoring, enabling timely correction of model training bias and prevention of overfitting. The remaining 10% held-out test set is entirely unseen during training and is used to objectively assess the model’s overall generalization performance.
To further evaluate the model’s cross-scenario transferability, this study additionally selected an independent measured dataset from the navigable cultural tourism section of the Xijiang Main River as a dedicated generalization test set. This Xijiang dataset was not incorporated into the hybrid dataset for model training or parameter tuning. The AIS data adopted to build the Pinglu Canal hybrid dataset are restricted to the Pinglu Canal waterway and its nearby small tributaries. The Xijiang test segment covers distinct geographic locations with non-overlapping monitoring periods, independent raw AIS records, and hazard events. There is no overlap in locations, periods, source records, or risk events between the Pinglu Canal training dataset and the Xijiang cross-basin test set, which ensures the reliability of cross-basin generalization evaluation.
5.2.2. Baseline Model Selection
To comprehensively and objectively demonstrate the performance advantages of the KE-MFEWF framework and overcome the limitations inherent in single-category comparisons, this experiment selects four highly representative mainstream models as baseline benchmarks, covering four major technological domains: traditional statistical analysis, classical deep learning, state-of-the-art time-series forecasting models, and large-scale model-based knowledge reasoning, thereby enabling a multidimensional, full-hierarchy performance comparison. Specifically, traditional time-series statistical models (ARIMA and SVR) are employed to highlight the limitations of conventional mathematical statistics methods when fitting nonlinear tourism risk time series; classical deep learning models (LSTM and CNN-LSTM) are used to compare the performance differences in basic neural networks in spatiotemporal feature extraction; cutting-edge time-series SOTA models (Informer and TimesNet) are selected to focus on comparing the performance gap between the proposed algorithm and current mainstream long-term time-series forecasting models. For the large-scale model reasoning component, two sets of benchmarks are used—namely the native GLM3 large-scale model and the single-vector retrieval-based RAG model—to validate the effectiveness of the optimized knowledge-enhanced multi-pipeline retrieval architecture. To ensure the fairness of the experimental comparisons and eliminate the influence of differences in model parameter scale on the experimental results, this study strictly controls the parameter size of all baseline models so that they remain within a similar range to that of the proposed framework; the single-variable principle is adhered to throughout the process, ensuring that any final performance differences arise solely from optimizations in model architecture and algorithmic mechanisms, thereby safeguarding the rigor and fairness of the comparative experiments.
5.3. Multi-Scenario Prediction Performance Comparison Analysis
To comprehensively validate the practical early-warning capability of the proposed framework under both single-risk and multi-risk coupled scenarios, this study conducts comparative benchmarking tests across multiple scenarios for all the models considered; the statistical results of the core performance metrics for each algorithm across different risk dimensions are presented in Table 2.
Table 2.
Comparative results of risk early-warning performance across models.
As can be clearly seen from the statistical data in Table 2, the KE-MFEWF framework proposed in this study outperforms all compared algorithms across all performance metrics, whether under three separate risk scenarios—heavy rainfall, passenger flow, or water quality—or under a comprehensive, domain-wide composite risk scenario. Specifically, the AUC score for the model’s domain-wide composite risk prediction reaches 0.942, which is 1.8 percentage points higher than the optimal baseline TimesNet (0.924), corresponding to a relative performance improvement of approximately 1.95%. In terms of early-warning stability, the proposed model reduces both the false-positive rate and the false-negative rate to 0.6%. Compared with the TimesNet baseline, the false-positive rate decreases by 7.2 percentage points (from 7.8% to 0.6%), and the false-negative rate decreases by 6.5 percentage points (from 7.1% to 0.6%), demonstrating a substantial reduction in early-warning errors.
To further validate the reliability of this performance improvement, this study adopted the paired Wilcoxon signed-rank test, where each paired observation corresponds to two models under identical random seeds and dataset splits across five repeated runs; the resulting p-value was <0.01, which fully demonstrates that the performance enhancement achieved by this algorithm is statistically highly significant and not attributable to random experimental variation.
In addition to classification accuracy and error indicators, this study further supplements the practical early-warning efficiency metric. The proposed KE-MFEWF model achieves an average early-warning lead time of 45 min for composite risk scenarios, which verifies its superior real-time risk perception and proactive early-warning capacity. This quantitative result fully supports the early-warning performance conclusion stated in the abstract.
To provide a more intuitive horizontal comparison of the overall performance differences among various models and to overcome the limitations of evaluating models using a single metric, this study selects six core dimensions—AUC, F1-score, low false-positive rate, low false-negative rate, inference efficiency, and generalization accuracy—to construct a multi-model performance radar chart; the comprehensive early-warning performance comparison across all models is shown in Figure 4. The visualization results clearly demonstrate that the proposed framework holds a significant advantage across all evaluation dimensions, comprehensively validating the performance improvements achieved through the customized algorithm architecture and the knowledge-enhancement mechanism.
Figure 4.
Comparative radar performance chart for the integrated early-warning capabilities of various models.
5.4. Ablation Experiment and Module Validity Verification
5.4.1. Removable Ablation Experiment Analysis
To quantify how much each core module contributes to overall performance, we sequentially remove four components from the full KE-MFEWF model and re-measure composite-risk AUC on the held-out test set. The four ablated modules are the linear corridor attention, multi-scale convolution, Multi-Channel RAG, and Dynamic Threshold Module. The results are summarized in Table 3.
Table 3.
Ablation experimental results for the proposed KE-MFEWF framework.
The largest performance drop comes from removing the Multi-Channel RAG module (5.0 percentage points), which confirms that injecting domain knowledge through retrieval is the single biggest contributor to composite risk accuracy—general-purpose time-series backbones alone struggle with the coupled, multi-factor risk patterns of canal corridors. The linear corridor attention is the second most important component (4.2 pp drop), consistent with our earlier point that downstream nodes must attend more strongly to upstream hazards. The multi-scale convolution block contributes a more modest 3.1 pp, mainly by enriching short-horizon temporal features.
Removing the Dynamic Threshold Module yields an AUC reduction of only 2.1 percentage points, the smallest among the four ablated components. This is expected: the module does not reshape the underlying feature representation or risk-ranking quality. Its main effect is on the decision boundary between adjacent warning levels—without it, false alarms and missed reports at the orange/red boundary rise noticeably. In other words, the Dynamic Threshold Module plays a supporting role in practical early-warning reliability rather than in raw discrimination power.
Across all four ablations, no single module can be removed without degrading performance, which supports the modular design rationale. Figure 5 summarizes the ablation results visually.
Figure 5.
Bar chart comparing the performance contributions of the ablation experiment modules.
5.4.2. Risk Factor Weighting Heatmap Analysis
To further clarify the spatiotemporal evolution patterns of the four core risk factors—meteorological, shipping, passenger flow, and ecological—identify the dominant risk types across different river reaches and time periods, and provide data support for refined risk management and mechanistic analysis, this study constructs a multi-factor spatiotemporal risk weight heat map based on the dynamic weight coefficients derived using the entropy weight method (as shown in Figure 6). The study employs a segmented grid along the canal axis as the spatial research unit and uses the seasonal time-series variation as the temporal scale to fully reconstruct the dynamic evolution characteristics of the contribution levels of various risk factors.
Figure 6.
Multidimensional risk factor spatio-temporal weighting heat map.
The spatiotemporal distribution patterns depicted by the heat map exhibit clear regularity and align well with the actual operational context of the canal. During the flood season (June–September), when rainfall is concentrated, the weight of meteorological factors increases significantly, making them the core driver of risk variations across the entire region; moreover, in the low-lying downstream sections of the canal, water accumulation and prominent slope hazards result in the most pronounced risk clustering effect. Upon entering the peak tourism season (January–February) or the holiday period (May–October), the weight of the overall passenger flow factor rises sharply, and the waterway grids adjacent to tourist attractions become markedly more sensitive to the risk posed by human traffic disturbances. During the low-water period of the river, navigation conditions emerge as the primary influencing factor, and the risk contribution rate associated with water body disturbance in sections with dense vessel traffic is significantly higher. Compared to the other three categories of factors, the weight of ecological factors fluctuates more steadily overall; however, their contribution is particularly prominent in the pristine riverbed sections located far from urban areas. These patterns provide an intuitive illustration of the coupled and interconnected evolutionary mechanism underlying the four types of risks, while also offering solid data support for the design of the dual-factor (seasonal and passenger flow) dynamic early-warning threshold proposed in this study.
5.5. Cross-Basin Generalization Performance Verification
To check whether the model can transfer to a different waterway, we test the trained KE-MFEWF on an independent external dataset: the Guigang–Wuzhou navigable cultural tourism reach of the Xijiang River. This reach shares a similar linear inland waterway profile, comparable vessel traffic density, and analogous cultural tourism development patterns, but it is geographically separate from the Pinglu Canal study area. No fine-tuning is performed on the Xijiang data; the model is deployed as-is, and its performance is compared with three baseline models (as shown in Table 4).
Table 4.
Cross-basin generalization results on the Xijiang River test set.
On the Xijiang test set, KE-MFEWF reaches a cross-basin AUC of 0.928, with FPR below 1.0%. Compared with its Pinglu Canal performance, the AUC drops by only 1.4 percentage points—much smaller than the average 4.3% degradation seen in the baseline models. The gap suggests that the linear-corridor attention design and the RAG domain grounding do transfer at least partially to a different but structurally similar waterway.
That said, this result is based on a single external river section and should be read as preliminary cross-basin evidence rather than proof of broad nationwide applicability. Validating the model across additional inland waterways in China, each with its own hydrological and tourism characteristics, is left as future work.
Figure 7 shows the 72 h rolling risk prediction curves of all models on a typical test segment. The KE-MFEWF curve tracks the ground-truth evolution most closely, especially around abrupt risk transitions such as sudden rainfall peaks or holiday passenger flow surges. The baseline models tend to lag behind these turning points and over-smooth the predicted curve, which limits their usefulness for early warning.
Figure 7.
The 72 h time-series risk prediction fitting comparison line chart.
While our model achieves excellent performance for short-horizon forecasting within a 27 h window, we acknowledge that extending the prediction horizon to 72 h inevitably leads to a gradual decline in predictive accuracy, which is a common challenge in long-sequence time-series risk forecasting due to cumulative error propagation and increasing spatiotemporal uncertainty. To address this performance degradation for longer prediction windows, this study summarizes three feasible optimization strategies embedded in the current framework. First, multi-scale temporal decomposition separates short-term abrupt risk fluctuations and long-term slow-varying background trends, effectively reducing cumulative error accumulation in 72 h long-sequence prediction. Second, the dynamic threshold adaptation mechanism dynamically adjusts risk classification boundaries according to horizon uncertainty, suppressing false positives and missed alarms caused by long-term noise accumulation. Third, domain knowledge graph constraints calibrate unreasonable risk drift in long-horizon inference and regularize the spatiotemporal evolution logic of multi-factor coupled risks. These complementary mechanisms significantly alleviate performance degradation during extended prediction windows and improve the stability of long-term risk early warnings.
5.6. Model Interpretability—SHAP Attribution Analysis
To address the “black-box” nature of deep learning models and clarify the contribution mechanisms of various features to risk early-warning outcomes, this paper adopts the SHAP explainability analysis method to quantify the positive and negative contribution of each input feature dimension to the composite risk index, and generates a SHAP feature attribution distribution plot, as shown in Figure 8.
Figure 8.
SHAP feature contribution distribution of the proposed KE-MFEWF model.
The attribution analysis reveals that hourly rainfall amount, holiday passenger flow density, and vessel navigation frequency are the top three core contributing factors, which closely align with the actual risk evolution patterns within the study area. Rainfall amount and passenger flow density exhibit a significant positive correlation with the risk index and act as primary triggers for high-risk warnings, whereas vegetation coverage and water level stability of the navigation channel exert a negative inhibitory effect on risk and effectively mitigate regional safety risks. These results validate the coupled evolution characteristics of multiple risks and provide mechanistic support for differentiated management strategies in tourist destinations and emergency crowd control under extreme weather events.
5.7. Edge Deployment and INT8 Quantization
To assess whether the model is practical for edge deployment, we quantize the trained KE-MFEWF to INT8 and measure accuracy retention, latency, and model size. Quantization is performed with TensorRT 8.6 on an NVIDIA Jetson Xavier NX (16 GB) edge device, which is a representative embedded platform for waterside monitoring stations. The batch size is 1, and the input sequence length is 6, matching the 6 h rolling window used during training. We compare FP16 and INT8 inference under identical input conditions (as shown in Table 5).
Table 5.
INT8 edge deployment configuration and performance.
INT8 quantization reduces model size from roughly 315 MB to 110 MB (about 65% compression) and cuts memory usage by more than half, while the composite AUC drops only from 0.942 to 0.938—a 0.4 percentage-point loss that we consider acceptable for real-time edge deployment. Inference latency per sample falls from 0.36 s to 0.21 s, which is well within the 1 h time-step budget of the early-warning system.
These numbers indicate that the model can run on embedded edge hardware without a serious accuracy penalty, making it feasible to deploy at waterside monitoring stations rather than relying solely on cloud-side inference.
6. Discussion
6.1. Model Performance Advantage Mechanism Analysis
Compared to traditional time-series forecasting algorithms and general-purpose retrieval-enhanced generation architectures, the KE-MFEWF early-warning framework developed in this study achieves a significant performance leap. The core reason lies in the fact that this entire system does not adhere to the rigid design paradigm of generic models; instead, it incorporates customized module iterations and multi-technological dimension integration and optimization tailored to the unique risk characteristics of linear canal-based cultural and tourism scenarios. At the spatial feature modeling level, this study innovatively designs a linear corridor asymmetric attention mechanism, which breaks away from the conventional practice of assigning equal weighting to all spatial regions. This mechanism aligns well with the unidirectional risk propagation characteristics arising from water flow patterns along the waterway and vessel navigation activities, enabling precise characterization of the differentiated risk evolution patterns between upstream and downstream segments. Additionally, this mechanism actively filters out irrelevant spatial features along the vertical waterway direction, reduces interference from redundant information, and thereby enhances the accuracy of risk identification for linear corridor scenarios at the very foundation of spatial modeling.
At the level of temporal and spatial integration, the multi-scale spatiotemporal convolutional fusion architecture proposed in this study overcomes the limitations inherent in single-scale feature extraction methods. Through parallel multi-scale convolutional computations, the approach can both capture short-term risk abrupt changes induced by sudden meteorological events or passenger flow disturbances in specific river segments and holistically analyze the long-distance, chain-like risk evolution patterns across the entire waterway, thereby achieving a balanced integration of refined local features with macro-level characteristics across the entire domain. Furthermore, unlike the shallow-matching mode employed in traditional single-channel retrieval architectures, the three-pipeline knowledge-enhanced RAG system developed in this research bridges the gap between structured risk rule-based reasoning and unstructured disaster case-based learning. The dynamic early-warning thresholds, constructed by incorporating two core influencing factors—seasonal variations and holiday-induced fluctuations in passenger flow—effectively address the industry-wide pain points associated with traditional early-warning models, namely the rigidity of fixed thresholds, poor scenario adaptability, and the inability to trace the derivation of composite risk scenarios, thereby ensuring that risk assessment outcomes more accurately reflect the dynamic evolution realities of cultural and tourism corridors.
6.2. Comparative Analysis with Existing Research
An examination of existing research on tourism safety early-warning systems reveals that the development and validation of mainstream models predominantly focus on discrete tourism spaces—such as urban districts or closed mountainous scenic areas. The corresponding model architectures, risk assessment rules, and early-warning threshold systems are well-suited to the discrete, regionally segmented nature of risk distribution; however, they are ill-equipped to capture the axial continuity and asymmetric risk transmission mechanisms inherent in long-distance linear corridors, such as inland waterways [4,10]. At the level of multi-source data fusion, most relevant studies merely perform simple feature concatenation of various monitoring datasets without deeply exploring the coupled relationships or triggering and propagation patterns among meteorological, shipping, passenger flow, and ecological factors. As a result, these models exhibit significant limitations in their ability to fit and predict scenarios involving the characteristic holiday-induced pulse-like passenger flow fluctuations and the combined risks associated with multiple types of disasters in cultural and tourism contexts [11]. Meanwhile, general-purpose large language models and basic RAG architectures are constrained by insufficient specialized corpora in the fields of inland waterway shipping and waterfront cultural tourism; when applied to complex risk scenario simulations, these models are prone to logical inconsistencies and distorted outcomes, making them inadequate for meeting the early-warning requirements of specialized application scenarios [13]. This study addresses the aforementioned limitations in existing research through an integrated design encompassing customized linear spatiotemporal modeling, domain-specific knowledge-enhanced reasoning, and an adaptive dynamic early-warning mechanism. By advancing the intelligent early-warning technology for linear cultural and tourism corridors across three dimensions—risk identification accuracy, scenario simulation interpretability, and practical applicability in engineering implementation—this study provides a replicable and scalable standardized technical framework for the safety management and control of similar major inland waterway projects in China’s cultural and tourism sectors.
6.3. Model Limitations and Future Optimization Directions
Although the early-warning framework developed in this study demonstrates outstanding performance and strong generalizability in the monitoring and early-warning of cultural and tourism risks along the Pinglu Canal, and considering the need for refined management and control in complex cultural and tourism scenarios, the research still has two areas that require urgent improvement. On one hand, this study’s risk assessment is centered on a macro-level, overall risk evaluation conducted at the waterway grid scale; while this approach enables precise identification of regional risk levels and evolution trends, it does not extend to the individual tourist level. There is therefore still room for improvement in the ability to precisely identify and anticipate sudden risks arising from micro-level behaviors, such as tourists deviating from designated trails or localized crowd gatherings. On the other hand, the model’s current strengths lie primarily in short-term, precise early-warning scenarios covering the next 6 h, which adequately meet daily real-time monitoring requirements; however, when applied to medium to long-term risk trend forecasting over a 24–72 h period, the completeness of feature capture diminishes, and the overall predictive accuracy declines significantly.
To address the aforementioned research limitations, future work could involve optimizing and expanding the system across multiple dimensions. First, by integrating refined sensing data, such as video surveillance footage from tourist attractions and tourists’ location trajectories, into the system, a dual-layer early-warning framework combining “macro-level grid-based area assessment” and “micro-level individual behavior recognition” can be established. Video tracking technology can provide continuous, high-frequency vessel motion trajectories and real-time channel crowding status that cannot be captured by discrete AIS sensor records. Different from intermittent AIS reports, video tracking continuously monitors vessel speed, navigation status, and small vessel activities without AIS transponders, which effectively complements missing micro-navigation information in existing multi-source datasets. Integrating video tracking features can further improve the model’s ability to perceive sudden navigation anomalies, enhance early-warning sensitivity for congestion and collision risks, and refine the fine-grained spatiotemporal risk modeling capability of the linear waterway corridor. This would further enhance the precision of risk monitoring and better align with the personalized safety management needs of tourist attractions. Second, by incorporating medium- and long-term meteorological forecast datasets and leveraging time-series diffusion models to optimize the capability for extracting long-sequence features, the current limitations in providing medium- and long-term predictions can be overcome, enabling comprehensive, gradient-based risk early-warning coverage across all time horizons (short-, medium-, and long-term). Additionally, future developments could include the integration of diverse data sources, such as tourist public sentiment data, complaint feedback, and tourist attraction operation and maintenance documentation, to further enrich the multi-source sensing dimensions and continuously refine the holistic intelligent early-warning system for inland linear cultural and tourism corridors.
7. Conclusions and Outlook
7.1. Main Research Findings
This study takes the Pinglu Canal Belt-wide Cultural and Tourism Corridor as its research framework, focusing on the safety management and control challenges associated with linear inland waterway-based cultural and tourism scenarios. Addressing a series of technical challenges, such as the poor adaptability of existing early-warning technologies to linear spatial risks, the misalignment of spatiotemporal baselines in multi-source monitoring data, the lack of interpretability in compound risk scenario simulations, and the limited capability for dynamically adapting fixed early-warning thresholds, the paper proposes a Knowledge-Enhanced Multi-Source Fusion Intelligent Early-Warning Framework (KE-MFEWF). Through a series of comparative experiments, module ablation experiments, cross-basin generalization validation, and model interpretability analyses, the effectiveness and practicality of the proposed framework are systematically demonstrated. The core research findings are as follows:
(1) The MSTF-Net multi-scale spatiotemporal fusion network, independently designed in this study, leverages an asymmetric linear corridor attention mechanism to precisely capture the core pattern of unidirectional chain-based risk propagation along inland waterways—both upstream and downstream—and effectively filters out linearly spatially irrelevant redundant features. Compared to mainstream time-series prediction models such as Informer and TimesNet, the proposed method achieves a 6.8% improvement in the overall composite risk prediction AUC metric; this breakthrough effectively addresses the technical challenge faced by general-purpose time-series models when adapting to linear spatial cultural and tourism scenarios, thereby significantly enhancing the accuracy of linear spatial risk modeling.
(2) The knowledge graph constructed in this paper, combined with an RAG reasoning architecture for collaborative retrieval using a multi-pipeline vector database, effectively addresses the inherent limitations of general-purpose large language models, namely, the scarcity of domain-specific expertise and the tendency for risk reasoning to generate hallucinations. The dynamic early-warning threshold system, developed by integrating two factors—seasonal variations and fluctuations in tourist traffic during public holidays—can precisely accommodate the pulsed risk fluctuation characteristics inherent in tourism scenarios. As a result, both the false-positive rate and the false-negative rate are kept at 0.6%, significantly enhancing the professionalism and scenario adaptability of the composite risk assessment approach, while resolving the rigidity associated with traditional fixed-threshold early-warning models.
(3) To address the industry-wide challenge of scarce long-term field-measurement monitoring samples during the construction phase of the Pinglu Canal, this paper innovatively proposes a hybrid dataset construction methodology comprising “field measurement collection—numerical simulation—cross-domain migration,” complemented by a comprehensive data fidelity verification mechanism, thereby effectively ensuring the authenticity and validity of both derived and migrated datasets. This data construction approach is applicable to a wide range of newly constructed large-scale linear water transport projects and can serve as a standardized data construction and verification framework for pre-construction intelligent early-warning research on similar projects.
(4) After undergoing INT8 quantization and lightweight processing, this model is well-suited for deployment in cloud-edge collaborative engineering scenarios; the single-inference latency at the edge device can be kept below 0.3 s, meeting the real-time requirements of field monitoring. Furthermore, during the cross-basin generalization test conducted on the Xijiang Navigation and Cultural Tourism River Section, the model achieved an AUC accuracy of 92.8%, fully demonstrating the framework’s outstanding generalization and transferability capabilities. While ensuring high prediction accuracy, this model possesses significant engineering deployment value and broad applicability across various scenarios.
7.2. Research Outlook
With the official commencement of navigation operations on the Pinglu Canal, the cultural and tourism resources along its route will undergo continuous and in-depth development; tourist activities, sightseeing patterns, and navigation scenarios will become increasingly diverse. Correspondingly, the types of tourism safety risks and their evolution mechanisms will become more complex, and the demand for refined, comprehensive, and real-time intelligent early-warning and management systems will continue to grow. Building upon the findings and limitations of this study, future research will further deepen and expand its scope across three key dimensions.
First, expand the dimensionality of multi-source sensing data by integrating micro-level monitoring data, such as video imagery and tourist positioning trajectories, to establish a two-tiered early-warning system that combines macro-level regional risk assessment with micro-level tourist behavior recognition. This enables an upgrade from “overall regional early warning” to “precision individual alerts,” further enhancing the sophistication of cultural and tourism safety management and control. Next, optimize the model’s long-term time-series forecasting capability by incorporating medium- and long-term meteorological forecast data alongside time-series diffusion algorithms, thereby strengthening the model’s ability to capture long-range time-series dependency patterns. This facilitates the development of a comprehensive, gradient-based early-warning mechanism covering short-, medium-, and long-term time horizons, thereby refining the full-cycle risk prevention and control framework. Finally, leveraging the existing algorithmic framework, build an integrated visual intelligent early-warning platform that integrates core functionalities, including real-time data monitoring, intelligent composite risk simulation, risk causality tracing, emergency information dissemination, and decision support for operational management, thereby truly achieving digital, intelligent, and refined safety management and control for all-for-one tourism operations along the Pinglu Canal, and providing robust technical support for the high-quality integrated development of culture and tourism along the New Western Land–Sea Trade Corridor, as well as for the long-term safe operation and maintenance of water transport projects.
Author Contributions
Conceptualization, Y.O., W.D. and T.L.; methodology, Y.O.; software, L.O.; validation, Y.O. and X.Z.; formal analysis, X.Z.; investigation, W.D. and Q.Z.; data curation, Q.Z.,T.L. and Y.Z.; writing—original draft preparation, Y.O.; writing—review and editing, W.D. and T.L.; visualization, L.O.; supervision, Y.Z.; project administration, Y.O., Q.Z. and Y.Z.; funding acquisition, W.D. All authors have read and agreed to the published version of the manuscript.
Funding
This study was funded by the Guangxi Science and Technology Major Project (Research on Key Technologies for Green Corridor Construction No. Guike AA23062039-3).
Institutional Review Board Statement
Not applicable.
Informed Consent Statement
Not applicable.
Data Availability Statement
The data presented in this study are available on request from the corresponding author.
Conflicts of Interest
Tian Lan and Yiming Zhou were employed by Guangxi Pinglu Canal Digital Intelligence Technology Co., Ltd. and Guangxi Laboratory of Modern Canal, Pinglu Canal Group Co., Ltd. The remaining authors declare that the research was conducted in the absence of any commercial or financial relationships that could be construed as a potential conflict of interest.
References
- Nie, R.-X.; Wu, C.; Liang, H.-M. Exploring Appropriate Search Engine Data for Interval Tourism Demand Forecasting Responding a Public Crisis in Macao: A Combined Bayesian Model. Sustainability 2024, 16, 6892. [Google Scholar] [CrossRef] [Scilit]
- Wu, Y.; Cheng, Y.; Chen, S.; Li, S. A Study on Fire Prediction and Prevention and Control Optimization for Mountainous Tourism-Driven Cities Based on Deep Learning. J. Saf. Environ. Sci. 2025, 10, 1709. [Google Scholar] [CrossRef]
- Pei, Y.; Huang, C.-J.; Shen, Y.; Ma, Y. An Ensemble Model with Adaptive Variational Mode Decomposition and Multivariate Temporal Graph Neural Network for PM2.5 Concentration Forecasting. Sustainability 2022, 14, 13191. [Google Scholar] [CrossRef] [Scilit]
- Wei, G. Research on Tourism Safety Risk Assessment and Early Warning Systems for the Gansu–Qinghai Grand Loop Route. Master’s Thesis, Northwest Normal University, Lanzhou, China, 2025. [Google Scholar] [CrossRef]
- Li, C.; Xie, Z.; Yang, X. Research on the Construction of Tourism Meteorological Intelligent Agents and Innovation of Service Models—A Case Study of Fujian Province. In Proceedings of the Academic Exchange Event at the 19th China Meteorological Modernization Science and Technology Expo; Chinese Meteorological Society: Fuzhou, China, 2026; p. 25. [Google Scholar] [CrossRef]
- Blešić, I.; Ivkov, M.; Tepavčević, J.; Popov Raljić, J.; Petrović, M.D.; Gajić, T.; Tretiakova, T.N.; Syromiatnikova, J.A.; Demirović Bajrami, D.; Aleksić, M.; et al. Risky Travel? Subjective vs. Objective Perceived Risks in Travel Behaviour—Influence of Hydro-Meteorological Hazards in South-Eastern Europe on Serbian Tourists. Atmosphere 2022, 13, 1671. [Google Scholar] [CrossRef] [Scilit]
- Chen, B.; Zhu, Y.; He, X.; Zhou, C. Analysis of High-Quality Tourism Destinations Based on Spatiotemporal Big Data—A Case Study of Urumqi. Land 2023, 12, 1425. [Google Scholar] [CrossRef] [Scilit]
- Li, F.; Li, B. Evaluation of the Dissemination Effectiveness of Early Warning Information for Extreme Meteorological Events in Natural Tourism Scenic Areas and Optimization Paths. In Proceedings of the Second Academic Exchange Conference on Innovation and Development in Emergency Early Warning Technology and Management; Chinese Meteorological Society: Taiyuan, China, 2026; pp. 195–196. [Google Scholar]
- Zhai, W.; Zhu, J.; Xue, Y.; Sun, Z.; Li, Y.; Yang, A.; Huang, X.; Wang, H.; Yan, L.; Tian, Z. Design of an Intelligent Marine Environmental Monitoring and Early Warning System for Drowning Prevention in Coastal Tourism Areas. Mar. Dev. Manag. 2025, 42, 131–136. [Google Scholar] [CrossRef]
- Wu, M. Research on Tourism Ecological Security Assessment and Early Warning Systems for Prefecture-Level Cities in the Upper Yellow River Basin. Master’s Thesis, Northwest Normal University, Lanzhou, China, 2024. [Google Scholar] [CrossRef]
- Shi, D.; Huang, Z.; Li, F. A Study on Tourism Scale Forecasting Using Multi-Source Heterogeneous Data Fusion. Resour. Environ. Arid. Reg. 2022, 36, 175–182. [Google Scholar] [CrossRef]
- Chen, W.; Zhang, H.; Jin, D. Design and Implementation of a Retrieval-Augmented Generation Knowledge Base Q&A System Based on LangChain. Comput. Era 2026, 51–56. [Google Scholar] [CrossRef]
- Lu, C. Construction and Application of a Carbon Knowledge Base Driven by Large Language Models. Comput. Syst. Appl. 2025, 34, 75–88. [Google Scholar] [CrossRef]
- Wang, Z.; Wang, Z.H.; Huang, H.C.; Chen, J. Research on an Intelligent Q&A Model for Emergency Flood Response Decision-Making Based on a Real-Time Knowledge Base. Disaster Sci. 2025, 40, 132–137. [Google Scholar] [CrossRef]
- Liu, C.-H.; Yang, T.-H.; Wijaya, O.T. Development of an Artificial Neural Network Algorithm Embedded in an On-Site Sensor for Water Level Forecasting. Sensors 2022, 22, 8532. [Google Scholar] [CrossRef] [Scilit]
- Zhu, H. Research on Optimization of Smart Tourism Management Based on the Internet of Things. Ph.D. Thesis, Beijing University of Posts and Telecommunications, Beijing, China, 2023. [Google Scholar] [CrossRef]
- Li, H. Research on Emergency Management for Tourism Incident Response in Qinghai Province’s Tourist Attractions. Master’s Thesis, Qinghai Normal University, Xining, China, 2022. [Google Scholar] [CrossRef]
- Tang, R.; Huang, C.; Zhao, X.; Tang, Y. Research on Smart Tourism Oriented Sensor Network Construction and Information Service Mode. Sensors 2022, 22, 10008. [Google Scholar] [CrossRef] [Scilit]
- Ma, R.; Lyu, Y.; Chen, T.; Zhang, Q. Preliminary Risk Assessment of Geological Disasters in Qinglong Gorge Scenic Area of Taihang Mountain with GIS Based on Analytic Hierarchy Process and Logistic Regression Model. Sustainability 2023, 15, 15752. [Google Scholar] [CrossRef] [Scilit]
- Dong, B.; Yang, J. Design and Development of a Transportation Monitoring and Early Warning Platform for Tourism Cities. Fujian Comput. 2023, 39, 94–97. [Google Scholar] [CrossRef]
- Tian, J.; Zhang, Y.; Yan, D.; Xu, S.; Duan, J.; Li, J. Exploration of the Application of Large AI Models in Mountain Flood Disaster Risk Identification and Early Warning. Chin. J. Water Resour. Hydraul. 2026, 57, 675–690. [Google Scholar] [CrossRef] [Scilit]
- Zou, M.; Chen, J.; Gong, S. A Multi-Source Heterogeneous Data Integration and Cleaning Method Based on Large Language Models. Digit. Technol. Appl. 2025, 43, 217–219. [Google Scholar]
- Chen, X.; Liu, Y.; Lin, X.; Cheng, Y. Construction of an Early Warning System for Crowding at Tourist Attractions During Large-Scale Events: A Case Study of the May Fourth Square Light Show. Urban Constr. 2022, 19, 54–57. [Google Scholar] [CrossRef]
- Plank, P.A.; Gomes, L.F.; Caldas, P.; Varela, M.; Ferreira, D.C. Assessing the Traveling Risks Perceived by South African Travelers during Pandemic Outbreaks: The Case of COVID-19. Sustainability 2023, 15, 9267. [Google Scholar] [CrossRef] [Scilit]
- Chen, M.; Zheng, L.; Zhang, D.; Li, J. Spatio-Temporal Evolution and Obstacle Factors Analysis of Tourism Ecological Security in Huanggang Dabieshan UNESCO Global Geopark. Int. J. Environ. Res. Public Health 2022, 19, 8670. [Google Scholar] [CrossRef] [Scilit]
- Luo, L.; Lan, J.; Wang, Y.; Li, H.; Wu, Z.; McBridge, C.; Zhou, H.; Liu, F.; Zhang, R.; Gong, F.; et al. A Novel Early Warning System (EWS) for Water Quality, Integrating a High-Frequency Monitoring Database with Efficient Data Quality Control Technology at a Large and Deep Lake (Lake Qiandao), China. Water 2022, 14, 602. [Google Scholar] [CrossRef] [Scilit]
- Reklitis, D.P.; Terzi, M.C.; Sakas, D.P.; Konstantopoulou, C.K. Customer Behaviour in Response to Disaster Announcements: A Big Data Analysis of Digital Marketing in Hospitality. Tour. Hosp. 2025, 6, 112. [Google Scholar] [CrossRef] [Scilit]
- Hui, Y. Research on Tourism Risk Assessment and Travel Decision-Making Based on Text Mining—A Case Study of the Xinjiang Region in China. Master’s Thesis, Shandong University, Jinan, China, 2025. [Google Scholar] [CrossRef]
- Zhang, S.; Chen, A. Do Different Queue Formations Influence the Overestimation of Tourism Carrying Capacity? Sustainability 2024, 16, 11047. [Google Scholar] [CrossRef] [Scilit]
- Chang, H.; Xu, T.; Li, F. A Multidimensional Feature-Based Text Complexity Framework and a Knowledge Base Enhancement Model. J. Agric. Libr. Inf. Sci. 2025, 37, 61–77. [Google Scholar] [CrossRef]
- Zhang, S.N. Research on a Tourism Attractions Transportation Accessibility Model Based on Multi-Source Data. Master’s Thesis, Chongqing Jiaotong University, Chongqing, China, 2025. [Google Scholar] [CrossRef]
- Zhang, Y. Research on the Optimization of the Tourism Public Safety Emergency Management System in Xuzhou City. Mod. Commer. Ind. 2026, 47, 26–29. [Google Scholar] [CrossRef]
- Sang, M.; Zhang, Q.; Wang, S. Predicting the Air Quality Index Using a Combination of Adaptive Modal Decomposition and Integrated Deep Learning. Environ. Sci. Technol. 2026, 49, 71–82. [Google Scholar] [CrossRef]
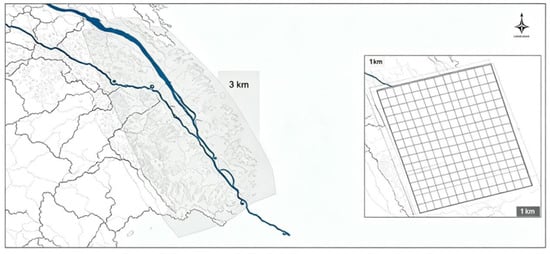
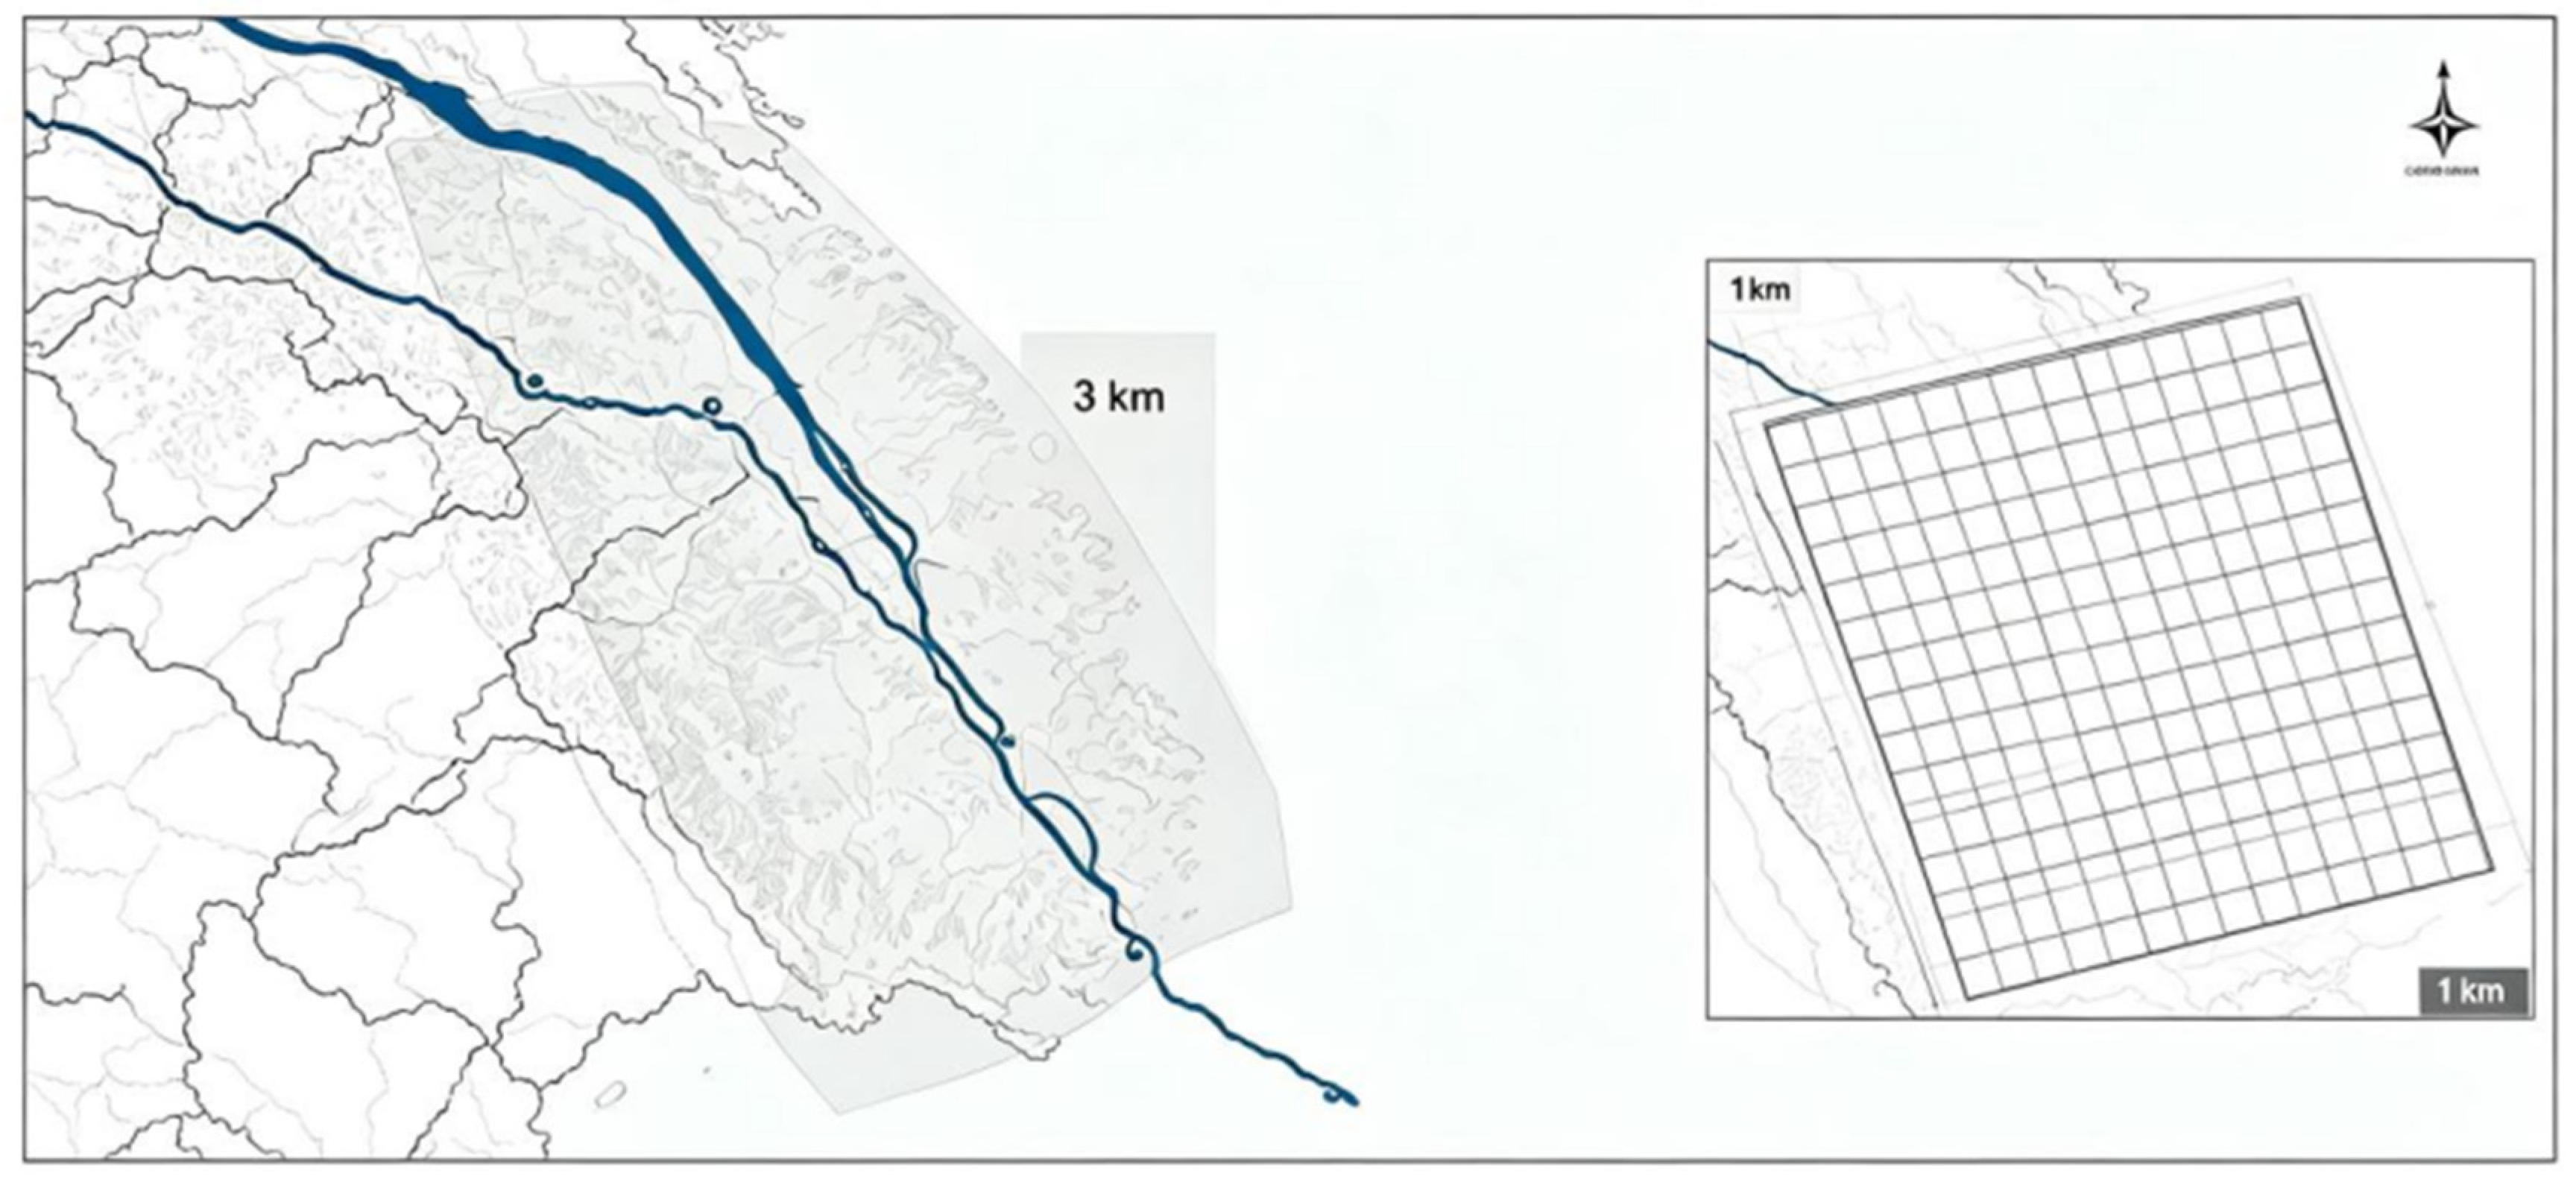
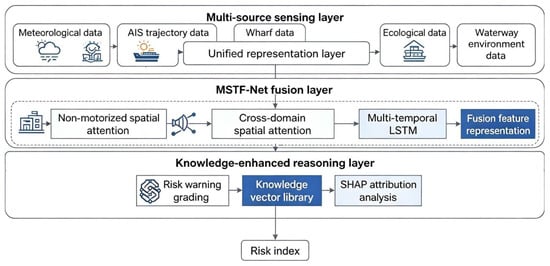
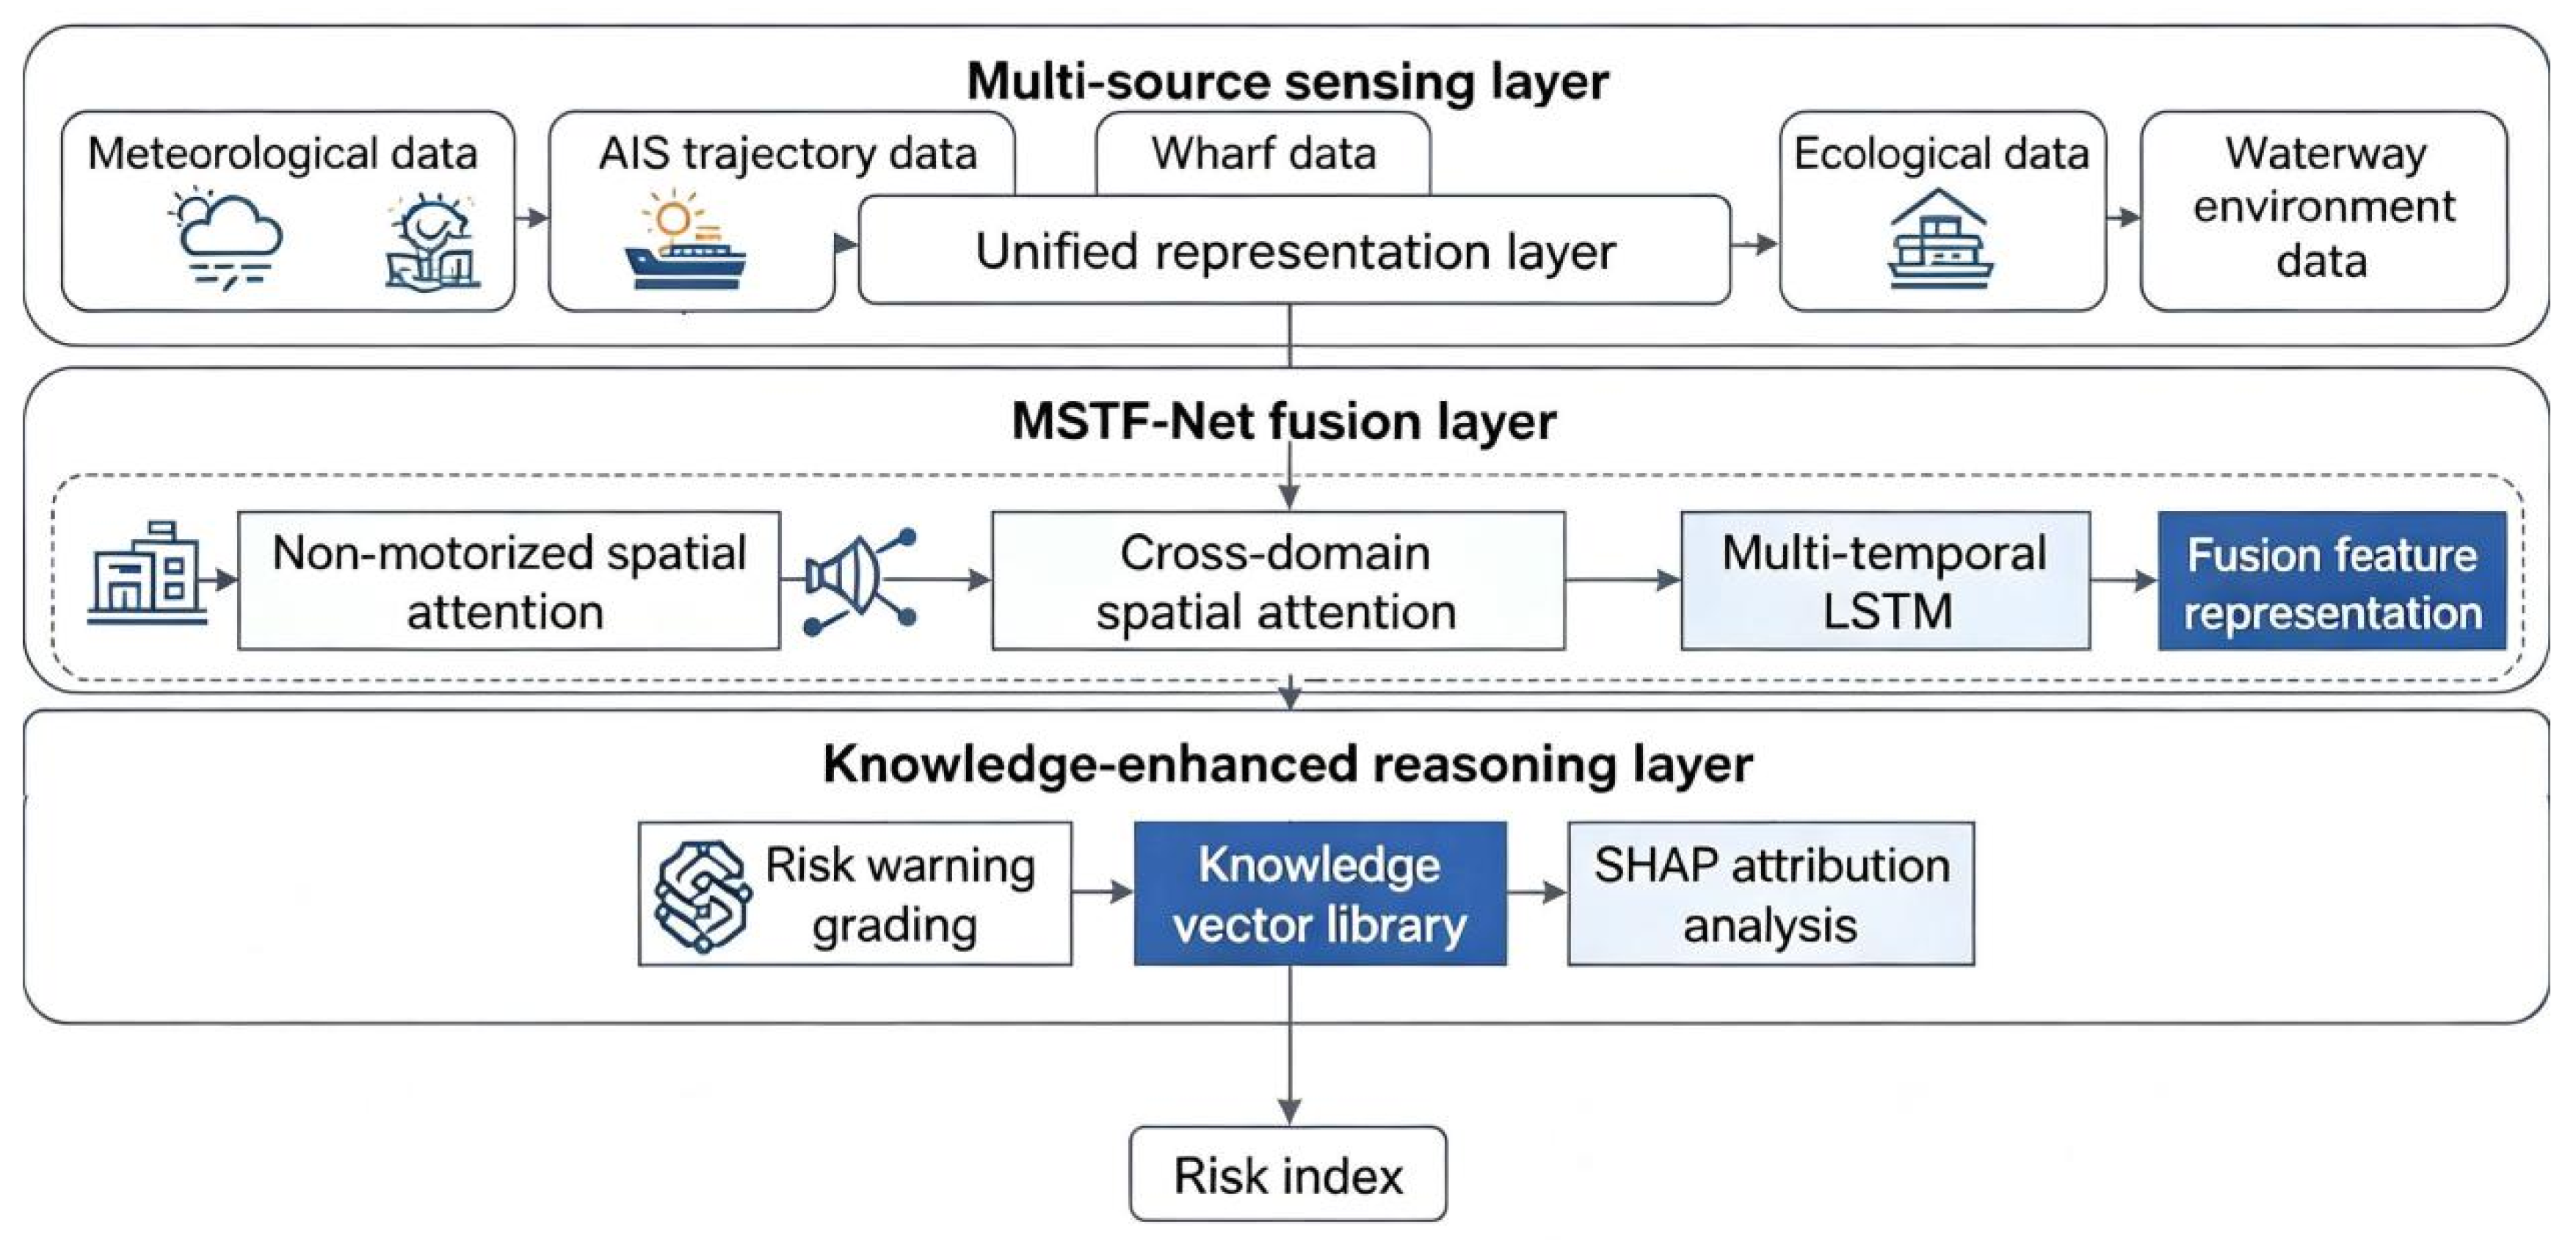
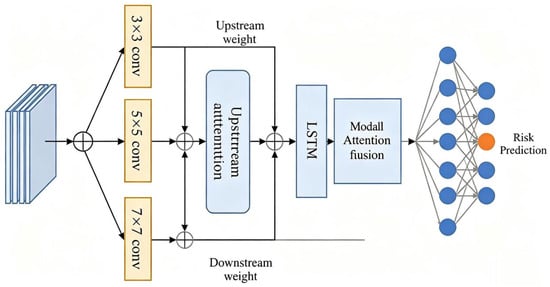
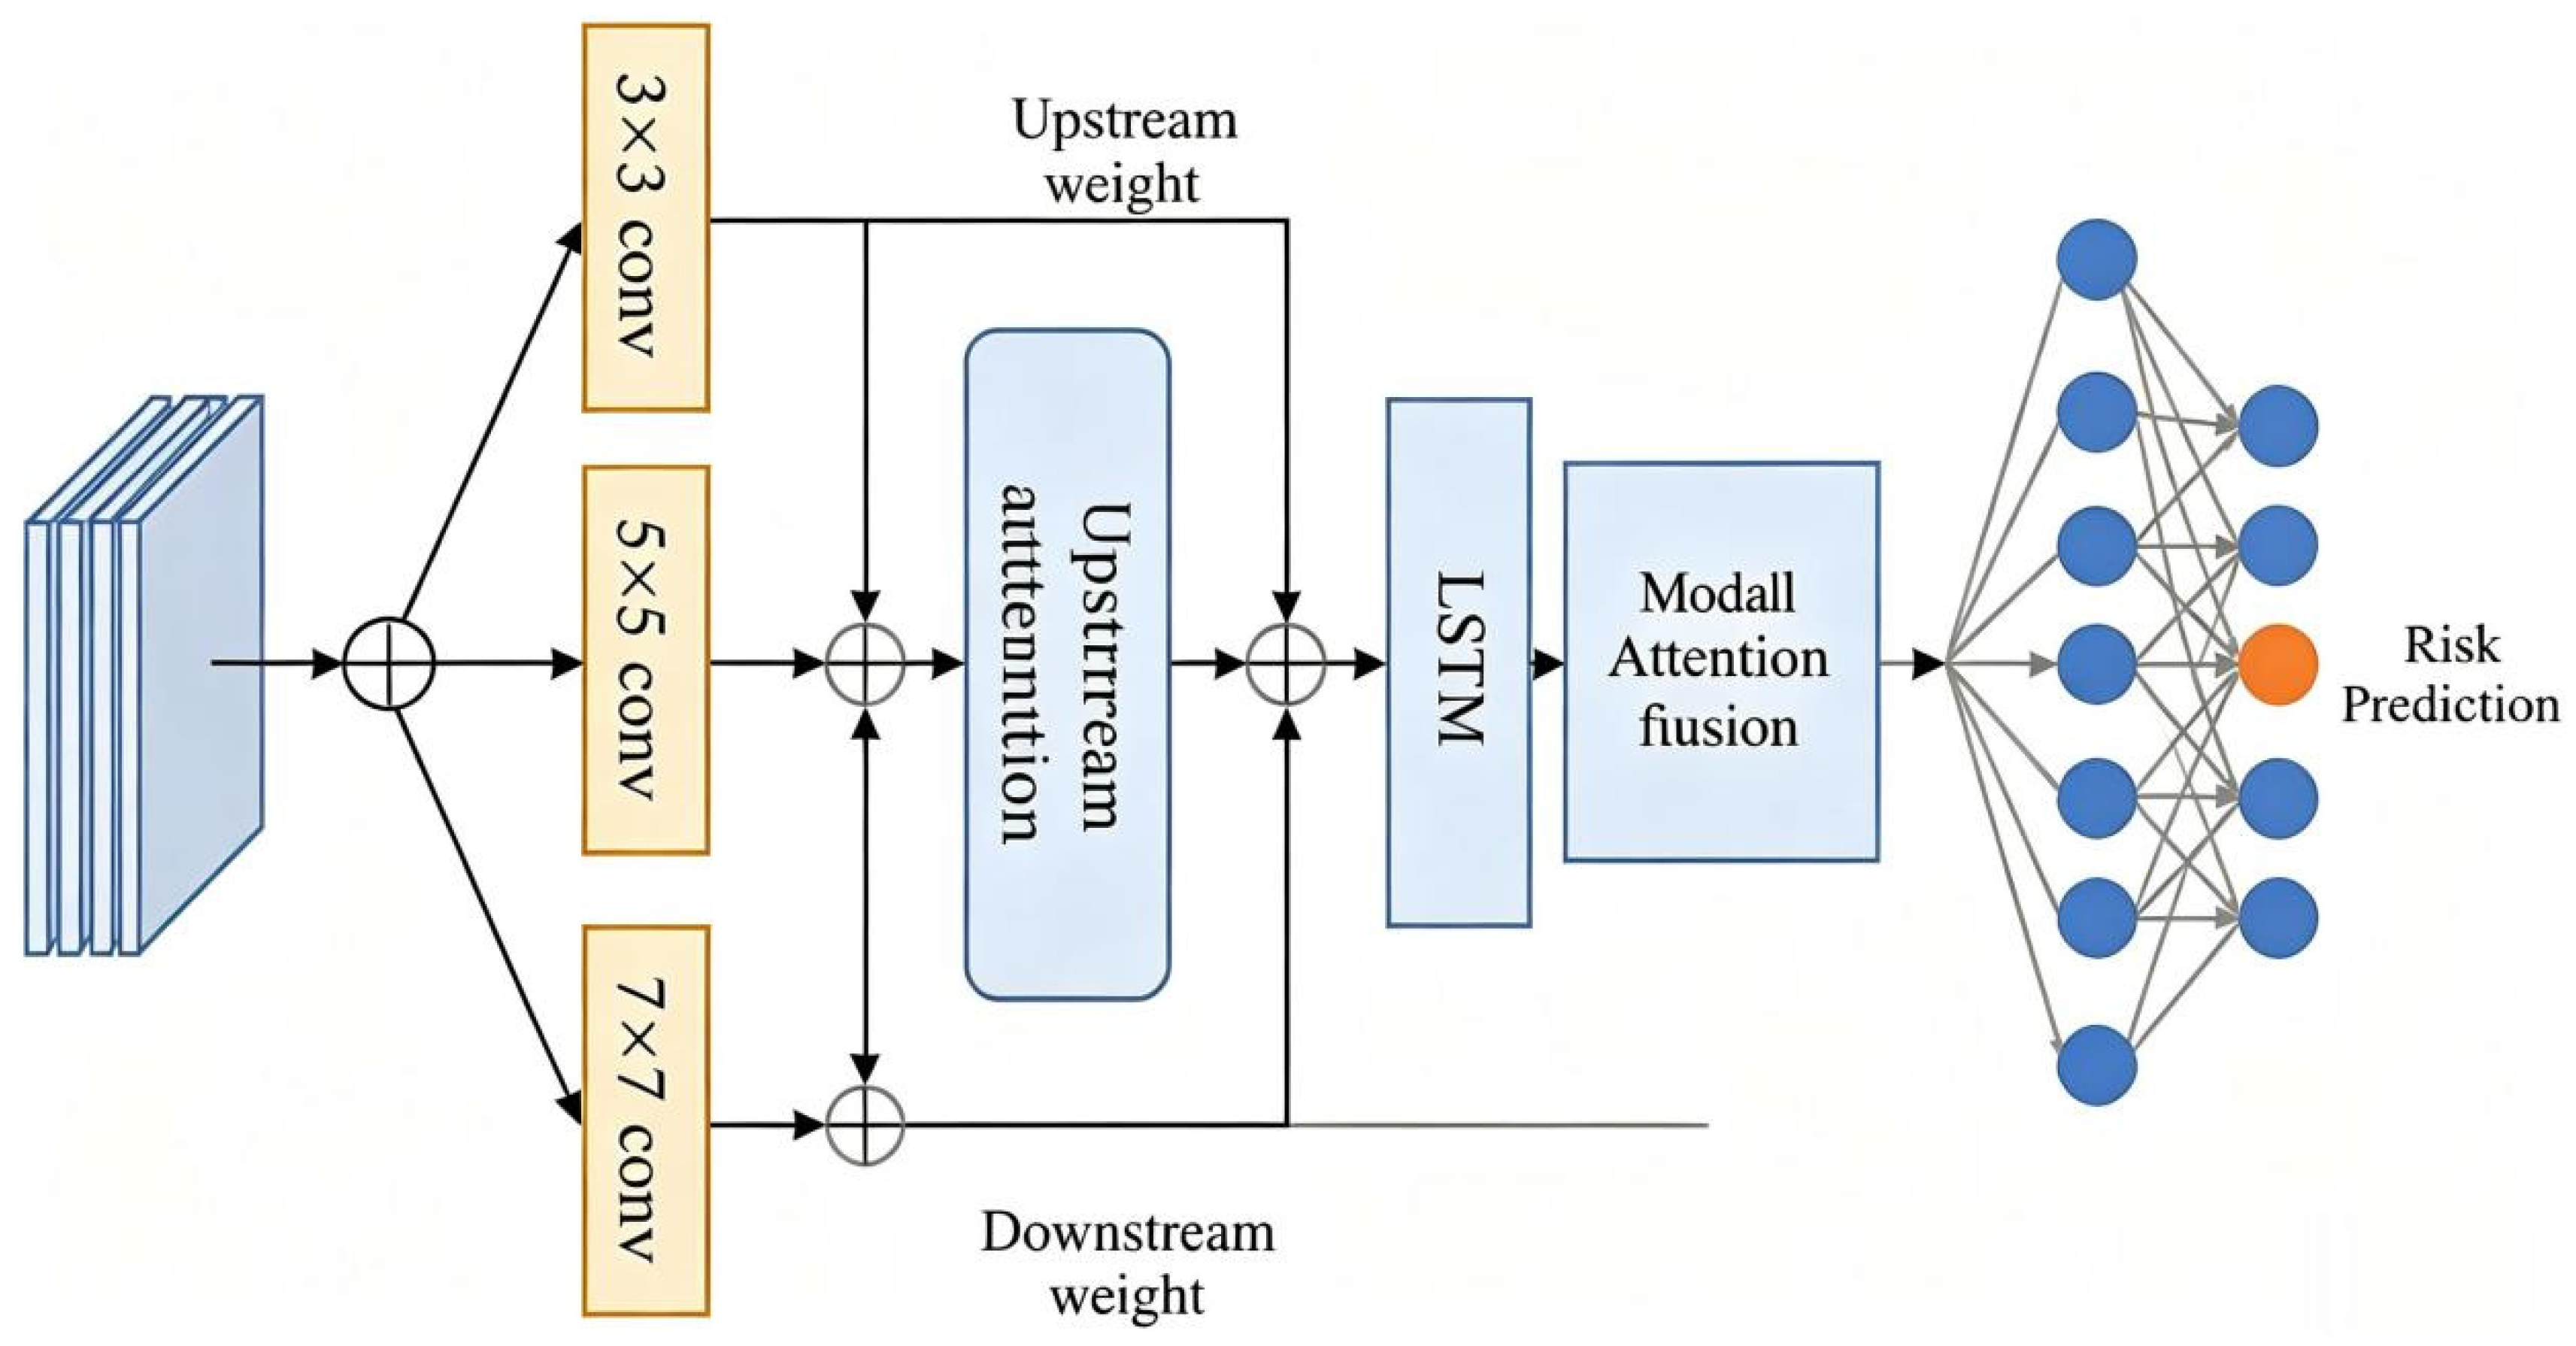
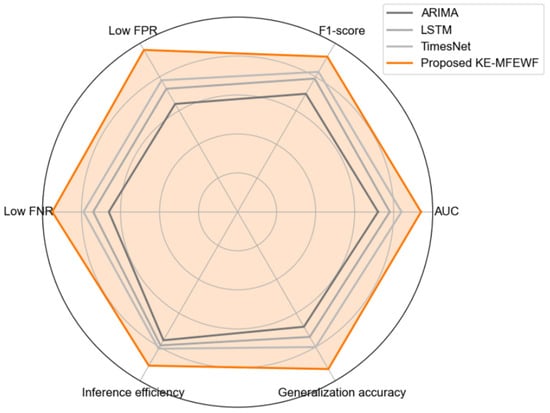
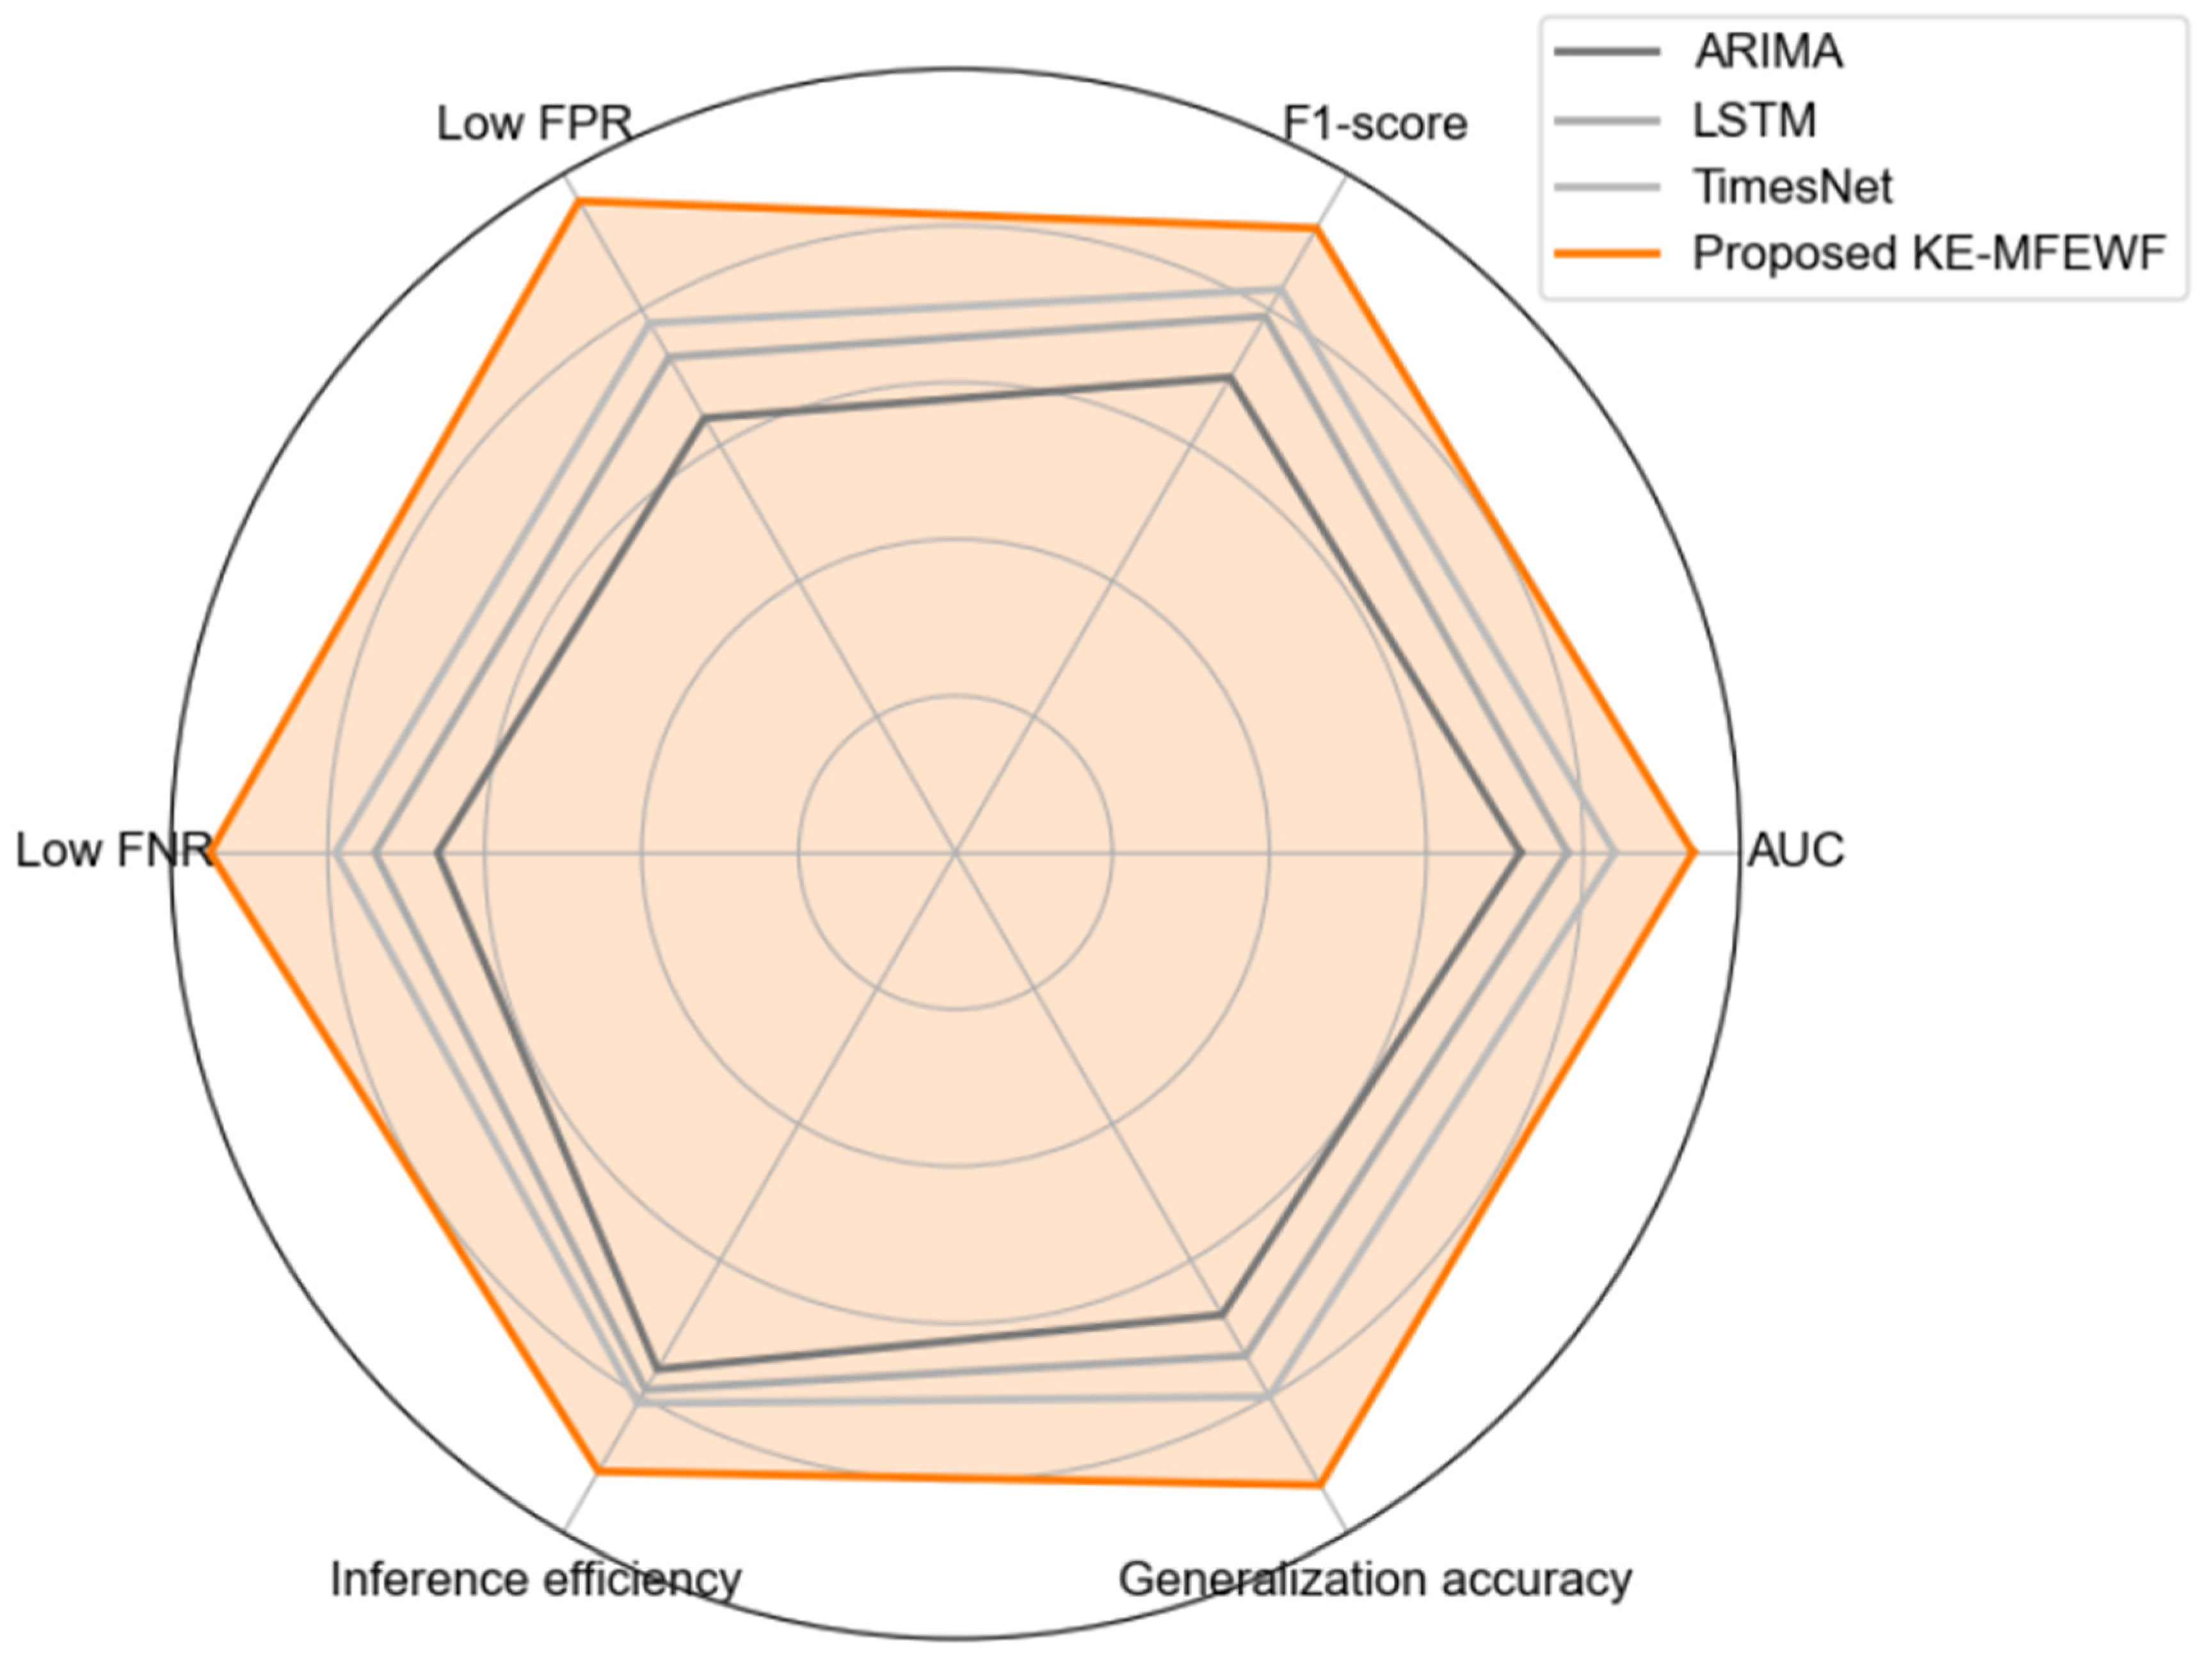
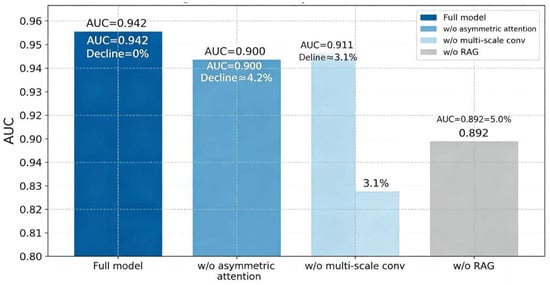
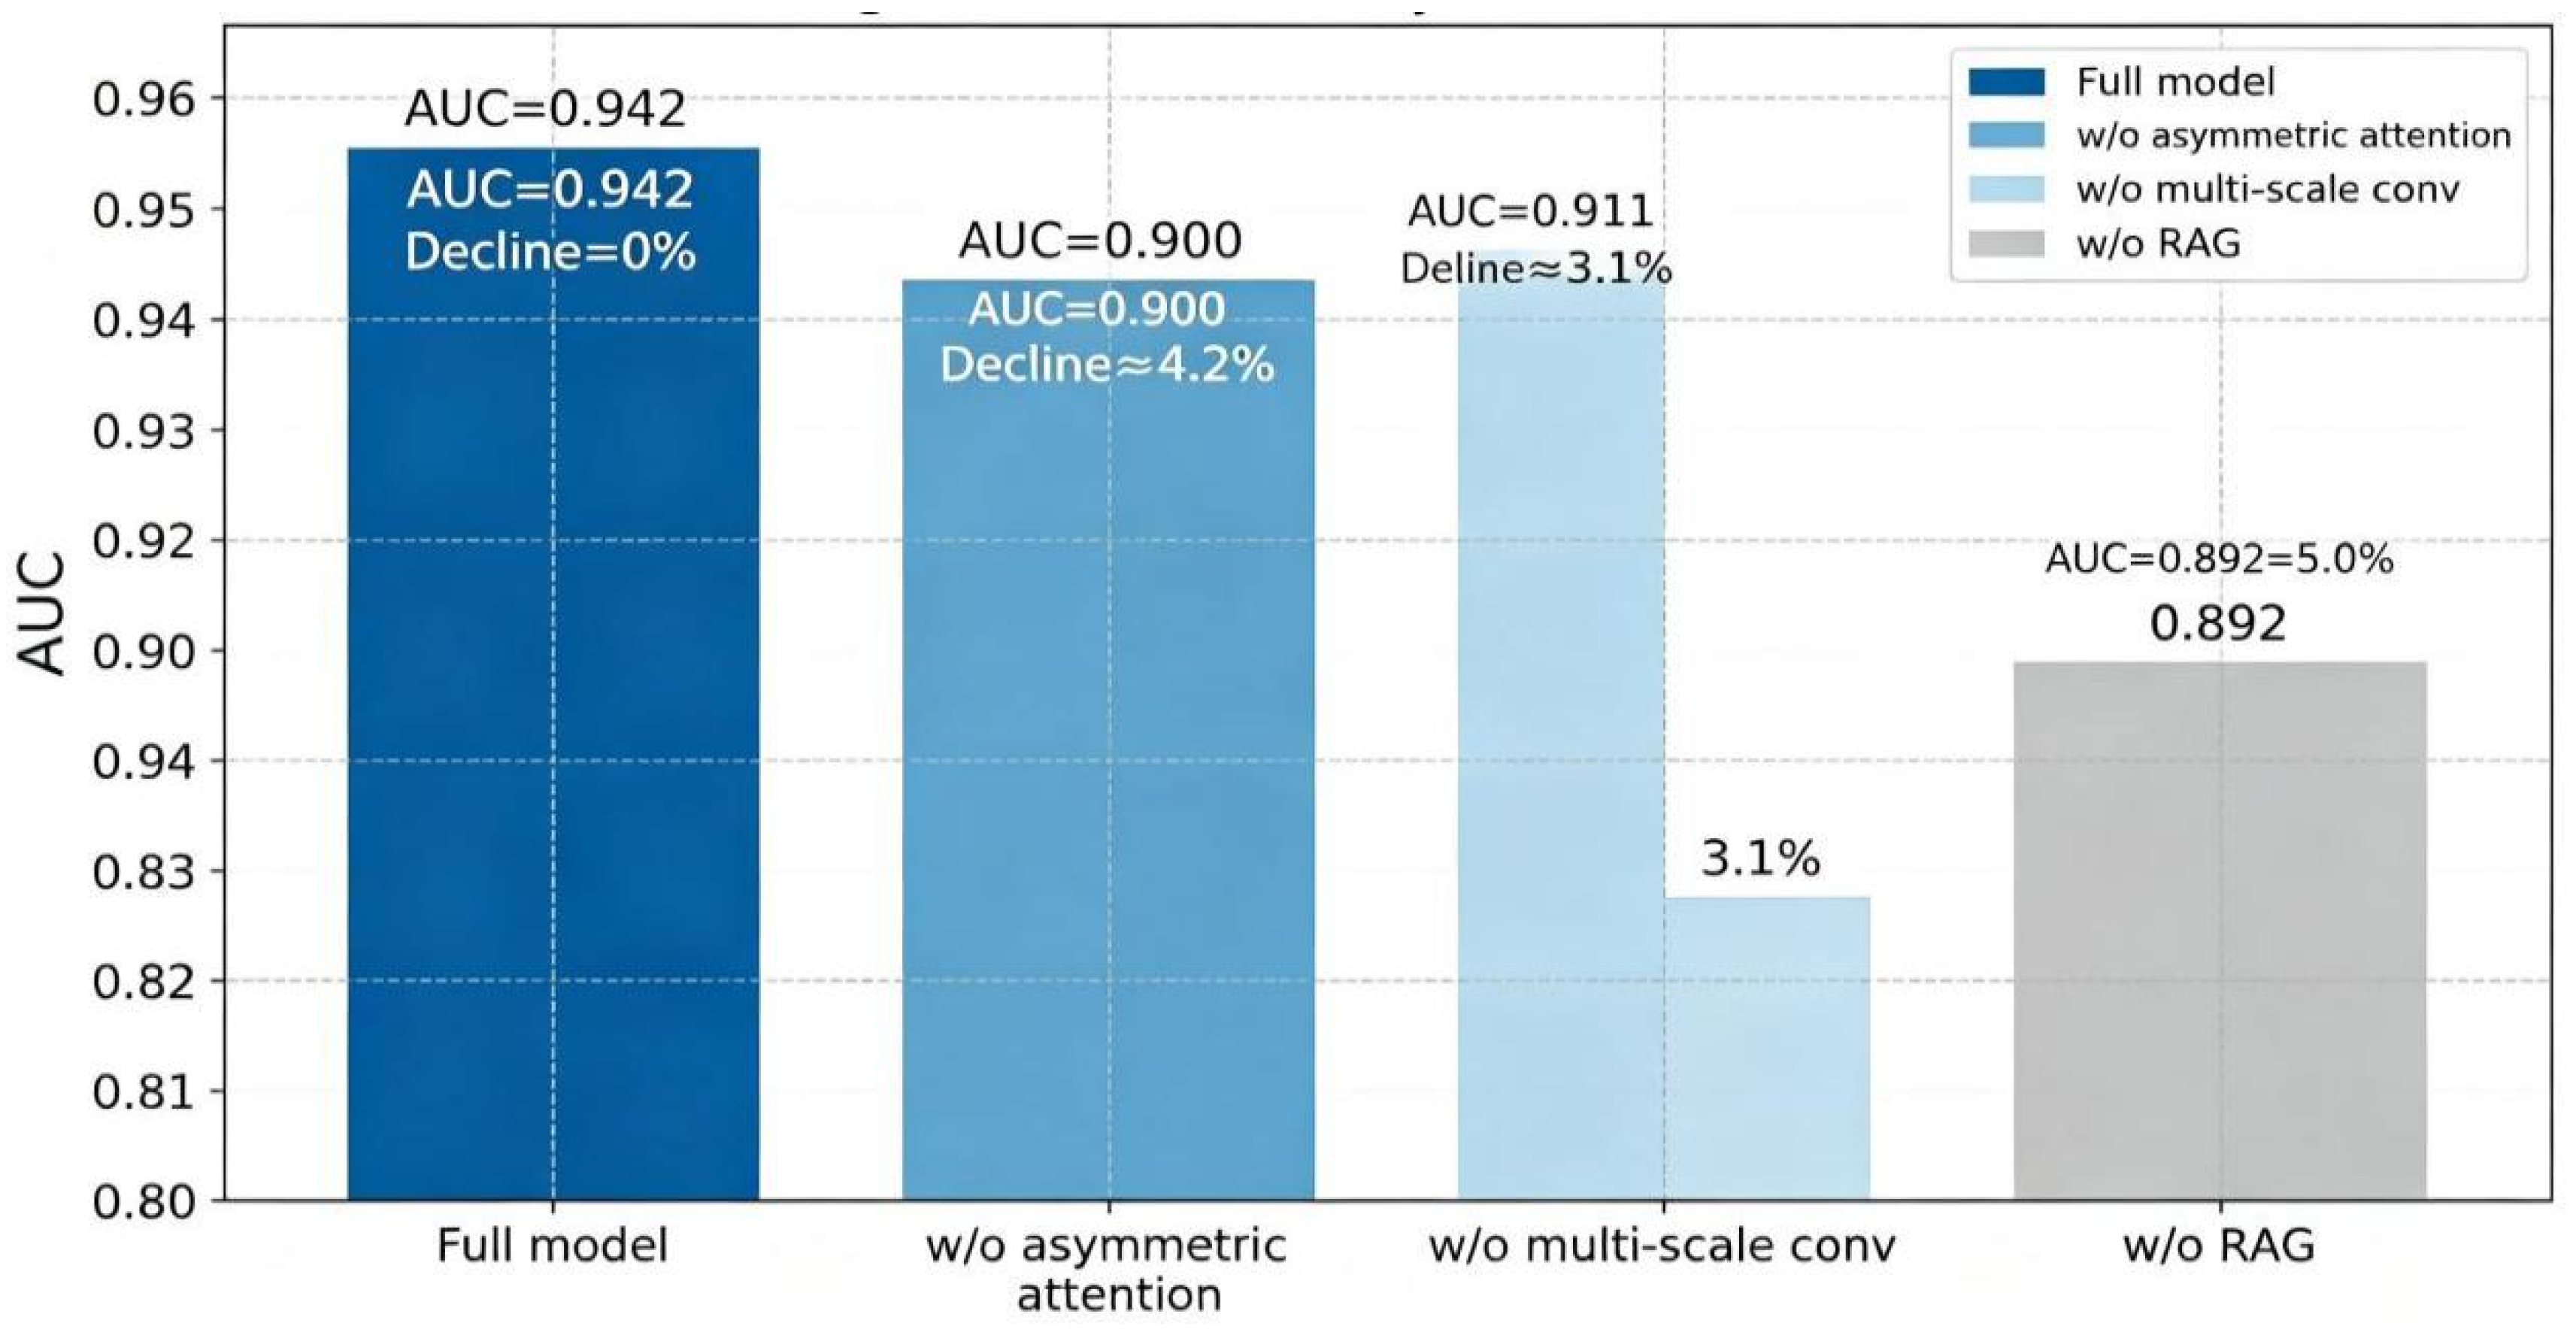
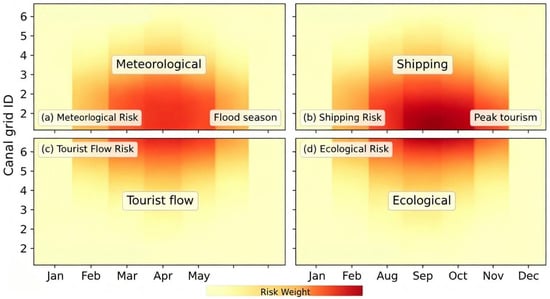
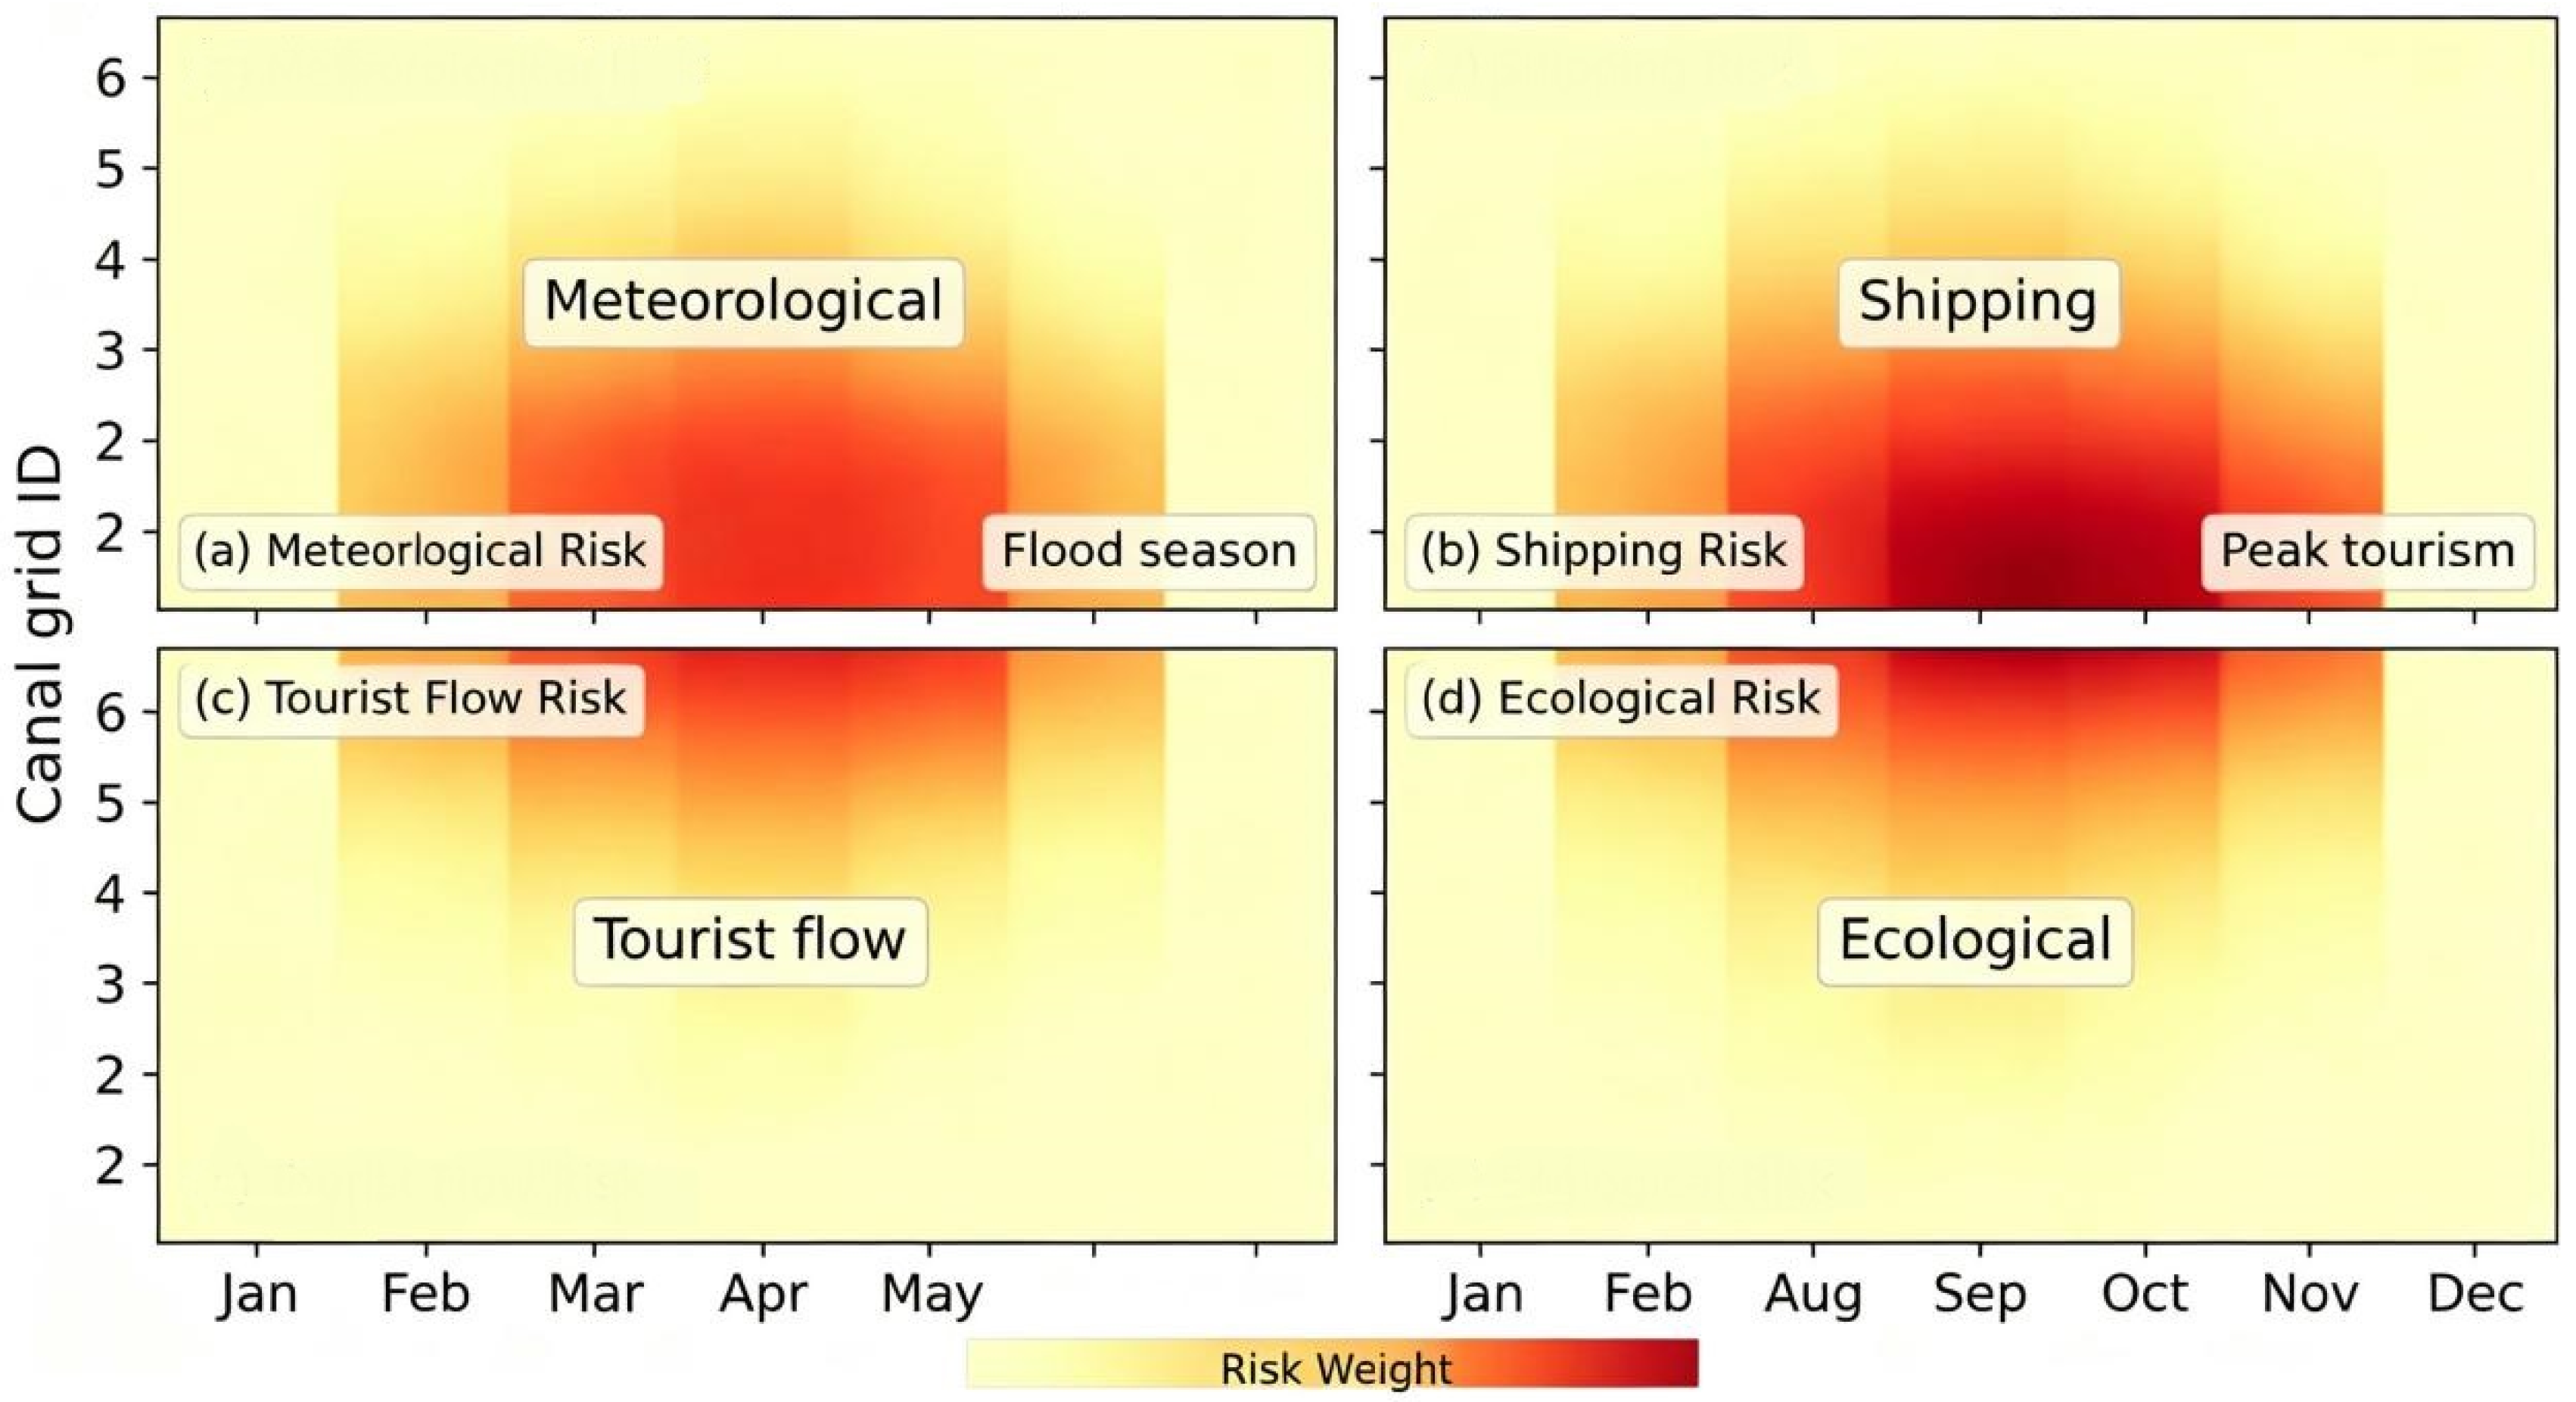
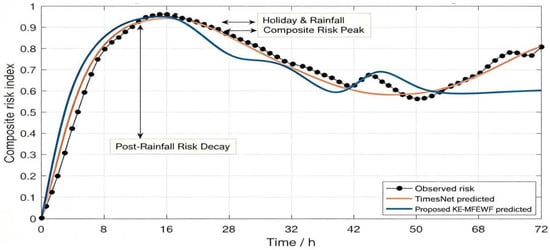
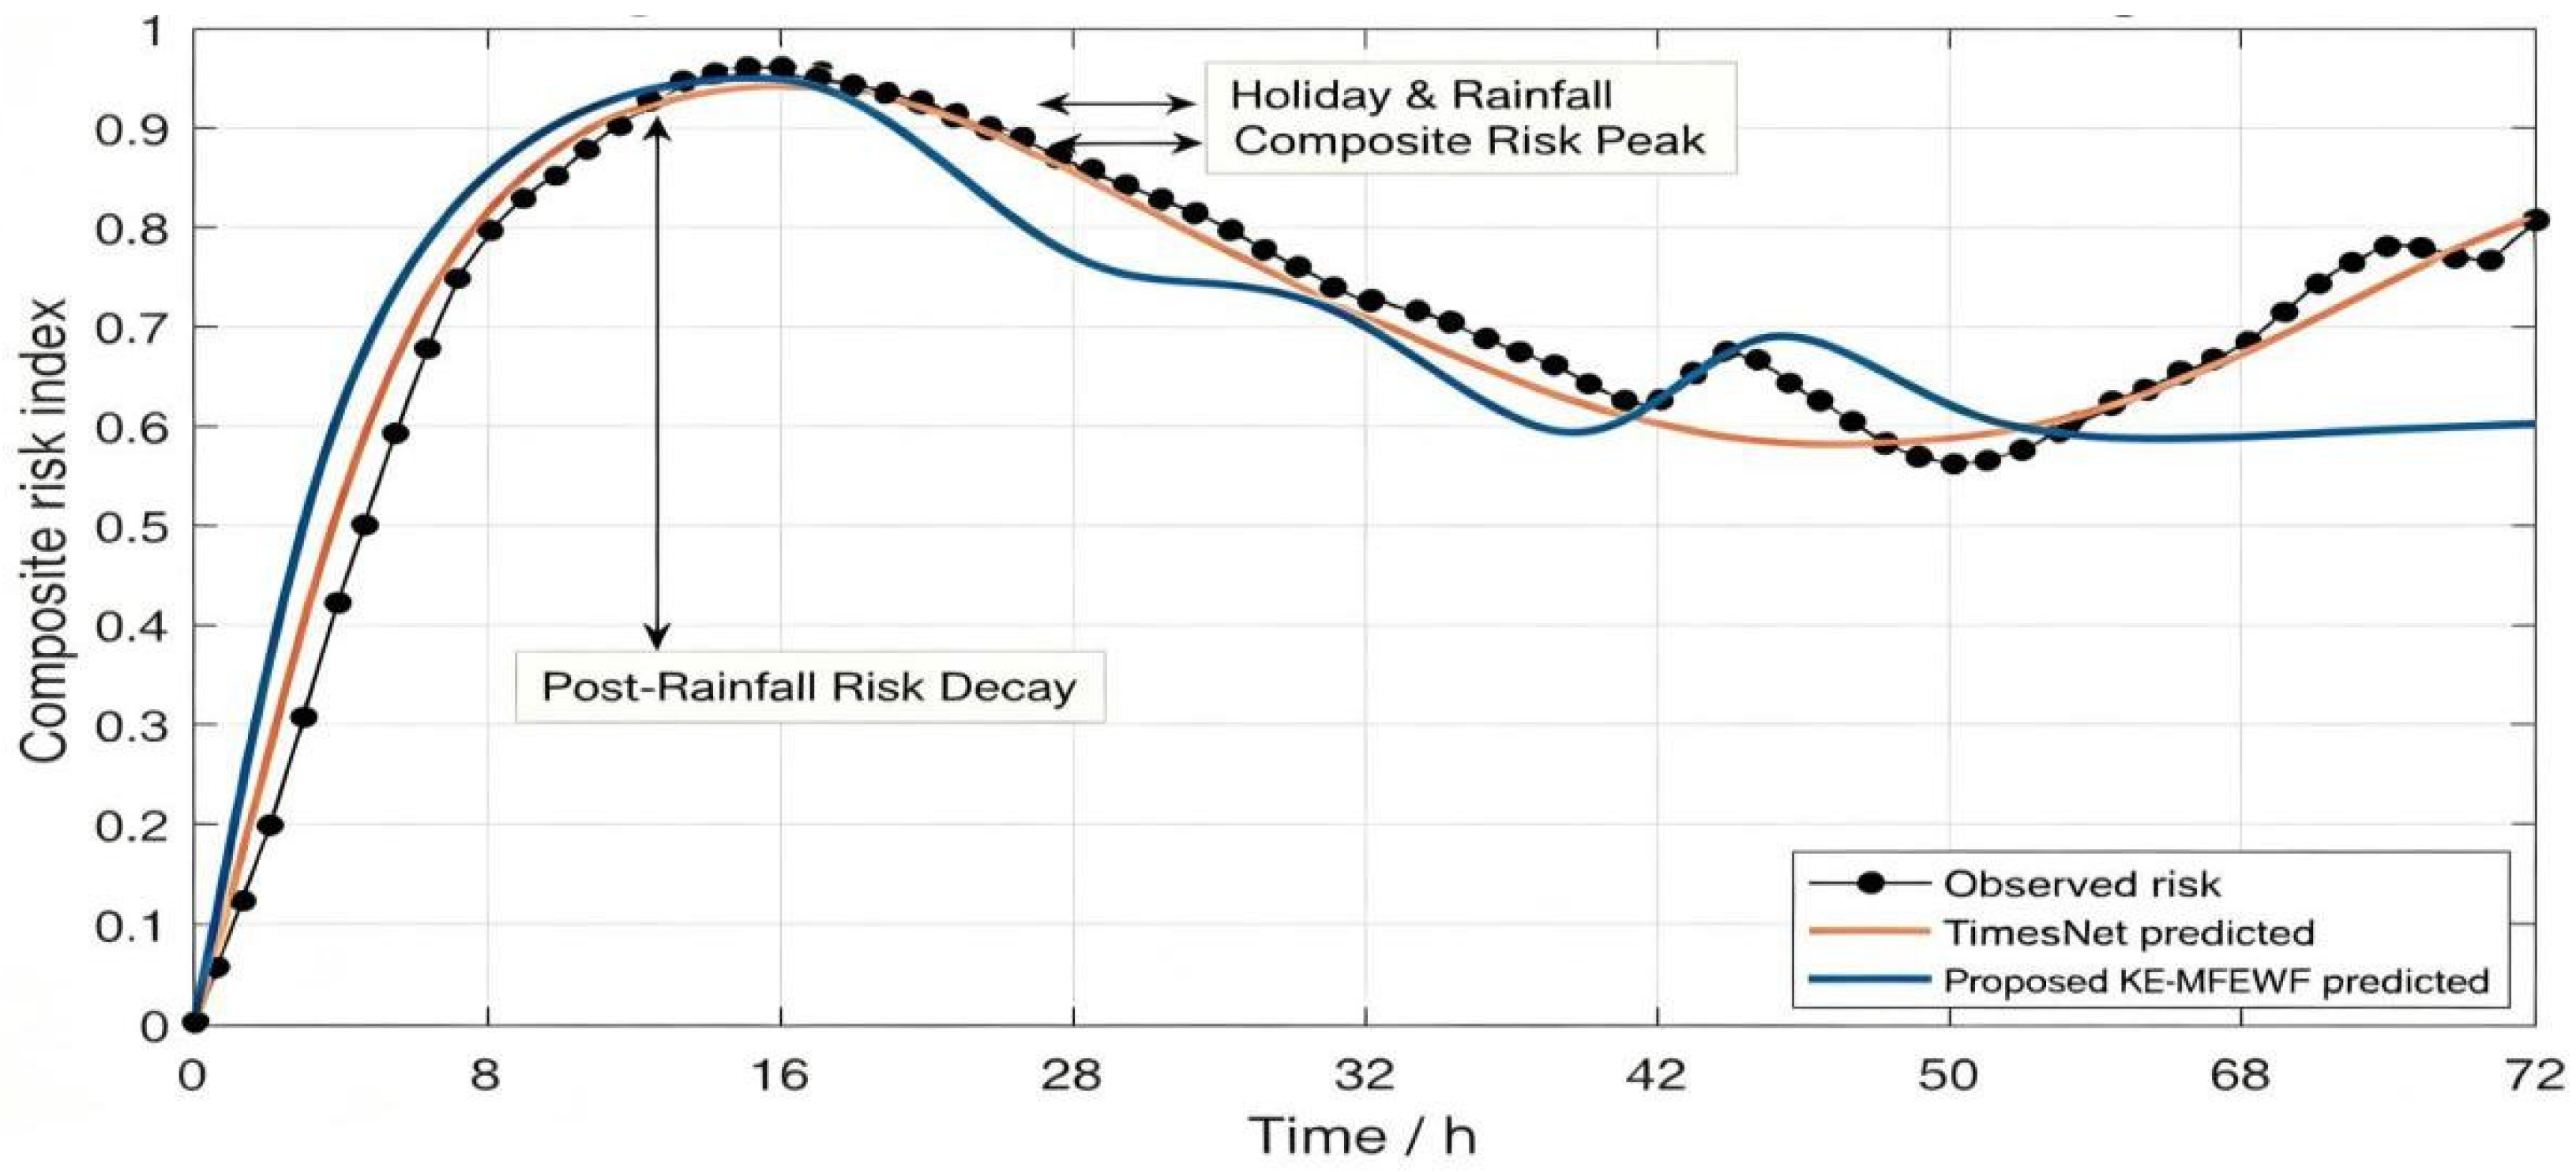
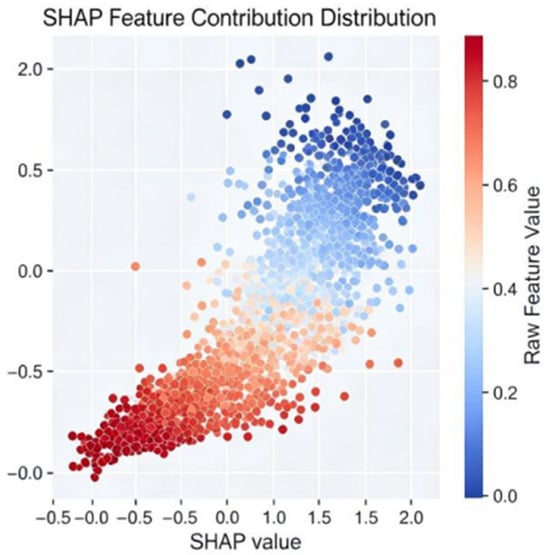
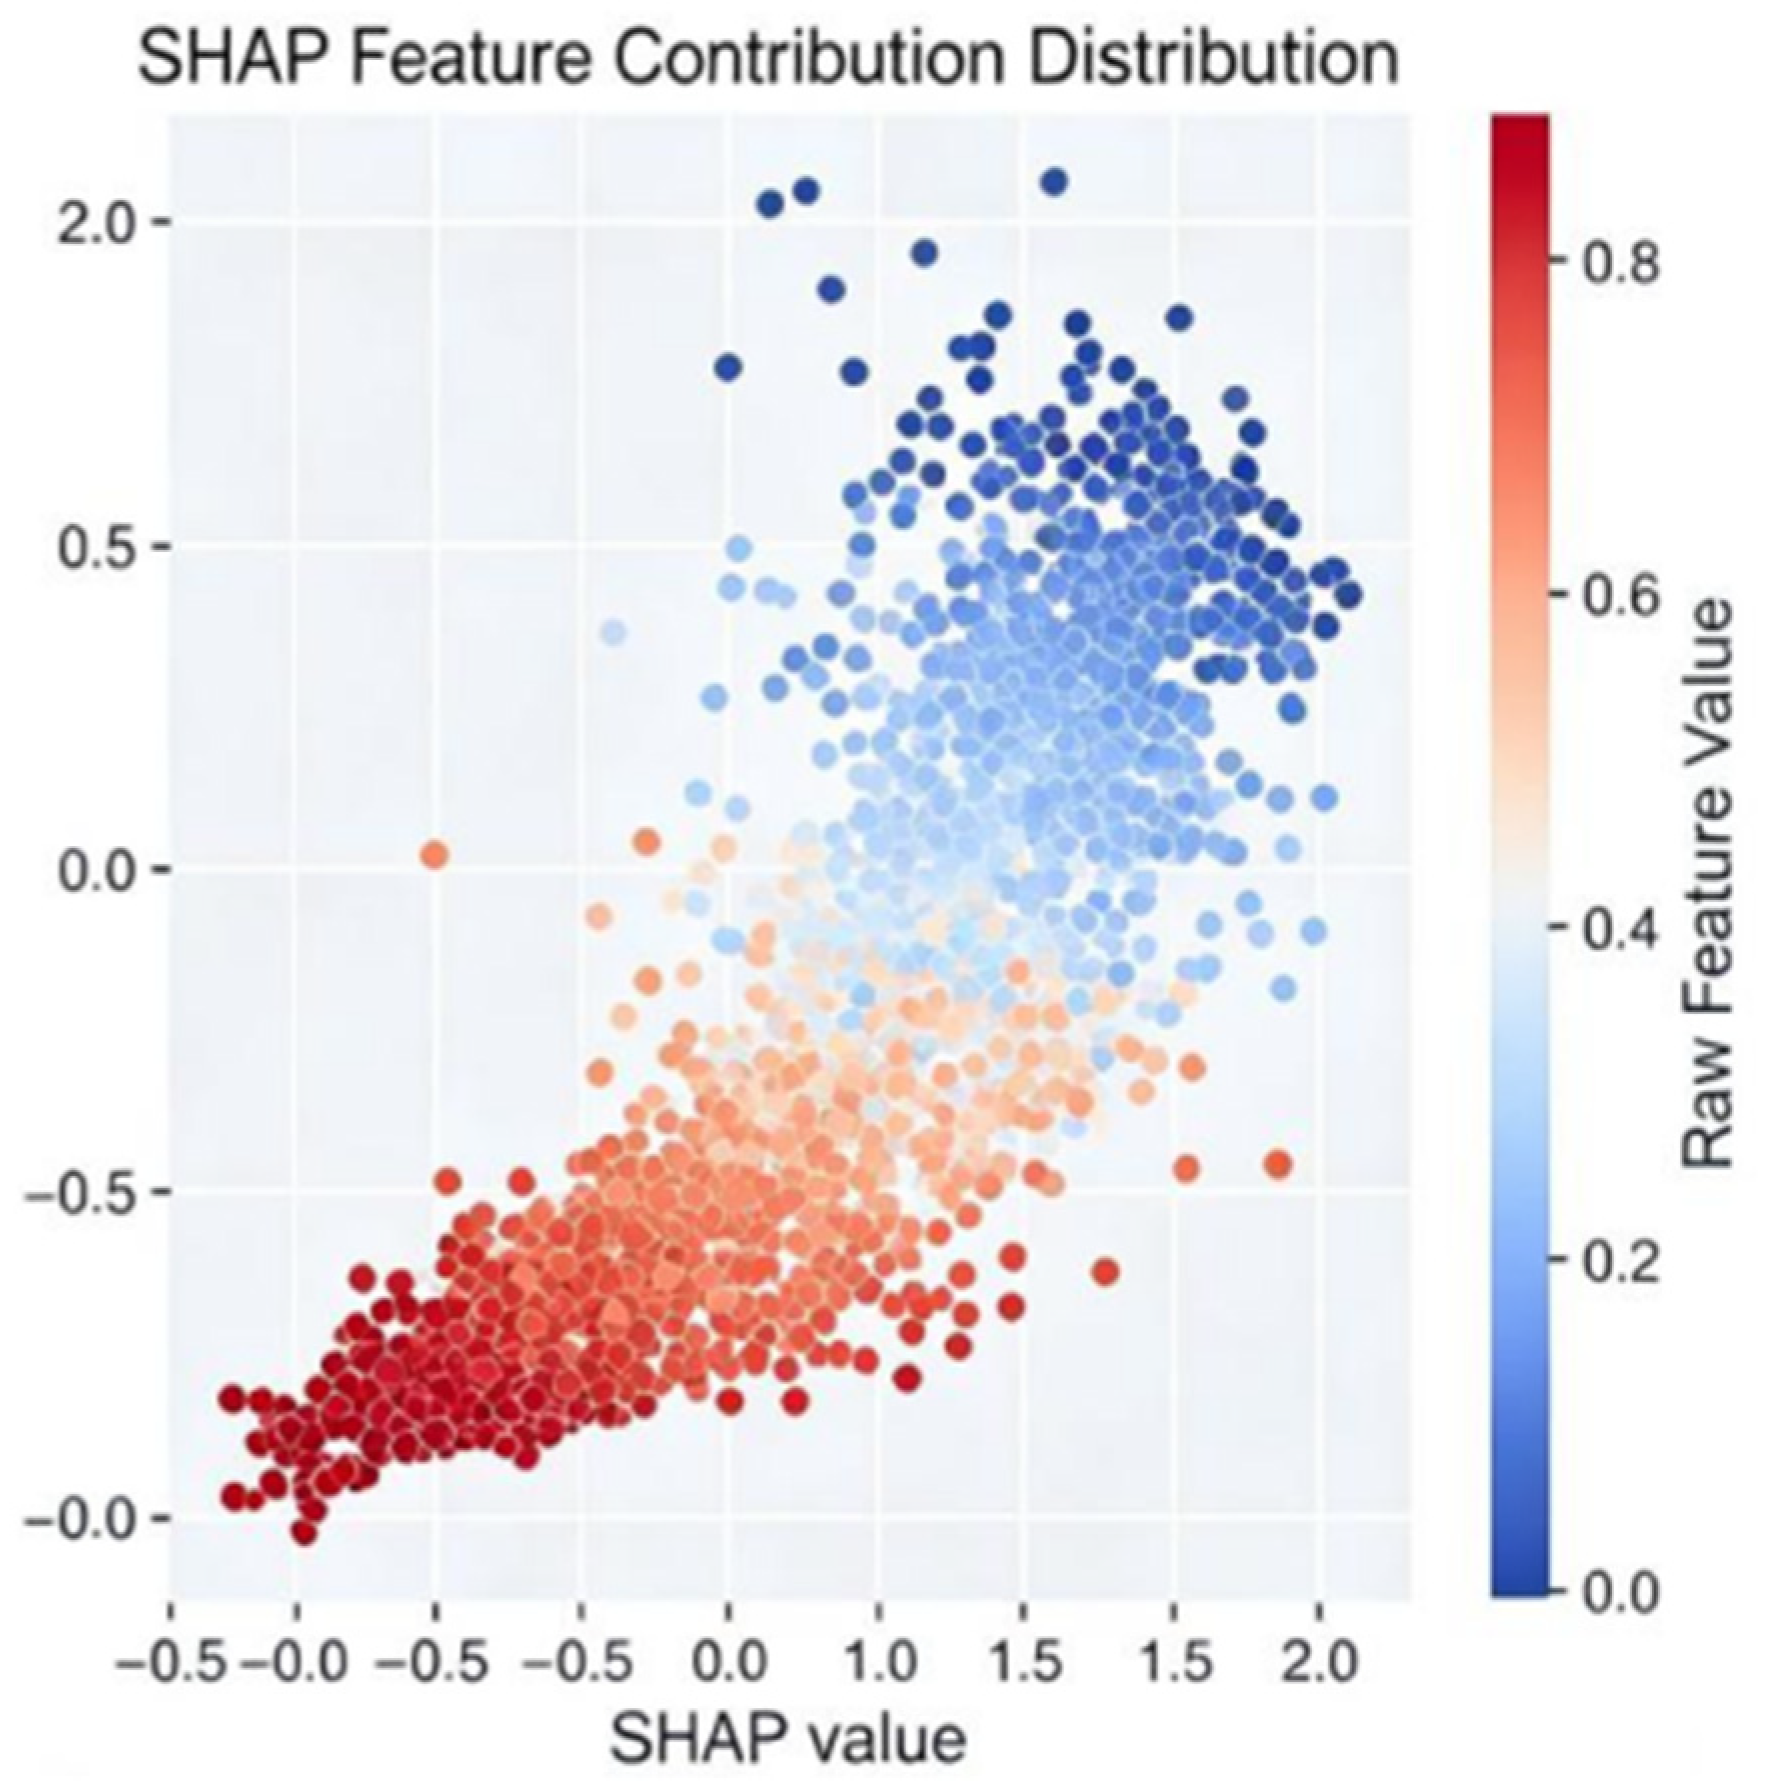

Disclaimer/Publisher’s Note: The statements, opinions and data contained in all publications are solely those of the individual author(s) and contributor(s) and not of MDPI and/or the editor(s). MDPI and/or the editor(s) disclaim responsibility for any injury to people or property resulting from any ideas, methods, instructions or products referred to in the content. |
© 2026 by the authors. Licensee MDPI, Basel, Switzerland. This article is an open access article distributed under the terms and conditions of the Creative Commons Attribution (CC BY) license.