


Abstract
Dual tower-crane crossing operations require timely identification of collision risks as the spatial relationship between the two jibs changes. Conventional systems based on crane-state sensors and static safety zones provide limited information about the surrounding three-dimensional workspace, while sparse point clouds, occlusion, and class imbalance complicate reliable jib recognition. This study develops a LiDAR-based method that converts point-cloud segmentation into geometric models for short-term collision-risk prediction. A geometric-temporal dynamic graph convolutional neural network (GT-DGCNN) combines geometric priors, class-balanced learning, and temporal consistency to identify the jibs and tower structures of both cranes. The segmented jibs are represented by capsule-based envelopes and evaluated using swept-volume prediction, dynamic safety distance, and time to collision. The complete method achieves a mean intersection over union of 87.3% and a jib recall of 91.7%, exceeding the DGCNN baseline by 6.4 and 7.4 percentage points, respectively. The missed-alarm rate decreases from 7.8% to 2.4%, with a processing rate of 17.2 frames per second. These results support the use of geometric-temporal point-cloud perception for jib recognition and collision warning in the evaluated dual-crane scenarios.
1. Introduction
1.1. Research Background
Tower cranes are among the most widely used vertical transportation equipment on high-rise buildings, prefabricated buildings, and large-scale construction sites. In dual- or multi-tower-crane crossing-operation scenarios, the jibs, counter-jibs, hooks, and loads of different cranes may form overlapping spatial working areas. When the slewing radii overlap, working heights are close, or load paths intersect, relying only on operator visual judgment, ground signaling, or simple limit devices for risk control is vulnerable to blind zones, night construction, dust, rain and fog, load swing, and communication delay, thereby increasing the probability of collision accidents. In particular, as the main building height increases, construction space becomes constrained, and multiple devices operate collaboratively, the relative spatial relationship between two crane jibs changes dynamically, making traditional static safety zones insufficient for reflecting real-time spatial risk.
Traditional tower-crane anti-collision systems mainly rely on encoders, GPS, UWB, limit switches, or manually defined safety zones. These methods can acquire, to some extent, the crane slewing angle, trolley radius, lifting height, and other internal status information. However, they primarily describe the motion state of instrumented equipment and have limited capability to represent temporary materials, building boundaries, scaffolding, non-instrumented objects, and dynamic obstacles on construction sites. In dual tower-crane crossing operations, collision risk is highly spatial and dynamic. Single-machine status parameters alone cannot accurately reflect the real-time geometric relationships among the two jibs, hooks/loads, and surrounding obstacles. Therefore, it is necessary to introduce LiDAR point clouds that can represent the three-dimensional working space and combine point cloud semantic segmentation, geometric fitting, and short-term motion prediction to shift from equipment-state monitoring to spatial-risk perception.
LiDAR point clouds can directly capture three-dimensional spatial information in construction environments and provide explicit representations of structural geometry and relative distance. Compared with two-dimensional vision, LiDAR-based perception is less dependent on ambient illumination and can directly support three-dimensional distance calculation. Compared with methods relying only on crane encoders, point-cloud perception represents the crane structures and surrounding obstacles within the monitored workspace. This study models the two crane jibs as large rigid structures within overlapping workspaces and estimates their geometric poses from continuous LiDAR point clouds. The resulting geometric models support distance calculation and short-term collision-risk prediction.
1.2. Research Objectives and Contributions
To address the limitations of conventional tower-crane anti-collision systems in representing the real-time spatial relationship between multiple crane jibs, this paper proposes a LiDAR point-cloud-based real-time anti-collision warning method for dual tower-crane crossing operations. The method converts point-level semantic segmentation results into continuous geometric representations for distance calculation, motion estimation, and collision-risk assessment. Multi-source LiDAR point clouds are first synchronized and transformed into a unified world coordinate system. An improved GT-DGCNN is then used to distinguish the jibs and tower structures of the two cranes from surrounding obstacles. The segmented jib point clouds are subsequently converted into centerlines, oriented bounding boxes, and capsule-based safety envelopes. Finally, the short-term motion of the two jibs is predicted, and multi-level warnings are generated according to their predicted minimum distance, dynamic safety distance, and time to collision.
The main contributions of this study are summarized as follows.
First, a real-time anti-collision warning framework is constructed for dual tower-crane crossing operations. The proposed framework integrates multi-source point-cloud acquisition, semantic segmentation, jib geometric fitting, continuous-frame pose estimation, swept-volume prediction, and collision-risk assessment into a unified technical process. It therefore establishes a complete transformation from raw LiDAR measurements to quantitative jib-level warning results.
Second, an improved geometric-temporal DGCNN, termed GT-DGCNN, is proposed for task-oriented segmentation of dual tower-crane point clouds. Tower-axis distance, theoretical or previously predicted jib-axis distance, height, range, reflection intensity, and local geometric coordinates are introduced as input features. Class-balanced learning and temporal consistency constraints are further employed to improve the recognition stability of the two jib classes under class imbalance, partial occlusion, point sparsity, and environmental noise.
Third, a jib-level collision-risk model combining centerline fitting, capsule-based safety envelopes, dynamic safety distance, and swept-volume continuous collision detection is developed. The model converts discrete point-level semantic outputs into engineering geometric representations and supports short-term risk prediction according to relative motion, minimum separation distance, and time to collision.
2. Related Work
Research on tower-crane operation modeling and safety monitoring has been conducted from the perspectives of three-dimensional simulation, sensor monitoring, and point-cloud modeling. Huang et al. proposed a point cloud-based lifting path planning method for tower cranes, digitizing complex construction-site environments into point clouds and combining tower-crane kinematics, hybrid C-space, and continuous collision detection to search lifting paths [1]. They further used laser scanning to virtualize complex lifting environments, providing a point-cloud modeling approach for crane path planning in scenarios without CAD/BIM models [2]. Li and Liu integrated field data with three-dimensional simulation to develop a tower-crane activity monitoring and alarming system, showing that sensor status data and 3D simulation can support tower-crane safety management [3]. Zhang and Chen reviewed digital technologies for crane safety management and pointed out that sensor perception, data processing, and visualization platforms are important directions for improving crane-equipment safety management [4]. These studies provide a basis for tower-crane workspace modeling and safety monitoring; however, in dual tower-crane jib crossing operations, the linkage among real-time point-cloud recognition, geometric representation, and future risk prediction still requires further research.
In terms of crane-component point-cloud segmentation and temporal monitoring, Jeong et al. mounted multiple LiDAR sensors on a crane and used grid sampling, DBSCAN clustering, and DGCNN to segment crane components, demonstrating the feasibility of dynamic graph convolutional networks for crane-component recognition [5]. Liang et al. proposed a 4D point cloud-driven real-time monitoring method for mobile cranes, using RANSAC, DBSCAN, geometric matching, and previous-frame bounding boxes to achieve temporal target tracking, thereby providing a reference for dynamic point-cloud monitoring during construction lifting operations [6]. Their subsequent work further combined 4D point clouds with semantic registration for spatial-temporal semantic monitoring of mobile-crane construction activities [7]. Mirzaei et al. reviewed machine-learning-based 3D point cloud processing methods in construction and infrastructure applications and emphasized that point cloud semantic segmentation, object recognition, and automated modeling are important research directions for intelligent construction-site perception [8]. Existing studies show that LiDAR point clouds can support construction-equipment status recognition and environmental representation, but methods that convert tower-crane component segmentation results into anti-collision geometric models and warning decisions are still limited.
From the perspective of point cloud deep learning algorithms, PointNet first proposed a deep network that directly takes unordered point sets as input, providing a fundamental model for point cloud classification and segmentation [9]. PointNet++ further introduced hierarchical local-region learning to overcome PointNet’s insufficient representation of local structures [10]. DGCNN introduced dynamic graph construction and the EdgeConv operation, which can dynamically learn local geometric relationships between points and their neighbors in feature space, making it suitable for describing the spatial topology of rod-like structures such as tower-crane jibs, towers, and hooks [11]. RandLA-Net improves processing efficiency for large-scale point clouds through random sampling and local feature aggregation [12], while KPConv provides a flexible convolutional representation for point clouds by defining kernel points in 3D space [13]. These networks provide algorithmic support for construction-scene point cloud segmentation, but direct application to dual tower-crane scenarios still faces challenges such as sparse key components, unbalanced classes, occlusion, and confusion between the jibs of different cranes.
For point cloud preprocessing and geometric modeling, the Point Cloud Library (PCL) provides a relatively complete tool chain for filtering, registration, feature estimation, model fitting, and segmentation [14]. DBSCAN can extract point-cloud clusters based on density without specifying the number of classes in advance and can treat outliers as noise, which is suitable for construction-site point clouds with variable object numbers and complex background interference [15]. RANSAC is a classical robust model-fitting method that can fit planes, lines, and geometric primitives in the presence of many outliers [16]. Schnabel et al. further extended RANSAC to efficient point-cloud shape detection, supporting the fitting of basic geometric primitives from noisy point clouds [17]. These methods provide the basis for ROI extraction, background removal, candidate clustering, and crane-jib centerline fitting in this study.
From the viewpoint of collision detection and spatial-envelope modeling, OBBTree uses oriented bounding boxes to construct a hierarchical interference-detection structure for rapid collision judgment between complex models [18]. Larsen et al. proposed swept sphere volumes for fast proximity queries and collision-distance computation, providing an idea for expanding line segments, rectangles, and other geometric primitives into continuous spatial envelopes [19]. Redon et al. proposed a fast continuous collision detection method for rigid bodies, emphasizing the computation of the first contact time during continuous motion to avoid missed detections caused by discrete-time checking [20]. These studies indicate that swept volumes and continuous collision detection are suitable for predicting future short-term collision risks. Therefore, combining point-cloud segmentation, geometric fitting, temporal tracking, and swept-volume continuous collision detection is a feasible technical route for real-time anti-collision warning of dual tower-crane jibs.
Recent work has extended construction collision monitoring through three-dimensional perception and digital twins. Schock-Schmidtke et al. developed a simulation-oriented tower-crane anti-collision system in which hook-mounted stereo cameras generate point clouds for detecting people near suspended loads and estimating their separation from the load [21]. Zhao et al. proposed a digital twin-enabled construction-site anti-collision system that combines image, depth, and motion information with dynamic warning zones [22]. These studies address load–person proximity and construction-site hazard zones. The present study focuses on the relative geometry and predicted motion of two tower-crane jibs, linking component segmentation to capsule-based collision assessment.
3. Materials and Methods
3.1. Overall System Design
The proposed system is intended for construction sites where the slewing workspaces of two tower cranes overlap or where their jibs operate cooperatively at close range. The system is organized around four stages: site perception, point-cloud recognition, geometric modeling, and risk warning.
3.2. Dual Tower-Crane Crossing-Operation Scenario
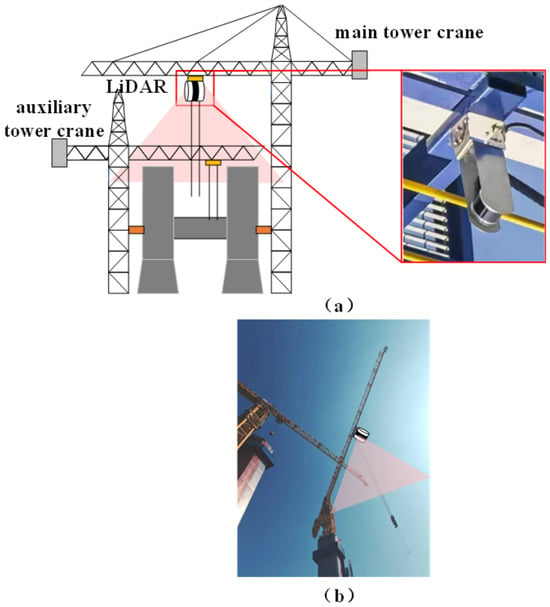
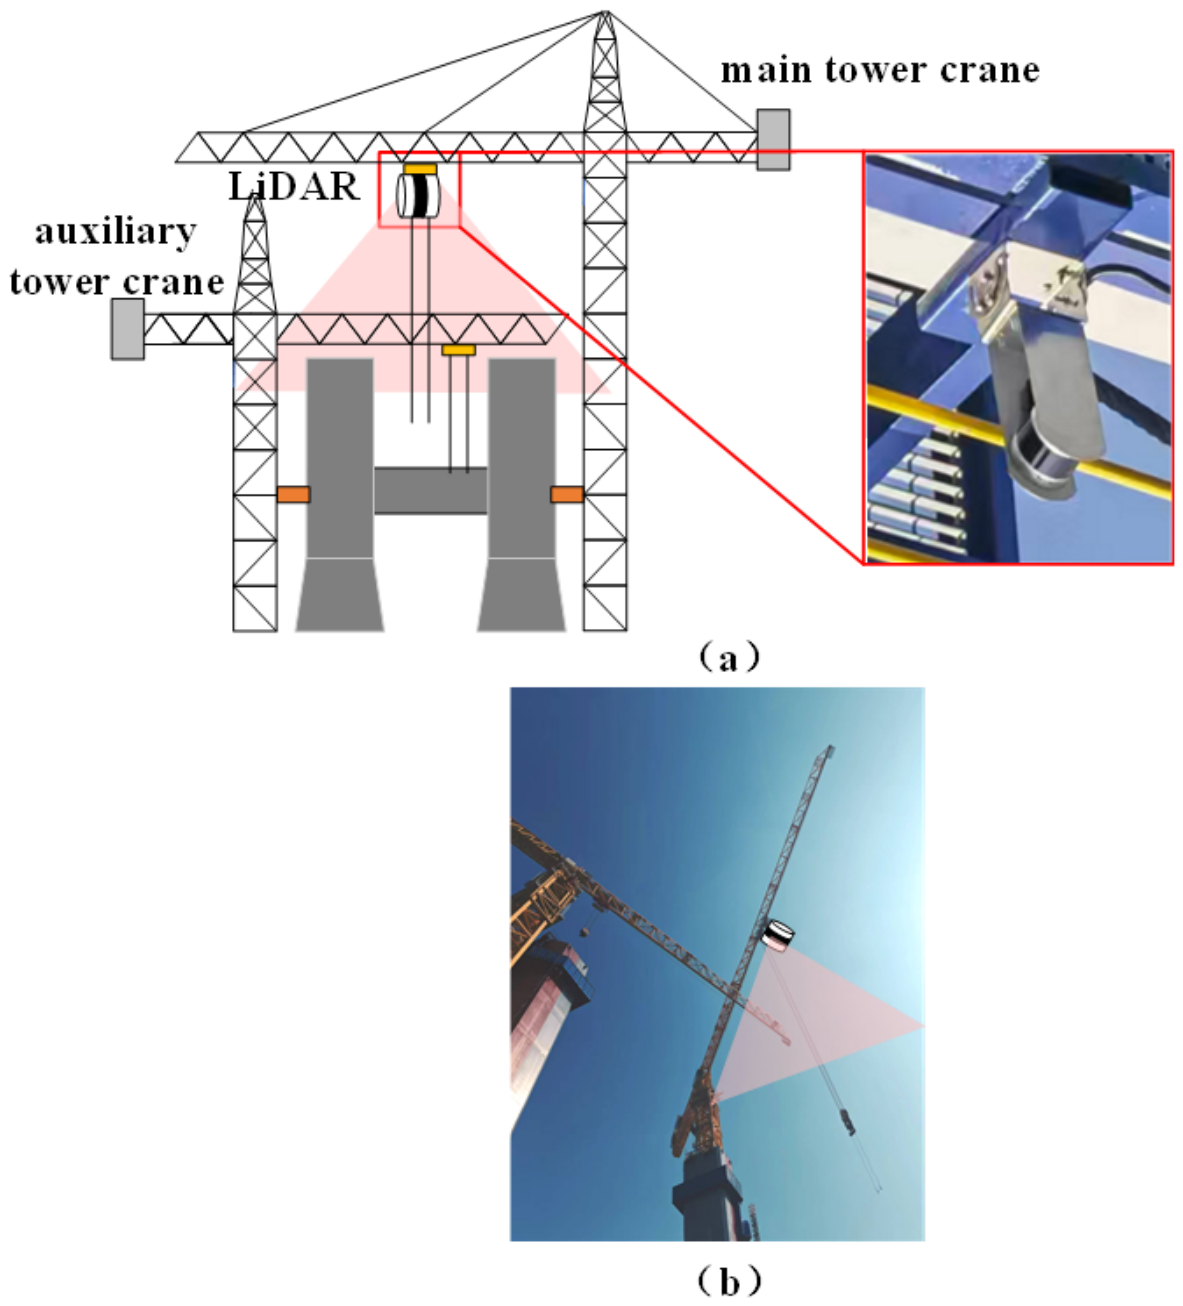
Figure 1 illustrates a dual tower-crane crossing-operation scenario in which the slewing workspaces of Tower Crane A and Tower Crane B overlap. During crane operation, the spatial relationship between the two jibs changes continuously. Building structures may partially obstruct the view of operators and ground signalers, while hooks and suspended loads may also pass through the overlapping workspace.
Figure 1.
Dual tower-crane crossing-operation scenario and jib-collision-risk region: (a) LiDAR installation schematic; (b) on-site installation.
This study investigates collision-risk warning for two rigid jibs during dual tower-crane crossing operations. As the cranes slew, the relative positions of the jibs change, and their spatial proximity depends on the installation heights, slewing angles, and relative motion states. Point clouds within the monitored workspace contain the jibs, their corresponding tower structures, and surrounding objects. Semantic segmentation extracts the point sets of the two jibs for geometric modeling, and continuous-frame motion states support collision-risk assessment between them.
Two LiDAR sensors are mounted on the jib of Tower Crane A near the trolley region and are oriented downward toward the principal crossing workspace. Their fields of view cover the space beneath the jib of Tower Crane A and the principal region through which the jib of Tower Crane B passes during crossing operations. The acquired point clouds contain the two crane jibs, their corresponding tower structures, and surrounding objects within the monitored area. The monitored area is defined according to the slewing centers, jib lengths, installation heights, operating radii, and spatial overlap of the two cranes. Hooks, suspended loads, and other objects appearing within this area are included in the obstacle class.
The synchronized PLC/encoder data provide the nominal motion states of the instrumented cranes and are used for temporal synchronization, frame-wise coordinate transformation, and state-consistency checking. The LiDAR sensors complement these data by observing the occupied geometry within the monitored crossing workspace. Surrounding objects are represented by the obstacle class during semantic segmentation, enabling the two jib point sets to be extracted for subsequent geometric modeling and collision-risk assessment. A candidate jib cluster whose estimated state is inconsistent with the encoder-derived state is assigned to the generic-obstacle category and retained in the point-cloud sequence for subsequent state updating.
3.3. Overall Data Flow
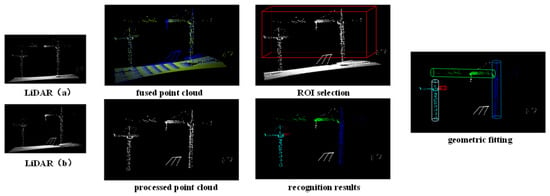
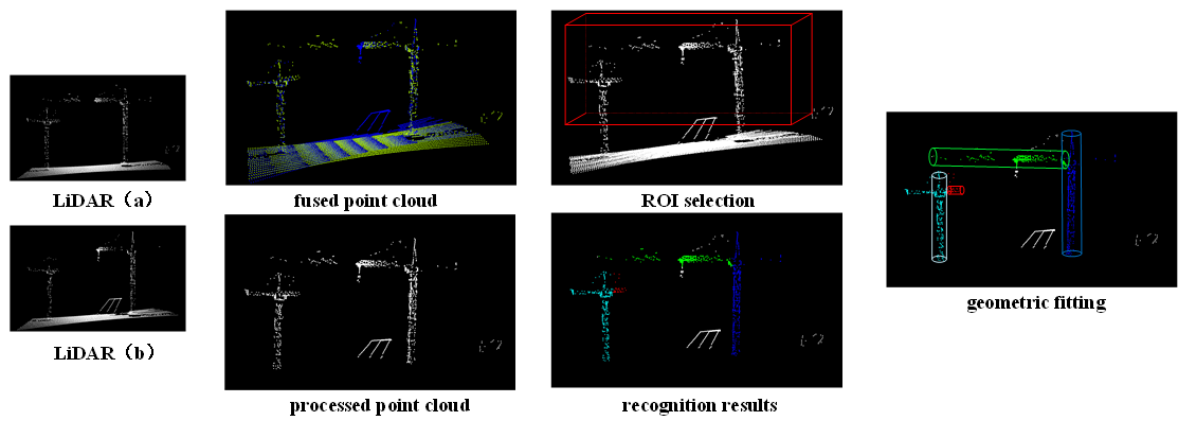
Figure 2 presents the overall processing flow from multi-source LiDAR acquisition to jib-level geometric modeling and collision warning. The point clouds acquired by the two LiDAR sensors are synchronized with the PLC and encoder states and transformed into a fixed world coordinate system using frame-wise coordinate transformations.
Figure 2.
Overall data flow of the dual tower-crane anti-collision system. (a) and (b): two LiDAR sensors; red box: region of interest (ROI).
A region of interest is defined according to the tower positions, jib height ranges, maximum slewing radii, and spatial overlap area. Adaptive voxel sampling, background-plane removal, and candidate-region extraction are then applied to reduce irrelevant points while retaining the geometric structures associated with the two jibs.
The processed point clouds are input into GT-DGCNN for point-level semantic segmentation. The output classes include Tower Crane A jib, Tower Crane A tower structure, Tower Crane B jib, Tower Crane B tower structure, obstacle, and background. The segmented jib point clouds are converted into centerlines, oriented bounding boxes, and capsule-based safety envelopes. Short-term motion prediction and swept-volume analysis are then performed to calculate the predicted minimum distance, dynamic safety distance, and time to collision.
The point-cloud panels in Figure 2 are generated from the same real-site LiDAR frame and present the corresponding semantic-segmentation output, capsule-based geometric-modeling result, and collision-warning result.
3.4. System Architecture
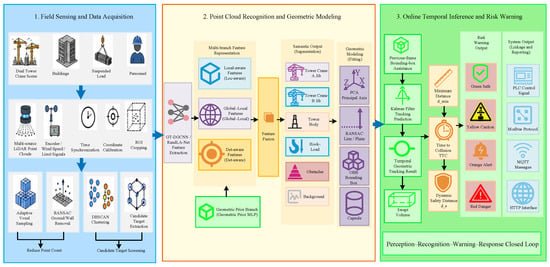
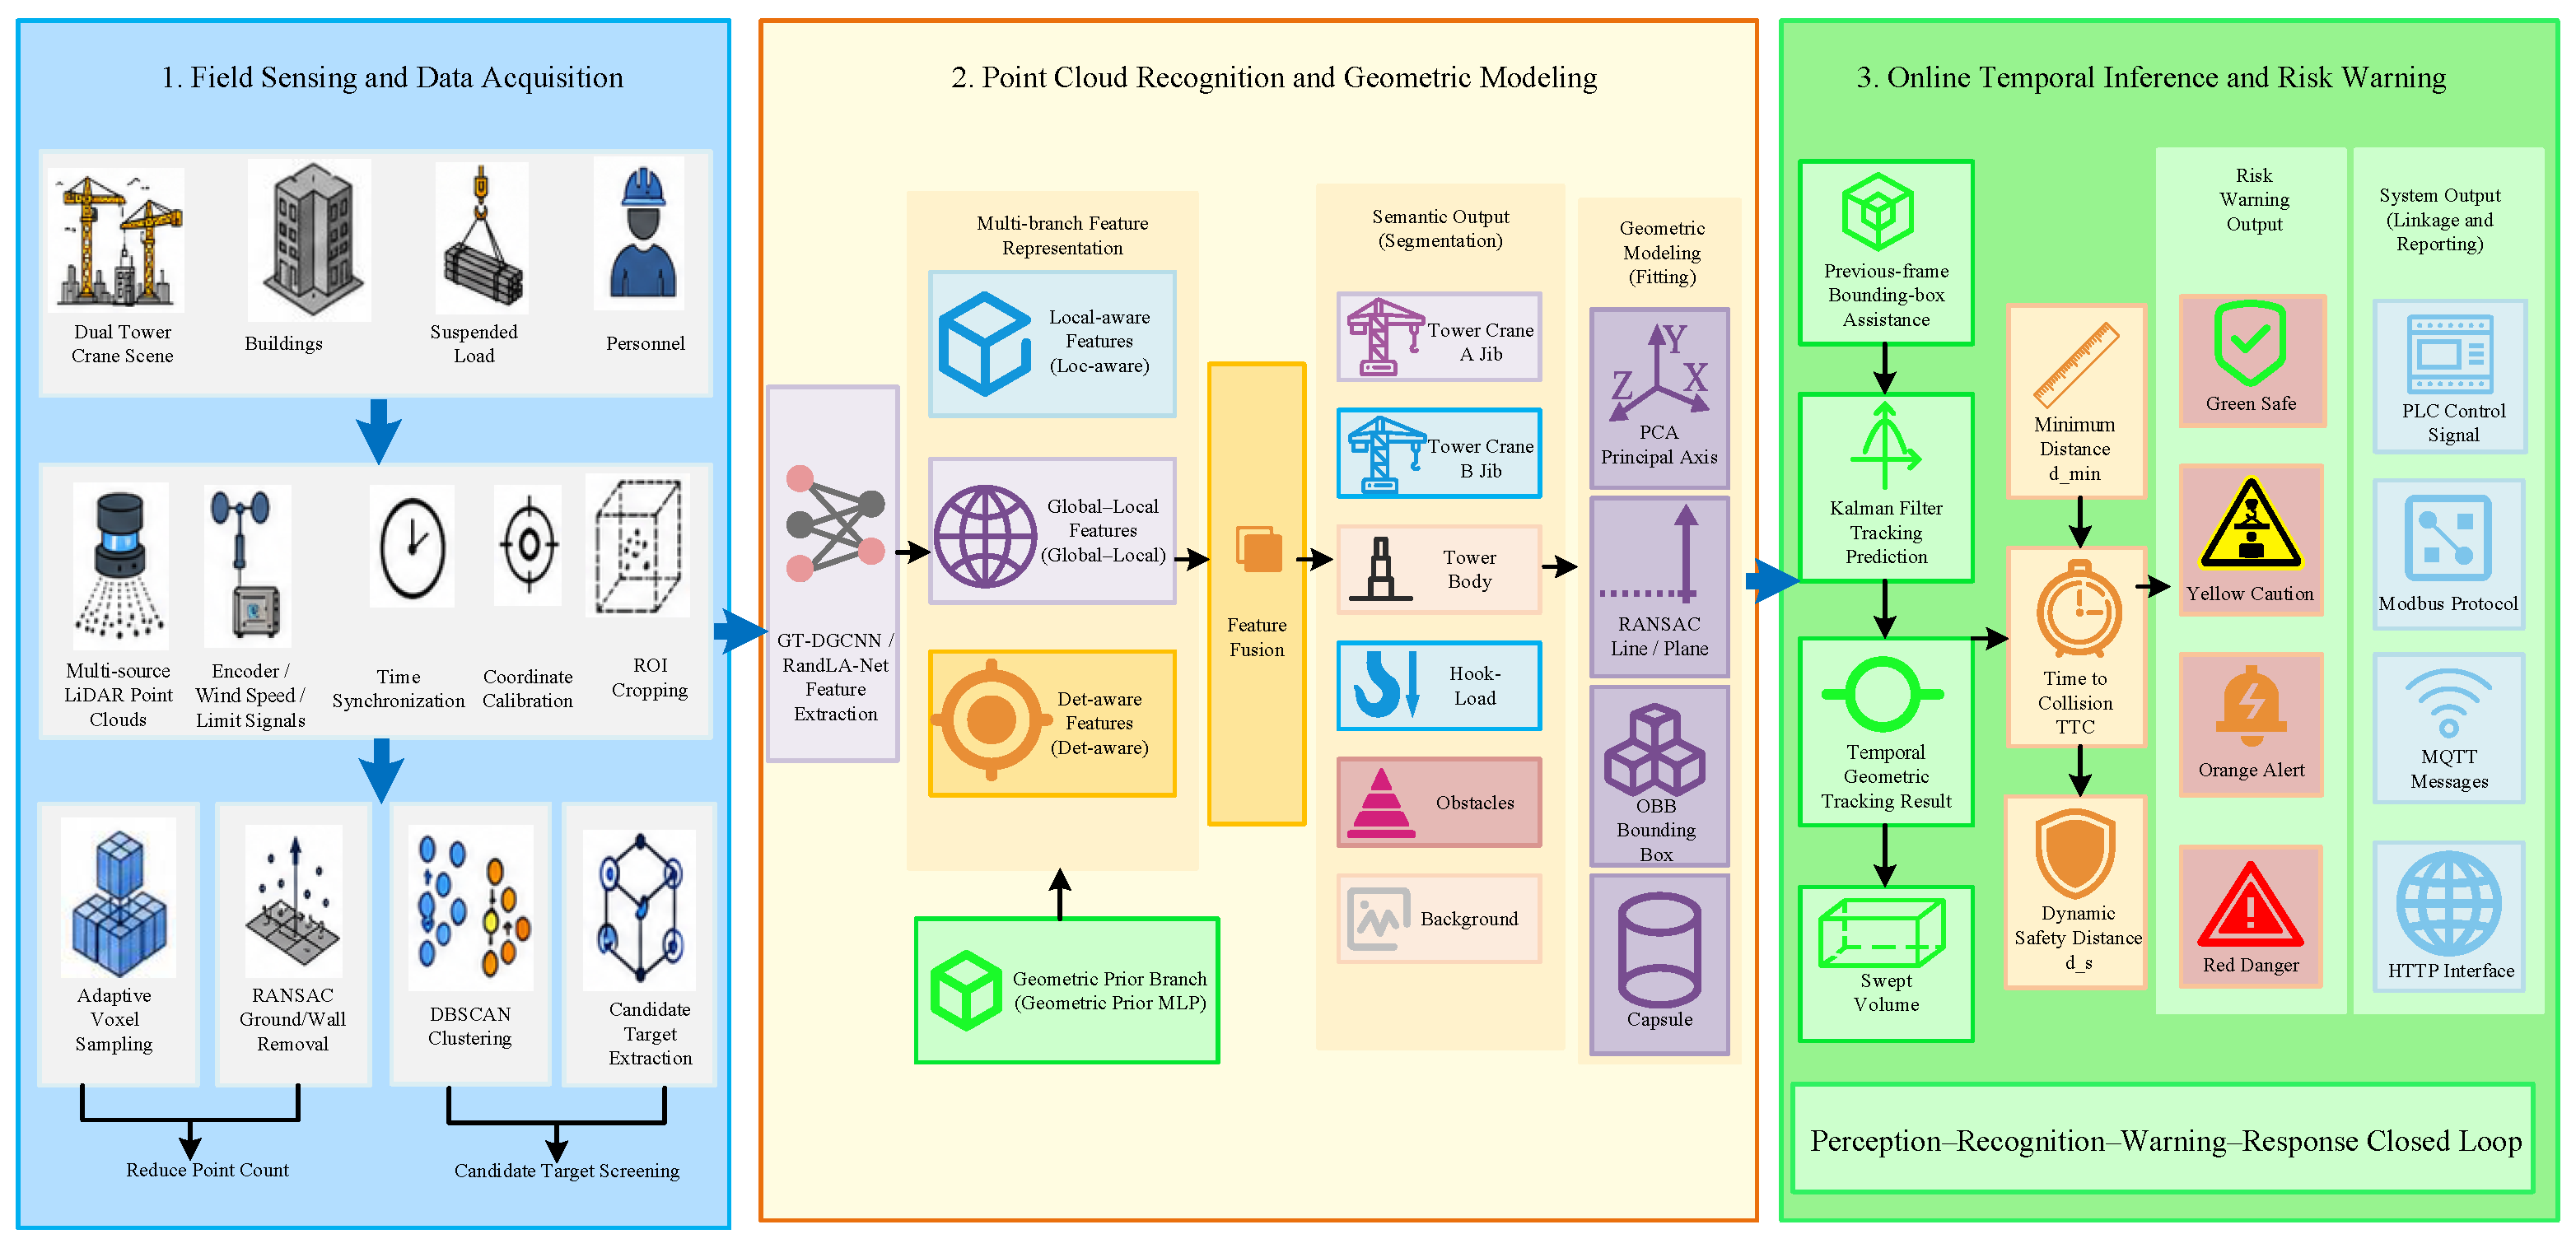
Figure 3 presents the complete system architecture. Multi-source continuous LiDAR point clouds constitute the primary perception input. Synchronized PLC and encoder information, including the slewing angles and trolley states of the two cranes, is used to update the LiDAR poses, evaluate jib-state consistency, and construct encoder-derived reference geometry.
Figure 3.
Overall flowchart of the real-time anti-collision warning system for dual tower-crane jibs.
After time synchronization and coordinate unification, the LiDAR observations form continuous point-cloud sequences in a common world coordinate system. Region-of-interest cropping, adaptive voxel sampling, RANSAC-based background-plane removal, and DBSCAN-based candidate-region extraction are performed to reduce the input scale and suppress environmental interference.
In the semantic-segmentation stage, the candidate-region point clouds are input into GT-DGCNN. The semantic output classes are Tower Crane A jib, Tower Crane A tower structure, Tower Crane B jib, Tower Crane B tower structure, obstacle, and background. The two segmented jib point clouds are passed to the geometric-modeling stage, where their centerlines, endpoints, oriented bounding boxes, and capsule-based safety envelopes are estimated.
In the risk-warning stage, continuous-frame geometric models are used to estimate the angular motion and relative approach of the two jibs. Their predicted positions and swept volumes are calculated over a short-term future horizon. A warning is generated when the predicted separation distance becomes smaller than the dynamic safety distance, when the swept safety envelopes intersect, or when the estimated time to collision falls below a calibrated threshold.
3.5. Data Input and Preprocessing
Data input and preprocessing are fundamental to the real-time anti-collision warning system for dual tower-crane jibs, and their quality directly affects subsequent point cloud segmentation, geometric fitting, and risk judgment accuracy. Since construction sites have large-scale crane structures, broad working spaces, obvious building occlusions, complex background point clouds, and inconsistent coordinates among multiple sensors, raw LiDAR point clouds cannot usually be directly input into the segmentation network. Therefore, this system first performs time synchronization and coordinate unification for multi-source continuous point clouds to form 4D point cloud sequences in a unified world coordinate system. ROI cropping, adaptive voxel sampling, RANSAC-based background removal, and DBSCAN-based candidate extraction are then used to reduce the point-cloud scale, remove irrelevant background, and retain key objects related to dual-crane anti-collision, thereby providing stable inputs for task-oriented point cloud segmentation and geometric modeling.
The system takes continuous-frame 4D point clouds as the main input. The point cloud at frame t can be expressed as:
where are the 3D coordinates of a point in the LiDAR coordinate system or the world coordinate system, is the reflection intensity, is the timestamp, and is the number of points in frame t.
For multi-LiDAR data fusion, the points acquired by each sensor are transformed into a fixed world coordinate system. Because the LiDAR sensors move with the crane mechanism, the complete LiDAR-to-world transformation varies with time. For LiDAR sensor m, a point acquired at frame t is transformed as
Here, and denote the homogeneous coordinates of the point in the m-th LiDAR coordinate system and the fixed world coordinate system, respectively. The matrix denotes the frame-wise transformation from the m-th LiDAR coordinate system to the world coordinate system.
The installation transformation between each LiDAR sensor and its mounting structure is determined through extrinsic calibration using artificial targets, known tower boundaries, and site control points. During crane operation, the pose of the mounting structure in the world coordinate system is updated using synchronized trolley-position and jib-state data from the PLC. The installation transformation and mechanism pose are combined to obtain .
The point-cloud frames from the two LiDAR sensors are synchronized with the corresponding PLC data. The transformed point clouds are subsequently fused in the fixed world coordinate system and used for point-cloud preprocessing, semantic segmentation, geometric modeling, and distance calculation.
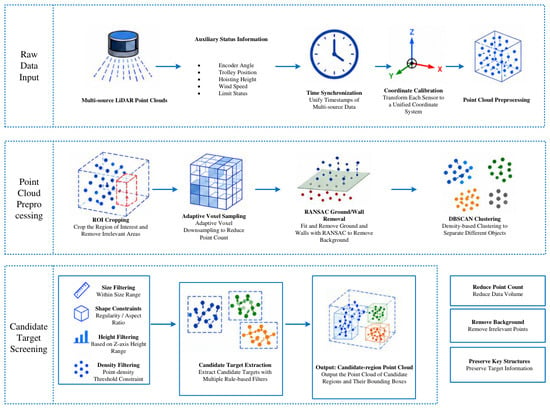
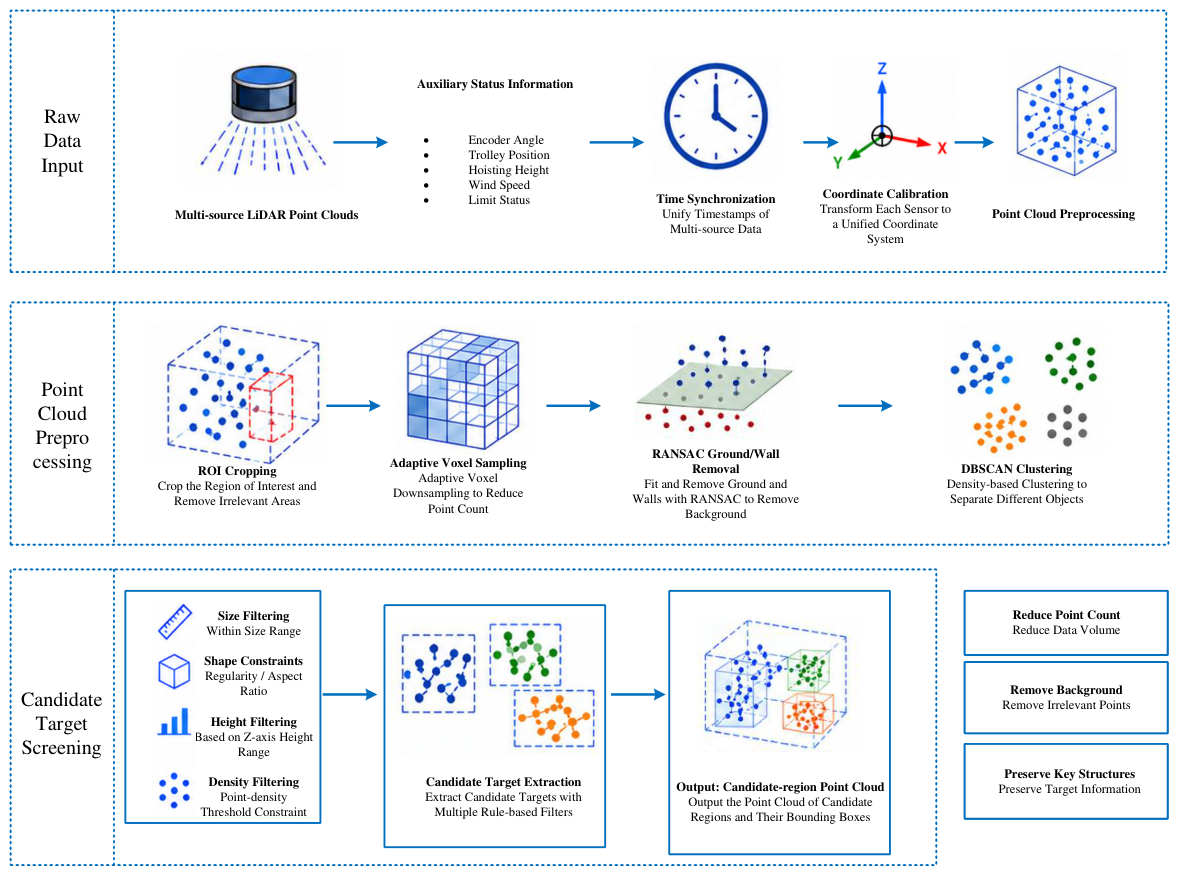
As shown in Figure 4, the data acquisition and preprocessing stage consists of three parts: raw data input, point cloud preprocessing, and candidate target screening. Raw data input includes multi-source LiDAR point clouds and auxiliary status information, such as encoder angle, trolley radius, lifting height, wind speed, and limit-switch status. After time synchronization, multi-source data are aligned to the same timestamp and converted to the unified world coordinate system through coordinate calibration, forming fused continuous point cloud sequences.
Figure 4.
Data acquisition and preprocessing stage.
In the point cloud preprocessing stage, the system first performs ROI cropping. ROI cropping is configured according to the slewing centers of the two cranes, jib lengths, maximum working radii, jib height ranges, and the crossing-operation area, retaining only the point cloud regions that may participate in collision judgment. Through ROI cropping, irrelevant point clouds far from the working area can be removed, reducing the burden of subsequent network inference and geometric computation.
To further reduce the point-cloud scale, an adaptive voxel sampling method is adopted. Adaptive voxel sampling sets different resolutions according to regional importance. Smaller voxels are used in the jib crossing-risk area and near the jib boundaries and endpoints to preserve the geometric characteristics of the elongated jib structures, while larger voxels are used for buildings, ground, and distant background to reduce point counts and improve real-time performance. This strategy reduces the number of points while retaining the key geometric structures required for jib segmentation, geometric fitting, and anti-collision warning as much as possible.
After voxel sampling, RANSAC is used to fit and remove the ground, large wall surfaces, or stable background planes. The plane model to be fitted is defined as:
For point , its distance to the plane can be expressed as:
When is smaller than the specified threshold, the point is classified as an inlier of the plane. This process removes large-area background planes such as the ground and walls, reducing their interference with subsequent clustering and segmentation.
DBSCAN is then used to cluster the remaining point clouds. DBSCAN divides spatially adjacent points into different candidate clusters according to point density and does not require the number of targets to be specified in advance. It is therefore suitable for construction sites where the number of targets is variable and obstacle positions change frequently. After clustering, candidate targets are further screened using size filtering, shape constraints, height filtering, and density filtering. The preprocessing stage finally outputs candidate-region point clouds and their bounding boxes as inputs for the subsequent point cloud segmentation network.
3.6. Improved Point-Cloud Segmentation and Anti-Collision Warning Algorithm
After multi-source point cloud synchronization, coordinate unification, and candidate target extraction, the system further recognizes key crane components from the candidate-region point clouds and converts the recognition results into geometric representations for collision-risk judgment. In dual tower-crane crossing operations, the jibs, tower structures, and surrounding obstacles differ greatly in scale, point density is uneven, local occlusion is obvious, and class samples are imbalanced. Therefore, traditional geometric rules alone cannot stably complete component recognition. Based on the dynamic graph convolutional feature-extraction ability of DGCNN, the algorithm incorporates tower-crane structural geometric priors, class-balanced loss, and temporal consistency constraints to construct an improved point cloud segmentation and warning algorithm for dual-crane anti-collision tasks. The algorithm takes candidate-region point clouds as input and sequentially performs point-level semantic segmentation, geometric fitting, temporal tracking, and collision-risk judgment, providing the computational basis for subsequent multi-level warning output.
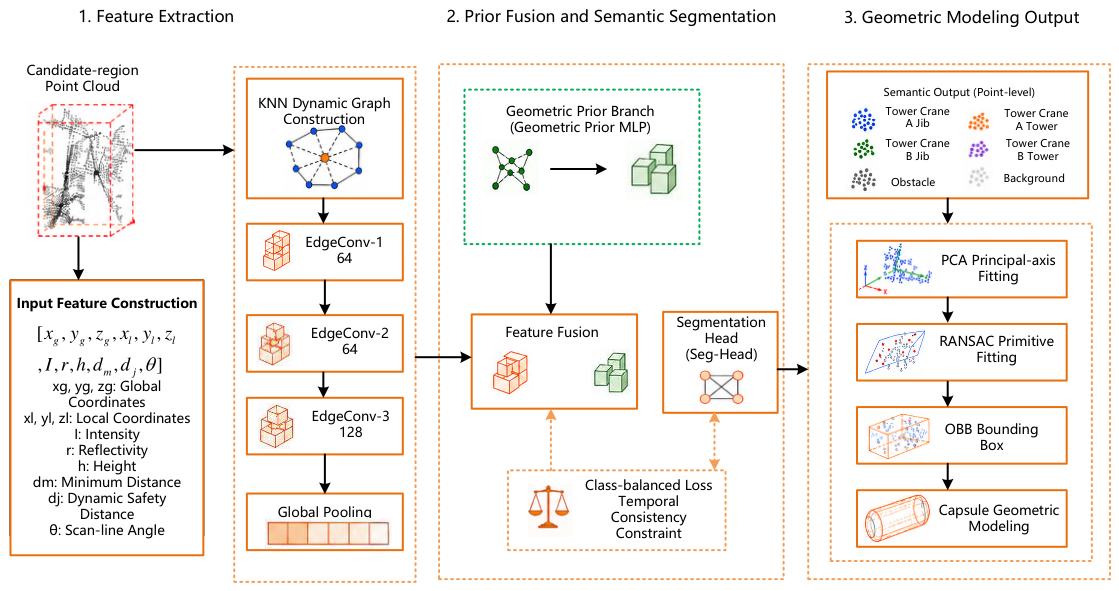
As shown in Figure 5, the candidate-region point cloud first enters the input feature construction module. To improve the recognition stability of the two crane jibs in dual tower-crane scenarios, multi-dimensional point features are introduced based on conventional 3D coordinate input. For point , the input feature is defined as:
where are the global coordinates of the point, are the intra-cluster locally normalized coordinates, I is the reflection intensity, r is the range from the point to the LiDAR, h is the height of the point relative to the tower-crane foundation, is the distance from the point to the tower axis, is the distance from the point to the theoretical jib axis or the previous-frame predicted jib axis, and is the polar angle of the point relative to the slewing center. These features encode the spatial distribution of the point cloud together with tower-crane structural geometry and motion constraints for distinguishing the two jib classes from surrounding structural and obstacle points.
Figure 5.
Task-oriented point-cloud segmentation and geometric-modeling stage.
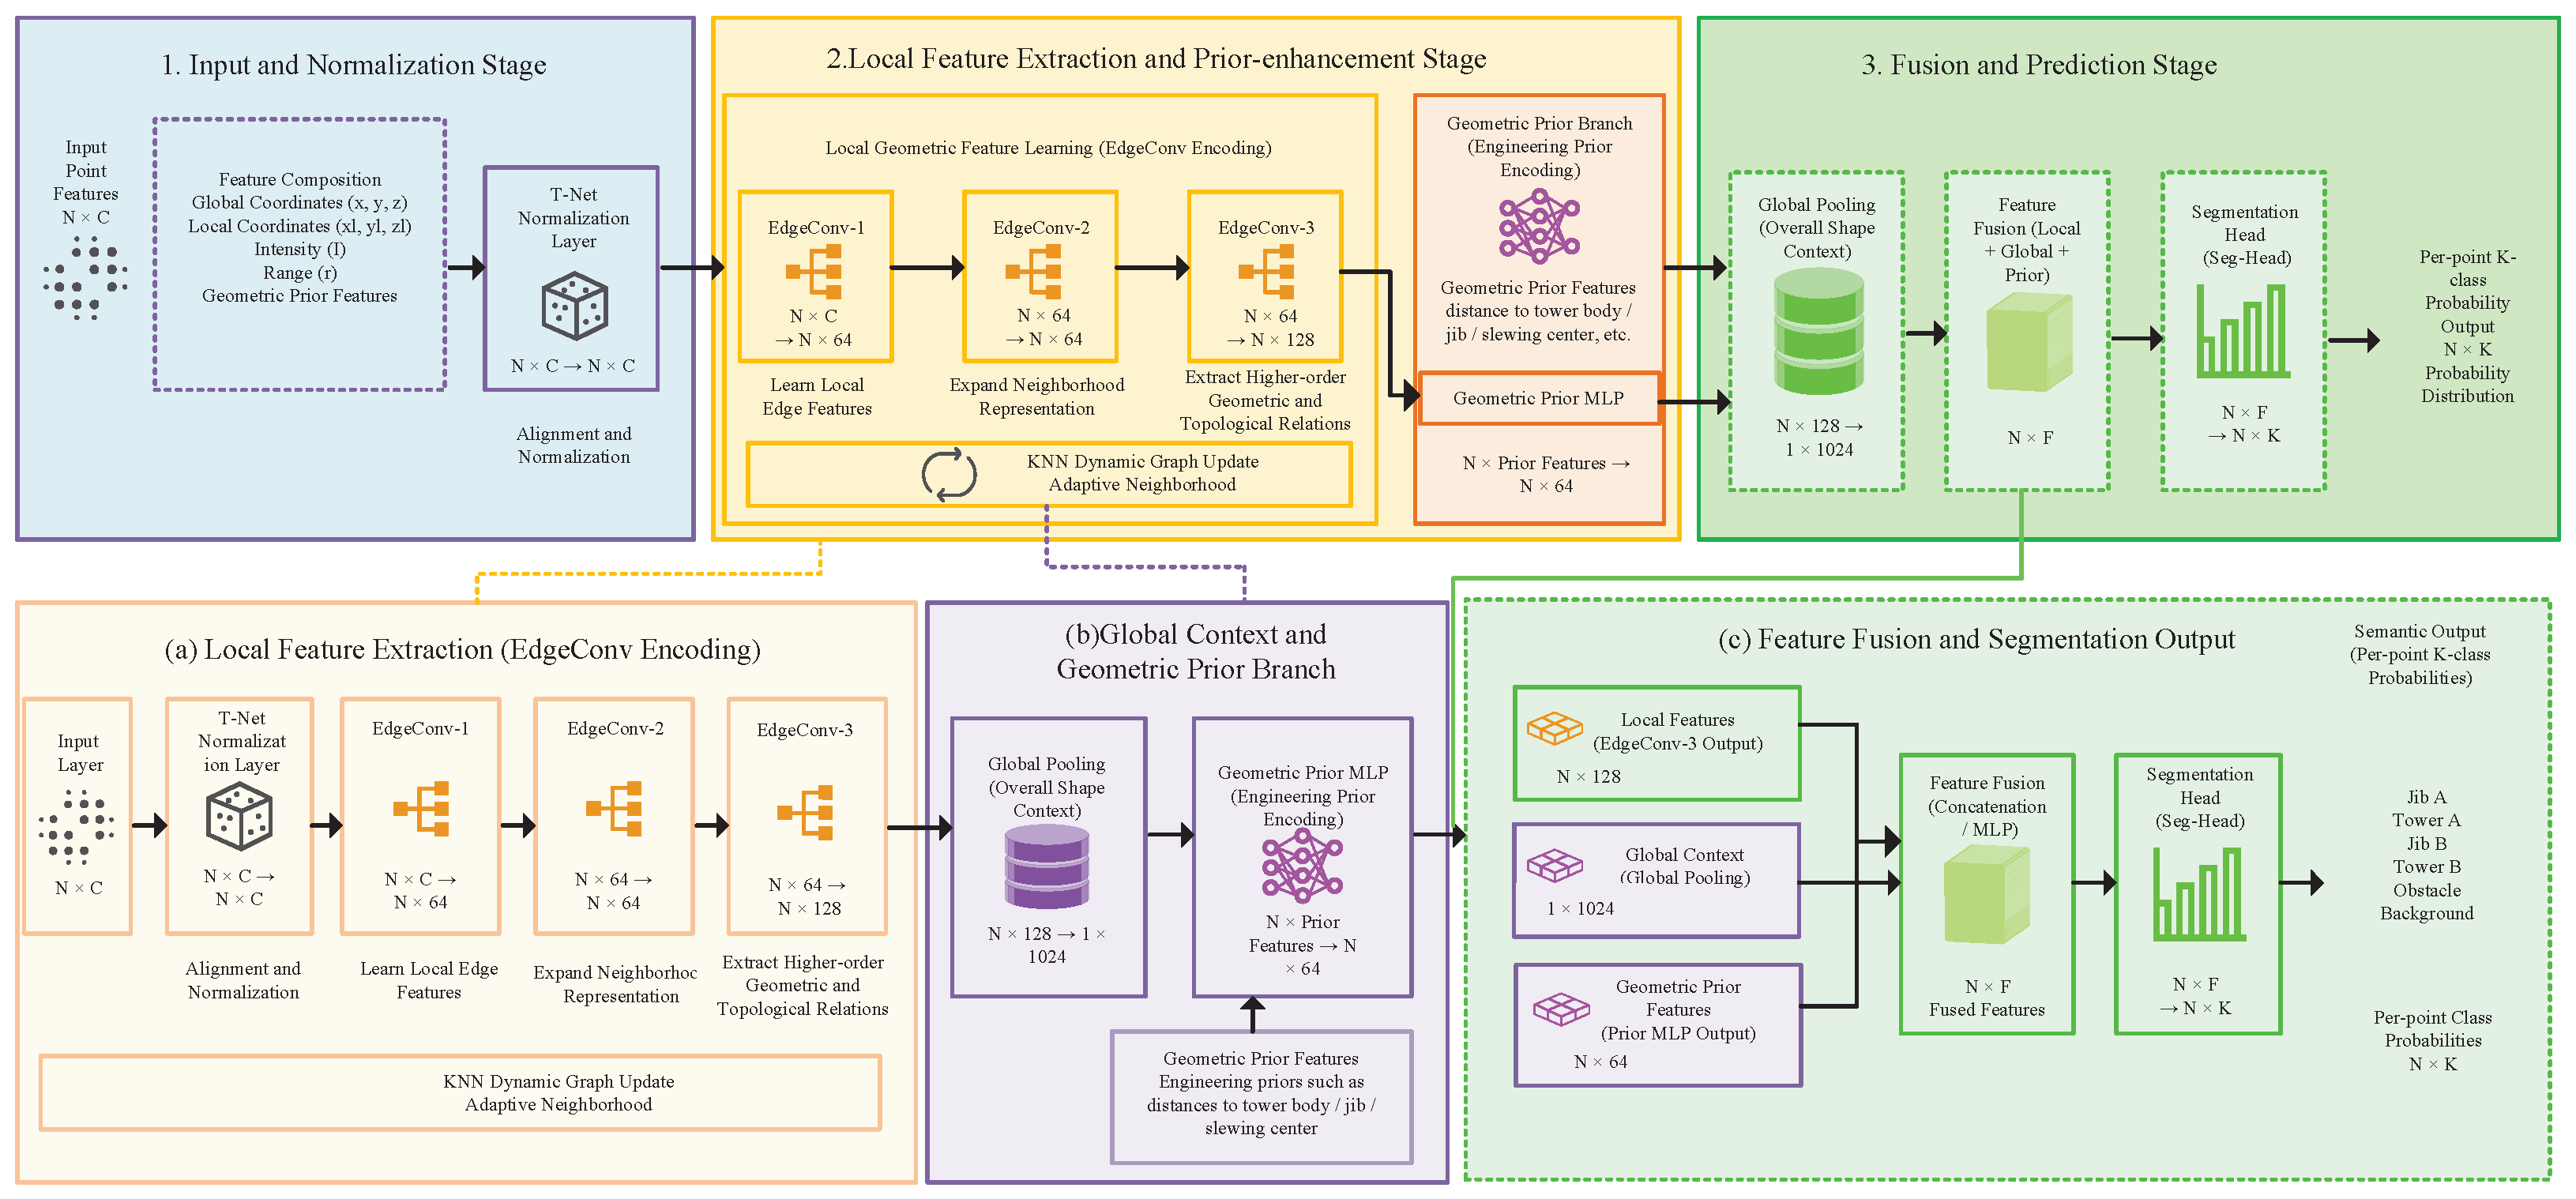
In the feature extraction stage, the network constructs a dynamic graph through KNN and uses EdgeConv to learn local geometric relationships between points and their neighboring points. EdgeConv-1 mainly learns local edge features, such as the linear structure of jib members and local point relationships. EdgeConv-2 expands neighborhood representation and enhances the perception of local component shape. EdgeConv-3 further extracts high-level geometric structures and topological relationships. Subsequently, global pooling extracts the overall shape context of candidate point cloud clusters, enabling the network to complete point-level classification using both local geometry and global structural information.
In the prior-fusion and semantic-segmentation stage, a geometric prior branch is designed. The branch adopts a multi-layer MLP to encode prior features such as the distance from points to the tower axis, the predicted jib axis, the slewing center, and the height range. The prior encoding is then fused with the local features extracted by EdgeConv and the global pooled features. The fused representation combines local point-cloud morphology with the spatial topology of tower-crane components for semantic classification of the two crane jibs, their corresponding tower structures, surrounding obstacles, and background.
The segmentation head uses a multi-layer perceptron to output the six class probabilities for each point. The semantic output classes include Tower Crane A jib, Tower Crane A tower structure, Tower Crane B jib, Tower Crane B tower structure, obstacle, and background. Since the number of points belonging to the two jib classes is usually smaller than the number of points belonging to large tower structures and surrounding obstacles, class imbalance can easily occur during training. Therefore, class-balanced loss and temporal consistency constraints are introduced, and data augmentation strategies such as class-aware sampling, local occlusion augmentation, random rotation, and coordinate jittering are combined to improve the recognition stability of the two jib classes. The comprehensive loss function is defined as:
where is the cross-entropy loss, is used to alleviate class imbalance, constrains the distance from points on the same jib to the fitted centerline, constrains the semantic labels and geometric poses of the same tracked target in adjacent frames to avoid unreasonable abrupt changes, and are the corresponding loss weights.
As shown in Figure 6, the main data flow of GT-DGCNN can be summarized as follows. The input point features first pass through T-Net or a normalization layer for scale alignment; then EdgeConv-1, EdgeConv-2, and EdgeConv-3 successively extract local edge features, multi-scale neighborhood structures, and high-level topological relationships. Global pooling then obtains the overall context of the candidate point cloud cluster. In parallel, the geometric prior MLP encodes the tower-crane structural priors. Finally, local features, global features, and geometric prior features are concatenated, and the segmentation head outputs the probability that each point belongs to K component classes.
Figure 6.
GT-DGCNN network hierarchy and data flow.
After semantic segmentation, the system converts the segmented jib point clouds into geometric models for distance calculation. PCA is first used to estimate the principal direction of the jib point cloud, and RANSAC is then used to fit the jib centerline and remove obvious outliers. The jibs of the two tower cranes are represented by the following line segments:
where and are the slewing centers or jib-root points, and and are the jib endpoints. The outputs of geometric fitting include the jib centerline, endpoint coordinates, axis angle, bounding-box size, and fitting confidence.
The jib line segment is expanded into a capsule to represent its structural width and safety margin. Let denote the jib line segment of tower crane i, the equivalent radius, and the safety expansion radius. The jib safety envelope can then be expressed as:
where denotes the distance from point to the jib centerline . The capsule model incorporates the jib structural width, point-cloud recognition error, geometric fitting error, and engineering safety redundancy into collision judgment.
Construction-site point clouds may contain short-term occlusion, sparse sampling, and frame-to-frame label variation. Kalman filtering and the previous-frame bounding box are used to maintain continuous estimates of the jib states. When the confidence of the current-frame result decreases, the previous-frame bounding box is used to extract a local region from the current point cloud for secondary recognition.
A point-cloud cluster is retained as a confirmed jib or tower component when its semantic confidence satisfies the predefined threshold and its estimated state is consistent with the synchronized encoder state. A cluster that does not satisfy these conditions is assigned to the generic-obstacle category, and an obstacle collision body is generated for subsequent distance calculation and warning assessment. The cluster remains in the monitored point-cloud sequence during temporal state updating.
When the semantic-confidence and encoder-consistency conditions are satisfied again in subsequent frames, the corresponding semantic class is updated and the class-specific collision body is reconstructed. The temporal tracker then continues state estimation using the restored component identity. Its outputs include the centerline sequences of the two jibs, angular velocity, relative velocity, confidence, and trajectory-smoothed geometric bodies.
In the dual tower-crane anti-collision risk model, each jib is represented as a rigid long arm rotating about the vertical tower axis. Let denote the slewing center of tower crane i, its jib length, and its synchronized encoder angle. The encoder-derived jib endpoint is expressed as
Here, denotes the rotation matrix about the vertical axis. The synchronized encoder state is used together with the point-cloud-derived centerline to evaluate state consistency and maintain the temporal identity of each jib.
The risk-warning module calculates collision risk within the current and future short-term time windows. This paper introduces swept-volume continuous collision detection to avoid missed detections caused by checking the distance between two jibs only at discrete time instants. For a tower-crane jib, the swept volume can be understood as the union of the spaces occupied by the jib capsule over a future time interval. Let H be the future prediction horizon and be the time step. The swept volume of the jib of tower crane i within the future time window can be expressed as:
For the two tower-crane jibs, the capsules and of the two cranes at time are predicted respectively, and the minimum distance is calculated as:
The dynamic safety distance is defined as:
where is the basic safety distance, is the relative velocity between the two jibs, is the point-cloud recognition and geometric fitting error, m is the additional engineering safety margin, is the velocity response coefficient, and k is the positioning-error amplification coefficient. If exists within the future time window, the system determines that the two jibs are at risk of approaching each other.
In this study, time to collision (TTC) denotes the predicted time to the first entry into the safety zone defined by the separation threshold between the two jib envelopes. Let denote the envelope separation predicted at the current time t for the future time . The dynamic safety distance is calculated using Equation (12) for the current frame and held constant over its prediction horizon. TTC is defined as follows:
Here, is the prediction time offset and H is the prediction horizon. TTC equals zero when the current envelope separation is already at or below the safety threshold. Otherwise, it represents the earliest predicted threshold-entry time. If no threshold entry is predicted within the horizon, TTC is assigned positive infinity. This value indicates the absence of a predicted threshold entry within the evaluated horizon, rather than a guarantee of safety beyond that horizon.
Multi-level warnings are determined using the current envelope separation, the predicted minimum separation, and TTC. A red danger warning is issued when the current envelope separation is at or below the dynamic safety distance, or when TTC is at or below the calibrated danger-time threshold. Predicted threshold entries with longer lead times are assigned orange or yellow warning levels according to the corresponding calibrated TTC thresholds. The predicted minimum separation is retained for proximity assessment, while TTC distinguishes the urgency of predicted safety-threshold entry.
Warning-threshold calibration accounts for crane model, braking performance, and site management requirements. The prediction horizon H, time step , basic safety distance , velocity response coefficient , positioning-error amplification coefficient k, and safety margin m are calibrated under different operating conditions and govern the warning sensitivity and false-alarm behavior.
4. Results
4.1. Experimental Parameters and Evaluation Formulas
To comprehensively evaluate the effectiveness of the proposed method, experimental indicators are set from four aspects: point cloud segmentation accuracy, geometric fitting error, risk-warning performance, and real-time processing capability. Point cloud segmentation accuracy evaluates the model’s ability to recognize the two tower-crane jibs, their corresponding tower structures, surrounding obstacles, and background. Geometric fitting error evaluates whether semantic segmentation results can be accurately converted into geometric models such as jib centerlines, bounding boxes, and capsules. Risk-warning performance evaluates the system’s ability to identify potential collision events, missed alarms, false alarms, and early warnings. Real-time processing capability evaluates whether the system meets online monitoring requirements on construction sites. Based on these goals, OA, mIoU, Precision, Recall, F1, geometric errors, warning recall, missed-alarm rate, false-alarm rate, lead warning time, and FPS are selected as experimental evaluation indicators.
Let , , and denote the true positives, false positives, and false negatives of class k, respectively. The precision, recall, and F1-score of class k are defined as follows:
The intersection over union of class k is:
The mean intersection over union is calculated over all six semantic classes (), including background:
Overall accuracy is defined as:
where N is the total number of points in the test set. Since the number of points belonging to large tower structures and surrounding obstacles is usually much larger than the number of jib points, using OA alone may lead to overestimated evaluation results. Therefore, this paper focuses on the IoU, Recall, and F1-score of the two jib classes, because the accuracy of jib segmentation directly affects subsequent centerline fitting and collision-risk assessment.
Geometric-modeling performance is evaluated by comparing the point-cloud-derived jib endpoints, axis directions, and minimum separation distances with encoder-derived reference geometry. The slewing angles of the two crane jibs are obtained from synchronized encoders. The slewing centers, jib lengths, and installation heights of the two tower cranes are used as known geometric parameters.
For tower crane , the reference jib endpoint at frame i is calculated as
Here, denotes the measured slewing center, denotes the jib length, and denotes the synchronized encoder angle. The installation height is incorporated into the vertical coordinate of . The corresponding reference unit direction vector is
The reference jib axis is defined by and . The reference minimum distance is calculated from the two encoder-derived geometric models using the same collision-body distance definition as the point-cloud-derived models. Let and denote the endpoint and unit axis direction estimated from the point-cloud-derived geometric model. The three geometric errors are defined as
Here, M denotes the number of evaluated frames. The angular error is reported in degrees, while the endpoint positioning error and minimum-distance error are reported in meters.
Temporal tracking is characterized by the jib tracking success rate, denoted by . The evaluation unit is a reference jib–frame pair within the monitored workspace. A pair is successful when the tracker provides a valid jib-state estimate associated with the correct crane identity (A or B), as determined from the reference labels. A missing estimate, an incorrect crane identity, or assignment of the jib to the generic-obstacle category counts as a tracking failure. Frames outside the monitored workspace or without an evaluable reference identity are excluded.
Here, is the number of successfully tracked jib–frame pairs and is the total number of evaluable reference jib–frame pairs. The metric measures the availability of correctly identified jib-state estimates; their geometric accuracy is evaluated separately using the endpoint, angular, and minimum-distance errors.
Risk-warning performance is mainly evaluated by dangerous-event recall, missed-alarm rate, false-alarm rate, warning-level accuracy, and average lead warning time. Let denote the number of dangerous events correctly warned, the number of dangerous events not warned, the number of safe events falsely warned, and the number of safe events correctly identified as safe. The dangerous-event recall is:
The missed-alarm rate is:
The false-alarm rate is:
The warning-level accuracy is:
If the true risk occurrence time of the j-th dangerous event is and the system’s first valid warning time is , the average lead warning time is:
Real-time performance is evaluated by end-to-end latency and frame rate. Let be the input time of point cloud frame i and be the time at which the system outputs the warning level. The average end-to-end latency is:
The system processing frame rate is:
4.2. Experimental Data and Operating Conditions
The experimental data comprise a normal-condition real-site dataset, a Unity-generated training-supplementation dataset, and a real-site environmental dataset.
The normal-condition real-site dataset contains 20,000 point-cloud frames collected during representative dual-tower-crane operations, including slewing, jib crossing, partial occlusion, and different relative positions of the two jibs.
The Unity-generated dataset contains 10,000 point-cloud frames acquired using virtual LiDAR sensors in a dual-tower-crane simulation environment. The simulated scenes cover extreme-approach, height-difference, and hazardous relative configurations. The virtual LiDAR parameters, installation positions, viewing directions, and sensing geometry were configured according to the real system. These frames were incorporated into the training set as supplementary samples of operating configurations with limited real-site data.
The real-site environmental dataset contains 5000 point-cloud frames collected under nighttime, rainy, foggy, and dusty conditions. This dataset is used to evaluate semantic segmentation, temporal tracking, and geometric modeling under adverse environmental conditions.
The semantic ground-truth labels were generated through manual point-cloud annotation. Five annotators used CloudCompare and followed a unified annotation protocol. Each valid point was assigned to one of six semantic classes: Tower Crane A jib, Tower Crane A tower structure, Tower Crane B jib, Tower Crane B tower structure, obstacle, and background. Consistent component-boundary rules were applied throughout the annotation process. Hooks, wire ropes, trolleys, and suspended loads were assigned to the obstacle class, while background was annotated as a separate semantic class. To provide an overview of the data sources and their allocation, Table 1 summarizes the composition and partitioning of the point-cloud datasets.
Table 1.
Composition and partitioning of the point-cloud datasets.
The normal-condition real-site data were partitioned at the sequence level. All frames from the same continuous acquisition sequence or complete operation round were assigned to the same subset. Of the 20,000 normal-condition real-site frames, 18,000 were allocated to training and validation, and 2000 were reserved for testing. The validation subset was used for model selection and hyperparameter tuning, and the test subset was used for performance evaluation. The 10,000 Unity-generated frames were incorporated into the training subset. The 5000 real-site frames collected under nighttime, rainy, foggy, and dusty conditions constitute the environmental-condition test set.
The experimental platform is a workstation for model training and inference testing, with an Intel Core i7-class processor, 64 GB memory, and an NVIDIA RTX 3090 GPU with 24 GB of video memory. The software environment uses Ubuntu 20.04, PyTorch 2.1.2, and CUDA 11.8.
The complete dataset contains 35,000 point-cloud frames. The model-training data consist of the training subset of the normal-condition real-site dataset and the 10,000 Unity-generated frames. Model validation uses the validation subset of the normal-condition real-site dataset. The test datasets contain 7000 real-site point-cloud frames, comprising 2000 normal-condition frames and 5000 environmental-condition frames. All 10,000 Unity-generated frames are used exclusively for training.
4.3. Network Comparison and Ablation Experiments
The ablation experiments use DGCNN as the common baseline. Four intermediate configurations are constructed by separately combining the baseline with geometric priors, class-balanced loss, adaptive voxel sampling, and temporal tracking. The complete GT-DGCNN configuration integrates all four components. Table 2 combines the network-comparison and ablation configurations.
Table 2.
Network comparison and ablation results for point-cloud segmentation and collision warning.
The DGCNN baseline achieved an mIoU of 80.9%, a jib recall of 84.3%, a missed-alarm rate of 7.8%, and a processing rate of 16.7 FPS. The baseline with geometric priors achieved an mIoU of 83.2% and a jib recall of 87.6%. The baseline with class-balanced loss achieved an mIoU of 84.0% and a jib recall of 88.1%. The baseline with adaptive voxel sampling achieved an mIoU of 84.8%, a jib recall of 88.9%, and a processing rate of 18.9 FPS. The baseline with temporal tracking achieved an mIoU of 85.7%, a jib recall of 90.1%, and a missed-alarm rate of 3.8%. The complete GT-DGCNN configuration achieved an mIoU of 87.3%, a jib recall of 91.7%, a missed-alarm rate of 2.4%, and a processing rate of 17.2 FPS.
Table 2 lists mIoU values of 80.2% for PointNet++, 82.1% for RandLA-Net, and 87.3% for GT-DGCNN, corresponding to differences of 7.1 and 5.2 percentage points between GT-DGCNN and the two comparison networks. The corresponding jib IoU values are 77.0%, 78.9%, and 85.8%, while jib recall is 83.8%, 85.6%, and 91.7%, respectively. The missed-alarm rates are 8.2%, 7.1%, and 2.4%. RandLA-Net has the highest processing rate in the table, at 22.0 FPS; PointNet++ and GT-DGCNN operate at 17.5 and 17.2 FPS, respectively.
4.4. Robustness Comparison Under Different Environmental Conditions
The environmental-condition experiments use the independent 5000-frame real-site dataset described in Table 1. The dataset covers nighttime, rainy, foggy, and dusty conditions. The daytime results obtained from the 2000-frame normal-condition real-site test subset are used as the reference condition. Crane type, LiDAR installation position, point-cloud acquisition frequency, network configuration, and warning parameters are kept consistent across the evaluated conditions.
The environmental evaluation compared segmentation, tracking, and geometric-modeling performance across daytime, nighttime, rain, fog, and dust. Segmentation was characterized by mIoU and jib IoU, tracking by tracking success rate, and geometric modeling by endpoint positioning, jib-axis angular, and minimum-distance errors. Table 3 reports these metrics for each condition, with the geometric errors expressed as mean ± standard deviation.
Table 3.
Segmentation, tracking, and geometric-modeling performance under different environmental conditions.
As shown in Table 3, the system achieves the best recognition and tracking performance under daytime clear conditions, with mIoU, jib IoU, and tracking success rate of 87.6%, 92.1%, and 96.8%, respectively. Under nighttime low illumination, the three indicators decrease by 0.7, 0.6, and 0.7 percentage points, respectively. Under rain, fog, and dust, segmentation accuracy and tracking success rate are lower than under daytime conditions. The foggy condition shows the largest decrease, with mIoU decreasing to 82.8%, jib IoU to 87.4%, and tracking success rate to 92.0%. Across the five evaluated conditions, mIoU ranges from 82.8% to 87.6%, jib IoU from 87.4% to 92.1%, and tracking success rate from 92.0% to 96.8%.
4.5. Geometric Modeling Accuracy
The point-cloud-derived jib endpoints, jib-axis directions, and minimum separation distances were compared with the synchronized encoder-derived reference geometry. The mean and standard deviation of the endpoint positioning error, jib-axis angular error, and minimum-distance error under different environmental conditions are reported together with the segmentation and tracking results in Table 3.
Under daytime conditions, the endpoint positioning error, jib-axis angular error, and minimum-distance error were 0.22 ± 0.09 m, 0.20 ± , and 0.16 ± 0.07 m, respectively. The corresponding nighttime errors increased slightly to 0.24 ± 0.10 m, 0.22 ± , and 0.18 ± 0.08 m. Higher mean errors and standard deviations were observed under rainy, foggy, and dusty conditions. Fog produced the largest mean endpoint positioning and jib-axis angular errors, at 0.34 ± 0.16 m and 0.32 ± , respectively. Dust produced the largest mean minimum-distance error, at 0.25 ± 0.11 m, while fog exhibited the largest standard deviation for this metric, at 0.13 m.
4.6. Collision-Warning Performance
Collision-warning performance is evaluated using complete jib approach-and-separation events. Table 4 summarizes the hazardous and safe event counts and warning results. Detection and missed-alarm rates are calculated over hazardous events; the false-alarm rate is calculated over safe events. A hazardous event is detected when a valid warning is issued by the reference risk-onset time. Warning-level accuracy is evaluated against the reference event labels. Lead time is calculated for correctly detected hazardous events, and latency is measured from point-cloud input to warning output.
Table 4.
Event-level collision-warning performance.
The warning evaluation used the same dataset over approximately 100 runs, with 50 hazardous and 50 safe event evaluations per operating condition in each run, yielding a cumulative total of 5000 hazardous and 5000 safe event evaluations per condition. Percentage metrics were averaged across runs. Warning lead time is reported as the mean and standard deviation pooled over correctly detected hazardous event evaluations across runs, while processing latency is summarized over all processed point-cloud frames across runs.
H/S denotes the cumulative numbers of hazardous and safe event evaluations across repeated runs under each operating condition, rather than counts of unique events. Lead time and latency are reported as pooled mean ± standard deviation over correctly detected hazardous event evaluations and processed point-cloud frames, respectively.
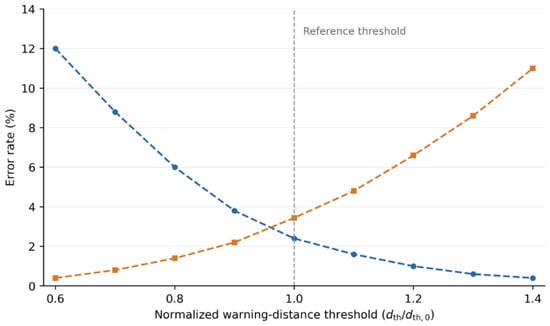
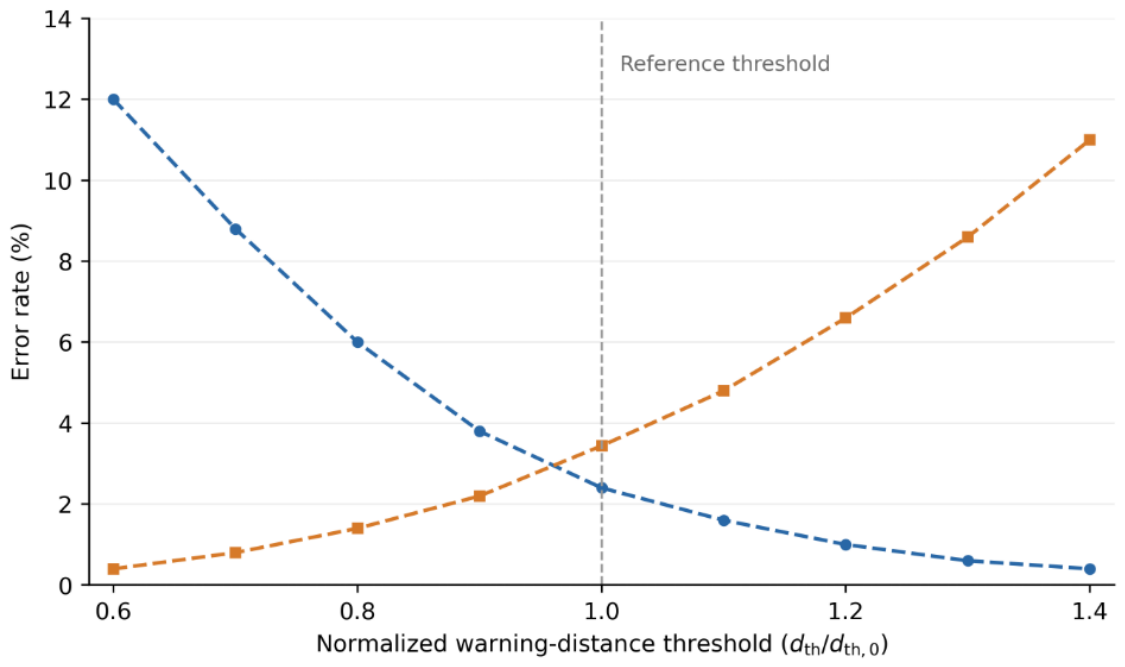
Figure 7 presents the threshold-sensitivity results obtained using the same collision-warning pipeline as in Table 4. The horizontal axis is the normalized warning-distance threshold , where is the evaluated threshold and is its reference value. At each threshold ratio, the event-level missed-alarm and false-alarm rates are calculated separately for the five environmental conditions and then averaged with equal weights. At the reference ratio of 1.0, the mean missed-alarm and false-alarm rates are approximately 2.4% and 3.4%, respectively. Table 4 reports the results separately for each condition. Over the evaluated range, increasing the warning-distance threshold reduces the missed-alarm rate and increases the false-alarm rate.
Figure 7.
Event-level missed-alarm and false-alarm rates averaged across five environmental conditions versus the normalized warning-distance threshold. Blue: missed-alarm rate; orange: false-alarm rate; vertical dashed line: baseline threshold.
Blue circles denote the mean missed-alarm rates, and orange squares denote the mean false-alarm rates across the five environmental conditions. The vertical dashed line marks the reference threshold ratio of 1.0. Connecting lines serve as visual guides.
4.7. Experimental Result Analysis
The complete GT-DGCNN configuration increased mIoU from 80.9% to 87.3% and jib recall from 84.3% to 91.7% relative to the DGCNN baseline, corresponding to gains of 6.4 and 7.4 percentage points. The missed-alarm rate decreased from 7.8% to 2.4%, while the processing rate increased from 16.7 to 17.2 FPS.
The environmental experiments showed small differences between daytime and nighttime performance and larger reductions under rain, fog, and dust. Fog yielded the lowest segmentation and tracking scores and the largest mean endpoint positioning and jib-axis angular errors. Dust yielded the largest mean minimum-distance error. These results describe the variation in recognition, tracking, and geometric accuracy across the evaluated environmental conditions.
In the independent ablation configurations, geometric priors and class-balanced loss increased jib recall to 87.6% and 88.1%, respectively. Adaptive voxel sampling achieved the highest processing rate among the ablation configurations, at 18.9 FPS, with an mIoU of 84.8%. Temporal tracking reduced the missed-alarm rate to 3.8%. The complete configuration achieved the highest mIoU and jib recall and the lowest missed-alarm rate among the six ablation configurations.
Beyond the quantitative results, the proposed method is not intended to replace encoder- or IMU-based kinematic localization of rigid crane jibs. When complete kinematic states, geometric parameters, and continuous calibration are available, encoder- and IMU-based monitoring systems can efficiently reconstruct nominal jib poses and provide direct separation estimates for two isolated rigid jibs. In the proposed system, synchronized PLC/encoder information provides nominal motion states, frame-wise coordinate updates, and state-consistency checking, whereas LiDAR provides the observed geometry of the monitored crossing workspace and non-instrumented surrounding objects.
The LiDAR–PLC fusion framework combines crane operating states with on-site geometric observations for collision-risk warning between two rigid jibs. Semantic segmentation distinguishes the two jibs, their corresponding tower structures, and surrounding objects in the point clouds. The extracted jib point sets provide the geometry for collision-envelope construction, and consecutive-frame observations support relative-motion estimation and short-term risk prediction. Synchronized PLC/encoder data support temporal alignment, coordinate transformation, and state-consistency checking. The contribution of the framework is the integration of scene perception, jib geometric modeling, and collision-risk prediction for dual tower-crane crossing operations.
Compared with generic point-cloud segmentation networks, the proposed GT-DGCNN configuration incorporates geometric priors, class-balanced learning, adaptive voxel sampling, and temporal tracking for the six-class dual-crane construction-site segmentation task. As shown in Table 2, the complete configuration achieves an mIoU of 87.3%, a jib IoU of 85.8%, a jib recall of 91.7%, and a missed-alarm rate of 2.4%. These results exceed those of PointNet++, RandLA-Net, and the DGCNN baseline under the same evaluation setting. The contribution does not arise from the isolated use of RANSAC, DBSCAN, capsule fitting, or a conventional point-cloud network; rather, it lies in the task-oriented integration and quantitative validation of semantic perception, temporal target handling, geometric collision-body construction, and collision warning for dual-crane crossing operations.
The proposed method also has limitations. Its performance depends on LiDAR visibility, site-specific sensor placement, and point-cloud quality, and its processing rate of 17.2 FPS is lower than the 22.0 FPS achieved by RandLA-Net. The environmental-condition experiments are included as robustness validation of the LiDAR perception component, rather than as the primary evidence of methodological novelty. Direct comparison with an encoder-only warning baseline under obstacle-inclusive crossing scenarios remains an important direction for future work.
5. Conclusions
This paper proposes a real-time anti-collision warning method for dual tower-crane jibs based on LiDAR point cloud segmentation and swept-volume continuous collision detection. The method takes multi-source 4D point clouds as input, uses an improved GT-DGCNN to identify key crane components, converts jib point clouds into engineering geometric models such as centerlines, OBBs, and capsules, and further performs multi-level warning based on dynamic safety distance, TTC, and future swept volumes. By combining synchronized crane-state information with LiDAR observations, the proposed method estimates the geometric states of the two jibs and predicts their short-term collision risk. The PLC/encoder information provides nominal motion states, time synchronization, frame-wise coordinate updates, and state-consistency checking, whereas LiDAR supplies the observed workspace geometry required for semantic perception and collision-body construction. The experimental results demonstrate the method’s performance in jib segmentation, geometric modeling, and event-level collision warning during dual-jib crossing operations.
Future work will extend the current field validation to additional construction sites, crane models, and longer-term operating conditions. In addition, tower-crane model, braking performance, and site safety management requirements will be further combined to calibrate dynamic safety distance, TTC thresholds, and warning-level judgment strategies so that the warning results better fit engineering practice.
Author Contributions
Conceptualization, Y.S. and X.M.; methodology, Y.S., X.M. and W.H.; software, W.H.; validation, W.Y., C.W., M.L. and W.H.; formal analysis, X.M. and W.H.; investigation, W.Y., C.W. and M.L.; resources, W.Y., C.W. and M.L.; data curation, W.H., C.W. and M.L.; writing—original draft preparation, W.H. and X.M.; writing—review and editing, Y.S., X.M. and W.Y.; visualization, W.H.; supervision, Y.S. and X.M.; project administration, W.Y. and Y.S. All authors have read and agreed to the published version of the manuscript.
Funding
This research received no external funding.
Institutional Review Board Statement
Not applicable.
Informed Consent Statement
Not applicable.
Data Availability Statement
Restrictions apply to the availability of these data. Data were obtained from Shanghai SMUVision Smart Technology Ltd. and are available from the authors with the permission of Shanghai SMUVision Smart Technology Ltd.
Conflicts of Interest
Author Chong Wang, Mingjun Li, and Wang Yao were employed by the company Shandong Hi-Speed Company Limited. Author Weiyuan Huang was employed by the company Beijing Xinqiao Technology Development Co., Ltd. Author Yang Shen was employed by the company Shanghai SMUVision Smart Technology Ltd. The remaining author declare that the research was conducted in the absence of any commercial or financial relationships that could be construed as a potential conflict of interest. The authors declare that this study received no external funding and that no commercial products, samples, or instruments were used in the experiments.
References
- Huang, L.; Zhang, Y.; Zheng, J.; Cai, P.; Dutta, S.; Yue, Y.; Thalmann, N.; Cai, Y. Point cloud based path planning for tower crane lifting. In Proceedings of the Computer Graphics International 2018; ACM: New York, NY, USA, 2018; pp. 211–220. [Google Scholar]
- Huang, L.; Dutta, S.; Cai, Y. Laser scanned real environment for intelligent virtualization of crane lifting. Virtual Real. Intell. Hardw. 2020, 2, 87–103. [Google Scholar] [CrossRef] [Scilit]
- Li, Y.; Liu, C. Integrating field data and 3D simulation for tower crane activity monitoring and alarming. Autom. Constr. 2012, 27, 111–119. [Google Scholar] [CrossRef] [Scilit]
- Zhang, Y.; Chen, K. Digital technologies for enhancing crane safety in construction: A combined quantitative and qualitative analysis. J. Civ. Eng. Manag. 2023, 29, 604–621. [Google Scholar] [CrossRef] [Scilit]
- Jeong, H.; Hong, H.; Park, G.; Won, M.; Kim, M.; Yu, H. Point cloud segmentation of crane parts using Dynamic Graph CNN for crane collision avoidance. J. Comput. Sci. Eng. 2019, 13, 99–106. [Google Scholar] [CrossRef] [Scilit]
- Liang, D.; Chen, Z.; Kong, L.; Wu, Y.; Chen, S.-H.; Xue, F. 4D point cloud (4DPC)-driven real-time monitoring of construction mobile cranes. In Proceedings of the 2023 European Conference on Computing in Construction, Crete, Greece, 10–12 July 2023. [Google Scholar]
- Liang, D.; Chen, S.-H.; Chen, Z.; Xue, F. 4D point cloud-based spatial-temporal semantic registration for monitoring mobile crane construction activities. Autom. Constr. 2024, 163, 105422. [Google Scholar] [CrossRef] [Scilit]
- Mirzaei, K.; Arashpour, M.; Asadi, E.; Masoumi, H.; Bai, Y. 3D point cloud data processing with machine learning for construction and infrastructure applications: A comprehensive review. Adv. Eng. Inform. 2022, 51, 101501. [Google Scholar] [CrossRef] [Scilit]
- Qi, C.R.; Su, H.; Mo, K.; Guibas, L.J. PointNet: Deep learning on point sets for 3D classification and segmentation. In Proceedings of the CVPR; IEEE: New York, NY, USA, 2017; pp. 652–660. [Google Scholar]
- Qi, C.R.; Yi, L.; Su, H.; Guibas, L.J. PointNet++: Deep hierarchical feature learning on point sets in a metric space. In Advances in Neural Information Processing Systems; Curran Associates, Inc.: Red Hook, NY, USA, 2017; Volume 30. [Google Scholar]
- Wang, Y.; Sun, Y.; Liu, Z.; Sarma, S.E.; Bronstein, M.M.; Solomon, J.M. Dynamic Graph CNN for learning on point clouds. ACM Trans. Graph. 2019, 38, 146. [Google Scholar] [CrossRef] [Scilit]
- Hu, Q.; Yang, B.; Xie, L.; Rosa, S.; Guo, Y.; Wang, Z.; Trigoni, N.; Markham, A. RandLA-Net: Efficient semantic segmentation of large-scale point clouds. In Proceedings of the CVPR; IEEE: New York, NY, USA, 2020; pp. 11108–11117. [Google Scholar]
- Thomas, H.; Qi, C.R.; Deschaud, J.-E.; Marcotegui, B.; Goulette, F.; Guibas, L.J. KPConv: Flexible and deformable convolution for point clouds. In Proceedings of the ICCV; IEEE: New York, NY, USA, 2019; pp. 6411–6420. [Google Scholar]
- Rusu, R.B.; Cousins, S. 3D is here: Point Cloud Library (PCL). In Proceedings of the ICRA; IEEE: New York, NY, USA, 2011; pp. 1–4. [Google Scholar]
- Ester, M.; Kriegel, H.-P.; Sander, J.; Xu, X. A density-based algorithm for discovering clusters in large spatial databases with noise. In Proceedings of the KDD; AAAI Press: Menlo Park, CA, USA, 1996; pp. 226–231. [Google Scholar]
- Fischler, M.A.; Bolles, R.C. Random sample consensus: A paradigm for model fitting with applications to image analysis and automated cartography. Commun. ACM 1981, 24, 381–395. [Google Scholar]
- Schnabel, R.; Wahl, R.; Klein, R. Efficient RANSAC for point-cloud shape detection. Comput. Graph. Forum 2007, 26, 214–226. [Google Scholar] [CrossRef] [Scilit]
- Gottschalk, S.; Lin, M.C.; Manocha, D. OBBTree: A hierarchical structure for rapid interference detection. In Proceedings of the SIGGRAPH; ACM: New York, NY, USA, 1996; pp. 171–180. [Google Scholar]
- Larsen, E.; Gottschalk, S.; Lin, M.C.; Manocha, D. Fast Proximity Queries with Swept Sphere Volumes; Technical Report TR99-018; University of North Carolina: Chapel Hill, NC, USA, 1999. [Google Scholar]
- Redon, S.; Kheddar, A.; Coquillart, S. Fast continuous collision detection between rigid bodies. Comput. Graph. Forum 2002, 21, 279–287. [Google Scholar] [CrossRef] [Scilit]
- Schock-Schmidtke, A.; Bernabé Caparrós, G.; Fottner, J. 3D vision based anti-collision system for automatic load movements with tower cranes—A simulation oriented development process. In Proceedings of the 2025 Winter Simulation Conference; IEEE: New York, NY, USA, 2025; pp. 2646–2657. [Google Scholar]
- Zhao, S.; Yu, C.; Zhong, R.Y. Digital twin-enabled anti-collision system for smart construction sites. Smart Constr. 2025, 2, 0022. [Google Scholar] [CrossRef] [Scilit]

Disclaimer/Publisher’s Note: The statements, opinions and data contained in all publications are solely those of the individual author(s) and contributor(s) and not of MDPI and/or the editor(s). MDPI and/or the editor(s) disclaim responsibility for any injury to people or property resulting from any ideas, methods, instructions or products referred to in the content. |
© 2026 by the authors. Licensee MDPI, Basel, Switzerland. This article is an open access article distributed under the terms and conditions of the Creative Commons Attribution (CC BY) license.