


Abstract
Pulse thyristors are extensively utilized in pulsed plasma discharge applications. In this study, a pulse switch prototype is built using two parallel valve groups, each consisting of seven series-connected thyristors. Each thyristor is equipped with an anti-parallel protection diode, a static voltage-sharing resistor, and an RCD (resistor-capacitor-diode) dynamic voltage-sharing circuit. The prototype withstands 24 kV, delivers 150 kA peak current, operates at 10 Hz, and can run continuously for 1 s. Thermal analysis is essential under narrow-pulse high-current conditions to avoid failure from localized overheating. By investigating the expansion process of the conduction zone during thyristor turn-on, a single-thyristor turn-on model and a finite-element model of the multi-layer series thyristor module are established to analyze transient temperature distributions. Results show a non-uniform temperature profile across the silicon wafer, with the hottest zone near the gate ring. During repetitive pulses, the silicon temperature fluctuates rapidly, while the copper base heats up gradually. At a spreading speed of 30 m/s, the gate terminal temperature rises about 38 °C—within safe limits for now, but projected to exceed them under future operating conditions. Thus, improved thermal management will be critical in further development.
1. Introduction
In fusion reactors, particle fuel serves as one of the critical methods for maintaining the steady-state operation of high-confinement plasmas. Injecting fuel particles directly into the core region of high-temperature and high-density plasmas facilitates the realization of tritium self-sufficiency and high fusion gain [1]. However, traditional particle fuel methods, such as gas puffing or pellet injection, may be inadequate for large-scale, high-magnetic-field, and high-temperature fusion plasmas because of challenges in penetration depth. The Compact Torus Injector (CTI) represents an innovative approach, functioning on principles analogous to those of a magnetized coaxial plasma gun. This system produces a compact, high-density, high-velocity plasmoid distinguished by its strong magnetic structure and rapid acceleration capabilities. Owing to these advantages, the CTI technique has been proposed as a primary fueling scheme [2,3].
In steady-state magnetic confinement fusion reactors, the pulsed operational nature of CTI necessitates that fuel injection systems support repetitive operation to sustain continuous deuterium-tritium fuel cycles [4,5,6,7]. As specified for the CTI designed for the International Thermonuclear Experimental Reactor (ITER), the required repetition rate must reach up to 50 Hz [5]. Historically, repetitive CTI systems have primarily employed ignitrons as pulsed switching devices. For example, the ignitron-based solution employed in the University of Saskatchewan Compact Torus Injector (USCTI) achieved a repetition rate of up to 10 Hz [8], whereas in EAST-CTI, a repetition rate of up to 2 Hz was achieved [9]. However, inherent limitations in their post-arc recovery characteristics and current-carrying capacity render these systems inadequate for meeting the stringent power density requirements for core fuel in fusion reactors. Specifically, ignitrons possess a limited charge transfer capacity, preventing operation at a relatively high pulse number. Furthermore, ignitrons suffer from severely limited service life. The CTI design for ITER has proposed the pulse thyristor as the main switch for the CTI [4]. Due to the limited voltage withstand capability and current-carrying capacity of individual thyristors, the ITER CTI design paper proposed employing pulse thyristors in series–parallel configurations to enhance both parameters. However, as the CTI has not yet been constructed for ITER, detailed thyristor design specifications have not been reported.
The MKPx 200-50 thyristor developed by CRRC Co., Ltd. from China for high-power electronic systems has a monolithic withstand voltage of 5 kV, a peak current of more than 200 kA, and a current rise rate (di/dt) of 20 kA/μs. Therefore, on the basis of this pulse thyristor, a series thyristor module prototype was developed for realizing the repetitive operation of the CTI. This prototype achieves a withstand voltage of 24 kV, a current-carrying capacity of 150 kA, a repetition rate of 10 Hz, and continuous operation for 1 s. These parameters are relatively conservative, and the limit parameters have not been tested. For a higher current-carrying capacity, the thermal issue of the thyristor becomes prominent. Therefore, a thermal simulation model of this series thyristor module prototype needs to be developed to analyze its transient temperature distributions. This thyristor is not yet a fully mature commercial product, and its performance parameters are not yet well-defined, especially the repetition rate. The pulse switch prototype is also custom-designed for the CTI. Currently, its repetition rate limit cannot be estimated. The pulse switch prototype operates under conservative parameter conditions, which are unable to meet the core fueling requirements of CTI for future steady-state, high-magnetic-field fusion reactors. The issue of overheating affects its reliable operation. Therefore, the heat generation must be estimated to ensure it remains within a Safe Operating Area (SOA). A high repetition rate will definitely exceed the SOA limit. Therefore, thermal simulation is utilized to estimate its SOA range.
Under pulsed power conditions, the high peak currents flowing through the thyristor prototype result in significant power losses within the devices [10]. These losses are dissipated as heat, leading to a temperature rise at the semiconductor junction. Sustained junction temperature increases under repetitive pulse conditions can alter device characteristics and ultimately compromise normal operation [11,12]. When the junction temperature exceeds 125 °C, unintended triggering may occur, and further temperature elevation can lead to thermal breakdown, causing irreversible damage to the device [13,14,15]. Consequently, thermal analysis of thyristors is critical to ensure reliable operation. The thermal characterization of thyristors primarily encompasses three principal methodologies: thermal impedance model analysis, gate diffusion model analysis, and silicon carrier diffusion model analysis. Thermal impedance model analysis utilizes a Foster model-based simulation program to evaluate thermal impedance and predict device temperature variations under high-surge current conditions [11]. Gate diffusion model analysis is based on thermal conduction and convection theories within thyristors, involving the construction of a transient heat conduction model driven by gate diffusion velocity to simulate temperature evolution under repetitive pulse currents [16]. Silicon carrier diffusion model analysis formulates two-dimensional physics-based equations for the thyristor, capturing the interdependence between carrier concentration distribution and thermal generation [17].
This study establishes a finite-element simulation model to investigate the transient temperature field distribution during thyristor turn-on under narrow-pulse, high-current conditions. The model is employed to assess whether the selected thyristors satisfy the experimental requirements and to provide theoretical support for subsequent experiments. The structure of this paper is as follows: first, the heat transfer mechanism in thyristors is theoretically analyzed; second, a finite-element model is developed to characterize the temperature distribution; third, simulation results are used to identify the maximum localized temperatures during high-current pulse operation; and finally, the conclusions derived from the investigation are presented. No existing thermal simulation model has been developed specifically for CTI thyristors. Therefore, this paper is aimed at addressing the thermal simulation requirements for CTI thyristors by drawing upon well-established simulation techniques from other fields to conduct targeted modeling and analysis. Compared with previous CTI power supplies, the innovation of this work lies in its innovative incorporation of an all-solid-state semiconductor solution, enabling high-repetition-rate operation.
2. Series Thyristor Module Prototype
2.1. Topology of the Thyristor Modules
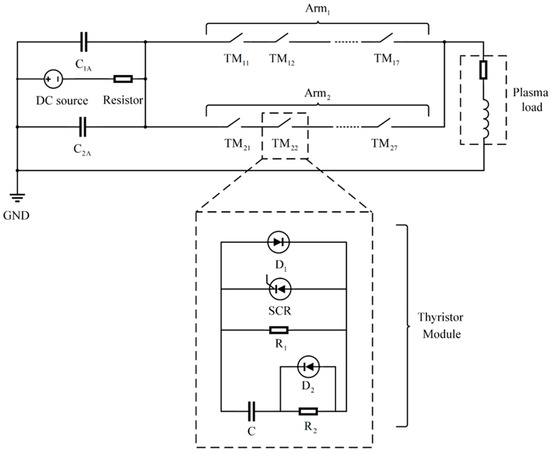
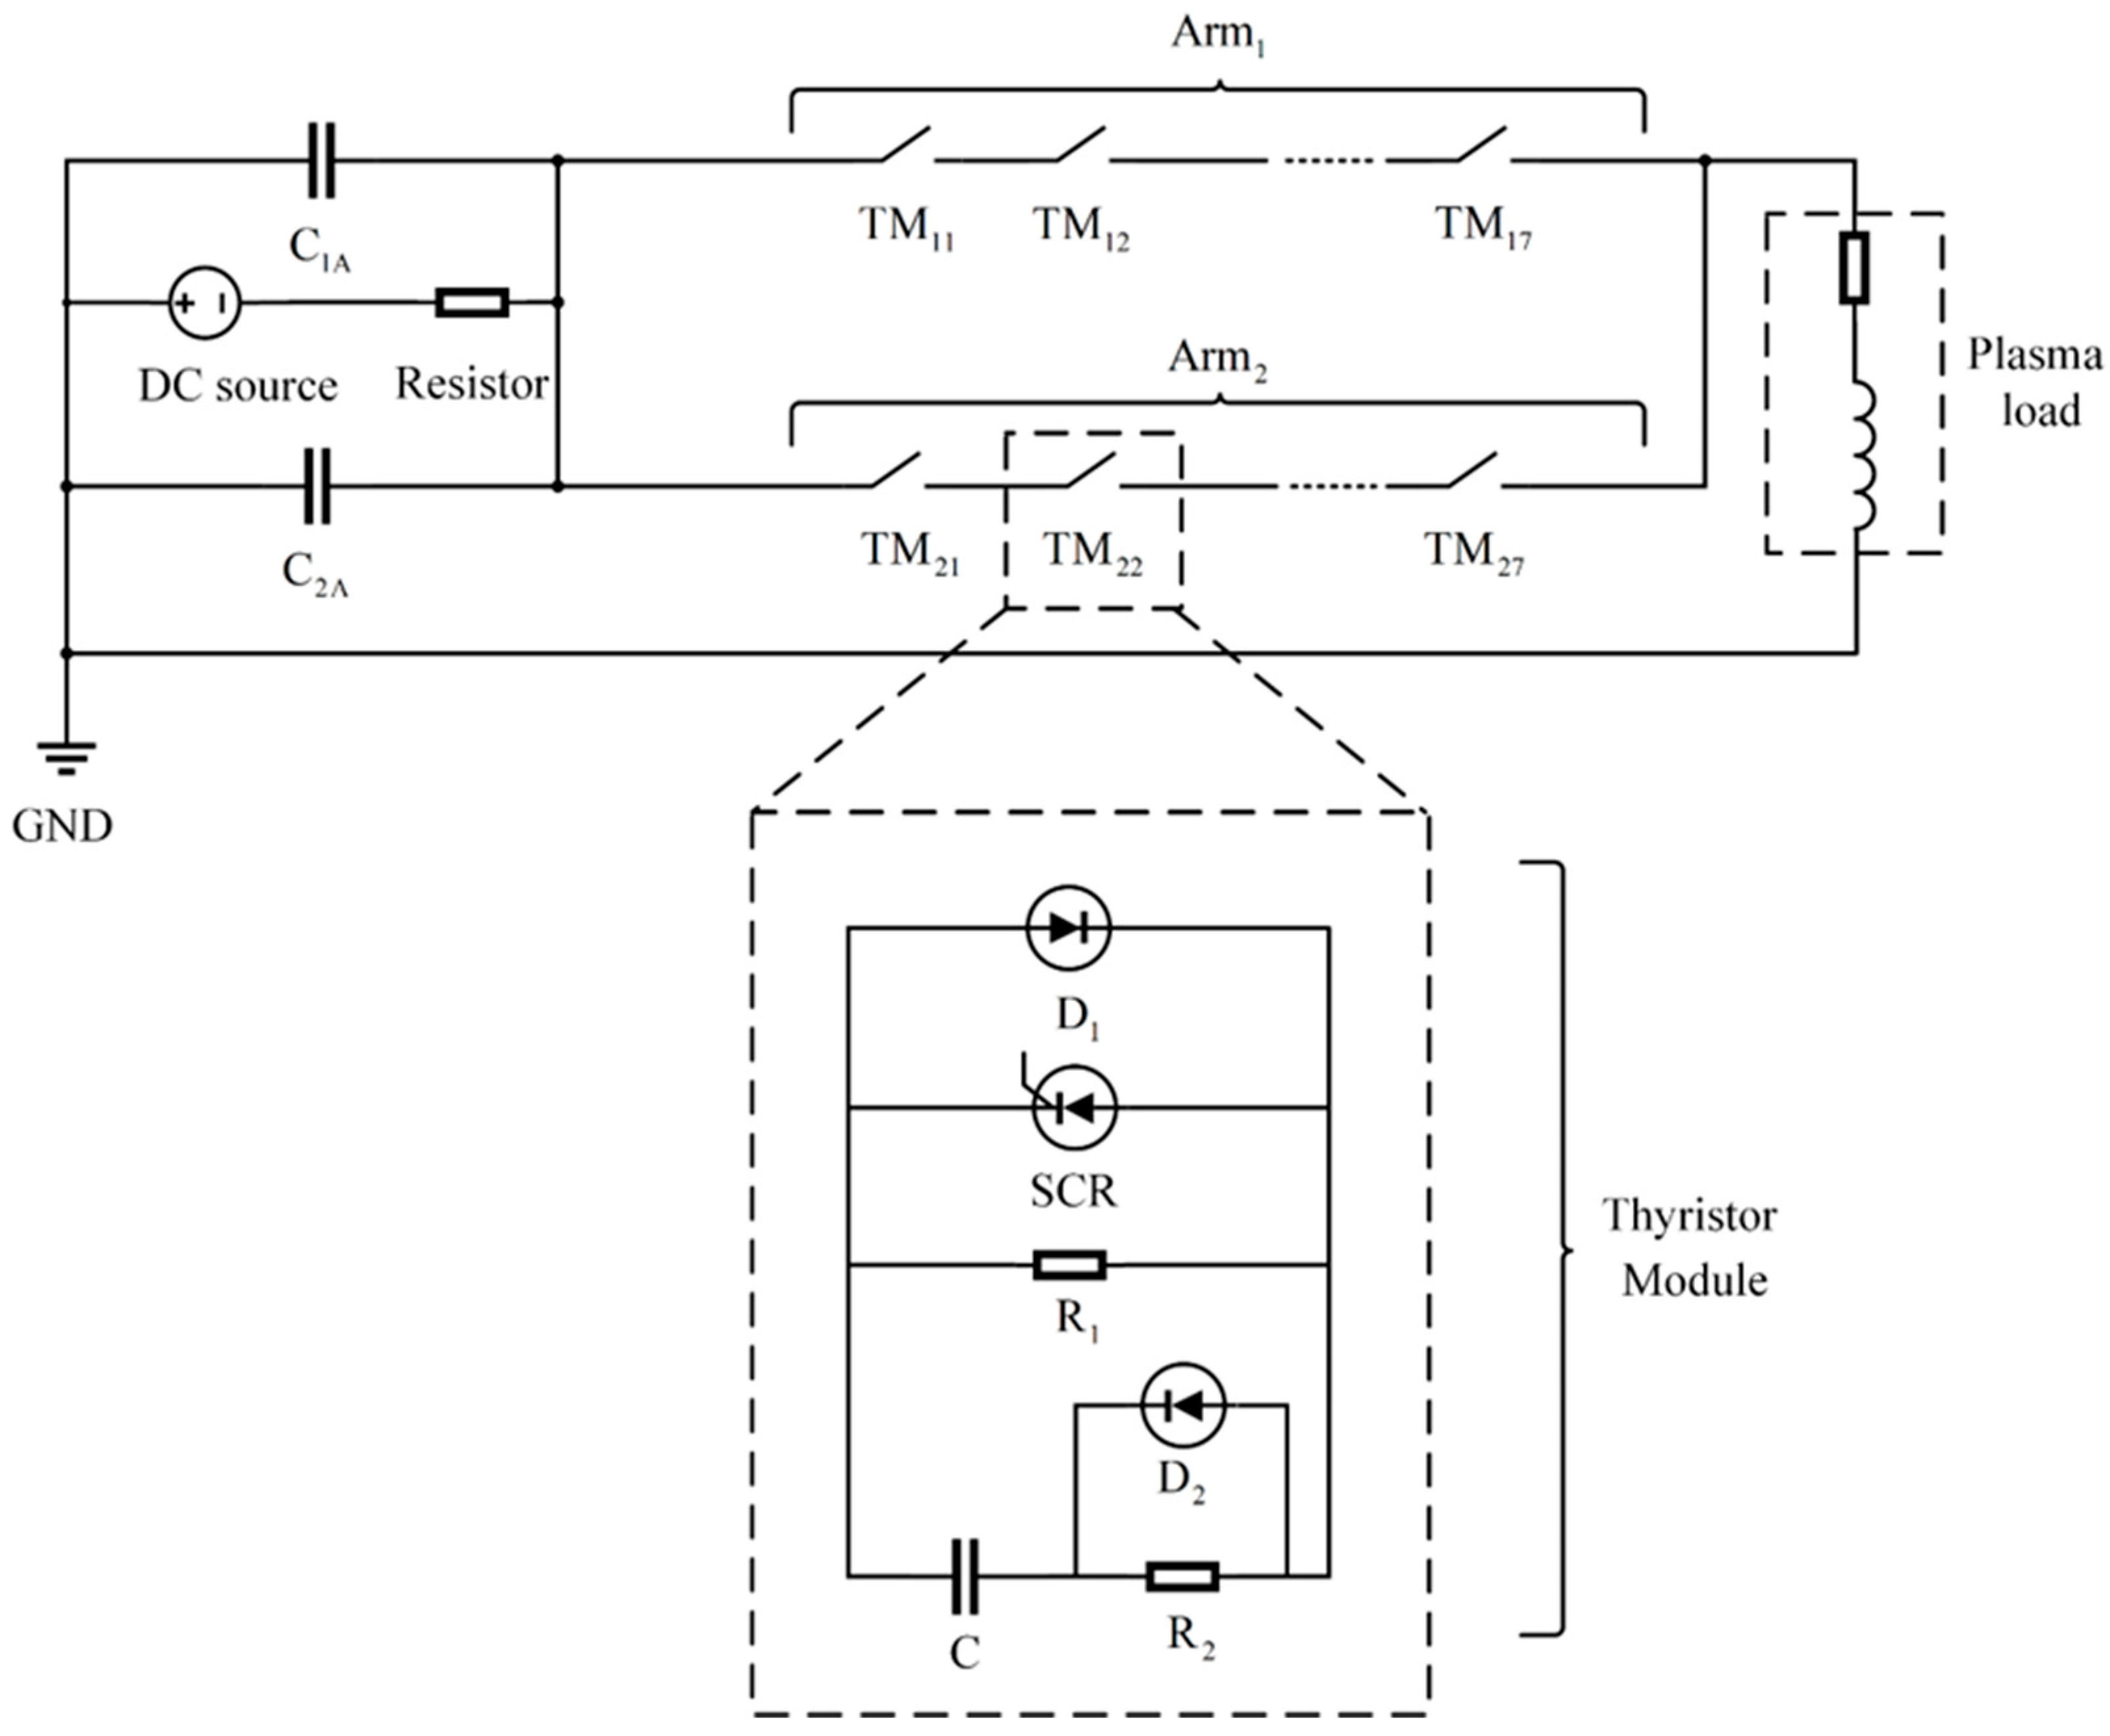
Under pulsed power conditions, a single semiconductor device cannot fulfill the required voltage and current ratings. Therefore, a series–parallel configuration of multiple devices is essential to construct a switch group assembly. To enable pulsed plasma discharge, a series thyristor module prototype has been developed, consisting of seven identical thyristor modules connected in series to form a single valve group, with two such valve groups connected in parallel, as depicted in Figure 1. Each thyristor is equipped with an anti-parallel diode across its terminals to provide a reverse current path for protection. However, due to inherent variations in thyristor characteristics—encompassing both static and dynamic parameters—uneven voltage distribution may arise during operation, posing a risk of device failure.
Figure 1.
Schematic overview of the system and detailed structure of a thyristor module (TM).
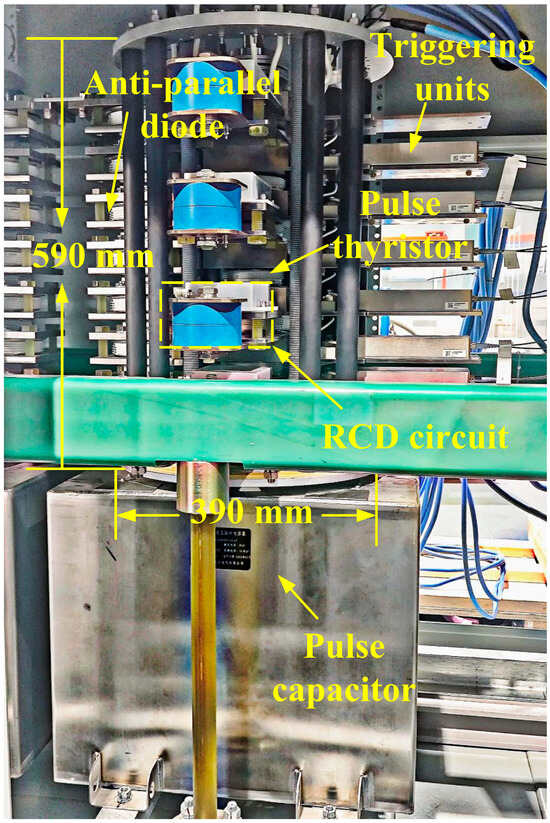
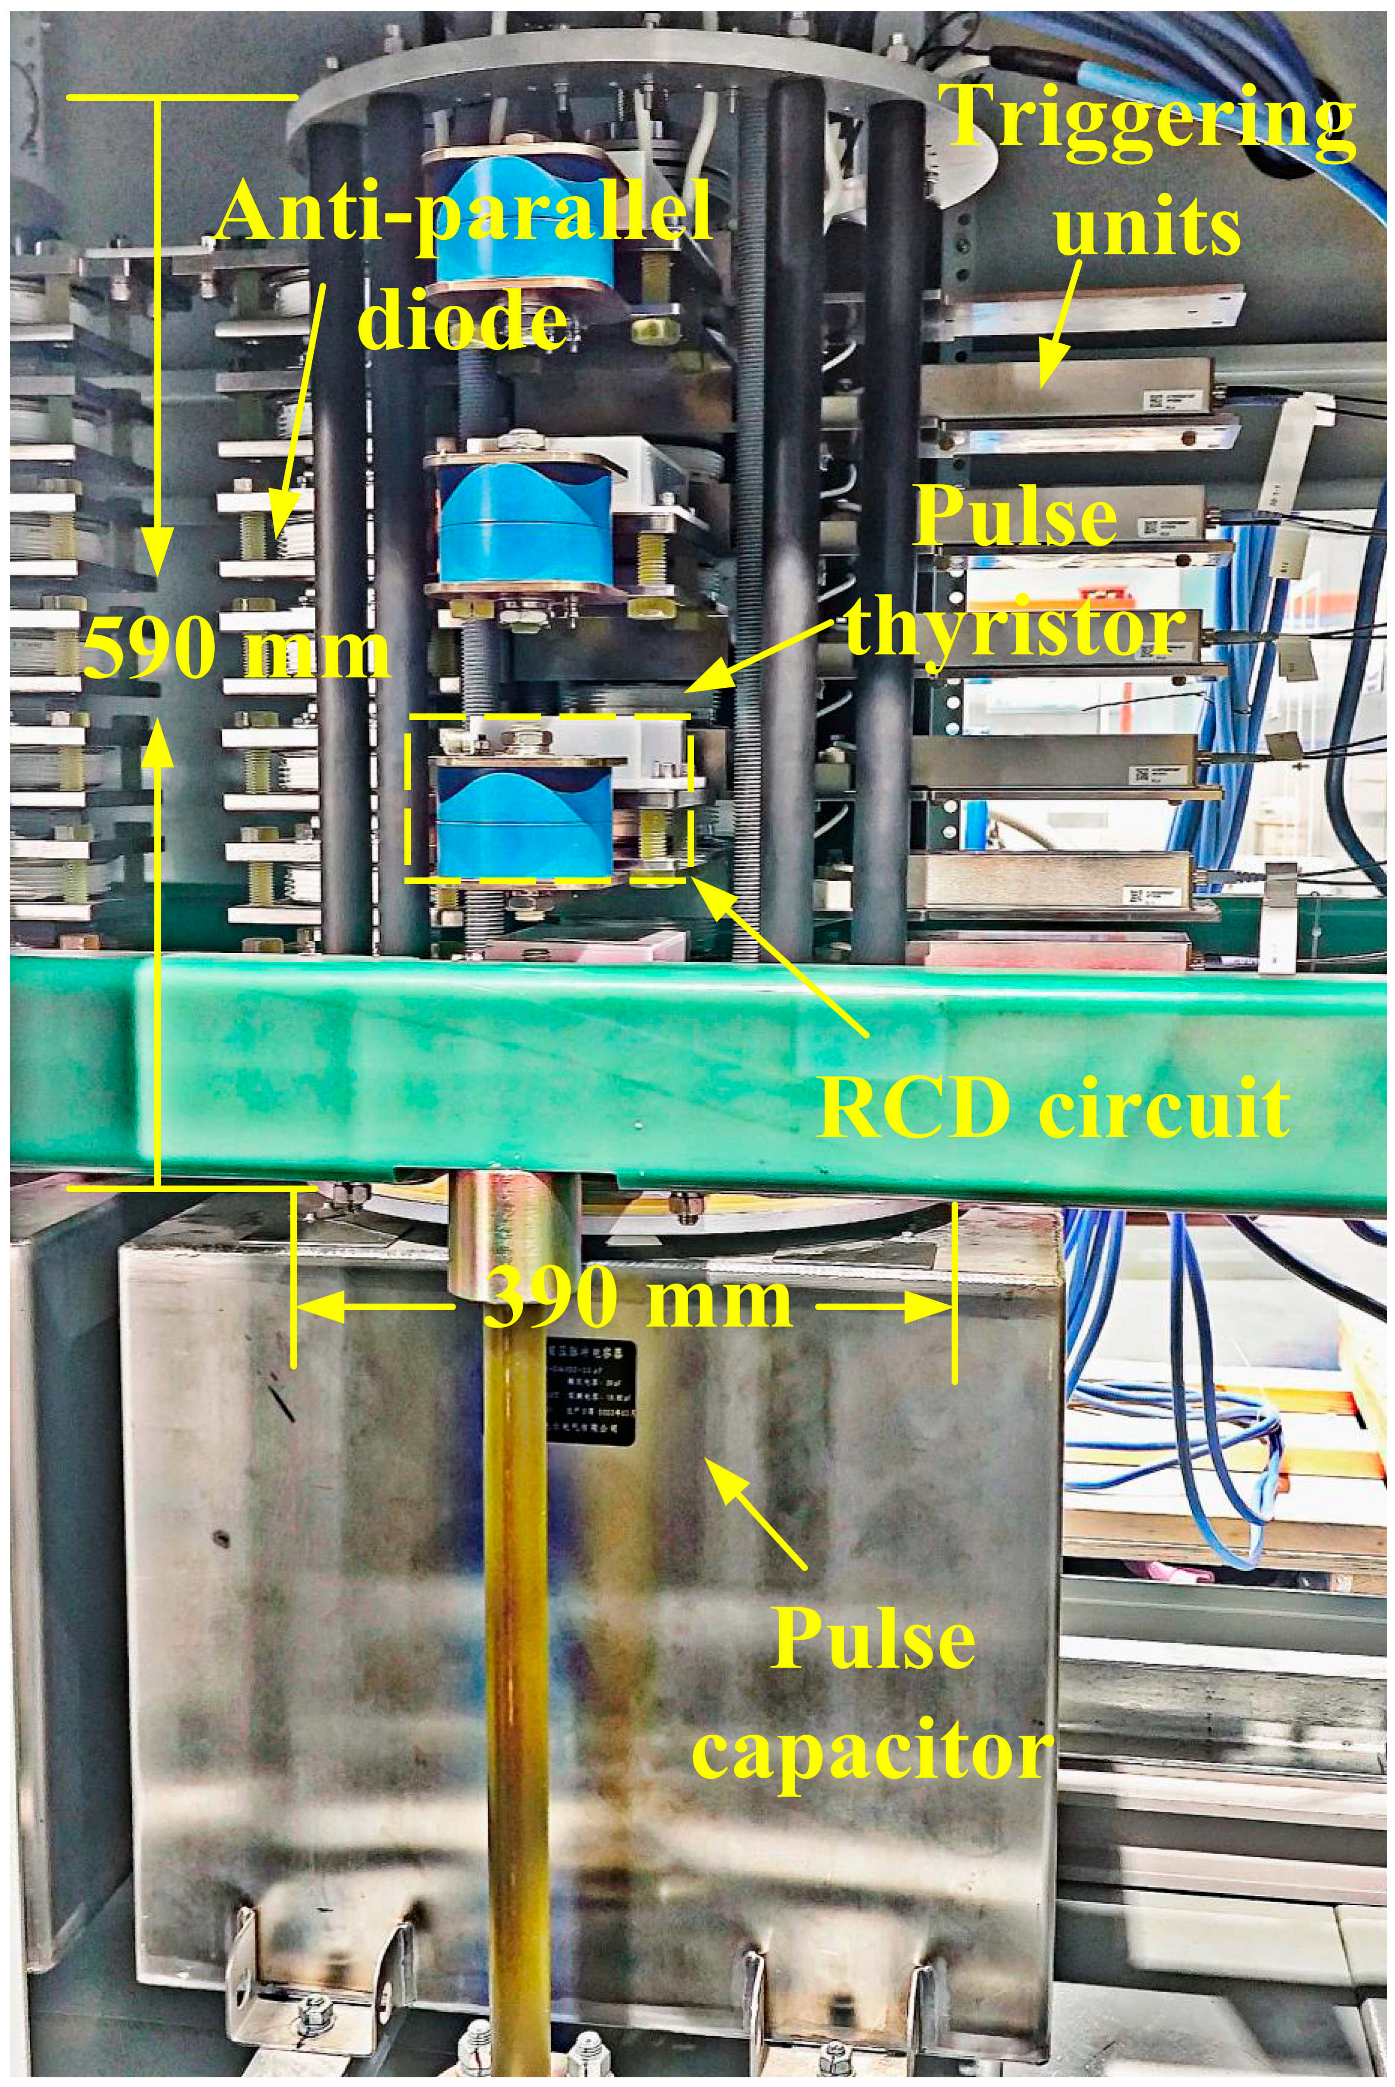
During pulsed power supply operation, the switches are responsible for blocking the capacitor voltage. However, mismatches in the static voltage-current (V–I) characteristics of the thyristors result in unequal voltage distribution across individual devices in the blocking state. To address this, relatively high-resistance resistors are connected in parallel with each thyristor to ensure static voltage balancing. During both turn-on and turn-off processes, thyristor switches experience uneven voltage distribution due to intrinsic characteristic variations and differences in triggering times. As a result, parallel RCD (Resistor–Capacitor–Diode) snubber circuits are employed to serve as dynamic voltage balancing components [18]. To improve heat dissipation performance, a solid aluminum alloy heat sink block is positioned at the center of each thyristor. A physical photograph of the assembly is shown in Figure 2.
Figure 2.
Series thyristor module prototype.
2.2. Short-Circuit Experimental Results
To investigate the switching performance of the series thyristor module prototype, an experimental platform was constructed with the topology depicted in Figure 1. The setup comprises fourteen thyristor modules (, … , , …, ) and load components, including resistance R and inductance L. Furthermore, the energy storage capacitors have a capacitance of 20 μF each, and the system was subjected to discharge tests using negative voltage. During the initial phase, the DC power supply charges the capacitor to its operating voltage, after which the charging circuit is disconnected. Subsequently, the pulse switch prototype initiates the discharge circuit, forming an underdamped oscillatory system composed of the capacitor, loop resistance, and inductance. This configuration produces a decaying oscillatory current waveform.
In the performance validation of high-voltage power electronic equipment, the voltage withstand capability of the thyristor prototype serves as a critical indicator of reliability. To rigorously assess its insulation performance under extreme operating conditions, the prototype first underwent a 24 kV voltage withstand test. This was followed by short-circuit testing, during which peak currents reached up to 150 kA—equivalent to 75 kA per series group—at a maximum repetition rate of 10 Hz and a discharge duration of 1 s. These conditions do not represent the operational limits of the thyristor prototype. Under elevated voltage and repetition rates, substantial transient thermal effects are expected to arise within the thyristors, potentially causing excessive junction temperatures that degrade electrical characteristics and reduce service life. Therefore, subsequent thermal simulation analysis is warranted.
2.3. Circuit Parameters of Plasma Discharge
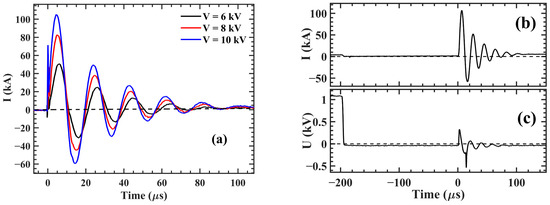
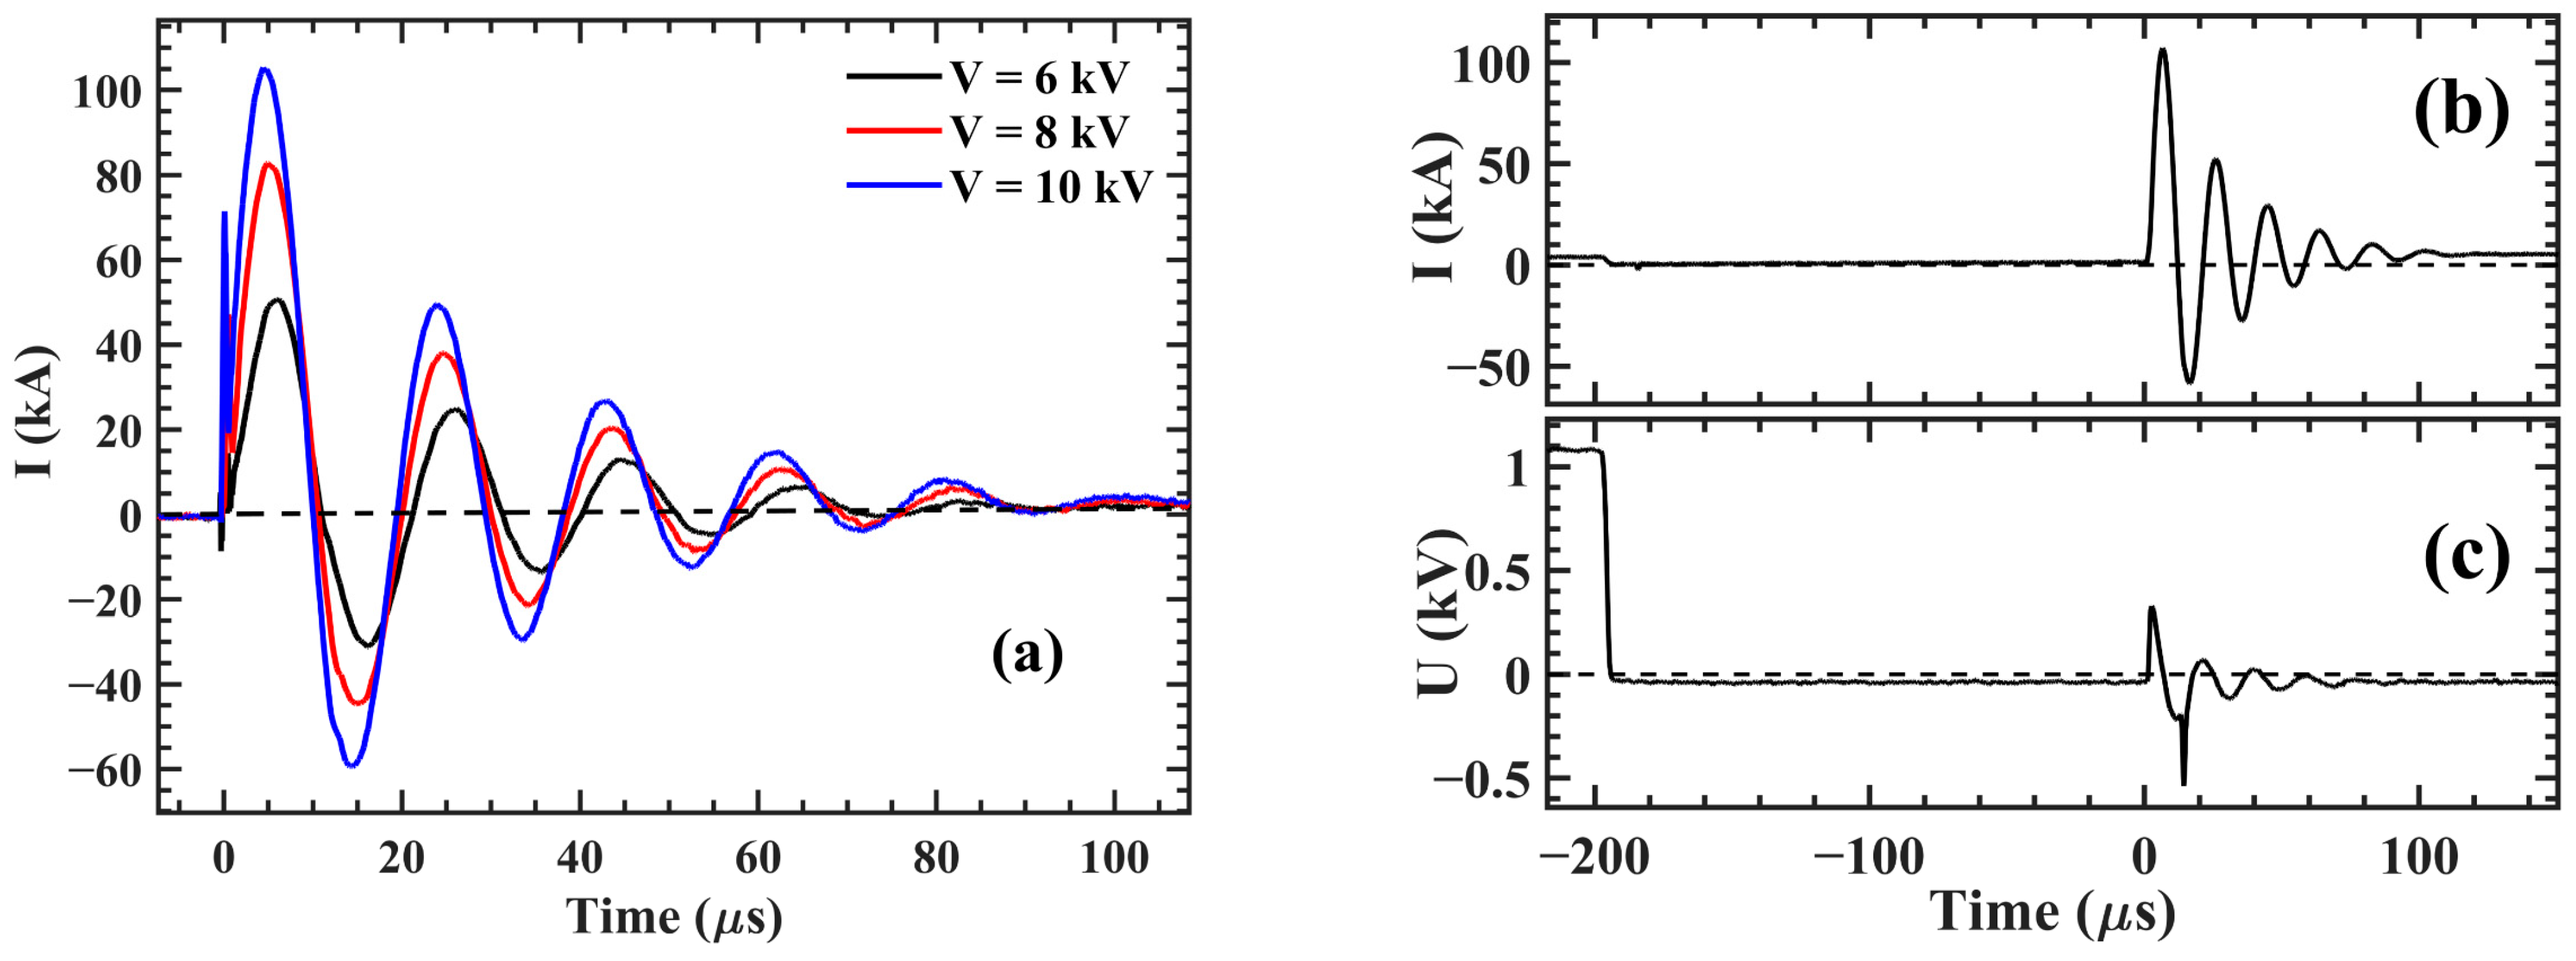
This pulse power supply was successfully implemented in a coaxial plasma gun for plasma discharge experiments, and multiple tests were conducted. Representative experimental results are shown in Figure 3. The peak current increases with increasing operating voltage. At an operating voltage of 10 kV, a plasma current of 112 kA was achieved, which accelerated the plasma. The current waveform exhibits characteristics of an overdamped oscillation, featuring multiple oscillation cycles with diminishing peak amplitudes over time.
Figure 3.
(a) Waveforms of discharge currents on the plasma load under 6 kV, 8 kV, and 10 kV, (b) waveform of discharge current on the plasma load under 10 kV, and (c) voltage across a single thyristor under 10 kV.
3. Thermal Simulation of a Single Thyristor Module
3.1. Heat Transfer Processes in Thyristors
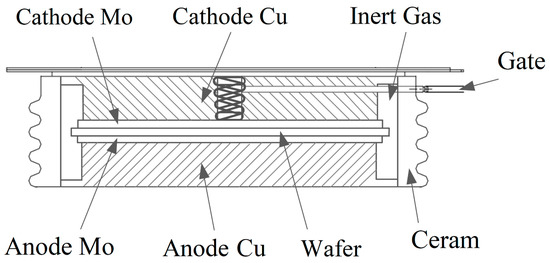
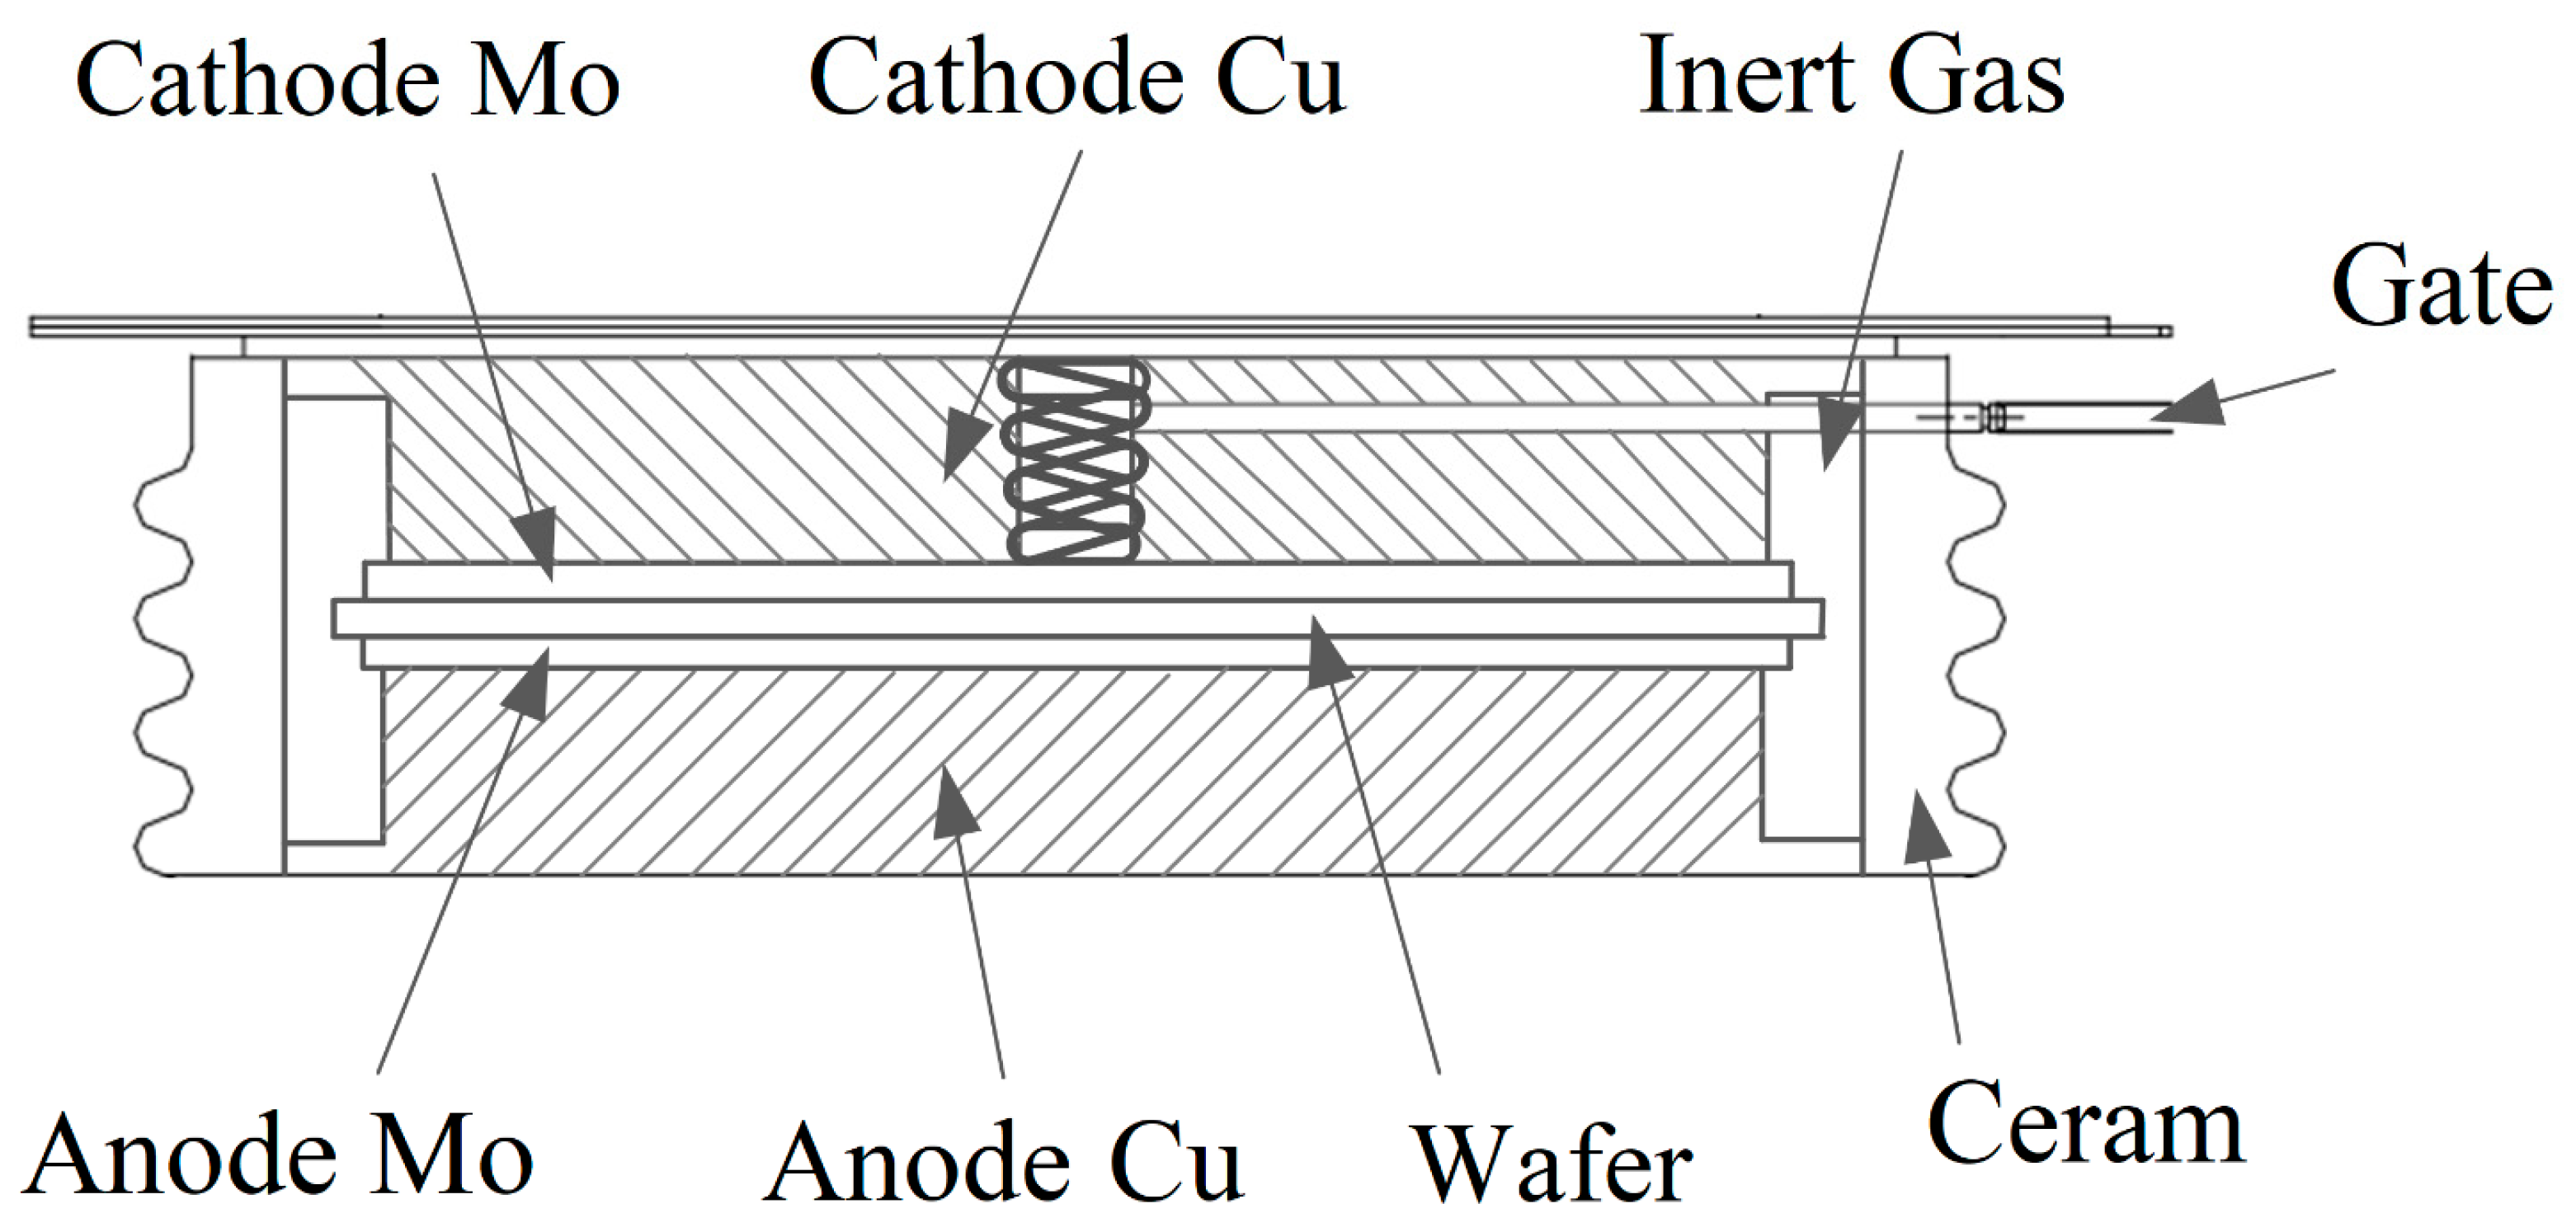
High-power semiconductor devices typically adopt a flat-type structure featuring double-sided cooling and ceramic packaging. As illustrated in the cross-sectional schematic of a conventional high-power thyristor structure in Figure 4, the device consists of five distinct layers: at its core lies a semiconductor silicon (Si) wafer, flanked by two molybdenum (Mo) plates, and enclosed by copper (Cu) bases on the outermost sides. The PN junction, represented by the Si wafer, is hermetically sealed at the geometric center of the device. The adjacent Mo plates perform both protective and thermal conduction functions. To enhance heat dissipation, large-area Cu bases are bonded to the outer surfaces of the Mo plates, incorporating extended Cu fins to increase the effective cooling area. The material parameters corresponding to each component are provided in Table 1.
Figure 4.
Cross-sectional schematic diagram of thyristor structure.
Table 1.
Dimensional parameters of the thyristor structure.
The transfer of thermal energy refers to the process by which heat flows from regions of higher temperature to those of lower temperature. There are three primary mechanisms of heat transfer: thermal conduction, thermal convection, and thermal radiation [19,20]. To facilitate practical engineering calculations, the following rational assumptions are adopted.
In the thyristor heat transfer model, thermal radiation is neglected due to the relatively low temperature gradient and the weak radiation absorption properties of the constituent materials. It is assumed that the thermal effects of the pulse current on the thyristor arise primarily from power dissipation in the Si wafer and resistive heating in the Mo plates and Cu bases. The heating duration of the pulse currents is on the order of several hundred microseconds, during which the internal thermal conduction process within the thyristor is considered. The space between the Si wafer and the housing is filled with high-purity inert gas. Given that the heat exchange between the thyristor discs and inert gas is negligible compared with the thermal conduction process between the thyristor discs, the thermal convection effects in the thyristor-housing gap are consequently excluded from consideration [21,22]. The initial temperature of the thyristor is set to 20 °C. The fundamental law governing thermal conduction is Fourier’s law, with the heat transfer equation expressed as [16]:
where ρ denotes the material density (kg/m3), c is the constant-pressure heat capacity of the medium (J/(kg·K)), T represents the temperature field (K), t is time (s), and k is the thermal conductivity of the medium (W/(m·K)). The term q denotes the heat source arising from Joule heating losses due to pulse currents passing through the Si wafer, while W represents the heat generated by the gate of the Si wafer and the material’s resistivity, corresponding to the Joule heating losses in the conductor. The specific heat capacity and density of the Si wafer are 710 J/(kg·K) and 2329 kg/m3, respectively. For the Mo sheet, these values are 250 J/(kg·K) and 10,200 kg/m3. The Cu base has a specific heat capacity of 385 J/(kg·K) and a density of 8960 kg/m3. For stainless steel, the specific heat capacity and density are 500 J/(kg·K) and 7950 kg/m3, respectively. The aluminum alloy has a specific heat capacity of 900 J/(kg·K) and a density of 2700 kg/m3. These material properties are summarized in Table 2.
Table 2.
Parameters of different materials.
The cylindrical surfaces of the entire model are defined as adiabatic boundaries, which can be described by the second-type (Neumann) boundary conditions in thermodynamics [16], expressed as:
where n is the normal direction of the contact surface. Under adiabatic boundary conditions, where no heat transfer occurs, the temperature rise will be significant. Conversely, the presence of heat transfer reduces the temperature rise. Introducing active cooling methods, such as forced air cooling, further enhances heat dissipation at the boundary, thereby lowering the temperature rise.
Therefore, the thermal modeling of thyristors primarily considers the following two heat transfer mechanisms:
- (1)
- Thermal conduction between the Si wafer and Mo plates, and subsequently between the Mo plates and Cu bases.
- (2)
- Thermal convection at the Cu base-ambient air interface, expressed as,where is the ambient temperature. Under environmental conditions with the ambient temperature maintained at 20 °C and natural air convection cooling, the convective heat transfer coefficient (h) typically ranges between 5 and 15 W/(m2·K). In this study, a conservative value of h = 5 W/(m2·K) is adopted.
These assumptions result in uniform heat generation and transfer; thus, the model cannot estimate temperature rises caused by non-uniformities in localized regions. Furthermore, this thermal model neglects thermal radiation, reverse-recovery heating, contact thermal resistance, and the temperature dependence of material properties. Currently, as the temperature is not very high, the effect of thermal radiation is relatively minor. Neglecting reverse-recovery heating and contact thermal resistance may lead to an underestimation of the temperature rise. Within a range where temperature variation is small, the influence of temperature-dependent material properties can be ignored. However, due to the lack of accurate thermal dependency models for the materials involved, this currently affects the precision of temperature rise estimation. When temperature changes are particularly significant—such as in the case of 50 Hz, 200 kA—material properties undergo substantial changes, which then have a pronounced impact. Factors such as chip manufacturing processes, asymmetric distribution of structural components, and imperfect press-pack connections will all contribute to these effects.
3.2. Modeling of a Non-Uniform Thyristor
Heat generation in a thyristor originates from localized sources and diffuses non-uniformly, creating significant gradients in both heat generation and transfer along the radial direction. This inherent inhomogeneity necessitates the development of specialized thermal models for non-uniform thyristors. In the design of thyristor thermal models, the device’s dissipated power can be calculated using the current-voltage product model:
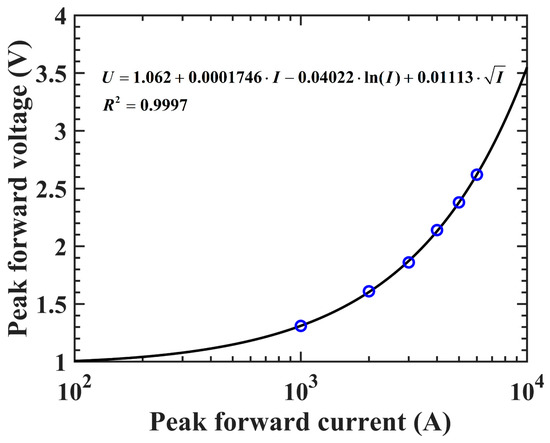
where U(t) and I(t) represent the on-state voltage and current of the thyristor, respectively. The on-state current of the thyristor is measured by the Rogowski coil. The on-state voltage of the thyristor is computed via an empirical formula provided by ABB [22]:
where A, B, C, and D represent device-specific constant coefficients that are independent of current, and can be determined through curve fitting of the manufacturer-supplied on-state voltage-ampere characteristics. Figure 5 presents the on-state voltage-ampere characteristics of the thyristor used in this study. Through nonlinear regression analysis of the experimental data, the coefficients in Equation (6) were determined as follows: , , , and . The data for the current range was obtained from the manufacturer’s test reports. The model does not currently cover surge or overload current conditions. The model extends to high-current operation.
Figure 5.
The on-state voltage-ampere (V-I) characteristics of a pulse thyristor.
This study selects the thyristor model MKPx 200-50, manufactured by CRRC Co., Ltd. from China as the subject of analysis, and conducts thermal simulations on a single device. A junction temperature analysis model is established based on heat transfer theory, incorporating the structural configuration of the thyristor, its thermal dissipation characteristics, and the thermophysical properties of its constituent layered materials.
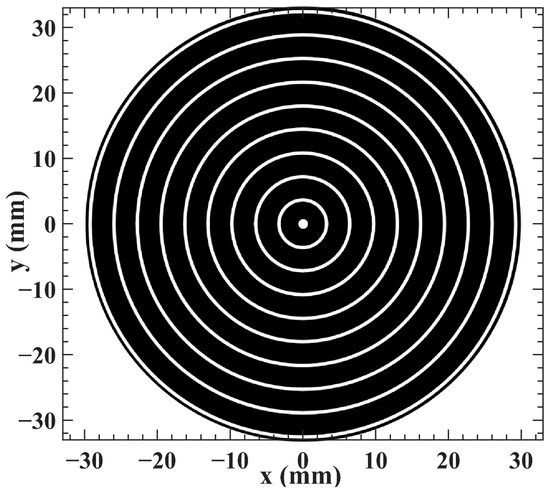
The current spreading process within the Si wafer results in a non-uniform heat distribution across the chip. Spatial and temporal variations in thermal power dissipation occur at different locations on the wafer, while temporal fluctuations in thermal power density are observed at fixed positions. Therefore, the heat source analysis must account for the thyristor’s turn-on dynamics and current spreading behavior. The conduction region propagates bidirectionally from the gate terminal. For simplification in simulation, the conduction area expansion is modeled as a constant-velocity process with a propagation speed denoted as v [23]. To ensure complete turn-on of the thyristor, multiple gate electrode patterns are etched onto the Si wafer. For computational simplicity, only the concentric ring gate pattern is considered in the model [24,25], as illustrated in Figure 6.
Figure 6.
Schematic diagram of thyristor gate electrode patterns is designed. x and y represent the horizontal and vertical coordinates of the axial cross-section of the Si wafer, respectively. The white area is the gate of the thyristor.
For computational simplification, the physical width of the thyristor gate electrodes is neglected. The conduction region is assumed to originate from the central axis of each gate electrode and to expand bidirectionally. The outermost gate electrode propagates only inward. When adjacent conduction regions intersect—specifically, when the inward-expanding region from an outer gate electrode overlaps with the outward-expanding region from an inner gate electrode at their midpoint—the conduction region is assumed to cease further expansion.
Assume that the first gate terminal is located at and that the last gate terminal is positioned at the Si wafer edge. With ten gate terminals present on this Si wafer uniformly distributed radially, i.e., , the radial spacing between adjacent gate terminals is , where is the radius of the Si wafer. The radial position of the i-th gate is . The volume of the conduction region of the triggering pulse is given by:
where is the conduction area of the i-th gate, is the thickness of the Si wafer, is the repetition rate, and is the duration of a single thyristor conduction event. Assuming a uniform current distribution within the conduction region, the power density of the activated area is expressed as:
For any point on the Si wafer, the dissipated power at that location remains zero until the conduction region propagates to it. Once the conduction region reaches this point, the local power density becomes . This temporal dependency is mathematically represented using the step function , which is defined as:
At any given time, each radial coordinate r can be exclusively activated and spread by only one gate. Therefore, the symbol “” represents the minimum value for all gates. The power density at any point of radius r on the Si wafer can be expressed as
When the thyristor group is conducting, current flows through each metal plate, so each plate itself generates heat. The power density in any connected metal plate is:
where denotes the electrical resistivity of the metallic material and where represents the radius of the metallic disc.
According to references [17,26], the conduction region expansion velocity in thyristors ranges from several meters per second to several tens of meters per second. In this study, a propagation speed of 30 m/s was selected. The initial temperature was set at 20 °C to simulate the Si wafer surface temperature under realistic current-carrying conditions. Given a total peak current of 150 kA, the peak current through a single-series thyristor group is 75 kA.
3.3. Analysis of the Thermal Simulation
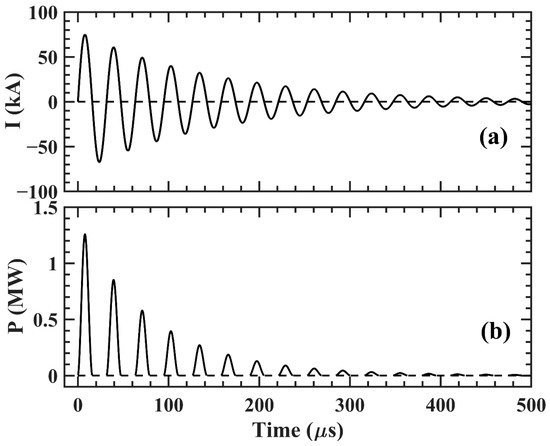
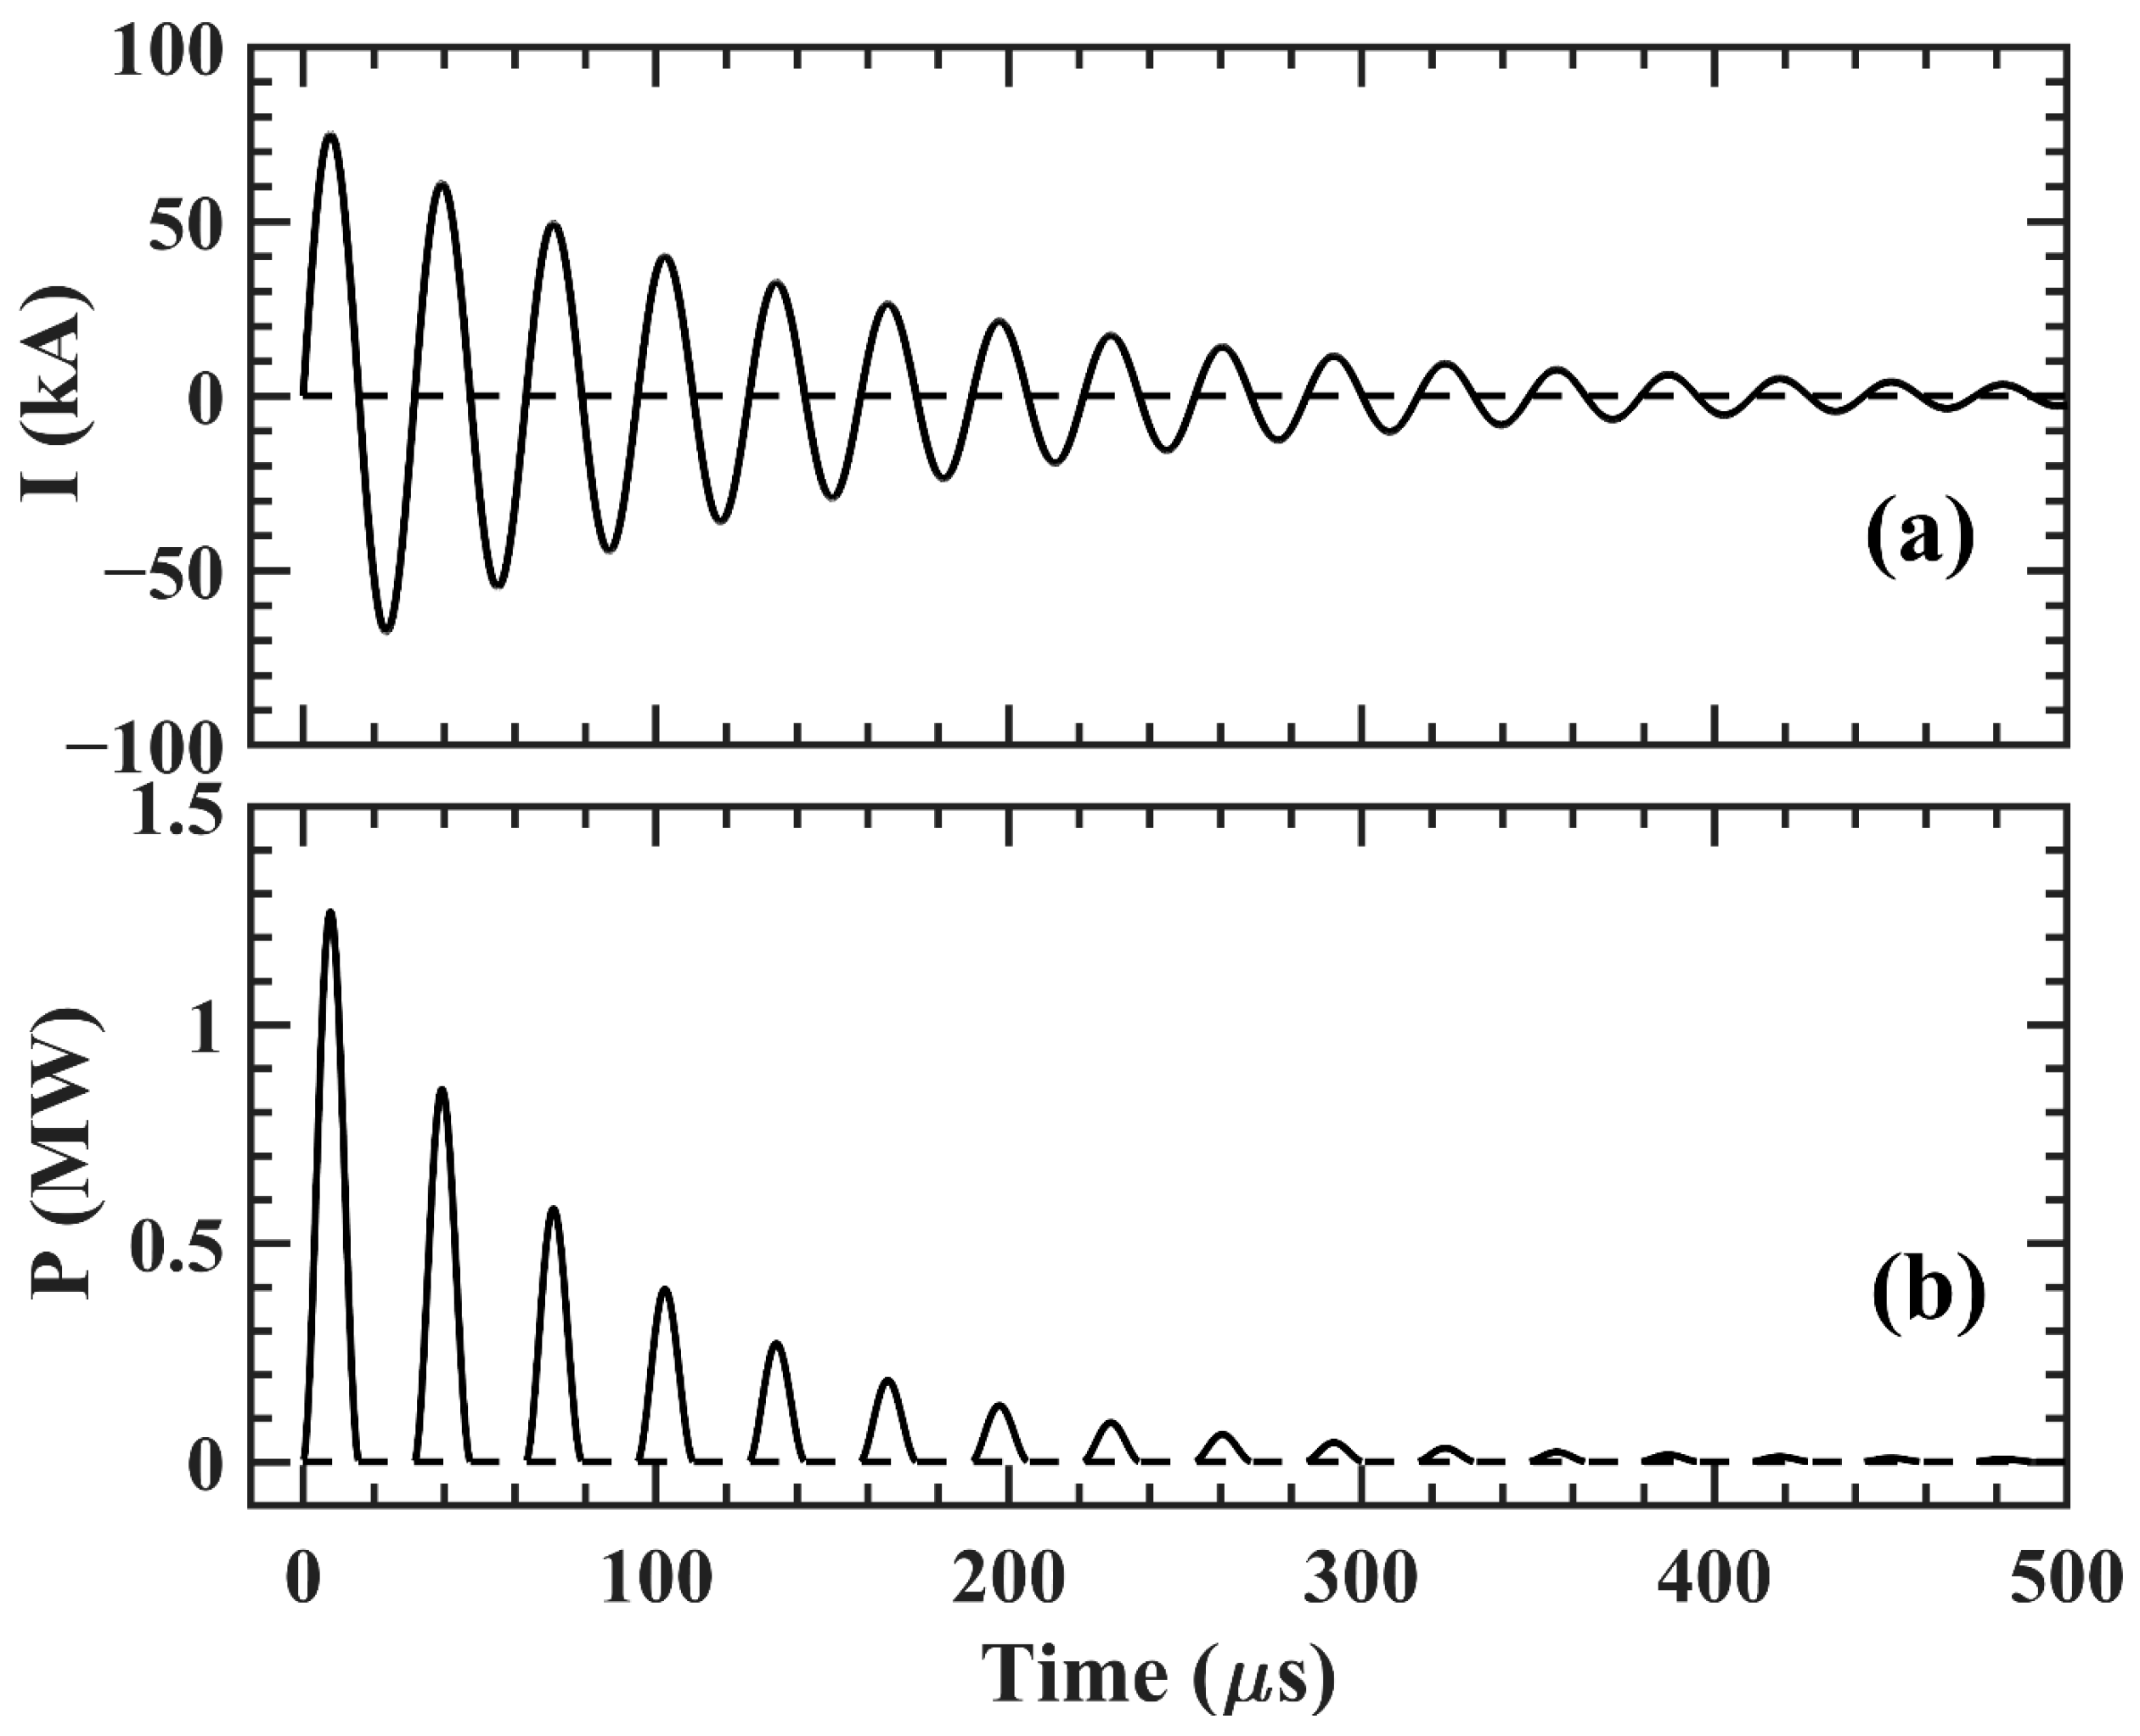
The simulation was conducted under pulsed discharge conditions with a peak current of 75 kA, a repetition rate of 10 Hz, and a total duration of 1 s. A two-dimensional axisymmetric thyristor model was employed to analyze the transient temperature field distributions. The various parameters used in the simulation are shown in Table 3. The simulation calculated the thyristor’s temperature profile following 1 s of operation. Figure 7 shows the input current used in the thermal simulation model. An idealized underdamped oscillatory LCR waveform is adopted, with consideration given to both the peak current and pulse width to facilitate subsequent parameter scanning. The power density waveform was derived from the input current profile (Figure 7) using Equations (3) and (4). To accurately reflect the forward conduction behavior of thyristors, the thermal effects of reverse currents were reasonably excluded from the dissipated power calculations. The single-pulse discharge current and the corresponding power input data are illustrated in Figure 7.
Table 3.
Summary of Simulation Parameters.
Figure 7.
(a) Waveform of total input current, and (b) waveform of total power dissipation in thyristor.
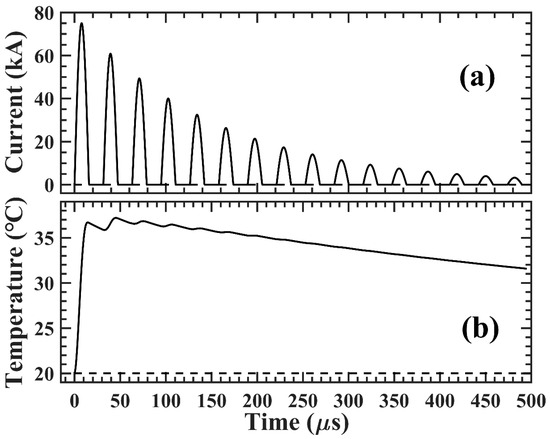
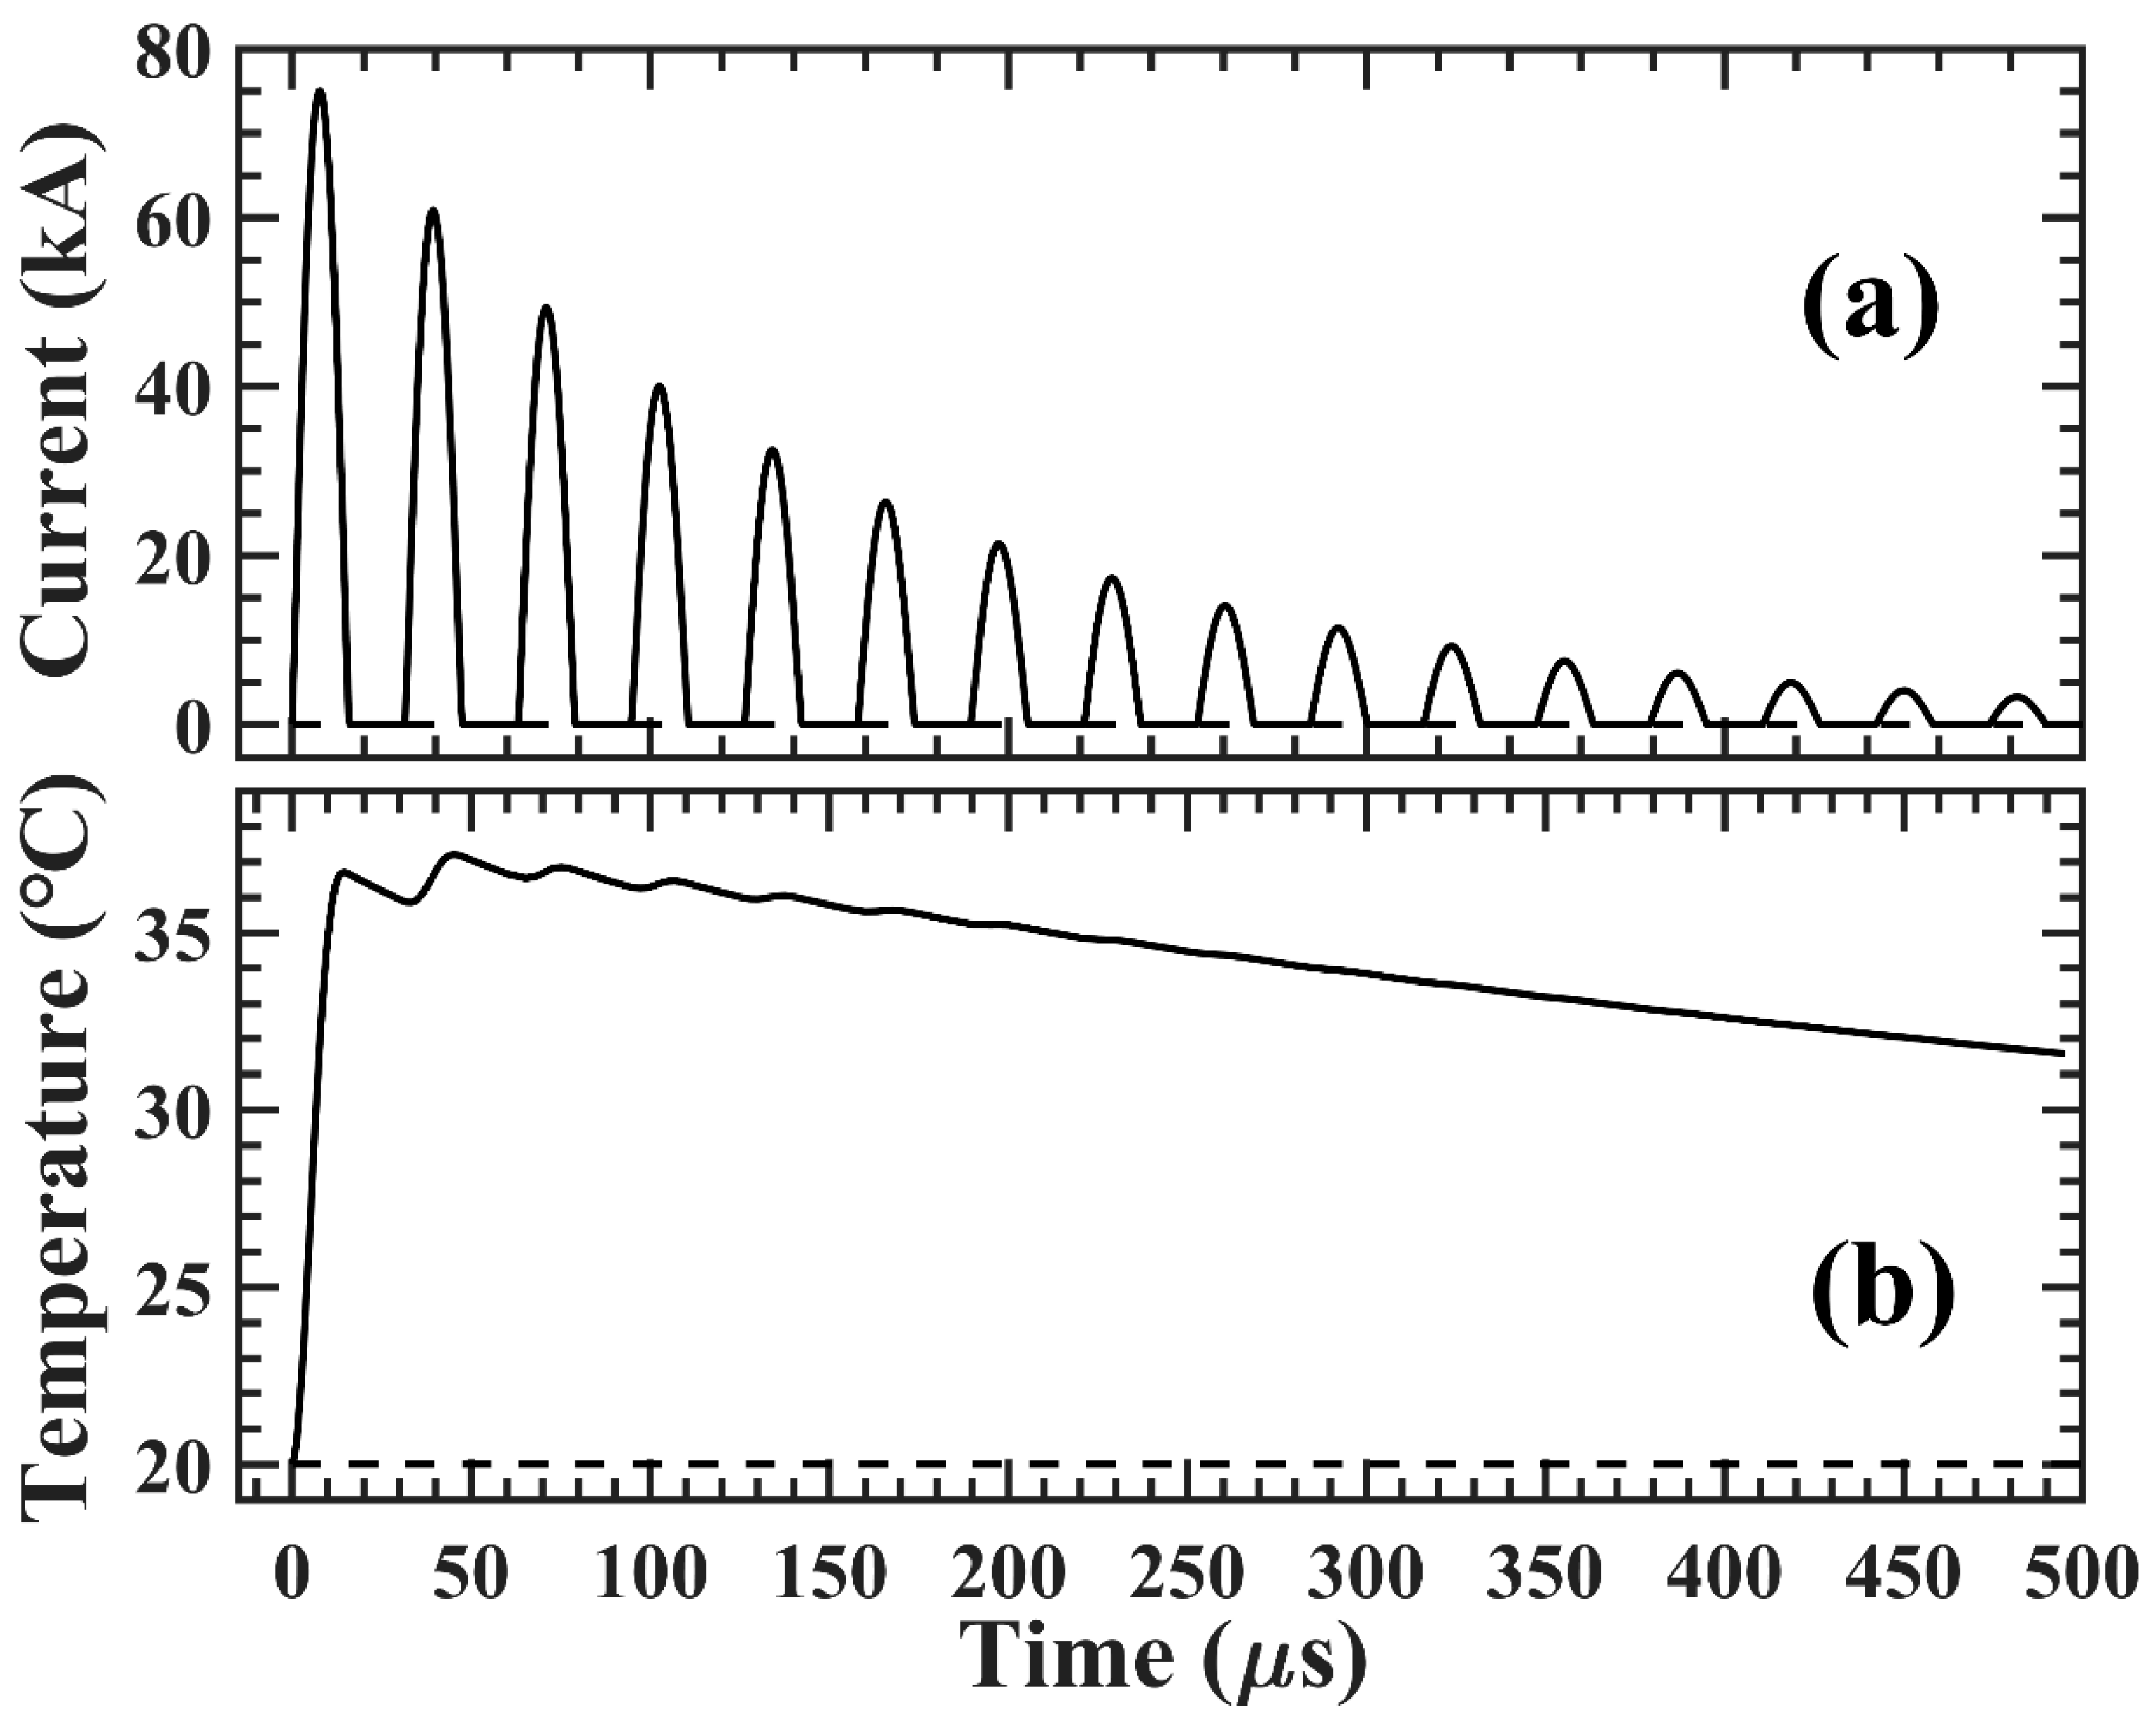
The single-pulse discharge simulation results, presented in Figure 8, directly illustrate the thyristor’s thermal response. As shown, the maximum temperature at the gate terminal reaches about 37.2 °C, peaking at 45.1 μs. This behavior occurs because, during the initial conduction half-wave periods, the heat generated by current flow through the thyristor exceeds the device’s heat dissipation capacity, leading to progressive temperature accumulation. During the current-off intervals, heat dissipation dominates, resulting in a temperature decrease. After several conduction cycles, once the current amplitude drops below a critical threshold, the rates of heating and dissipation balance, yielding a peak temperature. In the subsequent half-wave cycles, the heating effect decreases, allowing heat dissipation to dominate and gradually reduce the valve disc temperature.
Figure 8.
(a) Current flowing through a single thyristor group, and (b) temperature at the thyristor gate terminal.
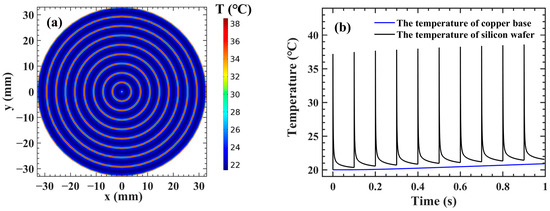
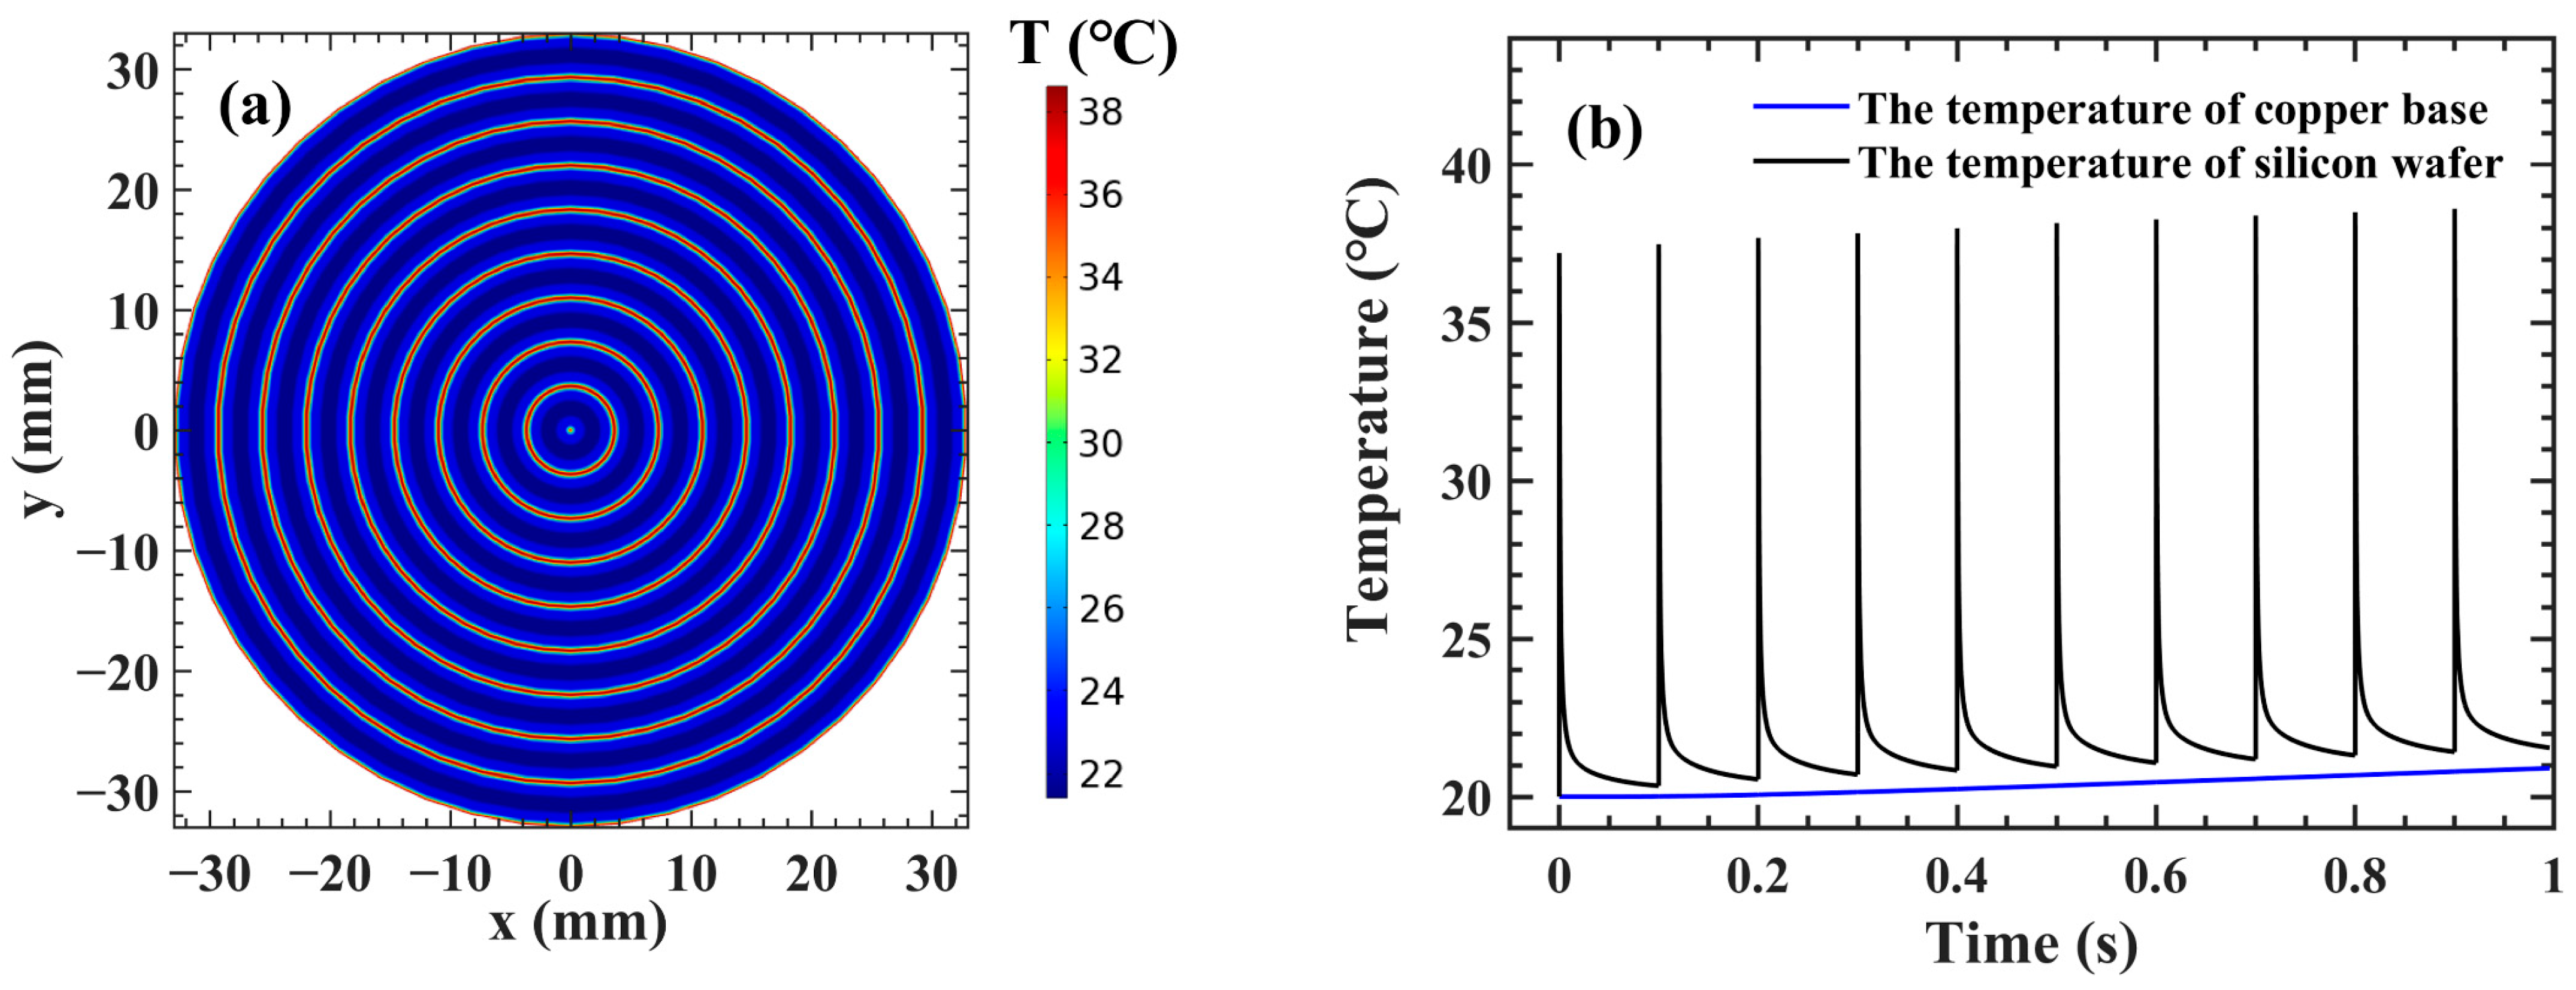
Figure 9 and Figure 10 present the simulation results for pulsed discharge conditions with a repetition rate of 10 Hz and a duration of 1 s. Figure 9a depicts the temperature distribution within the valve disc at the conclusion of the current flow. The results indicate that thermal energy is primarily concentrated in the Si wafer, with limited heat diffusion into the surrounding Mo plates. This behavior is mainly attributed to the low thermal conductivities of both Si and Mo, which substantially hinder effective heat propagation.
Figure 9.
(a) Temperature distribution in the Si die at peak temperature, and (b) the temperature of the Si wafer and Cu base.
Figure 10.
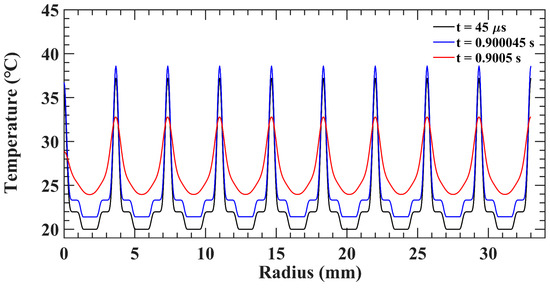
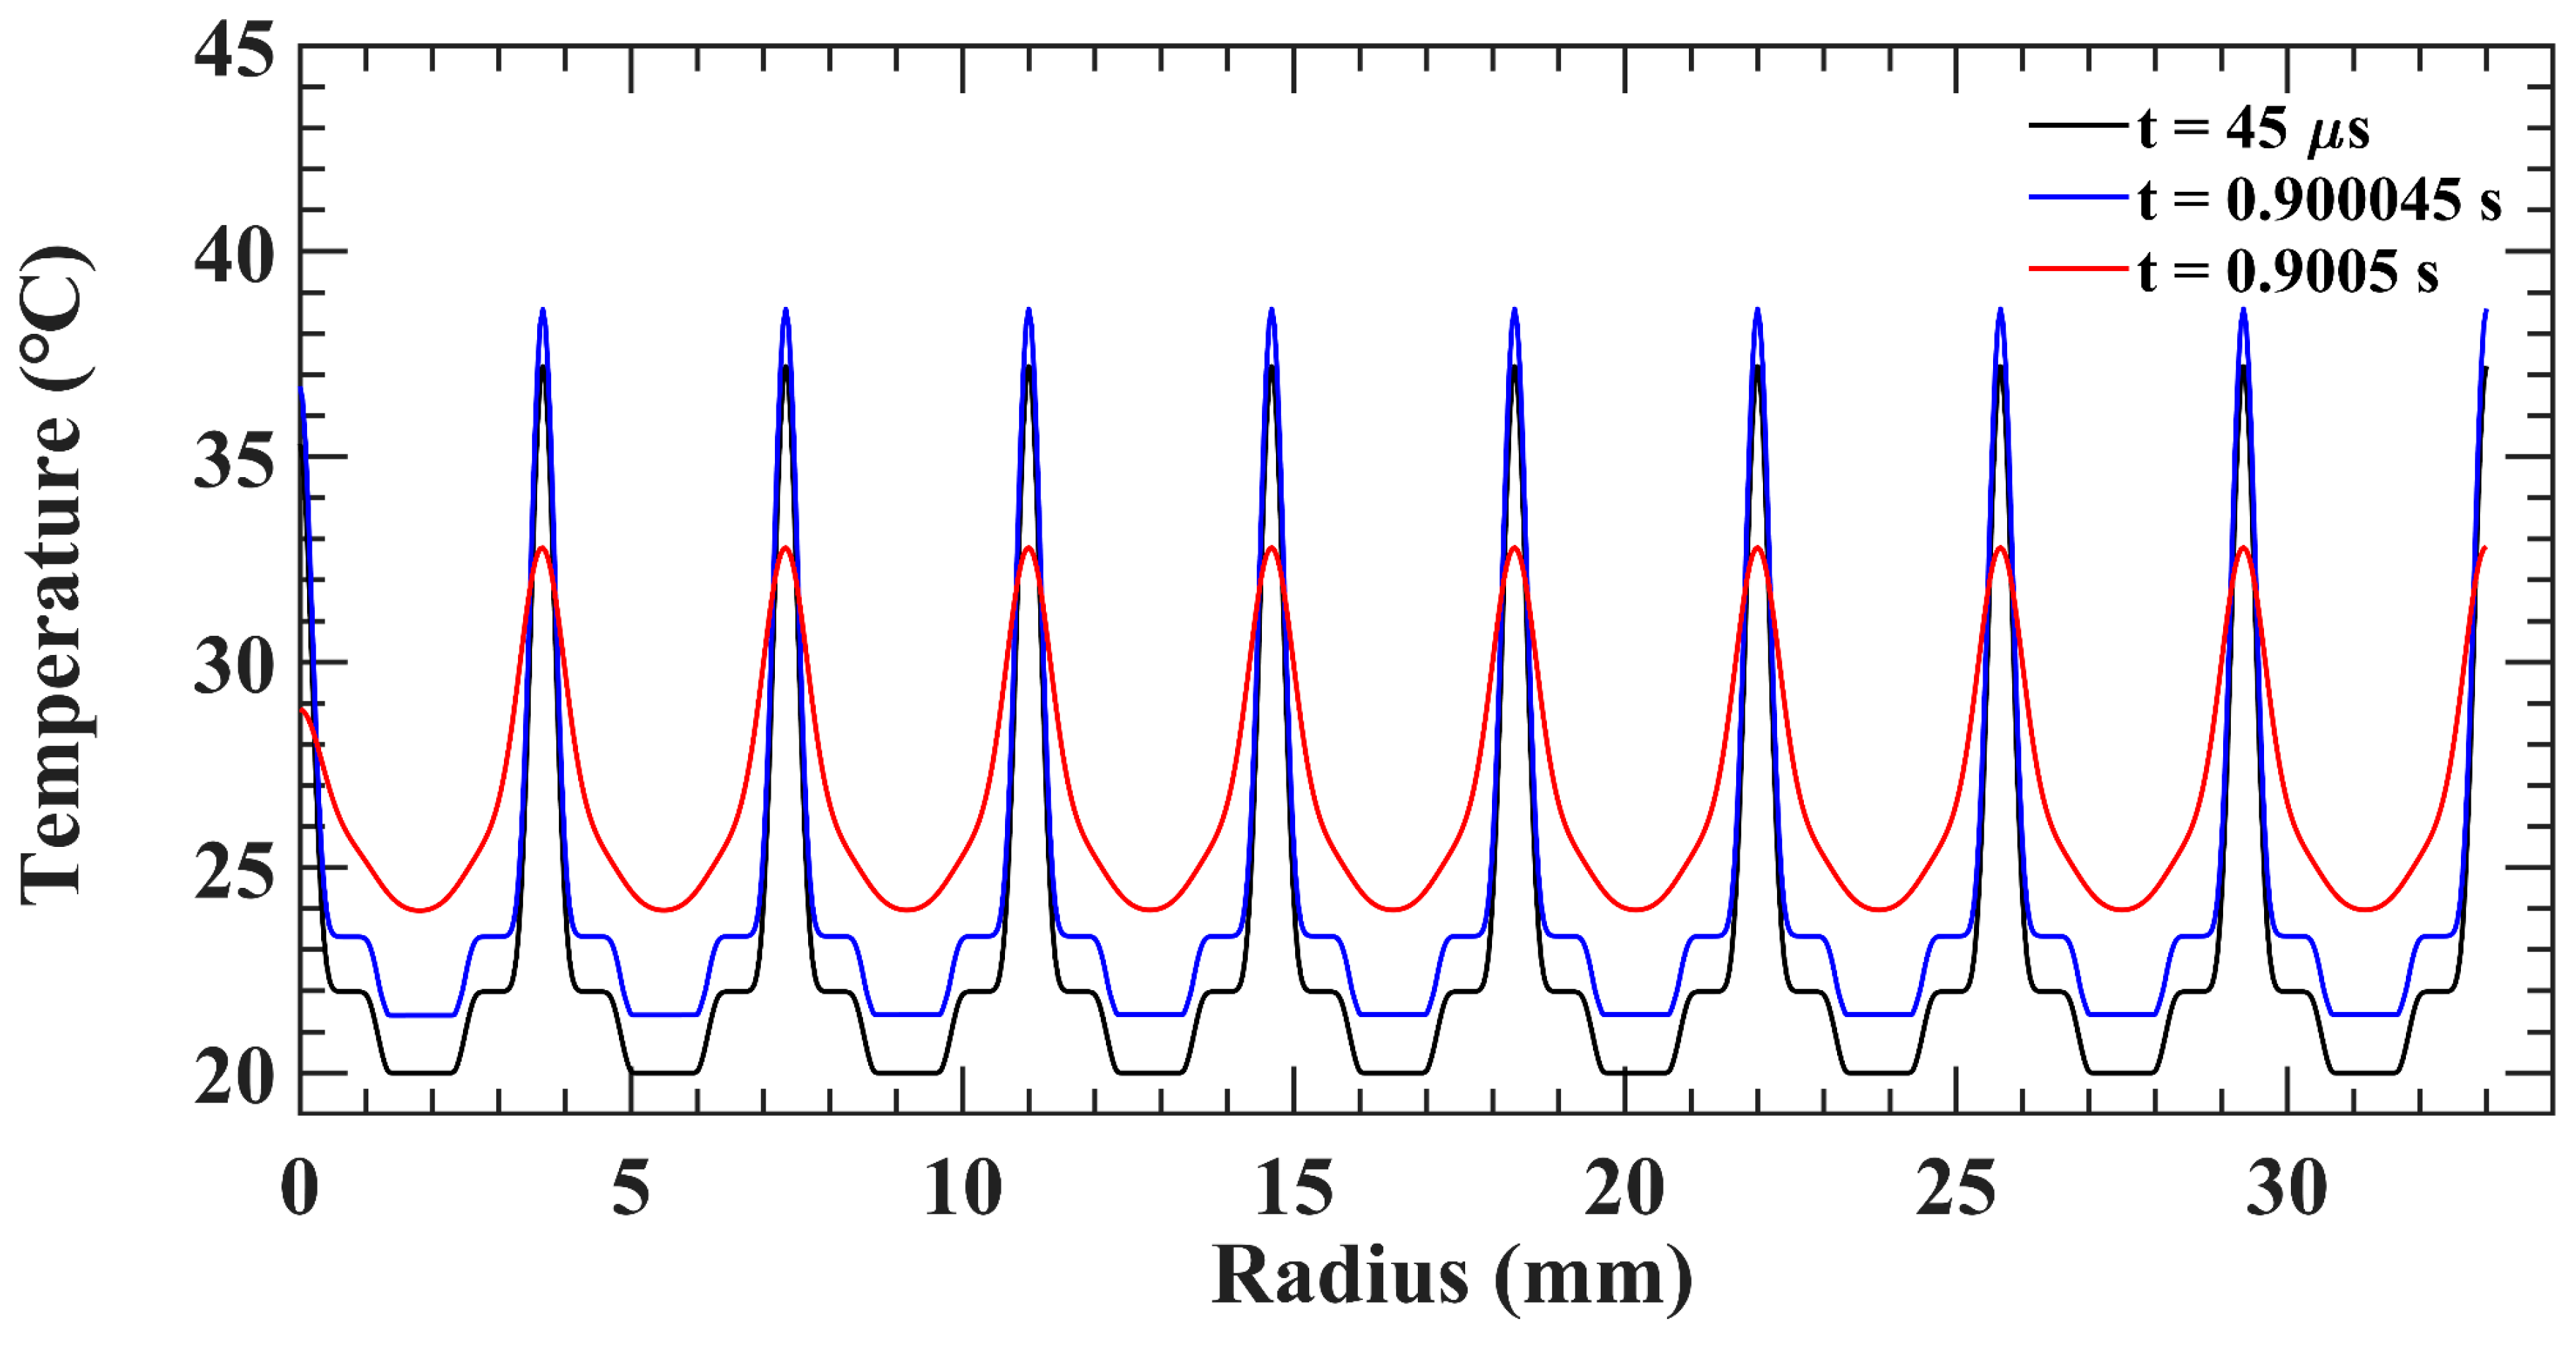
Time-dependent temperature evolution of the thyristor valve disc.
Figure 9b displays the temperature evolution of the Si wafer and the Cu base. A comparative analysis revealed pronounced temperature fluctuations in the Si wafer, characterized by abrupt junction temperature spikes followed by rapid cooling. In contrast, the Cu base exhibited a stable thermal response with a gradual increase in temperature. The following phenomena can be observed: the highest temperature occurs at the gate terminal, with the thermal gradients propagating radially outward. Under continuous operation with a 75 kA current input for 1 s, the instantaneous temperature of the thyristor is about 38 °C, which is well within the safe operating limit (<125 °C).
Figure 10 illustrates the radial temperature distribution profiles along a cross-sectional line of the Si wafer, extending from the central gate ring to the edge of the outermost gate ring. Three critical time points are analyzed: the curve at 45 μs represents the temperature distribution during the first pulse at the moment of peak gate terminal temperature; the curve at 0.900045 s reflects the thermal state immediately after the termination of the first current pulse; and the curve at 0.9005 s corresponds to the temperature distribution at the gate terminal following the completion of the tenth pulse. At 45 μs, the gate diffusion front reaches 1.35 mm. Accordingly, at both 45 μs and 0.900045 s, the second kink observed near the gate corresponds to the location of this diffusion front. The first kink near the gate arises due to the absence of reverse current in the thyristor. Thus, following the first half-wave current, no additional heating occurs during the reverse current phase; only thermal conduction is present, resulting in the formation of this kink.
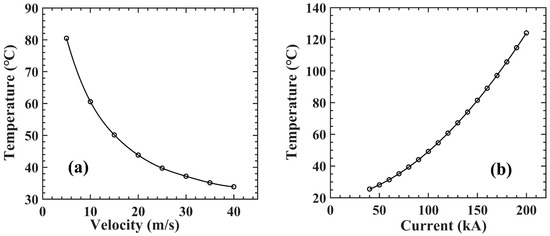
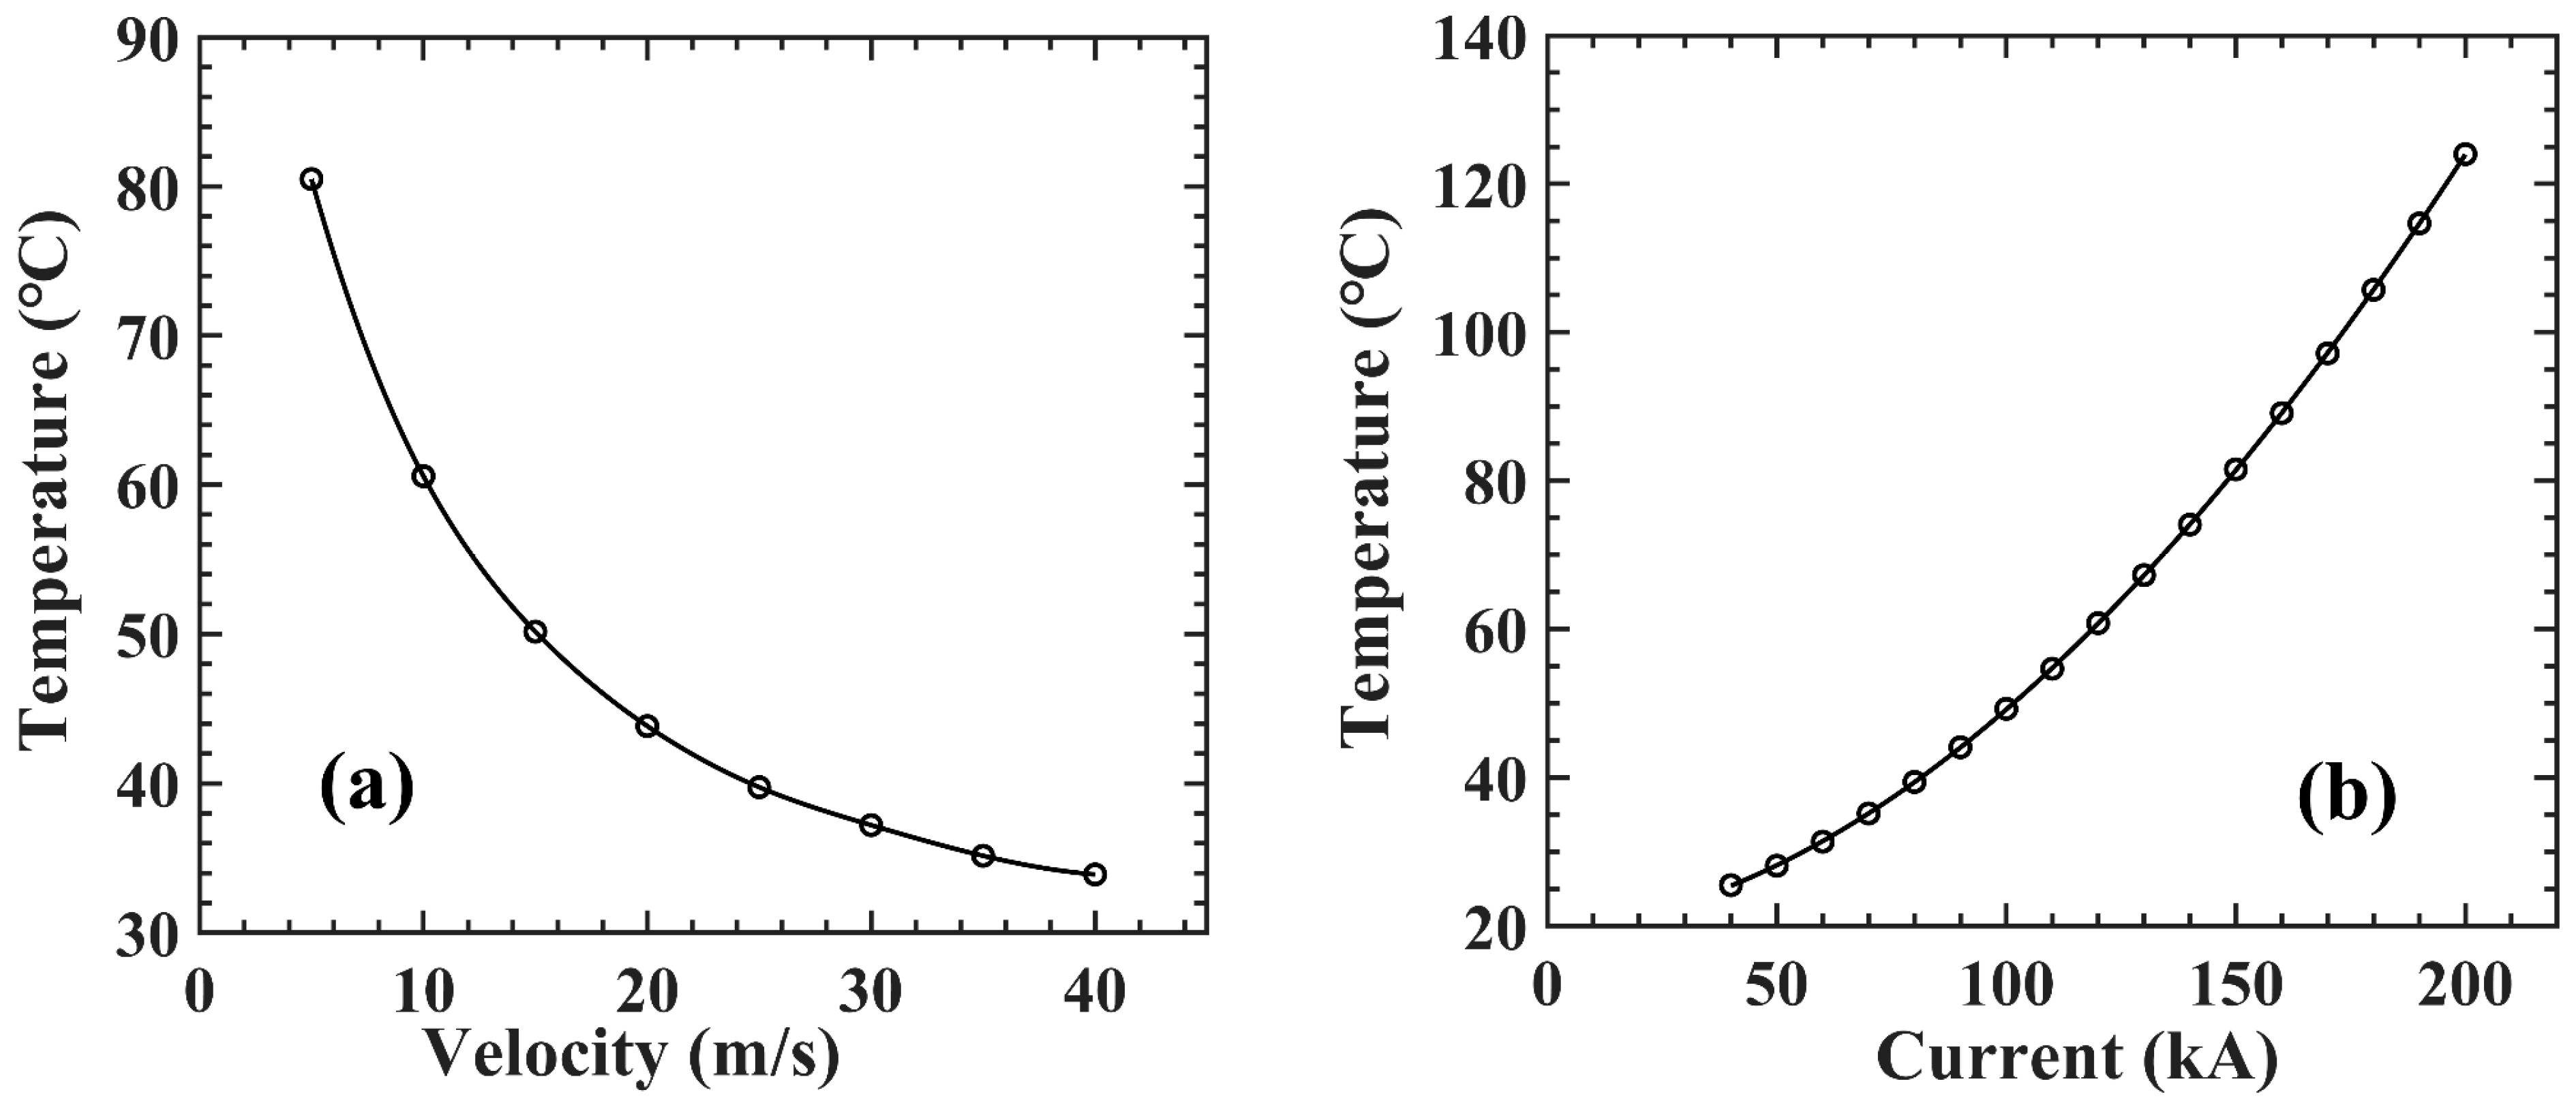
A gate spreading velocity of 30 m/s is adopted in this analysis. Research indicates that varying the gate spreading velocity significantly influences the transient temperature field distribution during thyristor turn-on. To investigate this relationship, thermal simulations were conducted for gate spreading velocities ranging from 5 to 50 m/s, with the single-pulse peak current maintained at 75 kA. The results, presented in Figure 11a, demonstrate that as the spreading velocity increases, the temperature amplitude in the gate region decreases. In other words, higher spreading velocities correspond to a more uniform temperature field.
Figure 11.
(a) Temperature variation under different gate spreading velocities, and (b) dependence of gate terminal temperature on the peak currents.
To examine the effect of peak current on the transient temperature field distribution during thyristor gate turn-on under a constant pulse width, thermal simulations were further conducted for varying peak current values, while maintaining a fixed single-pulse width. The maximum temperature in the gate region on the thyristor Si wafer is shown in Figure 11b. The maximum rate of increase in the gate temperature increases significantly with increasing peak current. At lower peak current levels, the temperature rise in the gate region is relatively gradual, and the magnitude of the temperature change is smaller. However, once the peak current exceeds a certain threshold, the curve becomes steeper, indicating a markedly accelerated rate of increase in the gate temperature. This rapid temperature increase highlights the practical necessity for strict control over the peak current to prevent adverse effects caused by excessive gate temperatures.
3.4. Thermal Simulation of the Series Thyristor Module Prototype
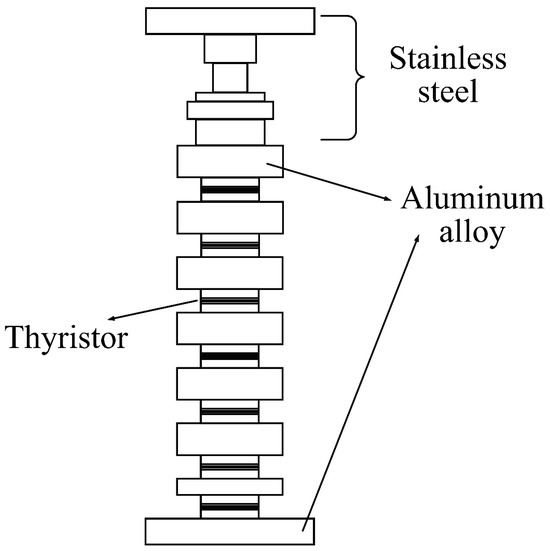
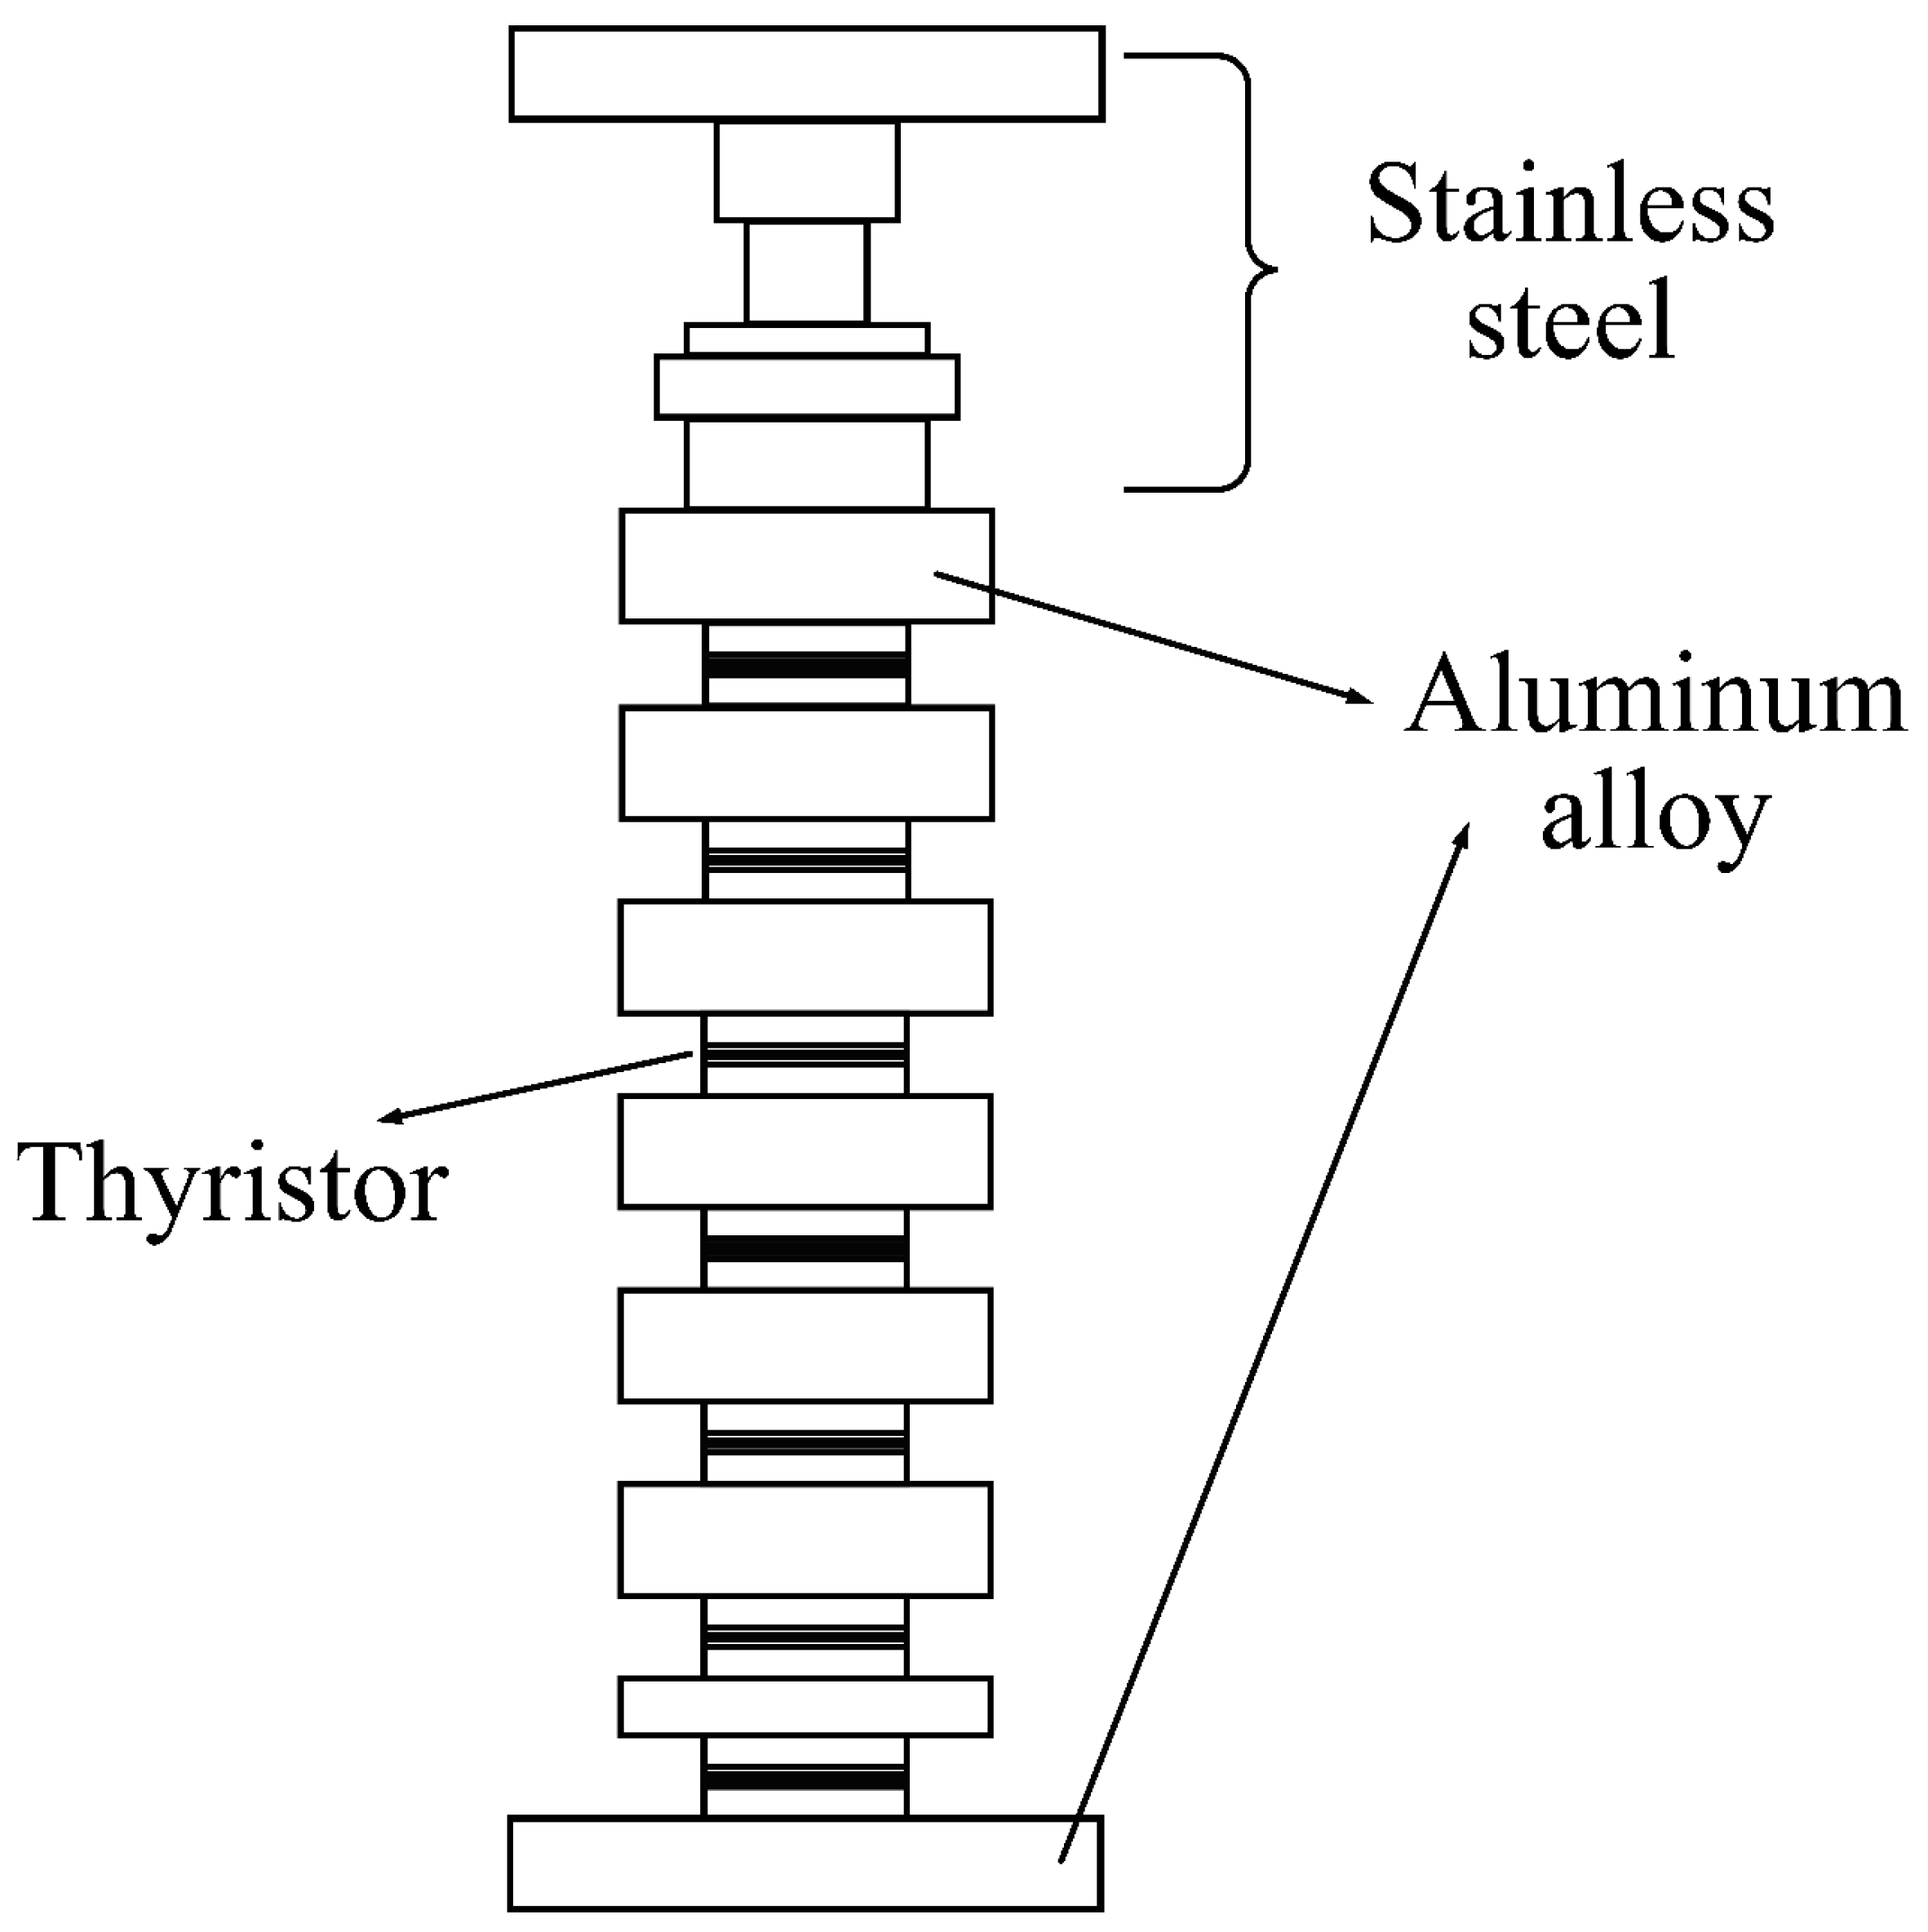
Thermal simulation was conducted for the series thyristor module prototype. As shown in Figure 12, the valve assembly structure comprises upper steel blocks and central aluminum alloy heat sink blocks, mechanically pressed together. The simulation approach mirrors that used for individual thyristors, primarily accounting for heat conduction and convective heat transfer processes. Heat sources were modeled as power losses within the Si wafer and resistive heating in the metallic interconnect layers. The objective of the simulation is to identify the maximum temperature within the prototype assembly, evaluate the natural cooling rate, and observe the overall temperature distribution across the series thyristor module prototype.
Figure 12.
Schematic diagram of the series thyristor module prototype structure.
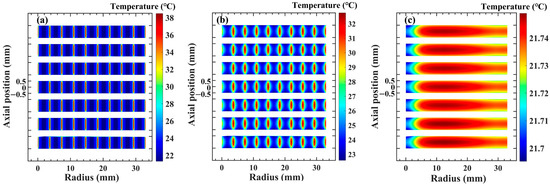
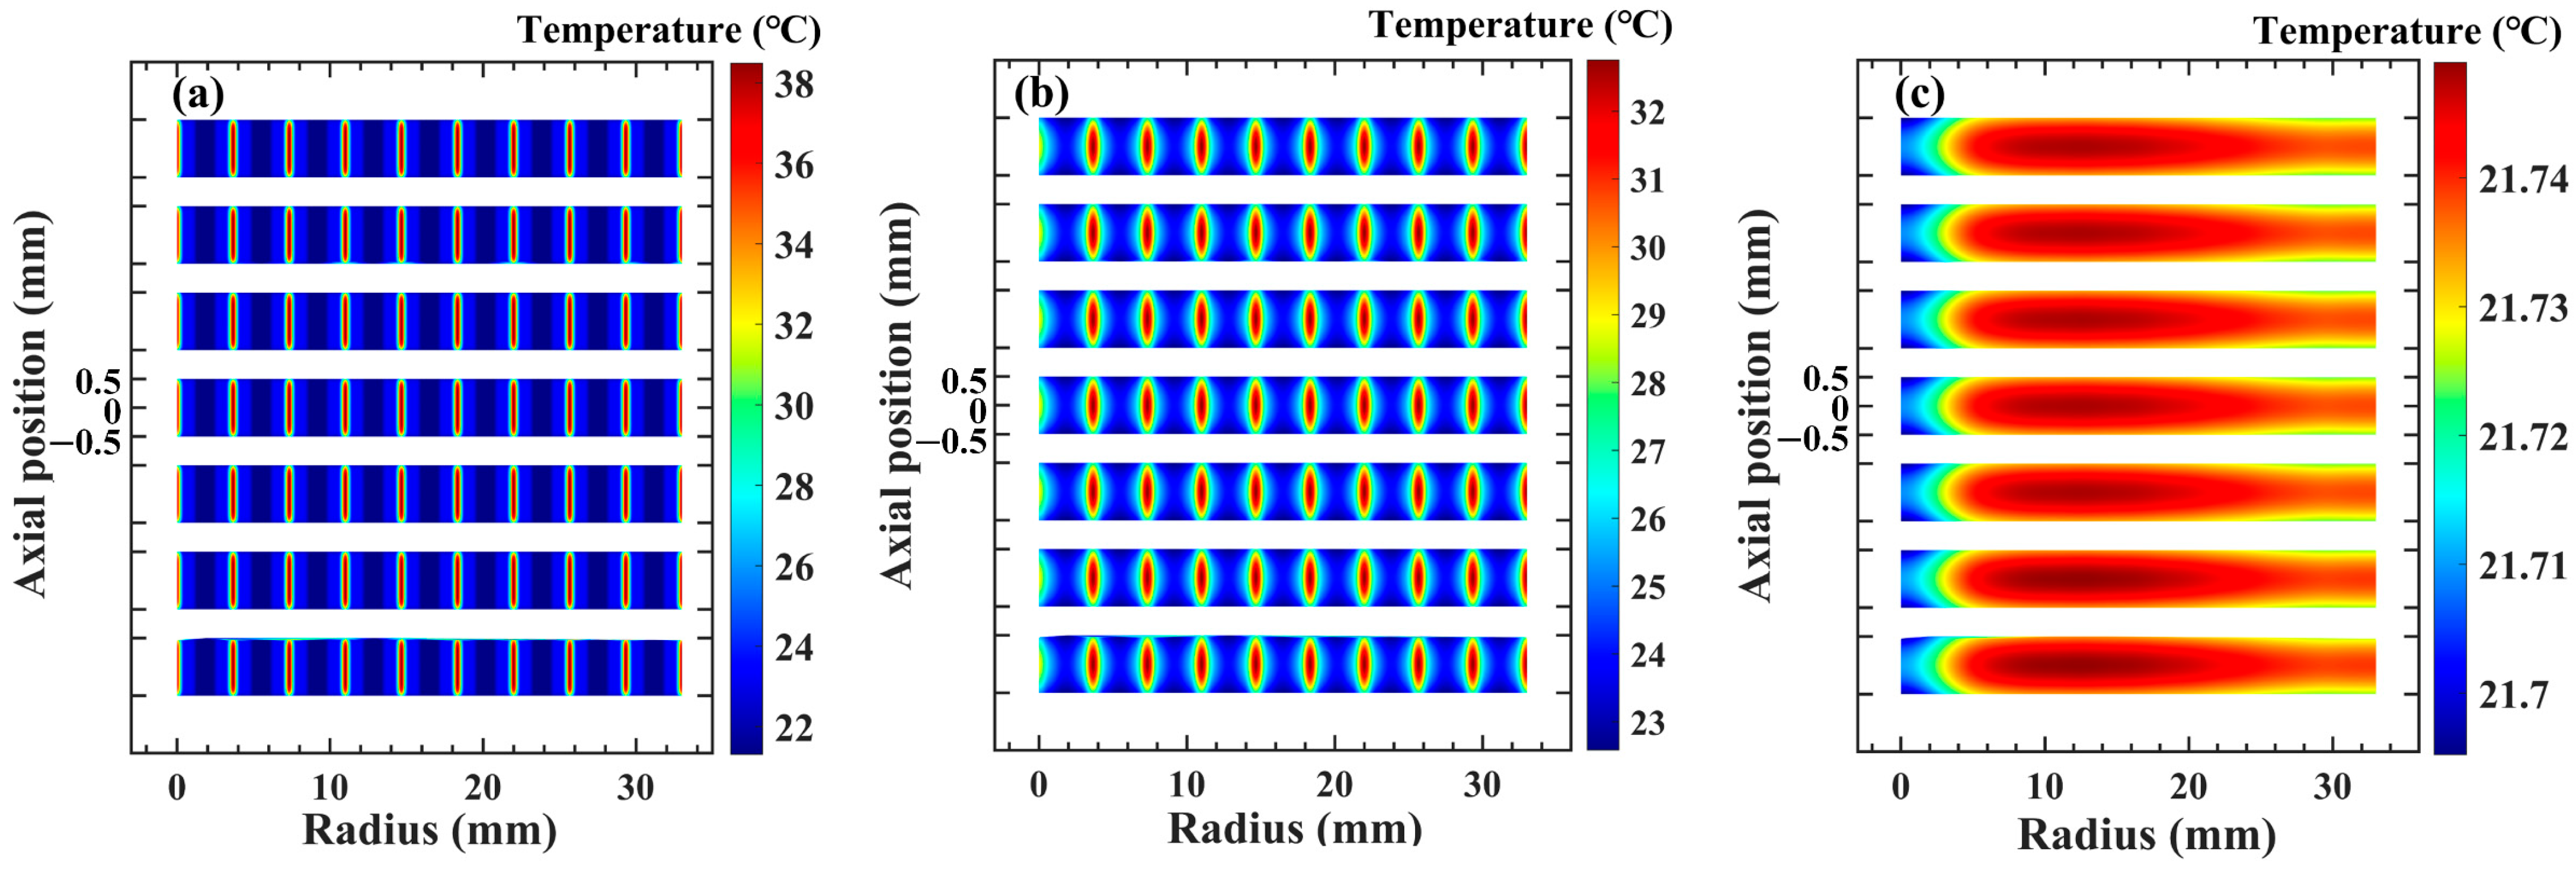
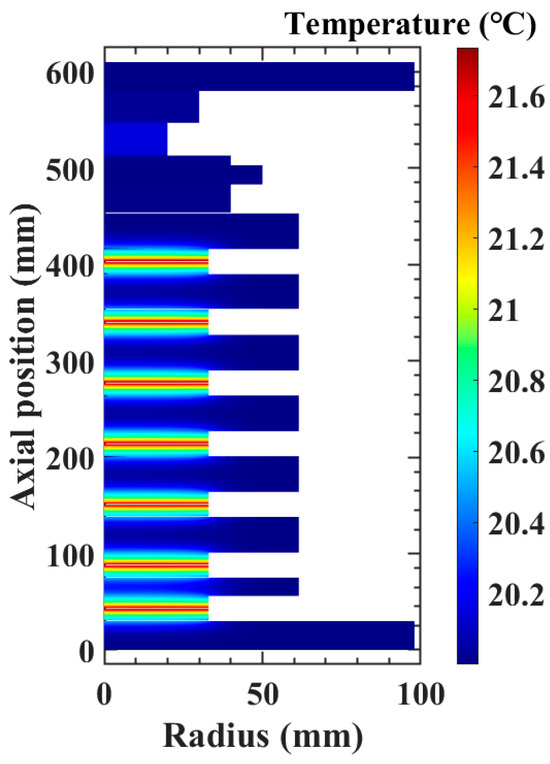
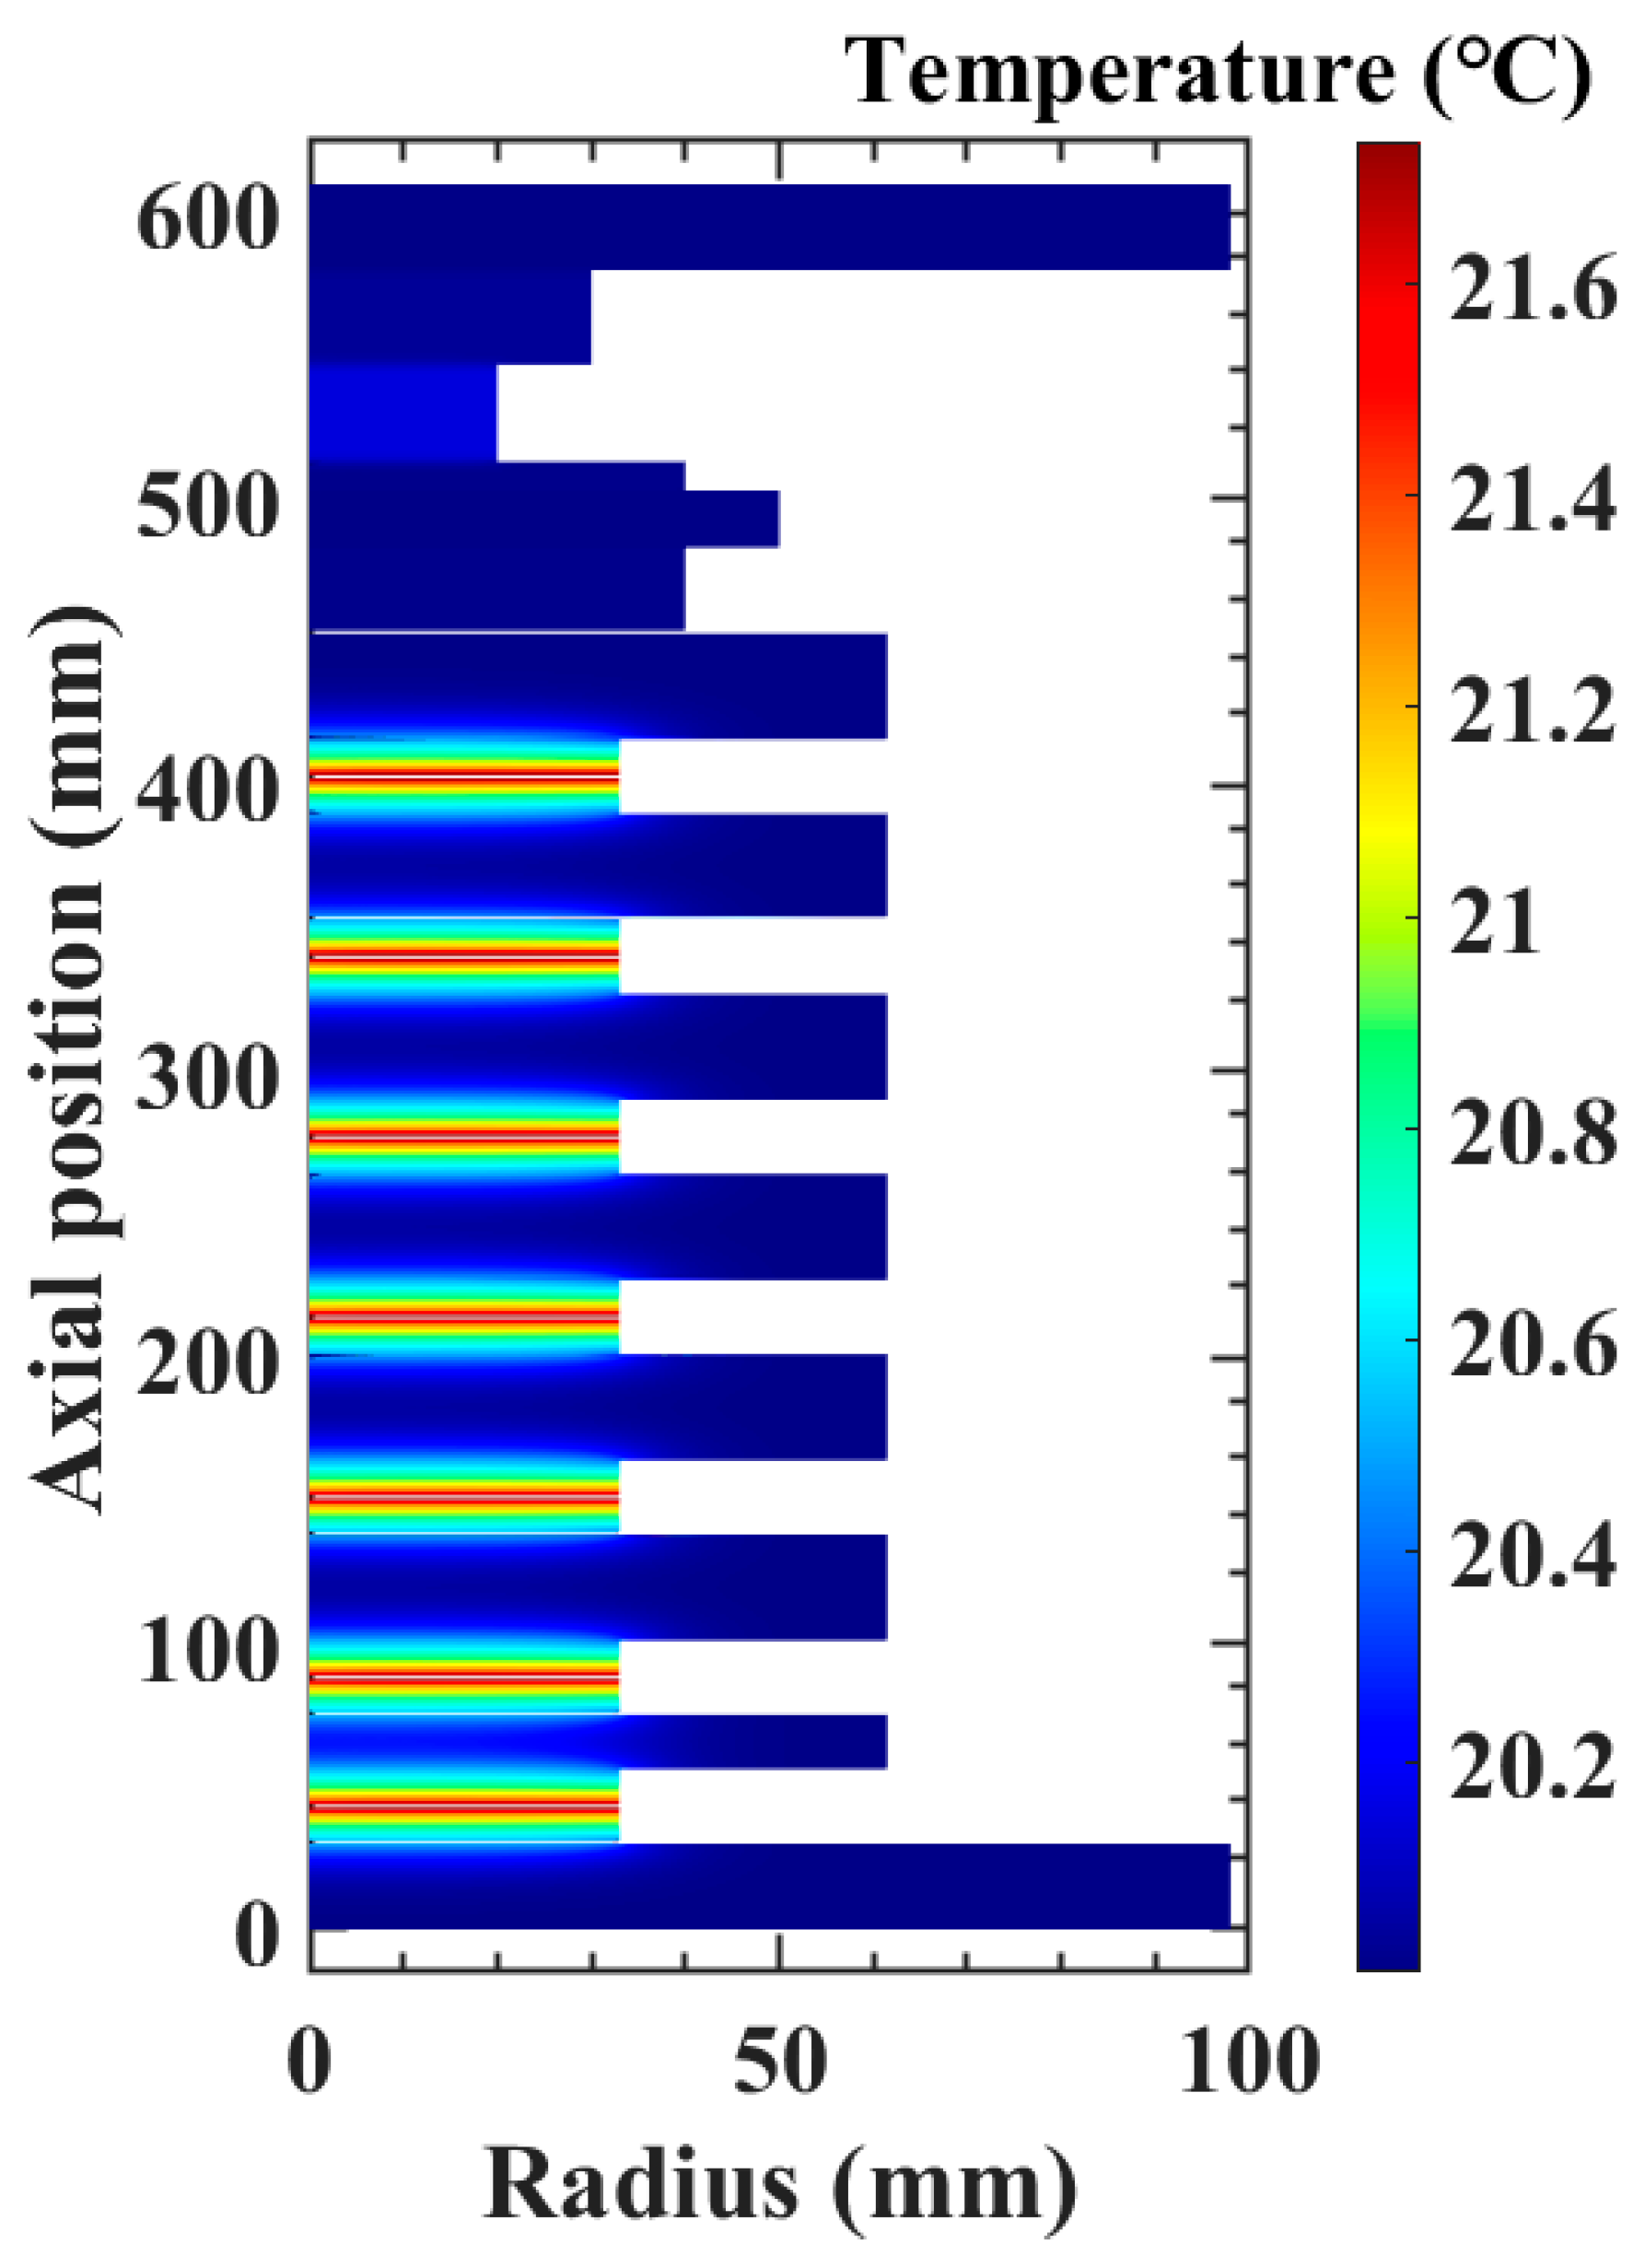
A pulsed discharge condition with a peak current of 75 kA, a repetition rate of 10 Hz, and a pulse duration of 1 s was applied to evaluate the thermal behavior of the series thyristor module prototype. The temperature distribution within the Si wafer is presented in Figure 13. Due to the axisymmetric structure of the series thyristor module, only half of the geometry is depicted. Initial conduction begins at the gate ring, which exhibits the highest temperature, and the thermal profile gradually spreads outward. Ultimately, as shown in Figure 13c, the temperature distribution becomes uniform. The outermost edge of the Si wafer is adiabatic, preventing radial heat dissipation. As a result, heat primarily diffuses vertically (i.e., upward and downward), leading to higher temperature concentrations in the central region. To provide clearer insight into the thermal behavior of surrounding components, the transient temperature field of a thyristor model without the Si wafer is shown in Figure 14. This reveals that heat diffuses predominantly into the Mo plates and Cu bases via thermal conduction, while resistive heating within these materials contributes minimally to the overall temperature rise.
Figure 13.
(a) Temperature distribution at peak temperature (t = 0.900045 s), (b) temperature distribution at the end of current conduction (t = 0.9005 s), and (c) temperature distribution after 50 ms of cooling (t = 0.9505 s) of seven Si wafers.
Figure 14.
Temperature distribution in the Si-removed structure after 50 ms of cooling (t = 0.9505 s).
4. Discussion
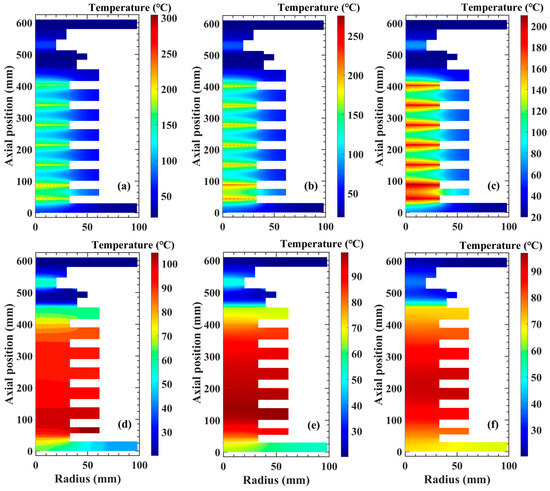
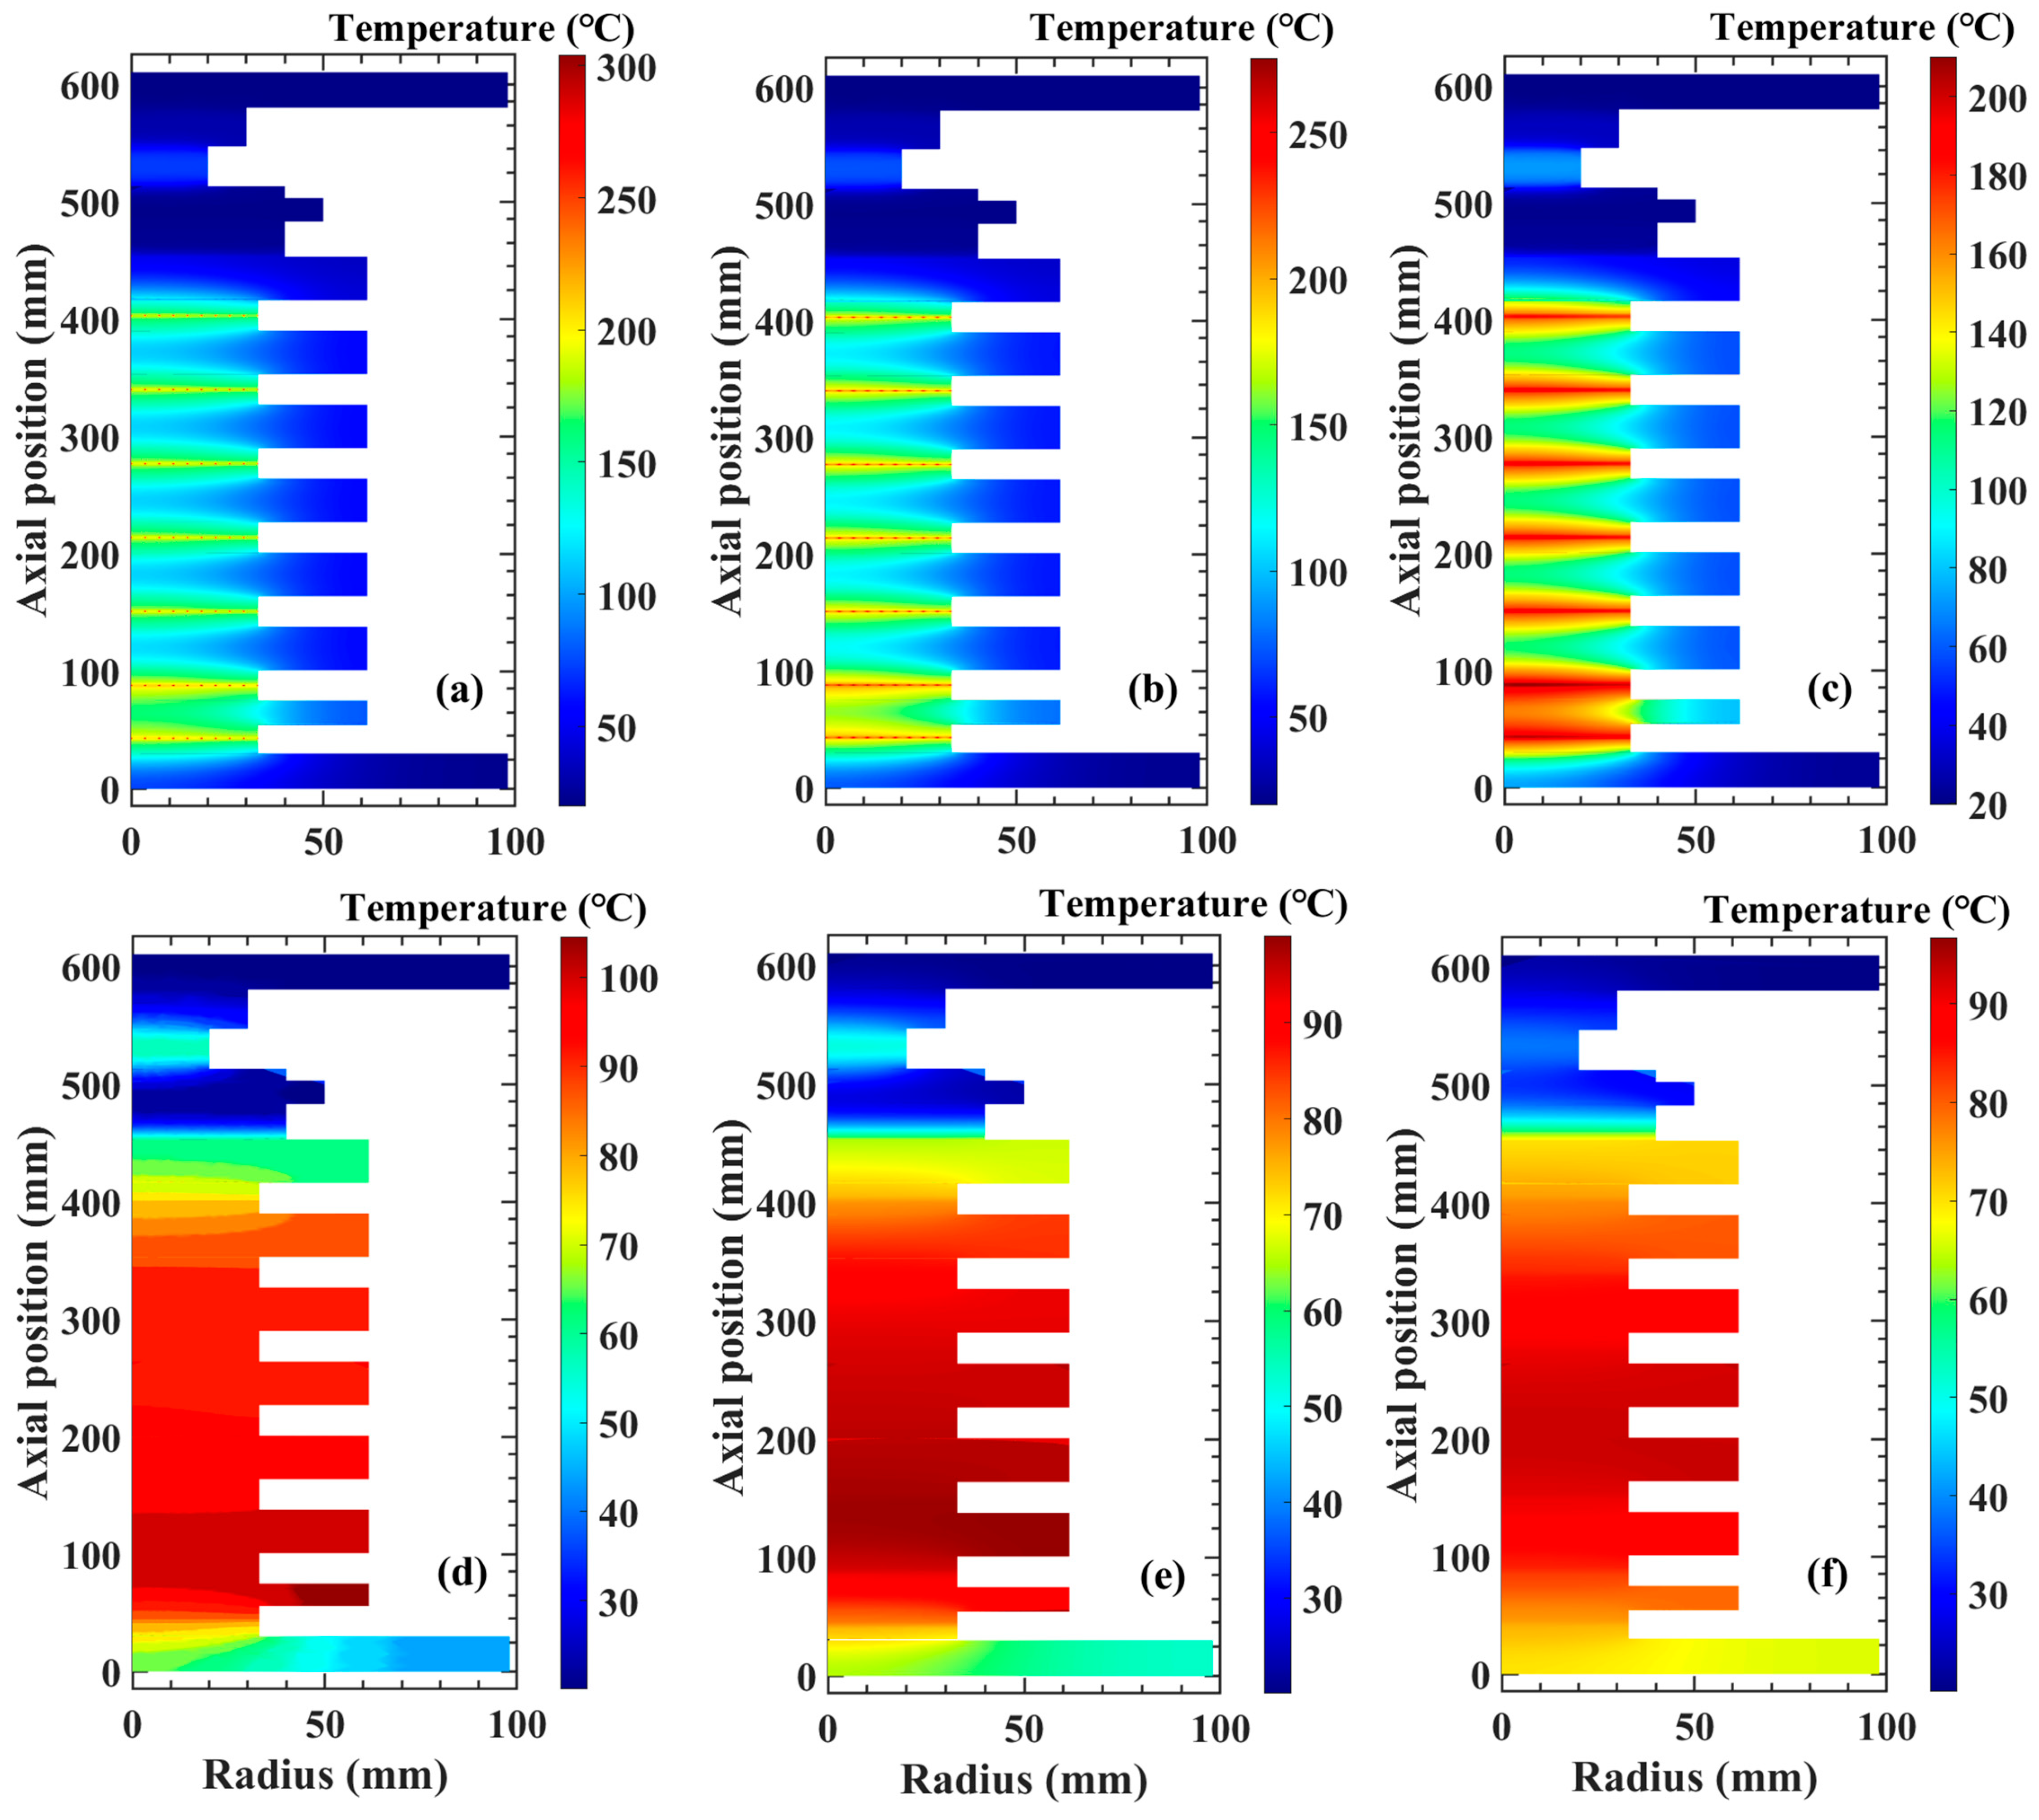
Within the CTI design for ITER, a repetitive rate of 50 Hz is specified. Additionally, under the National Magnetic Confinement Fusion Energy R&D Program of China, operational requirements mandate a sustained repetition rate of 50 Hz for 10 s, with short-circuit testing requiring peak currents exceeding 200 kA—conditions under which thermal management becomes particularly challenging. Simulations conducted under discharge conditions of a 200 kA peak current, 50 Hz repetition rate, and 10 s duration reveal pronounced thermal gradients within the thyristor valve group. The resulting temperature distribution of the thyristor assembly is presented in Figure 15. The findings indicate that peripheral thyristors exhibit lower gate junction temperature rises compared to those centrally located. This thermal gradient is attributed to the spatial configuration: centrally located thyristors are positioned between adjacent devices, leading to superimposed heating when multiple gate regions conduct simultaneously. In contrast, the upper and lower thyristors are situated nearer to the heat dissipation boundaries, facilitating more efficient cooling.
Figure 15.
(a) Temperature distribution at peak temperature (t = 9.980045 s), (b) temperature distribution at the end of current conduction (t = 9.98005 s), (c) temperature distribution after 10 s of cooling (t = 10 s), (d) temperature distribution after 30 s of cooling (t = 30 s), (e) temperature distribution after 50 s of cooling (t = 50 s), and (f) temperature distribution after 2 min of cooling (t = 2 min).
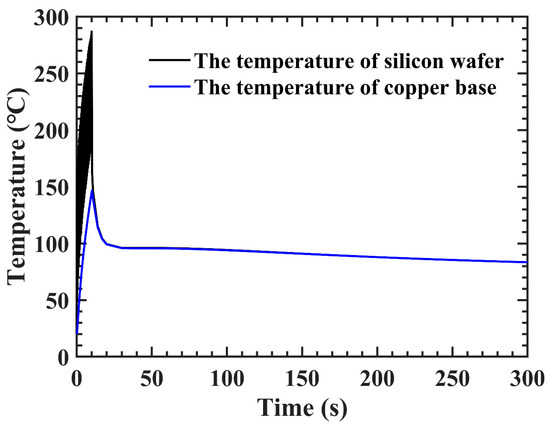
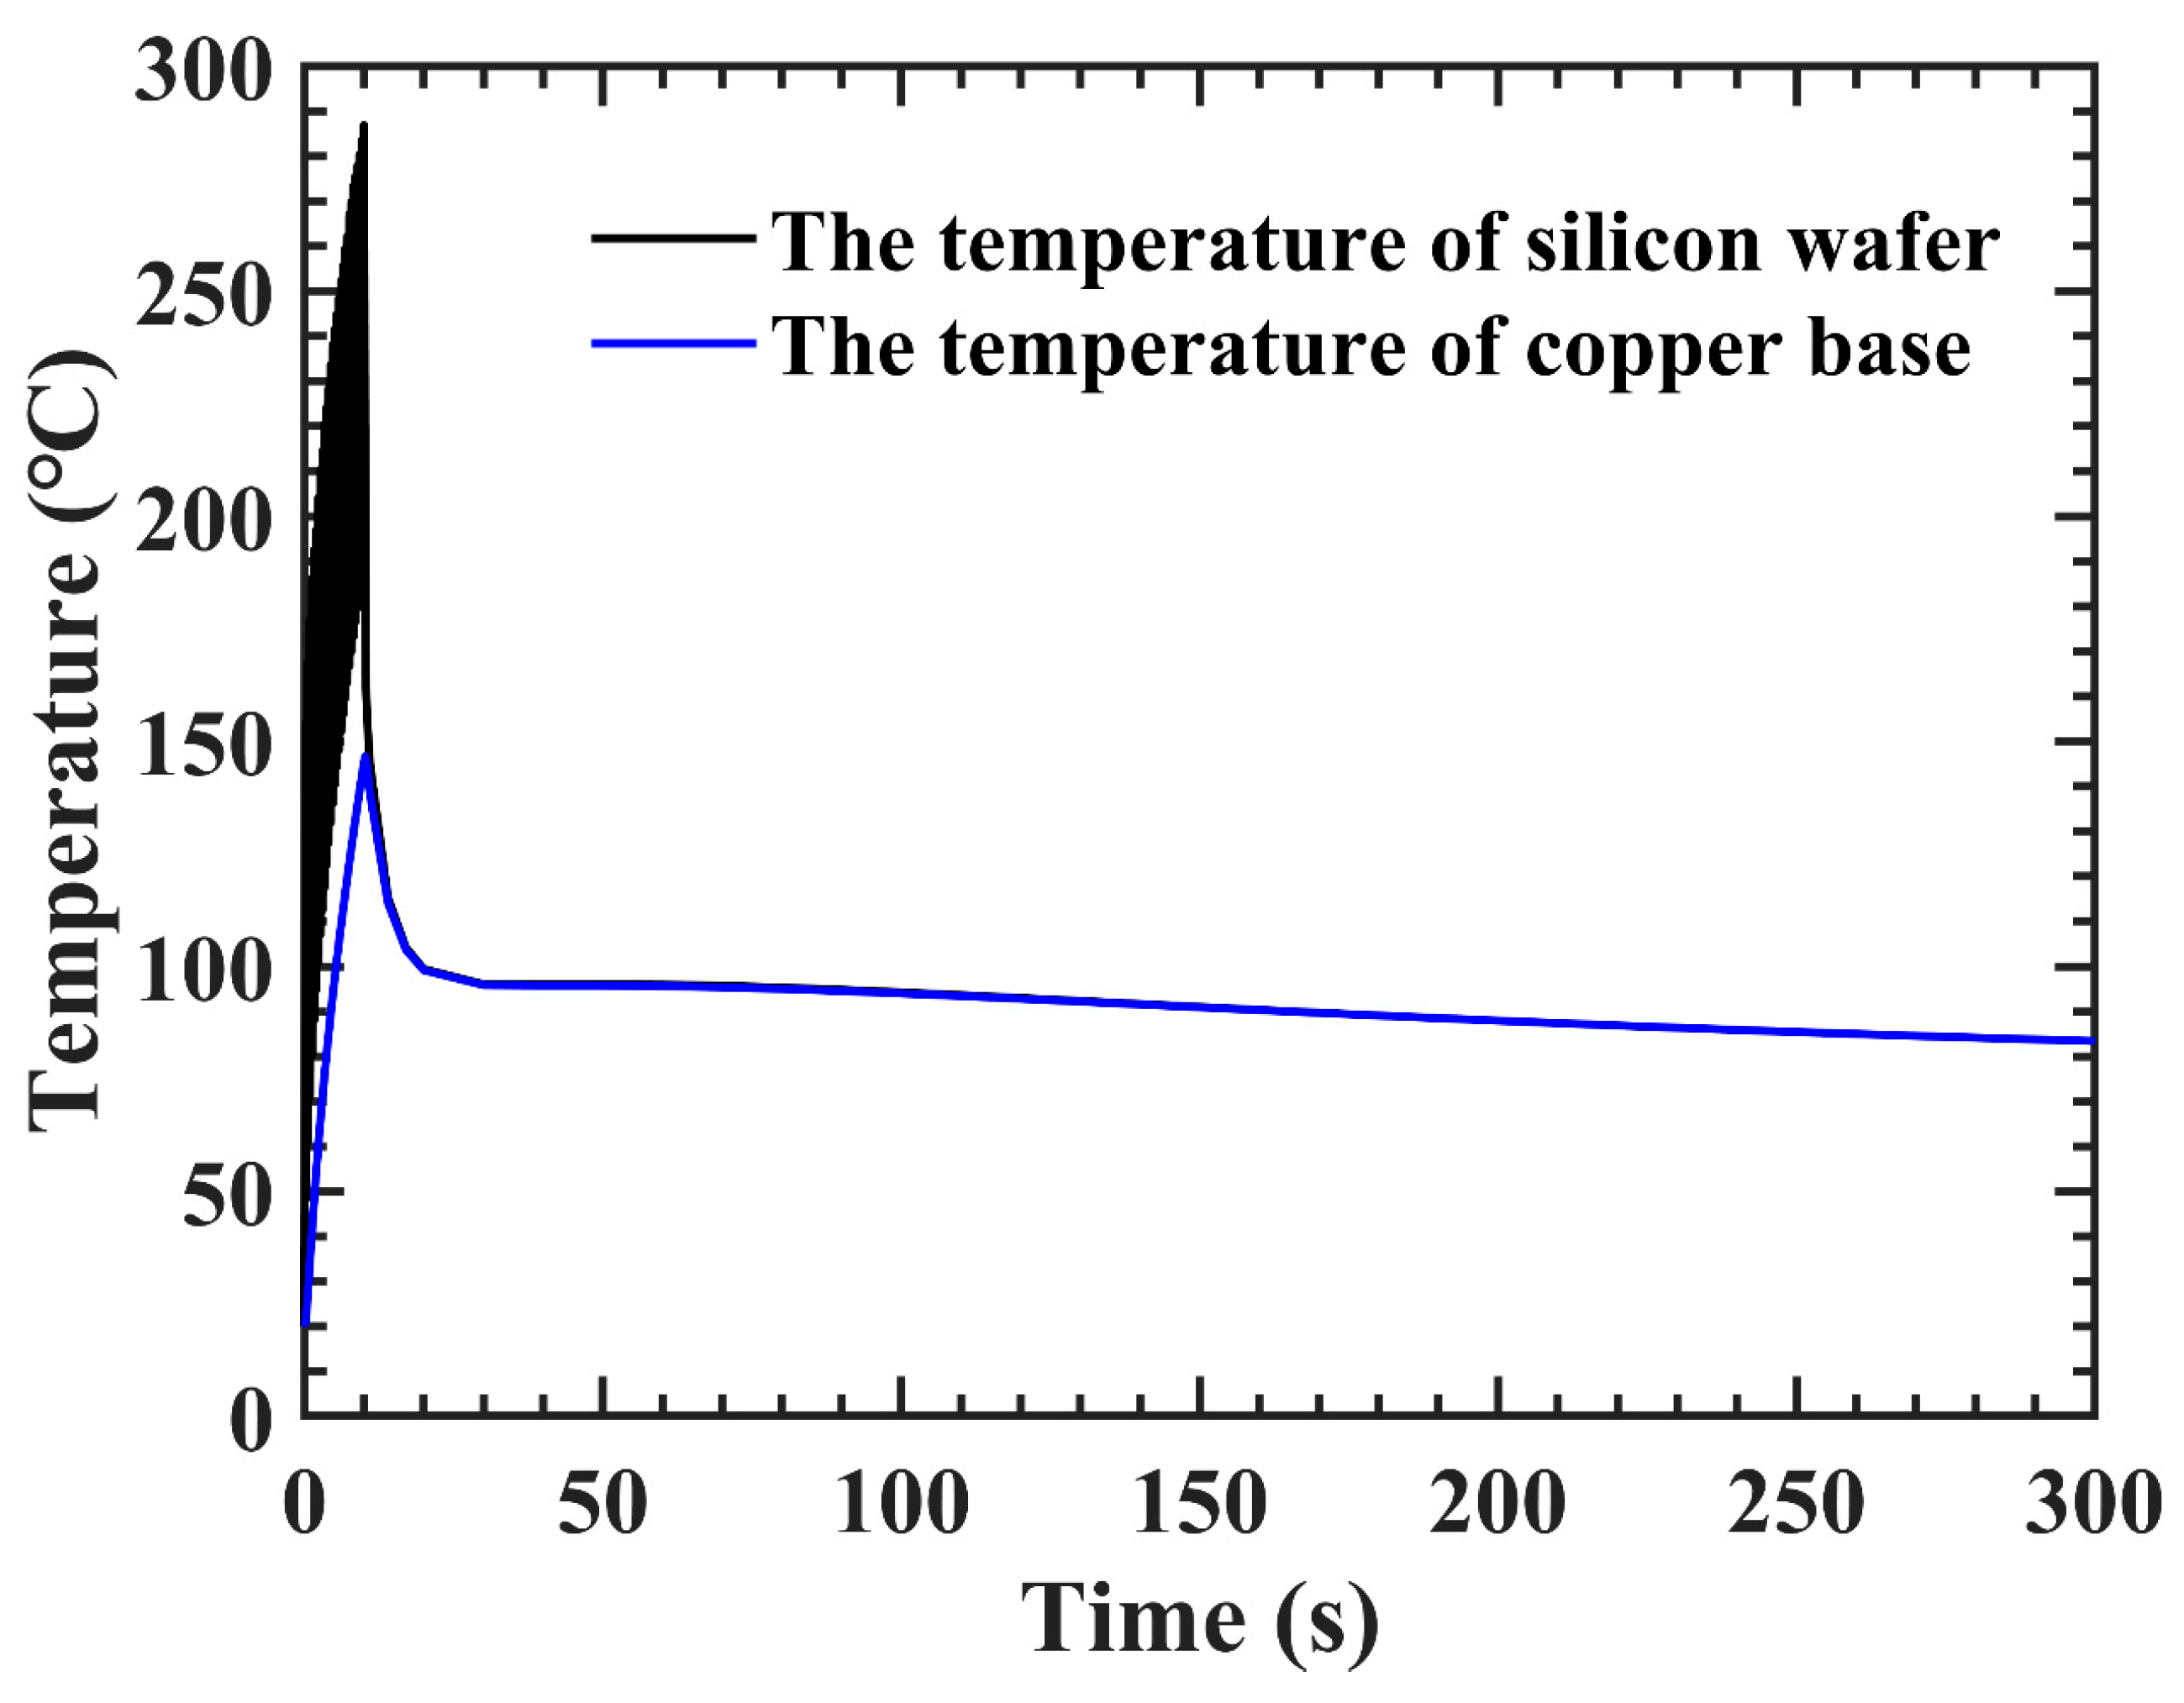
Figure 16 shows the junction temperature profiles of the Si wafer and the Cu base within the central thyristor module. During the 10 s current conduction period, the instantaneous peak temperature on the Si wafer reached 290 °C. Following 30 s of natural cooling, the device achieves a uniform temperature distribution with an approximate 70 °C temperature increase above the ambient temperature. The temperature subsequently decreases slowly, stabilizing at about 80 °C, which is governed by the defined air convective heat transfer coefficient. The results of the two simulation cases are summarized in Table 4.
Figure 16.
The temperature of the Si wafer and Cu base.
Table 4.
Summary of Simulation Results.
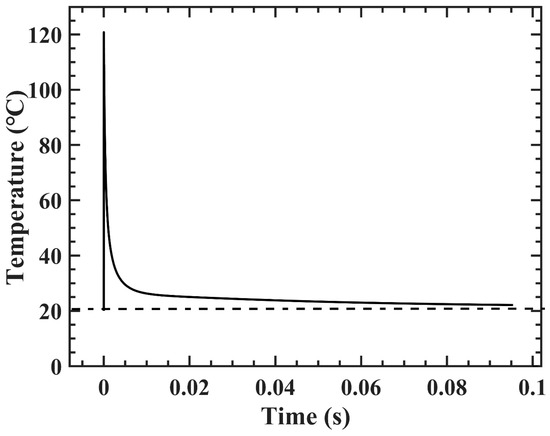
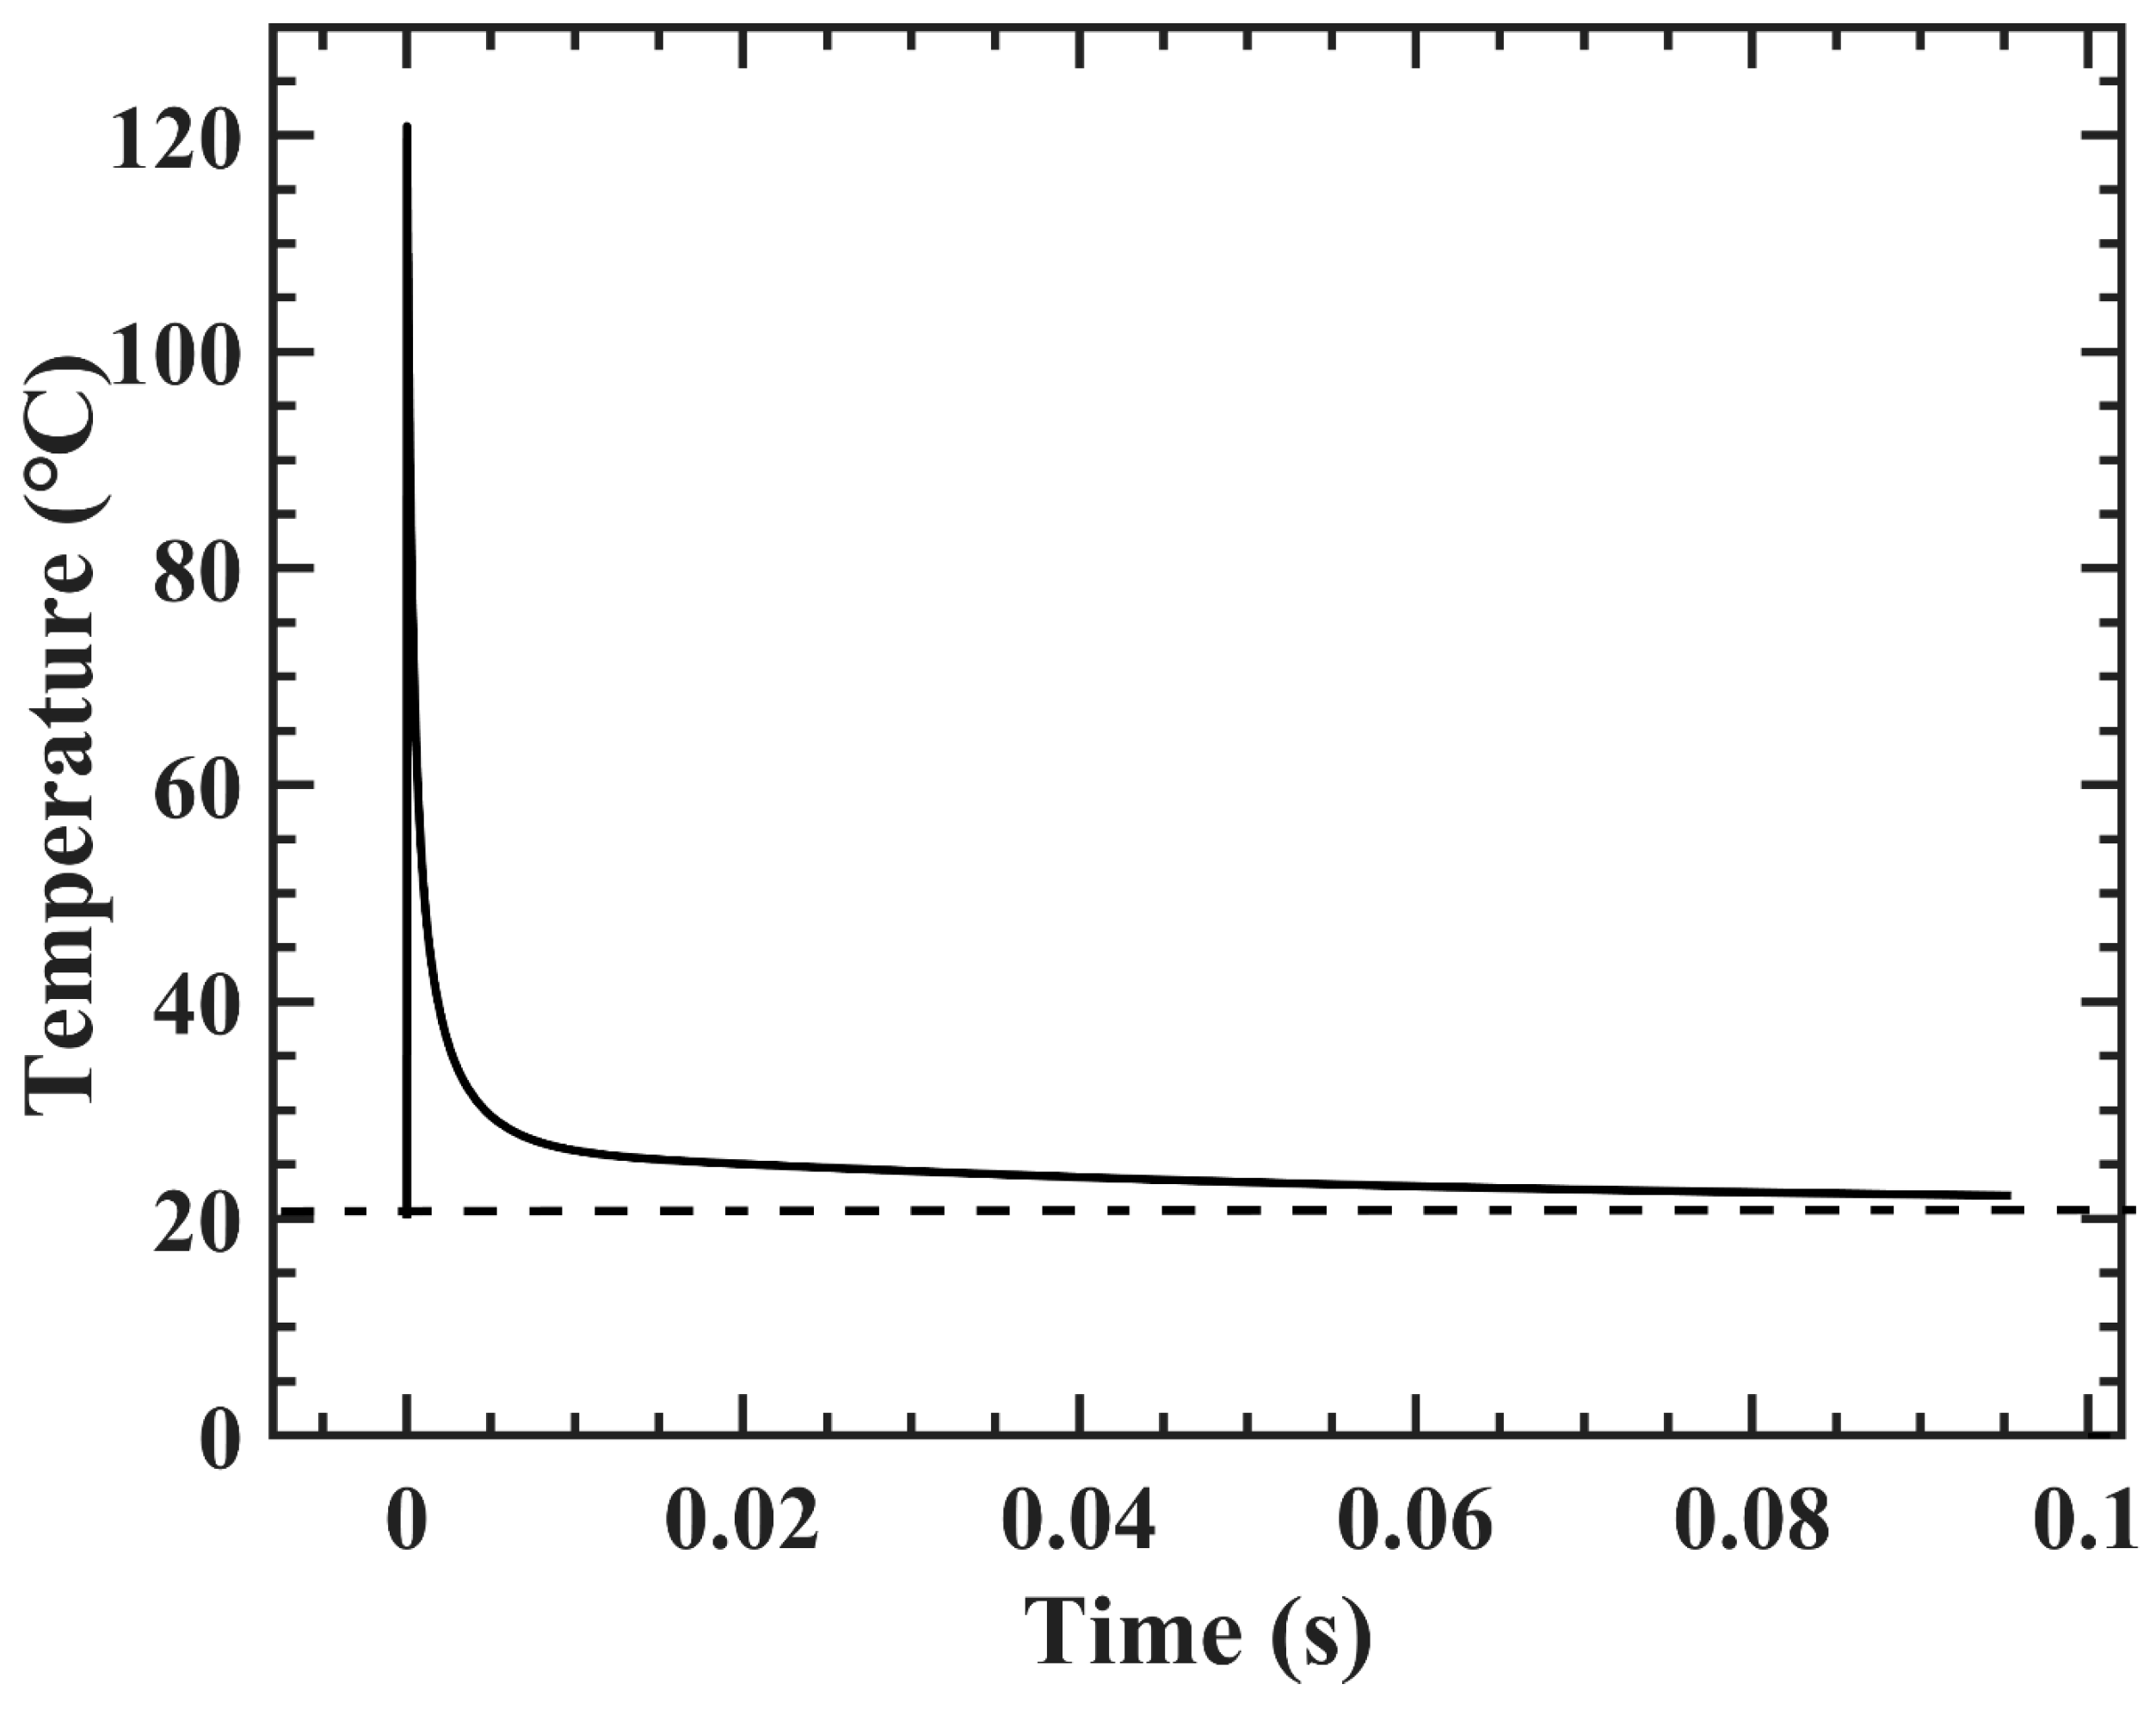
As shown in Figure 17, the time required for the temperature to drop to approximately 20 °C within the first cycle under natural cooling is about 0.1 s. This duration defines the maximum allowable duty cycle under such cooling conditions.
Figure 17.
The temperature of the Si wafer.
Whether device failure is initiated by peak temperature, thermal cycling, or cumulative heating, these thermal stressors can subsequently influence the reliability of the gate triggering function and ultimately compromise the operational lifetime.
Due to the uncertainties in parameters such as the spreading velocity and material properties, the predicted value of 290 °C should be regarded as indicative. In addition, the simulation results indicate that the natural cooling rate is relatively slow, and in practical operation, a certain time interval is required for adequate heat dissipation following current flow termination. To achieve higher operating frequencies, reduce the required cooling intervals, and ensure stable thyristor operation within a lower temperature environment—thereby extending device service life—it is essential to design an effective cooling structure for the thyristor pressure-contact modules. To satisfy the requirements for prolonged operation and enhanced heat dissipation, subsequent experiments may consider replacing the aluminum alloy heat sink blocks between thyristors with water-cooled plates. A suitable heat dissipation medium, such as non-conductive deionized water, can be employed to ensure both electrical insulation and efficient thermal management.
5. Conclusions
In this work, a thermal analysis of the thyristors for realizing the repetitive operation of a CTI is performed. The overall junction temperature variation and local distribution characteristics of the thyristor during the flow of pulsed high current are determined. The main work and conclusions of this paper are as follows.
The spreading process of the conduction area during the turn-on of the thyristor was analyzed, and a finite element simulation model for non-uniform temperature distribution was established within the device. The simulation results demonstrate that under high-current pulsed operation, the temperature initially concentrates near the gate terminal and subsequently diffuses to the surrounding cathode region. The heat diffusion velocity is directly correlated with the expansion speed of the conducting region. As the spreading velocity increases, the magnitude of the temperature rise significantly decreases.
Due to the low thermal conductivity of both Si and Mo, heat within the thyristor is primarily concentrated in the Si wafer. The temperature diffused from the Si wafer to the adjacent Mo plates is minimal, and even less heat reaches the Cu bases located outside the Mo plates. According to the simulation results, under a pulsed current peak of 150 kA and assuming a conduction region expansion velocity of 30 m/s, the gate terminal temperature of the thyristor reaches about 38 °C.
A comprehensive thyristor module model was developed on the basis of a non-uniform finite element model of individual thyristors. The simulation results indicate that resistive heating in the metal interconnects has a minor impact. The highest temperature in the thyristor valve, which is concentrated within the central Si wafer, reaches 38 °C, which is well within the 125 °C safety limit.
However, future pulsed discharge applications require higher peak currents, increased voltage withstand capability, and elevated repetition rates. The simulations under the discharge conditions of a peak current of 200 kA, a repetition rate of 50 Hz, and a duration of 10 s reveal a maximum temperature of 290 °C, which is well above the 125 °C safety limit. Consequently, enhanced cooling methods such as water cooling should be considered.
Author Contributions
Conceptualization, X.F., M.T., F.Z. and X.Z.; methodology, Y.Y., F.Z., C.Q., X.Z., E.W., H.H., D.K. and S.Z.; software, X.F., X.W., C.Q., J.Z. and W.M.; validation, M.T., X.H., F.Z., T.F. and S.Z.; formal analysis, X.H., F.Z., C.Q., E.W. and T.F.; investigation, X.F., X.H., X.Z., E.W. and W.M.; resources, M.T., Y.Y., D.K. and S.Z.; data curation, X.F., X.W., J.Z., W.M., T.F. and S.Z.; writing—original draft preparation, X.F.; writing—review and editing, M.T.; visualization, X.W., J.Z., H.H. and D.K.; supervision, M.T., X.H., X.Z., J.Z., H.H. and T.F.; project administration, X.W., Y.Y. and E.W.; funding acquisition, C.Q. and D.K. All authors have read and agreed to the published version of the manuscript.
Funding
This work was supported by the National MCF Energy R&D Program of China (Nos. 2024YFE03130002 and 2024YFE03130004), the Institute of Energy, Hefei Comprehensive National Science Center (Anhui Energy Laboratory) (No. 24KZS303), the Anhui Province Key Research and Development Plan Program (No. 202304a05020006), and the National Natural Science Foundation of China (Grant No. 12305247).
Data Availability Statement
The original contributions presented in this study are included in the article. Further inquiries can be directed to the corresponding authors.
Conflicts of Interest
Authors Xin Huang and Taixun Fang were employed by the company NR Electrical Co., Ltd. The remaining authors declare that the research was conducted in the absence of any commercial or financial relationships that could be construed as a potential conflict of interest.
References
- Xie, H.; Chan, V.S.; Ding, R.; Shi, N.; Jian, X.; Zagórski, R.; Ivanova-Stanik, I.; Chen, J.; Chen, J.; Li, J.; et al. Evaluation of tritium burnup fraction for CFETR scenarios with core-edge coupling simulations. Nucl. Fusion 2020, 60, 046022. [Google Scholar] [CrossRef] [Scilit]
- Perkins, L.J.; Ho, S.K.; Hammer, J.H. Deep penetration fuelling of reactor-grade tokamak plasmas with accelerated compact toroids. Nucl. Fusion 1988, 28, 1365–1378. [Google Scholar] [CrossRef] [Scilit]
- Parks, P.B. Refueling tokamaks by injection of compact toroids. Phys. Rev. Lett. 1988, 61, 1364–1367. [Google Scholar] [CrossRef] [Scilit]
- Raman, R.; Gierszewski, P. Compact toroid fuelling for ITER. Fusion Eng. Des. 1998, 39–40, 977–985. [Google Scholar] [CrossRef] [Scilit]
- Olynyk, G.; Morelli, J. Development of a compact toroid fuelling system for ITER. Nucl. Fusion 2008, 48, 095001. [Google Scholar] [CrossRef] [Scilit]
- Raman, R. Advanced fuelling system for ITER. Fusion Eng. Des. 2008, 83, 1368–1374. [Google Scholar] [CrossRef] [Scilit]
- Gierszewski, P.; Raman, R.; Hwang, D. Compact toroid fueling for ITER. Fusion Technol. 1995, 28, 619–624. [Google Scholar] [CrossRef] [Scilit]
- Onchi, T.; McColl, D.; Rohollahi, A.; Xiao, C.; Hirose, A.; Dreval, M.; Wolfe, S. Development toward a repetitive compact torus injector. IEEE Trans. Plasma Sci. 2016, 44, 195–200. [Google Scholar] [CrossRef] [Scilit]
- Tan, M.S.; Ye, Y.; Kong, D.F.; Dong, Q.L.; Zhao, Z.H.; Li, Y.H.; Li, B.; Wen, F.; Huang, Y.Q.; Tang, L.H.; et al. Design and operation of a repetitive compact torus injector for the EAST tokamak. Fusion Eng. Des. 2024, 205, 114559. [Google Scholar] [CrossRef] [Scilit]
- Liu, C.; Chen, W.J.; Shi, Y.J.; Tao, H.; Zhou, Q.J.; Zuo, H.L.; Qiao, B.; Xia, Y.; Xiao, Z.Y.; Gao, W.H.; et al. A Novel Insulated Gate Triggered Thyristor With Schottky Barrier for Improved Repetitive Pulse Life and High-di/dt Characteristics. IEEE Trans. Electron Devices 2019, 66, 1018–1025. [Google Scholar] [CrossRef] [Scilit]
- Feng, B.Y.; Liu, J.; Li, Y.S.; Fu, Y.J.; He, M.B. Thermal Behaviors of Thyristors in Repetitive Pulsed Power Applications. IEEE Trans. Plasma Sci. 2022, 50, 3659–3667. [Google Scholar] [CrossRef] [Scilit]
- Dai, L.; Hu, J.C.; Yang, Y.; Lin, F.C.; Zhang, Q. Research on transient junction temperature rise of pulse thyristor. In Proceedings of the 2016 IEEE International Power Modulator and High Voltage Conference (IPMHVC), San Francisco, CA, USA, 6–9 July 2016; pp. 482–487. [Google Scholar]
- Baliga, B.J. Temperature dependence of field-controlled thyristor characteristics. IEEE Trans. Electron Devices 1981, 28, 257–264. [Google Scholar] [CrossRef] [Scilit]
- Dettori, R.; Melis, C.; Cartoixà, X.; Rurali, R.; Colombo, L. Thermal boundary resistance in semiconductors by non-equilibrium thermodynamics. Adv. Phys. X 2016, 1, 246–261. [Google Scholar] [CrossRef] [Scilit]
- Sergeev, V.A.; Frolov, I.V. Estimate of Errors in the Determination of Parameters of Linear Thermal Circuits of Semiconductor Devices Based on the Frequency Dependence of the Thermal Impedance. Meas. Tech. 2016, 59, 850–855. [Google Scholar] [CrossRef] [Scilit]
- Wu, J.; Fu, X.; Lei, R.; Liu, S.Q.; Wang, S.; Zhao, Y.N. Transient Temperature Field Analysis of Thyristor Turn-on Process under Narrow Pulse Width and Large Current. IOP Conf. Ser. Earth Environ. Sci. 2019, 252, 032069. [Google Scholar] [CrossRef] [Scilit]
- Adler, M.S.; Possin, G.E. Achieving accuracy in transistor and thyristor modeling. IEEE Trans. Electron Devices 1981, 28, 1053–1059. [Google Scholar] [CrossRef] [Scilit]
- Huang, X.; Fang, T.X.; Zhou, Q.W.; Zhang, L.; Chen, H.; Huangfu, X.X. Research on Repetition Frequency Pulse Current Source Based on Solid State Switching Technology. In Proceedings of the 10th Frontier Academic Forum of Electrical Engineering (FAFEE2022); Springer: Singapore, 2022; pp. 789–796. [Google Scholar]
- Ryabin, T.V.; Yankov, G.G.; Artemov, V.I.; Ryabin, V.V. Optimization of Radiator Design for Immersion Cooling of a Powerful Thyristor. Therm. Eng. 2024, 71, 867–877. [Google Scholar] [CrossRef] [Scilit]
- Yang, G.Y.; Li, X.Y.; Hu, Y.Y.; Li, K. Review of thyristor junction temperature calculation methods. Adv. Mater. Res. 2013, 798–799, 91–96. [Google Scholar] [CrossRef] [Scilit]
- Profumo, F.; Tenconi, A.; Facelli, B.; Passerini, B.; Fimiani, S. A new approach to the instantaneous junction temperature evaluation of high power diodes (thyristors) during past current transients. In PESC97. Record 28th Annual IEEE Power Electronics Specialists Conference. Formerly Power Conditioning Specialists Conference 1970-71. Power Processing and Electronic Specialists Conference 1972; IEEE: New York, NY, USA, 1997; Volume 1, pp. 154–158. [Google Scholar]
- Motto, J.W., Jr.; Karstaedt, W.H.; Sherbondy, J.M.; Leslie, S.G. Thyristor(diode) on-state voltage, the ABCD modeling parameters revisited including isothermal overload and surge current modeling. In IAS ‘96. Conference Record of the 1996 IEEE Industry Applications Conference Thirty-First IAS Annual Meeting; IEEE: New York, NY, USA, 1996; Volume 3, pp. 1481–1488. [Google Scholar]
- Chasnikov, I.G.; Levinshtein, M.E.; Shenderey, S.V. Experimental investigation of turn-on spread in a thyristor. Solid-State Electron. 1981, 24, 649–653. [Google Scholar] [CrossRef] [Scilit]
- Yan, X.; Yu, Z.Q.; Qu, L.; Gan, Z.Z.; Huang, Y.L.; Feng, J. Electro-Thermo-Mechanical Analysis and Modeling of High-Power Intergrated Gate Commutated Thyristors. IEEE Trans. Power Electron. 2024, 39, 6654–6663. [Google Scholar] [CrossRef] [Scilit]
- Lyu, G.; Yu, Z.Q.; Zhou, W.P.; Xu, C.Q.; Chen, Z.Y.; Zhao, B.; Liu, J.P.; Zeng, R. 6-in Dual-Gate Ring Commutated Thyristor for DC Circuit Breakers. IEEE Trans. Electron Devices 2019, 66, 1444–1449. [Google Scholar] [CrossRef]
- Matsuzawa, T. Spreading velocity of the on state in high-speed thyristors. Electr. Eng. Jpn. 1973, 93, 136–141. [Google Scholar] [CrossRef] [Scilit]

Disclaimer/Publisher’s Note: The statements, opinions and data contained in all publications are solely those of the individual author(s) and contributor(s) and not of MDPI and/or the editor(s). MDPI and/or the editor(s) disclaim responsibility for any injury to people or property resulting from any ideas, methods, instructions or products referred to in the content. |
© 2026 by the authors. Licensee MDPI, Basel, Switzerland. This article is an open access article distributed under the terms and conditions of the Creative Commons Attribution (CC BY) license.