Abstract
This paper theoretically and experimentally investigates the effect of condenser location and geometry on the thermal performance of a vapor chamber, as thermal management systems for electronic devices with multiple heat sources under non-uniform heat flux conditions. A weighting factor approach was applied to represent the non-uniform heat input imposed on individual heat sources. The proposed theoretical model was validated through comparison with Lefèvre’s analytical results under the same conditions and experimental data obtained under different condenser locations. It was shown that the wall temperature distribution for the separated condenser configuration was lower than for the concentrated configuration. Using the validated model, the effects of condenser geometry on the temperature uniformity and maximum heat transfer rate of the vapor chamber were analyzed under the capillary limit condition by varying the condenser aspect ratio. The results show that higher aspect ratios improve temperature uniformity due to wider condenser coverage, whereas lower aspect ratios enhance the maximum heat transfer rate by reducing the liquid pressure drop between the evaporator and condenser. Specifically, the maximum heat transfer rate reaches 72.6 W at an aspect ratio of 2.5, which corresponds to a 13.3% increase compared to 64.1 W at an aspect ratio of 8.3.
1. Introduction
Portable electronic devices are typically composed of multiple electronic components such as the application processor (AP), graphics processing unit (GPU), and random access memory (RAM) [1,2]. When cooling is insufficient or computational loads are high, localized hot spots can develop owing to the non-uniform power dissipation among individual components [3,4]. If such localized thermal loads are not adequately mitigated, they can induce excessive thermal stress, leading to accelerated material degradation and a reduction in device reliability. In particular, maintaining the maximum temperature of electronic devices below 80 °C is essential to prevent performance degradation and ensure reliable operation [5,6]. Therefore, effective thermal management systems for multiple heat sources are essential to sustain long-term device performance [3,7,8].
Phase change materials (PCMs) have been widely applied in electronic cooling applications due to their high latent heat capacity, which enables effective reduction in sudden heat generation. However, once the melting process is completed, their heat absorption capability rapidly diminishes. In addition, inherently low thermal conductivity of PCMs and the risk of leakage in the liquid phase make them unsuitable for prolonged high-power operation [9]. To overcome these limitations, vapor chambers have attracted considerable attention as effective thermal management devices. A vapor chamber is a two-phase heat transfer device that utilizes the phase change in a working fluid to redistribute localized heat load and thereby alleviate temperature non-uniformity within the device. Therefore, many studies have focused on the thermal performance of vapor chambers under multiple heat source conditions [10,11,12]. Dan et al. [10] proposed a quasi-dynamic thermal resistance network model for vapor chambers with multiple heat sources, designed to capture the transient temperature response and spatial temperature distribution under non-uniform heating conditions while accounting for the effects of vapor core and wick thermal resistances. Kim et al. [11] developed a modified analytical model to evaluate the thermal performance of thin vapor chambers with multiple heat sources as well as multiple heat sinks under non-uniform heat flux conditions, considering various wick structures. The model was used to investigate how heat flux distribution and wick parameters affect the pressure and temperature distributions, and consequently the thermal performance limits of the vapor chamber. Zhou et al. [12] experimentally investigated the thermal spreading and operating characteristics of a large-size aluminum vapor chamber under multi-point heat source conditions, aiming to verify its feasibility for dissipating spatially distributed heat loads in large-scale electronic systems. These studies [10,11,12] primarily focused on understanding the thermal performance of vapor chambers under non-uniform and multi-source heating conditions, with particular emphasis on internal thermal resistance, wick characteristics, and heat flux distribution. However, the effect of the condenser location and geometry on the vapor chamber performance hadn’t been sufficiently investigated. In practical cooling systems, the condenser region typically occupies the largest volume and mass, thereby playing a critical role in system miniaturization and weight reduction. Moreover, improper condenser location and geometry can lead to inefficient heat removal under localized heat generation, potentially degrading thermal stability. Since the condenser configuration directly governs the internal velocity and pressure fields of the working fluid, optimizing its location and geometry is essential for achieving efficient heat dissipation while improving the design flexibility and compactness of the cooling system.
In this study, a theoretical and experimental investigation was conducted to analyze the effect of condenser location and geometry on the wall temperature distribution and the maximum heat transfer rate of a vapor chamber operating under the capillary limit with non-uniform multiple heat source conditions. To represent non-uniform heat flux at each heat source, a weighting factor approach based on the relative heat flux ratio among heat sources was applied [11]. The proposed theoretical model was preferentially validated by comparison with Lefèvre’s analytical results [13] under identical conditions. The theoretical model was further validated experimentally by comparing the theoretically predicted and experimentally measured evaporator temperatures for different condenser locations and heat load conditions. Two condenser locations were considered: a separated configuration with condensers positioned above and below the evaporator, and a concentrated configuration with the condenser located only below the evaporator. Different heat load distributions were imposed for each case to account for the corresponding condenser arrangements. Based on the validated model, the wall temperature distribution and the maximum heat transfer rate of the vapor chamber were theoretically evaluated by varying the condenser geometry. The condenser geometry was varied by changing the aspect ratio of the condenser surface area while maintaining a constant total condenser contact area.
2. Analytical Study
The present model represents a vapor chamber composed of a solid wall, a porous wick, and an internal vapor space, as shown in Figure 1a. Three discrete heaters (E1–E3) and two condenser (C1, C2) regions are located on the surface of the vapor chamber, as shown in Figure 1b. The chamber wall is made of copper, and ethanol is used as the working fluid. An M150 screen mesh wick is adopted in the present model. All regions except the heat source and the condenser were assumed to be adiabatic.
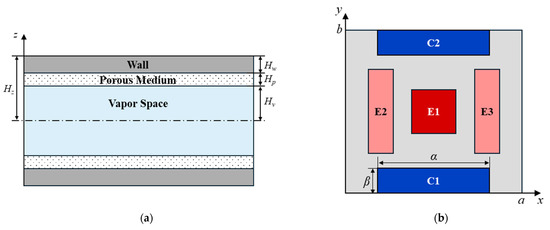
Figure 1.
Schematic view of the vapor chamber. (a) Cross-sectional view. (b) Top view.
2.1. Temperature Distribution Model
As shown in Figure 1b, the vapor chamber with multiple heat sources and condensers was theoretically analyzed. The governing energy equation at the wall [13] is given by
where Cp, kw, T, t, and ρ are specific heat, thermal conductivity of the wall, temperature, time, and density, respectively. In this analysis, the effects of convection and radiation on the wall were neglected. Under steady-state conditions, the energy equation at the vapor chamber wall is expressed in Equation (2) [13].
where x, y, and z are coordinates. The average heat flux is defined by
where Ae,i, Q, and qavg are evaporator area of i-th heat source, total heat input, and average heat flux calculated by dividing the total heat input by the total area of the heat, respectively. The dimensionless variables are defined as Equations (4) and (5).
where a, b, c, Hw, h, Tsat, and T* are the lengths of the x-direction, y-direction, and z-direction, the height of the vapor chamber wall, heat transfer coefficient, saturation temperature, and dimensionless temperature, respectively. By substituting Equations (4) and (5) into Equation (2), the equation can be derived as Equation (6) [13].
where Bi, B, C, X, Y, and Z are Biot number and dimensionless variables, respectively. The boundary conditions are given by
where wi, η, ϕ and χi are weighting factor, area ratio of the evaporator to the condenser (defined as ), the dimensionless heat flux, and the area of the i-th heat source, respectively. The non-uniform heat flux applied to the evaporator wall was defined using a weighting factor, while adiabatic conditions were assumed for all regions excluding the evaporators and condensers.
where N and γi are total number of heat sources and relative heat flux ratio of the i-th heat source, respectively. In Equation (12), the weighting factor is expressed as the heat flux ratio multiplied by the number of heat sources, applying the same average heat flux to each heat source. The dimensionless temperature T* and the dimensionless heat flux ϕ are assumed in the form of a two-variable Fourier series, as shown in Equations (13) and (14).
By applying Equations (10)–(12) to Equation (14), the coefficients Bm0, B0n, and Bmn are obtained as given by
The coefficients Am0, A0n, and Amn are derived by substituting Equation (14) into Equation (6), using Equations (7)–(11) and (15)–(17).
2.2. Liquid Pressure Distribution Model
According to Darcy’s law, the velocity and pressure of the liquid within the porous medium (wick) are expressed as Equations (21) and (22).
where K, P, u, v, and μ are permeability, pressure, velocity in the x-direction, velocity in the y-direction, and dynamic viscosity, respectively. The subscript l denotes the liquid phase. The porous medium (wick) used in this study is a screen mesh, and its permeability K is given by the following equation [13].
where d, Nm, w, and ξ are fiber diameter, mesh number, distance between fibers, and porosity, respectively. By applying Equations (21) and (22) to the mass balance of the liquid phase within the wick, the second-order partial differential equation is expressed as Equation (26).
where Hp, hlv, keq, kl, kp, and ρ are height of the porous medium, latent heat, equivalent thermal conductivity, thermal conductivity of the liquid, thermal conductivity of the porous medium, and density, respectively. The series model was used for the effective thermal conductivity of the wick, as shown in Equation (27) [14]. The boundary conditions are given by
By applying a two-dimensional Fourier series to the liquid pressure distribution, it can be expressed as Equation (29).
By substituting Equation (29) into Equation (26), the coefficients Cm0, C0n, and Cmn are expressed as Equations (30)–(32).
2.3. Vapor Pressure Distribution Model
The vapor flow between two parallel plates was assumed to be fully developed laminar flow. Under the incompressible flow assumption, the velocity distribution is expressed as Equations (33) and (34).
where the subscript v denotes the vapor phase, and Hv is the height of the vapor space. By applying Equations (33) and (34) to mass balance in the vapor phase, a second-order partial differential equation is obtained as Equation (35).
The boundary conditions are given by
By applying a two-dimensional Fourier series to Pv, it can be expressed as Equation (37)
where coefficients Cm0, C0n, and Cmn are given by Equations (30)–(32).
2.4. Maximum Heat Transfer Rate
In this study, the maximum heat transfer rate was evaluated based on the capillary limit, since other operational limits are not expected to be dominant under the investigated conditions. The analysis was performed under steady-state and ambient operating conditions, for which vapor velocities remain sufficiently low, thereby precluding sonic limitation. The applied heat flux levels are also below those required to induce local boiling within the wick structure. Moreover, liquid flow resistance within the wick is sufficiently small such that viscous limitations are negligible. Therefore, the maximum heat transfer rate in the present configuration is governed by the capillary limit as expressed as
where P, Pcap, reff, and σl are pressure, capillary pressure, effective pore radius, and surface tension, respectively. The subscript g denotes gravitational effect. Because the vapor chamber is assumed to be in a horizontal position, the gravitational pressure drop ΔPg in Equation (38) can be neglected. The maximum heat transfer rate is determined when total pressure difference for liquid and vapor reaches the capillary pressure.
3. Experimental Approach
Figure 2 shows the experimental apparatus used to validate the proposed theoretical model with respect to condenser location. The measurement devices used in the experiments are listed in Table 1. The heat was supplied using film heaters (model PLMLV-0502, OMEGA Engineering Inc., Norwalk, CT, USA) and power supplies, and copper blocks were placed beneath the evaporator and the condenser, in contact with the vapor chamber, to ensure a uniform temperature condition across the entire contact area. To minimize the heat loss to the ambient, the heaters were covered with thermal insulation (Isopink). The temperatures of the condensers were controlled using thermal baths to ensure stable and uniform thermal boundary conditions during the experiments. The configuration of the vapor chamber investigated in this study is shown in Figure 3. The device incorporates three discrete heat sources, denoted as E1 through E3. The vapor chamber has overall dimensions of 100 mm × 100 mm × 1 mm, with copper used as the wall material and ethanol as the working fluid. An M150 screen mesh wick served as the porous medium. The atmospheric temperature is assumed to be 25 °C. The detailed coordinates and surface areas of each heat source are provided in Table 2. As shown in Table 2, the surface areas of evaporator E2 and E3 are each 663.0 mm2, while evaporator E1 has a surface area of 676.0 mm2. A heat load of 20 W was applied to E1, whereas 10 W was applied to both E2 and E3.
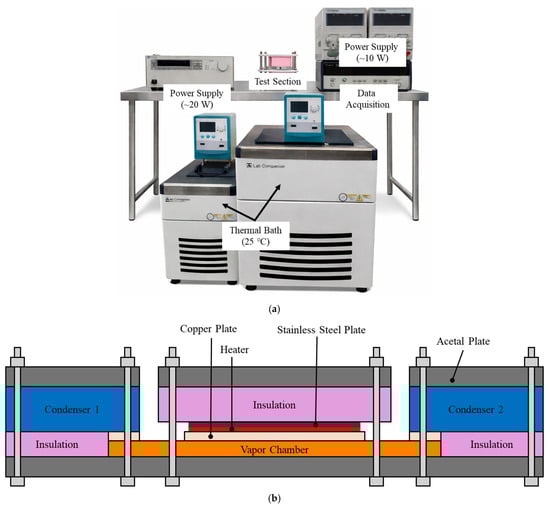
Figure 2.
Experimental apparatus. (a) Experimental Setup. (b) Schematic diagram of the test section.

Table 1.
Measurement devices.
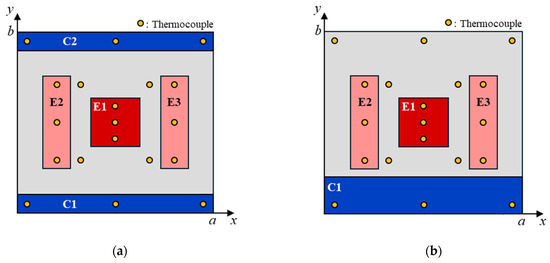
Figure 3.
Schematic view of experimental conditions. (a) Case 1 (Separated condenser). (b) Case 2 (Concentrated condenser).
Table 2.
Locations of evaporator and condenser.
The experiments were performed under two distinct configurations. In Case 1, the condenser was separated into upper and lower sections (C1 and C2), whereas in Case 2, the condenser was concentrated at a single location (only C1), as shown in Figure 3. The specific condenser locations corresponding to each case are summarized in Table 3. To isolate the effect of condenser location on vapor chamber thermal performance, the total condenser area was fixed at 2000 mm2 for both cases. The temperature distribution of the vapor chamber was measured using T-type thermocouples. The locations of the thermocouples on the vapor chamber surface are illustrated in Figure 3. Three thermocouples were placed in each evaporator and condenser. Also, four thermocouples were installed in the adiabatic region.
Table 3.
Location of Condensers.
4. Results and Discussion
4.1. Validation
To validate the present theoretical model, the same conditions used in Lefèvre’s model [13] were applied. Figure 4a presents a comparison of the temperature difference between Lefevre’s model and the present theoretical model. In Figure 4b,c, the black lines represent the results from Lefèvre’s model [13], while the colored lines represent the results from the present theoretical model. The condenser regions and the heat source regions are represented by black solid lines and black dotted lines, respectively. A screen mesh was selected as the wick structure. Copper and water were used as the wall material and working fluid, respectively. The locations of the heat sources and condensers are shown in Figure 4. Under these conditions, the maximum heat transfer rate predicted by the present model was 75.1 W, corresponding to an error of approximately 1.1% relative to Lefèvre’s result [13] of 76 W.
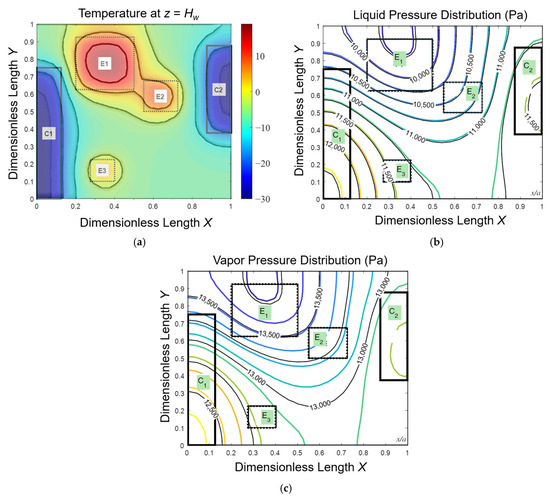
Figure 4.
Comparison of theoretical results between the Lefèvre (black) [13] and the present model (Q = 75.1 W, Tsat = 50 °C, color). (a) Temperature difference. (b) Liquid pressure distribution. (c) Vapor pressure distribution.
4.2. Comparison Between Theoretical and Experimental Results
To investigate the thermal performance under various condenser locations and heat load conditions, two representative condenser locations were considered: separated and concentrated configurations. In the separated configuration (Case 1), condensers were placed above and below the evaporator, whereas in the concentrated configuration (Case 2), the condenser was located only beneath the evaporator. Different heat load distributions were assigned to each case to reflect the corresponding condenser configurations. Specifically, Case 1 employed heat loads of 40 W, 15 W, and 15 W for E1, E2, and E3, respectively, while Case 2 employed heat loads of 20 W, 10 W, and 10 W for E1, E2, and E3, respectively. Figure 5 shows the temperature distribution of the vapor chamber for each case predicted by the proposed theoretical model. As a result, the separated configuration provides superior temperature uniformity compared to concentrated configuration. As shown in Figure 6, distributing the condensers around the heat sources produces a more uniform liquid pressure field within the wick structure. This pressure uniformity leads to a more evenly distributed liquid supply to the evaporator, allowing evaporation to occur more uniformly across the evaporator region. This uniform evaporation contributes to a more uniform temperature distribution of the vapor chamber.
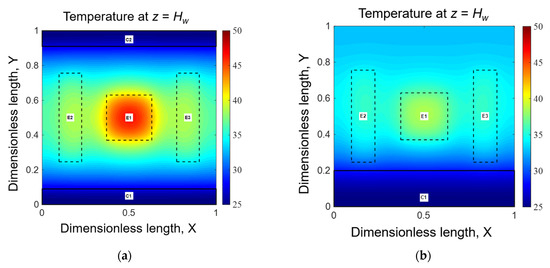
Figure 5.
Temperature distribution (a) Case 1 (E1:E2:E3 = 40 W:15 W:15 W). (b) Case 2. (E1:E2:E3 = 20 W:10 W:10 W).
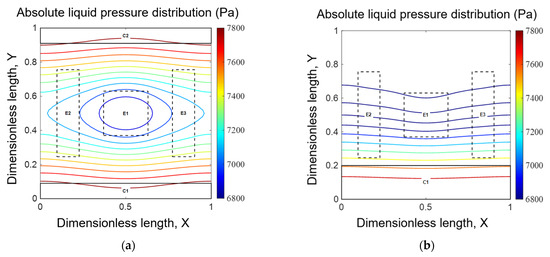
Figure 6.
Liquide pressure distribution (a) Case 1 (E1:E2:E3 = 40 W:15 W:15 W). (b) Case 2. (E1:E2:E3 = 20 W:10 W:10 W).
Figure 7 shows the maximum temperature of each evaporator obtained from the theoretical results and experimental data. In Case 1, the experimental data for E1 showed good agreement with the theoretical results. However, a temperature difference of approximately 3 °C was observed for E2 and E3. In Case 2, the corresponding temperature differences were approximately 2 °C for all evaporators. These discrepancies arise primarily because the theoretical model neglects thermal contact resistance, whereas the experimental setup inherently includes contact resistance between the vapor chamber and heaters. Moreover, the present model assumes a fully saturated wick, while in practice the liquid-filled height within the wick in the evaporator region may decrease as the heat input increases. This reduction in liquid-filled wick thickness can lower the effective thermal resistance of the evaporator section, which may contribute to slightly lower measured temperatures, as observed for E1 in Case 1. Despite these differences in absolute temperature levels, the theoretical and experimental results exhibit consistent trends with respect to condenser configuration, indicating that the proposed model is suitable for comparative evaluation of vapor chamber thermal performance under varying condenser locations.
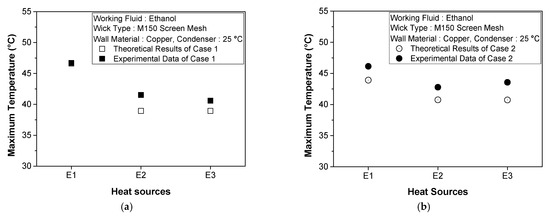
Figure 7.
Comparison of theoretical and experimental maximum evaporator temperatures. (a) Case 1. (b) Case 2.
4.3. Thermal Performance with Respect to the Aspect Ratio of Condenser Areas
As discussed in Section 4.2, the separated condenser configuration (Case 1) exhibits superior temperature uniformity compared to the concentrated condenser configuration (Case 2). Therefore, the effect of the condenser geometry on the temperature distribution and maximum heat transfer rate of the vapor chamber was theoretically examined under the separated condenser configuration. In this analysis, the condenser aspect ratio was varied under the constraints that the condenser length did not exceed the vapor chamber dimensions and did not overlap with the evaporator region, while the total condenser contact area was fixed at 2000 mm2. As shown in Figure 8, the condenser geometry was controlled by varying the aspect ratio of the condenser contact area, which is defined by
where AR, α and β are aspect ratio, width, and height of each condenser, respectively. In this section, the heat loads applied to E2 and E3 were fixed at 14 W. Figure 9 and Figure 10 show the temperature distributions and the corresponding maximum temperature differences under a constant total heat load of 64.1 W while maintaining a constant total condenser area for various condenser aspect ratios. As the condenser aspect ratio (AR) decreases, the overall temperature of the vapor chamber increases. Among the heat sources, the side evaporators (E2 and E3) exhibit a more pronounced temperature rise than the central heat source (E1), due to the reduced heat removal effectiveness associated with the decrease in condenser width as the aspect ratio decreases. This behavior is quantitatively reflected in Figure 10, where the maximum temperature difference increases as the aspect ratio decreases, indicating a degradation in temperature uniformity. Consequently, higher aspect ratios provide a more uniform temperature distribution across the evaporator region under the same heat load owing to the larger condenser coverage within the range of aspect ratios. When the aspect ratio decreases below 3.1, the maximum temperature difference remains nearly unchanged, because the variation in the condenser length in the y-direction becomes marginal with further reduction in aspect ratio.
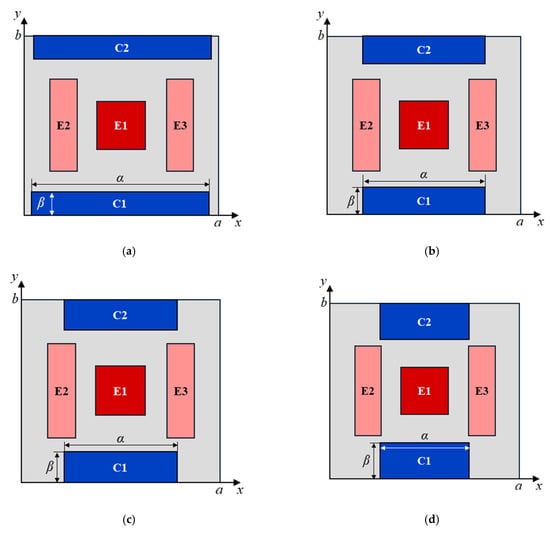
Figure 8.
Schematic views of the separated configuration for various condenser geometry (a) AR = 8.3. (b) AR = 5.0. (c) AR = 3.6. (d) AR = 2.5.
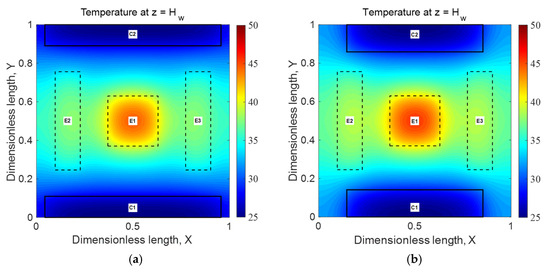
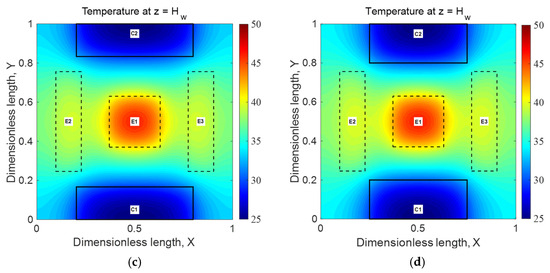
Figure 9.
Temperature distribution at a constant total heat load (Q = 64.1 W) for various condenser geometry (a) AR = 8.3. (b) AR = 5.0. (c) AR = 3.6. (d) AR = 2.5.
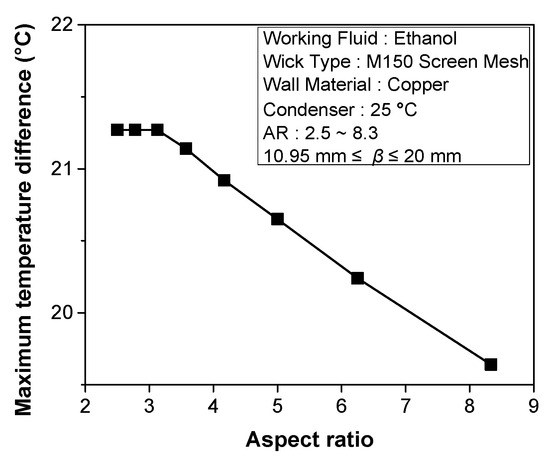
Figure 10.
Maximum Temperature difference at a constant total heat load (Q = 64.1 W) for condenser aspect ratios ranging from 2.5 to 8.3.
Figure 11 shows the maximum heat transfer rate under the capillary limit condition as function of the condenser aspect ratio for both the top and bottom condenser regions. The aspect ratio ranges from 2.5 to 8.3, while the condenser height (β) varies from 10.95 to 20 mm. The maximum heat transfer rate increases with decreasing aspect ratio. When the aspect ratio reaches 2.5, the total maximum heat transfer rate attains 72.6 W, corresponding to a 13.3% increase compared to 64.1 W obtained at an aspect ratio of 8.3. Figure 12 shows the liquid pressure distribution for various aspect ratios under a constant total heat load of 64.1 W. As the aspect ratio decreases, the distance between the condensers and the evaporators decreases, which leads to a reduction in the liquid pressure drop. This behavior arises because the effective flow path between the evaporator and condenser regions becomes shorter, thereby providing a larger capillary pressure margin before the capillary limit is reached. As a result, the vapor chamber can sustain a higher maximum heat transfer rate at lower aspect ratios. However, this enhancement in capillary-limit-based performance is accompanied by reduced temperature uniformity under the same heat load. While higher aspect ratios are more favorable for maintaining a uniform temperature distribution owing to wider condenser coverage, lower aspect ratios are advantageous for maximizing the allowable heat transfer rate. This trade-off highlights the need to balance temperature uniformity and maximum heat transfer capability when selecting the condenser aspect ratio.
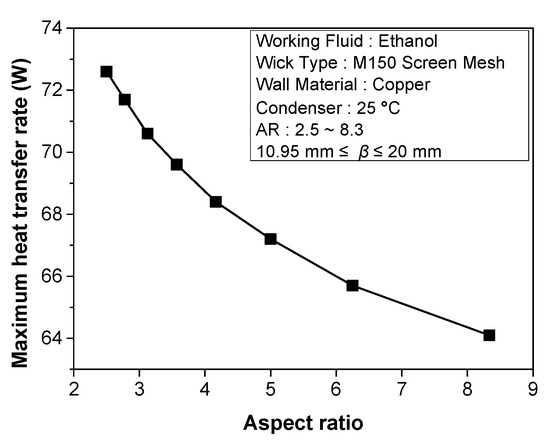
Figure 11.
Maximum heat transfer rate of the vapor chamber for various condenser geometry.
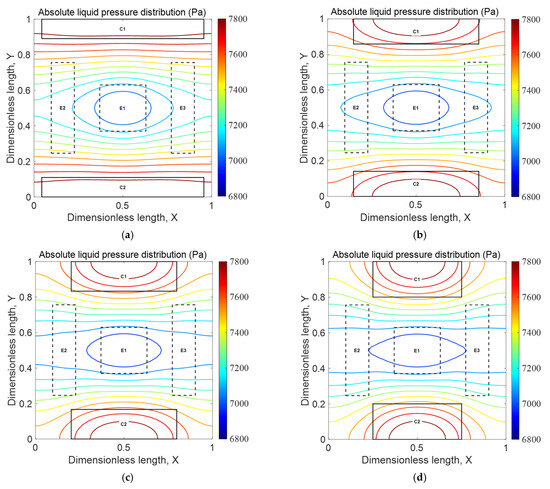
Figure 12.
Liquid pressure distribution for various condenser geometry at a constant total heat load (Q = 64.1 W) (a) AR = 8.3. (b) AR = 5.0. (c) AR = 3.6. (d) AR = 2.5.
5. Conclusions
In this study, the effects of condenser location and geometry on the thermal performance of a vapor chamber with multiple heat sources under non-uniform heat flux conditions were theoretically and experimentally investigated. A weighting factor approach was applied to represent the non-uniform heat flux distribution among multiple heat sources [11]. The proposed theoretical model was first validated by comparing the predicted maximum heat transfer rate with Lefèvre’s analytical solution [13] under identical operating conditions, showing good agreement with an error of 1.1%. The validation of the model was further conducted by comparison with the experimental results obtained for separated and concentrated condenser configurations. The separated configuration exhibited superior temperature and pressure uniformity. Also, despite temperature differences of approximately 2–3 °C among the heaters, the theoretical prediction followed the experimental results well. Using the validated theoretical model, the effects of the condenser geometry were analyzed under the separated condenser configuration by varying the condenser aspect ratio. Under the constant heat load, decreasing the aspect ratio led to higher overall wall temperatures and an increased maximum temperature difference, indicating degraded temperature uniformity. In contrast, the maximum heat transfer rate increased with decreasing aspect ratio due to a reduction in the liquid pressure drop between the evaporator and condenser regions. The maximum heat transfer rate increased from 64.1 W at an aspect ratio of 8.3 to 72.6 W at an aspect ratio of 2.5, corresponding to a 13.3% enhancement. This enhancement arises from the shortened effective liquid flow path within the wick structure, which provides a larger capillary pressure margin before reaching the capillary limit. However, the incremental gain diminished at lower aspect ratios, as further reductions in the evaporator–condenser distance became progressively smaller. It is shown that condenser placement closer to the heat sources can effectively improve the capillary-limit-based thermal performance of vapor chambers, while an appropriate balance between temperature uniformity and maximum heat transfer capability should be considered in practical design. While quantitative performance levels may differ for other working fluids or wick structures, the qualitative trends associated with condenser location and geometry identified in this study are applicable across a broad range of vapor chamber configurations governed by capillary-driven transport.
Author Contributions
Conceptualization, S.P.J.; Validation, H.S.M.; Investigation, G.B., S.Y.K., H.S.M. and M.K.; Data curation, H.S.M.; Writing—original draft, G.B. and S.Y.K.; Writing—review & editing, S.P.J.; Funding acquisition, S.P.J. All authors have read and agreed to the published version of the manuscript.
Funding
This work was supported by the Korea Research Institute for defense Technology planning and advancement (KRIT) grant funded by the Korean government (DAPA (Defense Acquisition Program Administration)) (KRIT-CT-22-022, Ultra-High-Flux Cooling System Research Laboratory, 2025).
Data Availability Statement
The original contributions presented in this study are included in the article. Further inquiries can be directed to the corresponding author.
Conflicts of Interest
The authors declare no conflicts of interest.
Abbreviations
| Nomenclature | ||
| Ae,i | evaporator area of i-th heat source | |
| AR | the aspect ratio of the condenser region | |
| a | x—direction [m] | |
| B | dimensionless variable, b/a | |
| b | y—direction [m] | |
| C | dimensionless variable, c/a | |
| Cp | specific heat, [J/kg∙K] | |
| c | z—direction [m] | |
| d | wire diameter [m] | |
| Hw | height of the wick [m] | |
| Hp | height of the porous media [m] | |
| Hv | height of the vapor space [m] | |
| h | heat transfer coefficient [W/m2·K] | |
| hlv | latent heat of vaporization [J/kg] | |
| K | permeability [m2] | |
| kw | thermal conductivity of wall [W/m∙K] | |
| keq | thermal conductivity of a screen mesh [W/m∙K] | |
| P | pressure [Pa] | |
| ΔP | pressure drop [Pa] | |
| Q | total heat input [W] | |
| qavg | average heat flux [W/m2] | |
| qi | heat flux of the i-th heat source [W/m2] | |
| reff | effective pore radius [m] | |
| T | temperature [K] | |
| T * | dimensionless temperature | |
| Tsat | saturation temperature | |
| t | time | |
| u | the velocity in the x-direction [m/s] | |
| v | the velocity in the y-direction [m/s] | |
| w | pore spacing [m] | |
| wi | weighting factor of the i-th heat source | |
| X | dimensionless variable, x/a | |
| x | coordinate | |
| Y | dimensionless variable, y/a | |
| y | coordinate | |
| Z | dimensionless variable, z/a | |
| z | coordinate | |
| Greek Symbols | ||
| γi | relative heat flux ratio assigned to the i-th heat source | |
| μ | dynamic viscosity [Pa·s] | |
| ρ | density [kg/m3] | |
| η | area ratio of the evaporator to the condenser | |
| ϕ | heat flux | |
| χi | in the i-th heat source | |
| σl | surface 120 tension [N/m] | |
| Subscripts | ||
| avg | average | |
| cap | capillary | |
| e | evaporator area | |
| g | gravity | |
| eff | effective | |
| i | i-th heat source | |
| l | liquid | |
| m | screen mesh wick | |
| p | porous medium wick | |
| sat | saturation | |
| w | wall | |
| v | vapor |
References
- Dev, K.; Mahmud, M.M.; Reza, S.M.M. CPU GPU memory DVFS for power efficient MPSoC in mobile cyber physical systems. Future Internet 2022, 14, 91. [Google Scholar] [CrossRef]
- Pedram, M.; Nazarian, S. Thermal modeling, analysis, and management in VLSI circuits: Principles and methods. Proc. IEEE 2006, 94, 1487–1501. [Google Scholar] [CrossRef]
- Cho, Y.; Kim, M.; Lee, S.; Park, H. Experimental analysis and measurement of hotspot location with thermal test vehicle in mobile SoC. In Proceedings of the 2024 23rd IEEE Intersociety Conference on Thermal and Thermomechanical Phenomena in Electronic Systems (ITherm), Aurora, CO, USA, 28–31 May 2024; pp. 1–6. [Google Scholar]
- Maranda, S.; Sponagle, B.; Worlitschek, J.; Groulx, D. Experimental investigation of thin PCM packages and thermal spreader for thermal management of portable electronic devices. Int. Commun. Heat Mass Transf. 2021, 9, 4613. [Google Scholar] [CrossRef]
- Rostamian, F.; Etesami, N.; Haghgoo, M. Management of electronic board temperature using heat sink containing pure and microencapsulated phase change materials. Int. Commun. Heat Mass Transf. 2021, 126, 105407. [Google Scholar] [CrossRef]
- Hosseini Rad, E.; Nikkhah, V.; Ahmadi, G.; Safaei, M.R. Experimental investigation on the heat transfer characteristics of diamond microchannel heat sink for multi point heat source cooling. Energies 2022, 15, 5315. [Google Scholar]
- Kuiphuis, D.J.G.; Terpstra, M.J.; Wits, W.W.; Rohlfs, W. Thermal hydrodynamic modeling and design for microchannel cold plates subjected to multiple heat sources. Appl. Therm. Eng. 2025, 262, 125220. [Google Scholar] [CrossRef]
- Bianco, V.; De Rosa, M.; Vafai, K. Phase-change materials for thermal management of electronic devices. Appl. Therm. Eng. 2022, 214, 118839. [Google Scholar] [CrossRef]
- Radouane, N.; Hasan, A.; Kherbeet, A.S.; Al-Sulaiman, F.A. A comprehensive review of composite phase change materials (cPCMs) for thermal management applications. Energies 2022, 15, 8271. [Google Scholar] [CrossRef]
- Dan, D.; Li, W.; Zhang, Y.; Xie, Y. A quasi-dynamic model and thermal analysis for vapor chambers with multiple heat sources based on thermal resistance network model. Case Stud. Therm. Eng. 2022, 35, 102110. [Google Scholar] [CrossRef]
- Kim, S.H.; Kang, S.Y.; Park, S.J.; Jang, S.P. Comparison of the maximum heat transfer rate of thin vapor chambers with different wicks under multiple heat sources and sinks. Energies 2024, 17, 3330. [Google Scholar] [CrossRef]
- Zhou, J.; Zhan, D.; Qian, J.; Wei, T. Experimental investigation on the thermal performance of a large-size aluminum vapor chamber for multi-point heat sources. J. Therm. Sci. Eng. Appl. 2024, 16, 111009. [Google Scholar] [CrossRef]
- Lefèvre, F.; Lallemand, M. Coupled thermal and hydrodynamic models of flat micro heat pipes for the cooling of multiple electronic components. Int. J. Heat Mass Transf. 2006, 49, 1375–1383. [Google Scholar] [CrossRef]
- Li, C.; Peterson, G.P. The effective thermal conductivity of wire screen. Int. J. Heat Mass Transf. 2006, 49, 4095–4105. [Google Scholar] [CrossRef]


Disclaimer/Publisher’s Note: The statements, opinions and data contained in all publications are solely those of the individual author(s) and contributor(s) and not of MDPI and/or the editor(s). MDPI and/or the editor(s) disclaim responsibility for any injury to people or property resulting from any ideas, methods, instructions or products referred to in the content. |
© 2026 by the authors. Licensee MDPI, Basel, Switzerland. This article is an open access article distributed under the terms and conditions of the Creative Commons Attribution (CC BY) license.