Abstract
This paper discusses the economic factors that affect and, hence, must be investigated for the subsequent stage of onshore power supply (OPS) (or cold ironing) applications. In order to be considered a viable alternative to the conventional but pollutant marine gas oil, the cost of electricity must be favorable when determining the optimal choice for vessels at the time of mooring. The financial burden of onshore power supply encompasses the expenses associated with its production, distribution, and the enhancement of port grids. Further research must be conducted on the potential for alternative approaches to recapture the authorized revenue for the DSO, along with the parameters that govern vessel types and the dimensions of ports equipped with operational cold ironing mechanisms.
1. Introduction
In alignment with international and European directives, regulations mandate reducing GHG emissions by 2030 and 2050. Fit-for-55 and TEN-T specifications include necessary measures to diminish the carbon footprint on ports [1]. European Union’s measures have been considered as the perfect pilot example to showcase IMO’s global policy on green shipping towards climate neutrality target [2]. Thus, Fit-for-55 and TEN-T specifications of the European Commission, comprising the necessary measures to diminish the carbon footprint on ports [1], consist of the ultimate reference case study to perform extensive investigation via detailed studies analyzing alternative scenarios of operation and their impact. Specifically, until 2030, core EU ports are required to incorporate specific equipment to rely on electricity from the grid. This process is referred to as ‘cold ironing,’ which effectively substitutes electric power usage while minimizing air pollution [3,4,5,6]. Additionally, the successful adoption of renewable energy sources (RES) plays a critical role in mitigating CO2 emissions, albeit at a cost to other resources.
Onshore power supply (OPS) or cold ironing is a global project which involves many different parts such as port authorities, shipowners, electricity producers, and government agencies [7,8,9,10,11]. This process must be investigated both in terms of technical efficiency and also economic sustainability [12,13,14,15]. The electricity market must be competitive against the pollutant fossil fuel oil to ensure equitable benefits among all stakeholders. Furthermore, the allocation of roles within the energy market needs to be thoroughly discussed. The port-as-virtual-power-plant model posits that all parties must assume a pivotal role in the production and consumption of energy. Renewable energy sources (RES) have the potential to enhance port operations by leveraging the port’s geographical advantage for green energy production. Except for cold ironing, electrification encompasses other procedures like maintenance, transportation of goods by cranes, hydrogen production in nearby areas [16]. In addition, ports serving as energy hubs can provide electricity to nearby regions and contribute directly to the grid power distribution.
As stipulated within the EU Emissions Trading Scheme (ETS) Maritime Directive [17], a financial liability must be assigned to emissions from large vessels, accounting for 100% of their carbon dioxide (CO2) production, effective from the year 2026. This regulation affects passenger ships, including RoPax, RoRo, cruise ships, and container ships which have gross tonnage 5000 gross tonnage or above. In addition, the following ports must also be able to provide source side electricity in order to reduce carbon footprint. More specifically, ports that have at least 50 calls from passenger vessels (of all types except cruise ships) above 100 port calls from container ships and at least 25 port calls from cruise ships must follow the regulation.
The primary objective of this paper is to assess the economic transition of ports through electrification processes within this realm of decarbonation. Within this context, next, the critical parameters affecting the maritime electricity market are formed via the implementation of OPS, analyzed, discussed, and their impact is investigated. It is stressed again that the European case study has been selected as a most representative example to showcase the emerging strong correlation between the Energy and Maritime Transport sectors that needs to be thoroughly studied.
2. Total Cost of Electricity
In the context of the electricity market, the aggregate cost for consumers, such as the ship owner, comprises a combination of distinct values, including the expense incurred by the producer and the cost of transmission and distribution networks. In addition, the financial implications of tariffs, port charges, and municipal taxes must be considered. A comprehensive investigation into all components of the total amount is imperative to reduce the overall cost of the supplied energy and enhance the competitiveness of the electricity market in relation to the fuel market and other alternatives. Firstly, the entity responsible for the generation of electricity is remunerated based on the quantity of energy that is utilized. The aforementioned cost is calculated in euros for each megawatt-hour (MWh) of electricity purchased from a supplier by the consumer. Secondly, Transmission System Operator (TSO) and Distribution System Operator (DSO) are responsible for the billing of the total installed power that has been contracted with the consumer. It is imperative that the total demand of the consumer does not exceed the peak demand stipulated in the contract period. Furthermore, the quantity is multiplied by the energy consumed in megawatt-hours (MWh). The operator must determine whether the percentage of total cost will be allocated to the installed power demand in MW or to the energy in MWh. In the context of high peak demands in ports, it is imperative to consider the installed power cost as a crucial factor in addition to the total magnitude of energy flow. This approach ensures a more realistic assessment of the situation.
A Power Purchase Agreement (PPA) is a bilateral contract between a generator and an electricity supplier or a large consumer. The purpose of the PPA is to enhance the liquidity of the forward market. The establishment of an agreement between the two parties is instrumental in ensuring a stable and predictable price of electricity, thereby safeguarding the supply of essential energy requirements. It is imperative that these agreements address the volatility of electricity prices, which are influenced by a multitude of factors. These include the dynamic shifts in renewable energy generation, fluctuations in energy market parameters related to supply and demand, and other variables.
Pursuant to the conditions precedent, a Contract for Difference (CFD) can engender a mutually beneficial scenario for all parties involved, provided that a Contract for Difference is also included in the agreement. The regulatory authority or the government is an external observer of the economic transaction. Specifically, a predetermined price, designated as C, is established through a contractual agreement between the electricity generator and its consumers. In the event that the stipulated price is determined to be less than the production cost price, P, the supplier will incur a loss. This loss can be indemnified by the CfD. On the other hand, in the event that the stipulated price exceeds the cost of generation, the supplier is obligated to compensate the common fund for the excess. Another application of CfD involves utilizing the energy market price as a benchmark for evaluating the fixed price. The energy producer, predominantly engaged in green production, implemented a fixed pricing strategy. In the event that the market price is lower than the agreed amount, the producer is entitled to a refund from the consumer. Conversely, if the market price exceeds the agreed amount, the producer incurs a financial obligation. It is imperative to consider the potential implications of the European common price policy on alterations to maritime schedules. This is due to the discrepancy in electricity pricing between interconnected ships from multiple countries.
In the recent paper [9], the authors examine different scenarios of electricity pricing. They proposed a PPA between the supplier and the consumer. The final price for each MWh is equivalent to the hypothetical price of fuel use scenario. A cost–benefit analysis of distribution network fees, incorporating considerations of both energy supply loss and revenue, has been conducted to assess the financial implications. The dynamic pricing strategy employed by the operator has been shown to be advantageous for all involved parties. It is important to note that the CfD has also been proposed as a method for mitigating the risks associated with long-term price agreements for both parties.
2.1. Distribution System Operator Cost
2.1.1. Weighted Average Cost of Capital
The WACC is a metric employed to assess the cost of capital investments utilized for financing the distribution network operator. It functions as a stock market indicator of the return on investment, before tax, on the regulated asset base. For that reason, it is a significant factor for new investments of the operator. The calculation of the weighted average cost of capital (WACC) is performed using the following Formula (1) [18]:
The gear ratio, denoted by g, ranges from 45 to 60%. This parameter is influenced by the ratio of debt capital to regular capital, and thus may fluctuate based on that ratio. The cost of distributing capital rd is determined by the return on investments of foreign capital in a zero-risk scenario, along with lending risk. The parameter re is the cost of equity after taxes. Parameter t is a tax on the company to compensate for its benefits.
A considerable number of DSO and TSO worldwide employ the WACC formula to calculate their annual revenue [19]. The nominal value of the weighted average cost of capital differs from its real value, which is estimated by the inflation rate. Additionally, a discrepancy in valuation metrics has been observed among DSO’s when appraising recent investments as opposed to more dated ones. According to the survey, the average nominal WACC for EU countries was established at 5.48% for the year 2024, while the real value was determined to be 4.17% [20].
The implementation of cold ironing necessitates the modernization of distribution energy systems within port facilities. As has been previously documented, the energy requirements of ports are notably elevated. It is imperative that investments be executed by the distribution operator to ensure the capacity of the grid to manage power peak demands. The distribution operator’s responsibilities include implementing cabling, wiring, new substations, and transformers.
2.1.2. New Investments Cost Analysis
The total cost of the equipment, inclusive of labor expenses, must be remitted within years of construction and prior to the first year of operation. The total capital expenditure (CAPEX) is allocated to annual costs, which are disbursed in percentages until the initial year of operation. Until the first year of operation, the value of the regulated asset base (RAB) increases annually by the amount corresponding to the value of the capital employed in the Works in Progress (WIP). Specifically, the Work In Progress capital represents the invested capital that has already been integrated into the asset base of the company. The Regulated Asset Base for grid upgrades in the initial operating year is equivalent to the total capital expenditure minus the annual depreciation value of the total capital expenditure. Furthermore, the annual depreciation value must be calculated as the total cost of investment divided by the total years of useful life. The equation for this calculation of regulated asset base is presented below (2) and (3). The annual amortization of equipment is determined by calculating the weighted average of the useful life of the asset and the residual value.
In addition, the annual financial obligations associated with this investment, which are referred to as operational expenditures (OPEX), encompass not only the cost of equipment maintenance, but also the expenses related to labor. The nondepreciated value is then multiplied by the weighted average cost of capital factor to calculate Required Annual Revenue. This value represents the annual income flows, with the exclusion of OPEX costs. It is important to note that these costs do not undergo multiplication by the WACC factor. In addition, annual costs encompass the annualized cost of investment for the initial years of construction and the OPEX for the operational years. Residual value is defined as the total nondepreciated value of equipment in the year of interest.
2.2. Energy Markets
In the many energy markets around the world, the price of energy is determined by the energy exchange. In EU electricity exchange markets it is primarily mandated by the Commission Regulation (EU) 2015/1222 [21]. Two models of dynamic pricing of electricity are presented for the participants of the energy market [22]. In the day-ahead market, customers and producers establish relationships to ensure the procurement of energy for the subsequent day. All participants are required to disclose their respective electricity prices in anticipation of day D, thereby enabling the requisite transparency for the collective body. Additionally, it is imperative to note that all financial agreements must be concluded prior to day D-1. The calculation of the system marginal price is contingent upon the submission of energy offers and demands, as well as the price for each MW, by the relevant stakeholders, suppliers, and buyers. The System Marginal Price (€/kWh) signifies the cost of the final MW that will be available in the market.
Within the Intraday Market, energy transactions are executed within the same day. In such market contexts, the exchange of energy during the day (D) serves to mitigate the discrepancies that emerge within the day-ahead market. It has the capacity to satisfy the requirements of producers who have an excess of energy, such as during periods of particularly high sunlight intensity. Conversely, it can also address the needs of clients with elevated demand. In the event of a day of abundant sunlight, the manufacturing of solar panels may result in a surplus of energy demand. The producer has calculated that it will be able to supply this excess energy to its customers. Concurrently, it is possible that another producer will purchase these additional units of energy at a more favorable price point, thereby satisfying its own requirements.
The Imbalance Settlement of the Balancing Market is a meticulous procedure for resolving discrepancies. Specifically, the TSO is accountable for the balancing of energy flows to ensure the stability of the system. In the event that a producer experiences an inability to fulfill their contractual obligations due to a failure of the production facilities, the energy in question must be addressed within the framework of the market for balancing. The aforementioned producer has the option of procuring incomplete energy from Intraday production. In the event that the producer elects not to do so, it is the responsibility of TSO to cover the energy deficit, and the producer is obligated to pay the cost of the balancing procedures. Additionally, TSO assumes responsibility for the resale of energy in excess of that consumed by a buyer. It is imperative to recognize that an excess of energy that must be curtailed from the system’s flow balance incurs significantly higher costs compared to a deficiency that a producer is unable to address.
3. Different Approaches of Shore-Side Grid Operation
A port may be regarded as a distribution network that is responsible for the organization of the supply of electricity to the mainland. In this manner, the objective of achieving efficiency and capability in meeting energy demands is accomplished, whilst avoiding the involvement of DSO with consumers. In one scenario, the port exerts control over the exchange of energy, yet does not engage in the energy market. A particular nexus exists between the DSO and the closed distribution network, wherein energy supplied by suppliers is utilized to meet 100% of the energy demands associated with ship operations and port functionality. The port is responsible for the operation of the cables and transformers, which facilitate the transmission of electricity from the grid to the shore-side connection.
In alternative scenarios, ports with a substantial area of land under their ownership have the capacity to establish energy production facilities. These facilities would be capable of meeting the energy requirements of the closed distribution network. Moreover, the comprehensive literature on the subject of establishing ports and ships as microgrids has been reviewed. In such a scenario, port authorities, electricity producers, and ships could also be considered consumers and suppliers of electricity. As proposed in recent studies, the ability of ships to provide electricity to the port could potentially serve as a stabilizing factor in the grid while the ship is at port.
Within the port of Marseilles, two maritime companies have established a presence, operating four of OPS units within the terminal. The port authority has entered into a Power Purchase Agreement with the national energy company, which is responsible for the provision of all consumed energy. Additionally, port resells the purchased energy to ship companies at a pre-agreed price ceiling [16]. The port has also been equipped with photovoltaic panels with the purpose of generating electricity autonomously on the mainland, with an estimated capacity of up to 9 MWp.
4. Case Study
The subsequent case study will examine the economic parameters of the installation and operation of OPS systems. The two fundamental parameters that are taken into account are the total energy demand and the power peak demand for the port grid. The parameters in consideration are determined by the following factors: (a) the type of ship, (b) the ship’s schedule, (c) its gross tonnage. The total cost of electricity is determined by the following variables: (a) the total cost of the OPS installation (CAPEX) and the operation cost (OPEX), (b) the weighted average cost of capital (WACC) factor, (c) a fixed price for the producer, (d) the cost of tariffs for the distribution operator. The final component is determined as a percentage of energy flow and peak demand.
The present case study utilizes a singular strategy for the purpose of examining the project’s economic viability. A decade-long analysis of a port characterized by specific attributes has been conducted. First of all, the data under consideration are from RoPax vessels, and the energy demands are calculated through the utilization of empirical formulas derived from their gross tonnage. Secondly, the DSO has been designated as the authority responsible for conducting the investigation and overseeing the operation of the OPS. The strategy for calculating cost recovery is determined by the methodology that employs the weighted average cost of capital (WACC) factor. Thirdly, the investigation’s financial implications are addressed in the following manner. Initially, a 100% of the cost is allocated to energy flow of vessels over the first five years. Subsequently, 80% of the cost is allocated to energy flow and 20% to peak demand over the subsequent five years. Finally, a sensitivity analysis is conducted to ascertain the impact of fluctuations in the rate of basic parameters on the total cost of electricity.
In accordance with the provisions stipulated in the EU-ETS Maritime legislation, all RoPax vessels with a gross tonnage exceeding 5000 GT and requiring a duration of two hours or more for berthing are obligated to be connected to the shore-side supply infrastructure. The implementation of the aforementioned legislation is mandatory in ports that receive a minimum of 50 calls per year. In this case, the port was selected as a medium-scale exemplar of an island port with regular RoPax calls in the Mediterranean Sea. The data was made available during the designated schedules that were accessible to passengers utilizing the vessel. The facility is characterized by a year-round operational schedule, with a maximum of two berthed vessels present concurrently. It is imperative that the vessels under investigation adhere to the established legislation.
It is worth noting that this is the earliest instance in the bibliography that the cost of electricity from the port side is addressed and studied. The cost of electricity is subject to variation due to numerous factors, including the manner in which the Distribution System Operator (DSO) generates revenue, the method of electricity production, and the connection of the port to the main national grid, as well as the numerous islands that have not yet established such connections. Moreover, the unique attributes of each vessel category dictate high demands on the energy flow during berthing. Furthermore, the port of this case study is a medium-sized island port, with a maximum hosting capacity of two vessels moored simultaneously.
A further and comprehensive investigation is to be undertaken into larger ports that feature a multitude of schedules and a variety of vessel types that arrive concurrently. In such cases, priorities to the energy flows within the berthing schedule must be introduced in order to address the maximum energy demand from the port grid [23]. For instance, certain tasks associated with containerships may be executed concurrently with the majority of RoPax vessels, naturally, in accordance with the stipulated time schedule for each maritime activity.
The ship characteristics and their power demands are represented in Table 1. Having the schedule for 8760 h of the year, the total annual power needed from the port was calculated to 8328.66 MWh annually. For the purpose of determining the average peak demand, the EMER/EAA guidebook’s formulas were utilized as a reference point, with the gross tonnage of each ship serving as the primary data point [24]. The maximum number of vessels that are docked at the same time is two. The peak value for the OPS power supply was found equal to 4 MW. This peak value is needed for only 24 h while two ships together when berthing are 1203 h per year.

Table 1.
Ship characteristics. Vessels visiting the port.
The duration of simultaneous berthing as well as the peak power demand on an annual basis is subject to future investigative efforts. It is crucial to assess the extent to which the arrival of the scheduled ship one to two hours ahead or behind its scheduled arrival time would contribute to a reduction in peak power demand and, by extension, in total CAPEX. The needed peak power demand per time is given in Figure 1. In addition, the consumption of each ship per month of the year is presented in Figure 2. As it can be seen, there are more schedules during summer months, while the calls of the rest of the year are more often. In addition, the peak values of the power demand are noted seven times between July and August. During summer months, the schedules are made for two vessels (ship A and ship H) that have the specific port as the daily stop of their route. The other ships typically visit this port for specific routes in other months in a lower frequency.
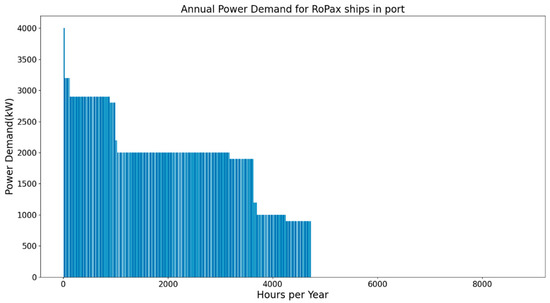
Figure 1.
Port grid load duration curve. The blue bar is a representation of the maximum power demand necessary for the annual operation hours.
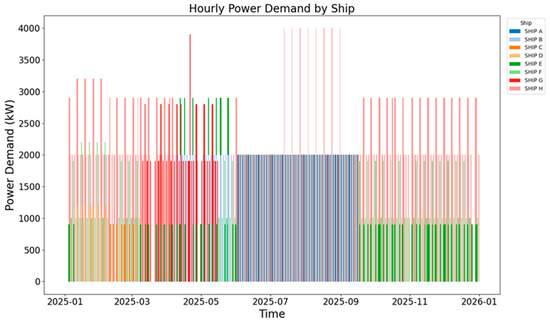
Figure 2.
Electricity demand curve.
The total cost of installing the OPS system and upgrading the network is estimated to be approximately 6 million €. The total investigation will be financed by DSO for the purposes of this analysis. The remaining expenses will be covered by state funding. It is estimated that the annual revenue permitted for the DSO in the initial year will amount to 0.41 million €, with an expected value of 0.36 million € by the tenth operational year. This cost encompasses the maintenance of the system. It has been demonstrated that the annual revenue is declining during the operational years, attributable to the reduction in the regulated asset base of the grid. In this manner, the aggregate expenditures of the shipowners on the grip operator are diminished over time.
The DSO will cover the allowed revenue by costing A €/MW and B €/MWh. The DSO will calculate its total income for the operation of the system by employing the following Equation (4):
where TP is the total agreed power demand of each vessel and TE is the total energy consumed.
The parameters A and B are determined by the fixed percentages of the total allowed income that the DSO will choose. The total agreed power demand is the sum of all the invested vessels berthing at port. The total energy consumed is the sum of the supplied energy to each vessel.
The case study under consideration has entailed an analysis of a 10-year operation. In the initial five years of the operation under consideration, the grid operator incurs costs exclusively for the total energy supplied from the grid. Consequently, the parameter A is considered to be equal to zero. Over the course of the past 5 years, the DSO has obtained 80% of the allowable revenue income from energy consumption. The remaining 20% is derived from the agreed-upon peak demand for each vessel.
The cost of electricity supply from the producer is taken to be €105 per megawatt hour. This price was the weighted average market price for the year 2024 in the energy market within the specified country where the port is located. It is hypothesized that this cost will decrease at a rate of 2% per year due to the significant increase in renewable energy sources (RES) in the energy mix.
The cost of electricity must be compared to the business-as-usual scenario, in which vessels use MGO as main fuel for auxiliary engines to produce their operational energy while on port. The price of the MGO is determined by two factors. The first one is the actual value of the fuel per ton on the market. This value has to be converted in means of cost per energy produced (€/MWh) in order to be compared with electricity price. The value in this case study is taken as 115 (€/MWh), as it is proposed in the DNV survey [14]. The second parameter is the emission cost policy, which upgrades annually the total cost for traditional energy production. In this paper, emission cost upgrades for 5% of every year of operation. Cold ironing seems to be the more attractive choice as the emission costs make MGO energy production more expensive.
The critical parameters of peak power of vessels, number of calls, and berthing time at port affect the total cost for the supply of electricity. For the first years of the case study, all vessels are charged for time of berthing. That way, vessels that are using the system for less calls have benefits. After the fifth year of operation, ships with high energy demands and peak value seem to be the most benefited as their annual cost decreases.
The data for select years is presented hereafter. Table 2, Table 3 and Table 4 provide the calculations of the parameters for the first, sixth, and tenth years of operation. As demonstrated, during the initial year of operation, the fees for the grid are calculated exclusively based on energy consumption (see Table 2). The financial outlay required for the grid investment is approximately half of the cost incurred by the producer of energy for each vessel. The price is commensurate with the total energy supplied by the shore supply. Consequently, vessels with lower frequencies are not subjected to excessive charges, and their participation in the payment process is equitable. The business-as-usual scenario is less expensive because it is assumed that the price of CO2 emissions will gradually increase over the course of the operation years. In the sixth year of operation, vessels are subject to charges that reflect both peak demand and energy consumption (see Table 3). It appears that the Ship H, which exhibits minor alterations in its schedule and energy demand relative to the 1-year baseline, has experienced the most favorable outcomes with respect to the fee price change. In addition, the use of cold ironing cases has been demonstrated to be a cost-effective measure, contributing to a reduction in the overall expenditure. In conclusion, the 10th year of operation is characterized by a decline in the total cost of electricity, both in terms of grid and producer price costs (see Table 4). It has been determined that vessel E has experienced a financial advantage over the period under consideration. This is due to the fact that, despite exhibiting a comparable energy consumption, the cost to the grid has been reduced. This phenomenon is attributable to the vessel’s low peak demand capacity.
Table 2.
Calculated results of case study. First operational year of OPS.
Table 3.
Calculated results of case study. Sixth operational year of OPS.
Table 4.
Calculated results of case study. Tenth operational year of OPS.
In Figure 3, a comparison is presented between two distinct methods for generating electricity for operational purposes of the vessels. In the first years of the examination, marine gas oil (MGO) price is yet to exceed the total price for electricity from the grid. Progressively, the price of MGO is to undergo an increase, attributable to the imposition of emission fees. On the contrary, electricity is to become more economical due to a decrease in grid fees and the most favorable pricing of electricity production.
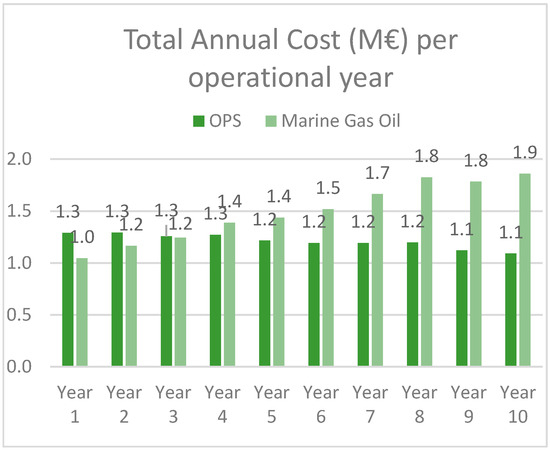
Figure 3.
Cost–benefit results for medium port.
The present study incorporates a sensitivity analysis of parameters impacting the total annual cost. The parameters of CAPEX of the installation, the WACC ratio, as well as the electricity price of the producer, had undergone a 20% increase or decrease. It has been demonstrated that the aforementioned parameters exert an influence on the OPS total cost analysis, given that all cost loss or benefit is paid by the shipowners. The ensuing Table 5, Table 6 and Table 7 present the aggregate maximum and minimum costs incurred during the initial, sixth, and tenth operational years, as determined by sensitivity analysis. Furthermore, Figure 4, Figure 5 and Figure 6 illustrate the variations in the annual price for the same years.
Table 5.
First year of operation: Minimum and maximum values, and the impact on annual cost.
Table 6.
Sixth year of operation: Minimum and maximum values, and the impact on annual cost.
Table 7.
Tenth year of operation: Minimum and maximum values, and the impact on annual cost.
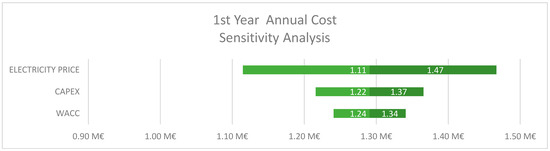
Figure 4.
First year of operation: total annual costs fluctuation due to 20% change in critical parameters. As shown in the color scale, light green indicates an overall decrease in price, while deep green signifies an increase.
Figure 5.
Sixth year of operation: total annual costs fluctuation due to 20% change in critical parameters. As shown in the color scale, light green indicates an overall decrease in price, while deep green signifies an increase.
Figure 6.
Tenth year of operation: total annual costs fluctuation due to 20% change in critical parameters. As shown in the color scale, light green indicates an overall decrease in price, while deep green signifies an increase.
Fluctuations in critical parameters may have a significant impact on the evolution in economic terms. The findings of the analysis demonstrated a moderate sensitivity of 5.95% at the last operational year (see Table 7) in terms of the increase or decrease in total annual costs for a 20% change in CAPEX. In addition, elevated sensitivity manifested as price variations from the producer, as demonstrated by the energy flux of each vessel. A 13.65% change in the total cost may be associated with fluctuations in the price of electricity (see Table 5). On the other hand, the variability in the WACC appeared to demonstrate a medium degree of sensitivity, with an observed value of 4.05% (see Table 5).
As demonstrated, there is an analogous alteration in the aggregate annual expense in accordance with the fluctuation in the cost of electricity. Furthermore, an increase or decrease in capital expenditure exerts a moderate influence on the aggregate annual cost of all vessels. It can be discerned that the alterations in the weighted average cost of capital persist within a moderate range over the course of the operation.
5. Discussion of Results
As it is underlined above, the case study focuses on a 10-year operational model of installation of cold ironing operated by distribution network. That is a representative period for taking into account the price changes in business-as-usual mgo diesel which is going to take higher values including emission costs. In addition, electricity prices are decreasing because of the higher rate of RES production in the energy mix.
The case study proved the following:
- (A)
- The methodology employed by the DSO to calculate the revenue of the installation exerts a significant influence on the costs incurred by each shipowner. The findings of the study indicated that when the energy consumed was calculated in MWh, it was demonstrated that all vessels exhibited equivalent loss or benefit rates in comparison with the business-as-usual scenario. This is the reason why the revenue is only altered by energy flow during the initial year of operation. In contrast, when peak value is taken into consideration, vessels with a higher number of port calls exhibit a greater advantage over those with a lower number of port calls over the course of the year. Furthermore, vessels exhibiting lower peak demand experience a positive impact from power charging.
- (B)
- It was demonstrated by the sensitivity analysis that fluctuations in basic parameters have a significant impact on economic analysis. Firstly, the most significant impact is that of the alteration in electricity prices for producers. It has been demonstrated that this particular parameter exerts a substantial influence on the total cost of electricity, given its status as the most substantial component of that value. Secondly, variations in the weighted average cost of capital (WACC) exert a moderate influence on the aggregate electricity price. Furthermore, fluctuations in capital expenditures (CAPEX) exert a modest influence on the aggregate electricity price. This issue must be explored in greater depth in the context of the various port schedules, as prioritizing the energy requirements of vessels has the potential to reduce peak loads and, consequently, the overall investigation expenses.
The transition to cold ironing was found to be economically viable for all stakeholders when compared to the “business as usual” scenario. Emissions tariffs have been shown to play a controversial role in promoting the financial benefits of green alternatives for shipowners.
Although the European Union case has been selected in terms of assumptions, costs, and timelines as the most appropriate example to the general plan of IMO’s global policy towards climate neutrality by the maritime sector, the methodology of the analysis investigating the impact of several parameters during operation of OPS systems can be extended in other case studies all over the world
Moreover, the aforementioned conclusive remarks could be further extended in future work covering maritime electrically related transactions such as the following:
- ➢
- Incorporating financial entities like dedicated funds or enterprises into spot electricity market with renewable energy via holistic risk-aware bilevel optimization approaches;
- ➢
- Implementing this energy market approach in most novel schemes onboard commercial marine vessels comprising Microgrid-Based Power Systems with Hybrid Propulsion system.
6. Conclusions
The present paper analyzes the challenges associated with the operation of onshore power supply systems and the coverage of electricity demands within port infrastructure. Typical European cases studies have been considered, as Europe has been the forerunner and driving force of implementing the global IMO’s policy towards climate neutrality by 2050 via sustainable green shipping methods like the fast-track implementation of onshore power supply by 2030. It has been demonstrated that the optimization of ship energy flow scheduling can effectively mitigate the challenges posed by high peak demands. Furthermore, the publication initiated a discourse concerning the revenue generation of the Distribution System Operator, who is the primary entity responsible for the onshore power supply, as evidenced in this case study. The selected approach has been shown to yield benefits. Primarily, the fees are based exclusively on electricity, and the pricing strategy incorporates demand for energy. Over the course of several years, the strategy takes into consideration power peaks. In subsequent studies, it is imperative to consider a more comprehensive economic perspective, encompassing a diverse array of port and vessel types. Further investigation is necessary to determine how these parameters change for the presence of different types of vessels at various port sizes.
Author Contributions
Conceptualization, E.F. and J.P.; methodology, E.F., J.P. and A.M.; software, E.F.; validation, E.F., J.P. and A.M.; formal analysis, E.F.; investigation, E.F.; resources, E.F.; data curation, E.F.; writing—original draft preparation, E.F.; writing—review and editing, E.F., J.P. and A.M.; visualization, E.F.; supervision, J.P.; project administration, J.P. and A.M.; funding acquisition, J.P. All authors have read and agreed to the published version of the manuscript.
Funding
This research received no external funding.
Data Availability Statement
No new data were created or analyzed in this study. Data sharing is not applicable to this article.
Conflicts of Interest
The authors declare no conflict of interest.
References
- European Union. Regulation (EU) 2023/1805 of the European Parliament and of the Council of 13 September 2023 on the use of renewable and low-carbon fuels in maritime transport, and amending Directive 2009/16/EC. OJL 2023, 234, 48–100. [Google Scholar]
- International Maritime Organization (IMO); Marine Environment Protection Committee (MEPC 83). Circular Letter No.5005—Draft Revised Marpol Annex Vi; International Maritime Organization (IMO): London, UK, 2025. [Google Scholar]
- European Maritime Safety Agency (EMSA). Shore-Side Electricity Guidance to Port Authorities and Administrations; European Maritime Safety Agency (EMSA): Lisbon, Portugal, 2022. [Google Scholar]
- Mehammer, E.B.; Mjelde, A.; Sverud, T. Status for Onshore Power Supply in Selected EU Ports; 4100—DNV AS, Norway Maritime 101222—Environment Advisory: Bærum, Norway, 2024. [Google Scholar]
- Skjong, E.; Volden, R.; Rødskar, E.; Molinas, M.; Johansen, T.; Cunningham, J. Past, Present, and Future Challenges of the Marine Vessel’s Electrical Power System. IEEE Trans. Transp. Electrif. 2016, 2, 522–537. [Google Scholar] [CrossRef]
- Schenk, E.; Carr, E.; Corbett, J.J.; Winebrake, J.J. Macroeconomic and Environmental Impacts of Port Electrification: Four Port Case Studies; Maritime Administration; U.S. Department of Transportation: Washington, DC, USA, 2020. [Google Scholar]
- Prousalidis, J.; Kanellos, F.; Lyridis, D.; Dallas, S.; Spathis, D.; Georgiou, V.; Mitrou, P. Optimizing the operation of port energy systems. In Proceedings of the 2019 IEEE International Conference on Environment and Electrical Engineering and 2019 IEEE Industrial and Commercial Power Systems Europe (EEEIC/I&CPS Europe), Genova, Italy, 11–14 June 2019; pp. 1–6. [Google Scholar]
- D’Agostino, F.; Schiapparelli, G.P.; Dallas, S.; Spathis, D.; Georgiou, V.; Prousalidis, J. On Estimating the Port Power Demands for Cold Ironing Applications. In Proceedings of the 2021 IEEE Electric Ship Technologies Symposium (ESTS), Arlington, VA, USA, 3–6 August 2021; pp. 1–5. [Google Scholar] [CrossRef]
- Manos, A.; Lyridis, D.; Prousalidis, J. Establishing a Framework of the Open Maritime Electric Energy Market. Energies 2023, 16, 5276. [Google Scholar] [CrossRef]
- Manos, A.; Lyridis, D.; Prousalidis, J. The Maritime Sector in the electric Energy Markets. In Proceedings of the 2023 IEEE International Conference on Electrical Systems for Aircraft, Railway, Ship Propulsion and Road Vehicles & International Transportation Electrification Conference (ESARS-ITEC), Venice, Italy, 28–31 March 2023. [Google Scholar]
- Manos, A.; Lyridis, D.; Prousalidis, J.; Sofras, E. Investigating the Operation of an LNG Carrier as a Floating Power Generating Plant (FPGP). J. Mar. Sci. Eng. 2023, 11, 1749. [Google Scholar] [CrossRef]
- Ghimire, P.; Park, D.; Zadeh, M.; Thorstensen, J.; Pedersen, E. Shipboard Electric Power Conversion: System Architecture, Applications, Control, and Challenges [Technology Leaders]. IEEE Electrif. Mag. 2019, 7, 6–20. [Google Scholar] [CrossRef]
- IEC/ISO/IEEE. 80005-1:2019+A1:2022; Utility Connections in Port—Part 1: High Voltage Shore Connection (HVSC) Systems—General Requirements. IEC/ISO/IEEE: Geneva, Switzerland, 2019; pp. 1–76.
- IEC/ISO/IEEE. 80005-1:2012; Utility Connections in Port—Part 2: High and Low Voltage Shore Connection Systems. Data Communication for Monitoring and Control. IEC/ISO/IEEE: Geneva, Switzerland, 2018; pp. 1–56.
- IEC/ISO/IEEE/PAS. 80005-3:2014; Utility Connections in Port—Part 3: Low Voltage Shore Connection (LVSC) Systems—General Requirements. IEC/PAS: Geneva, Switzerland, 2014; pp. 1–56.
- European Commission: Directorate-General for Energy, DNV, LBST & Trinomics. Port Electricity Commercial Model (Project Pilot)—Final Report; Publications Office of the European Union: Luxembourg, 2024. [Google Scholar] [CrossRef]
- European Union. Regulation (EU) 2023/957 of the European Parliament and of the Council of 10 May 2023 amending Regulation (EU) 2015/757 in order to provide for the inclusion of maritime transport activities in the EU Emissions Trading System and for the monitoring, reporting and verification of emissions of additional greenhouse gases and emissions from additional ship types. OJL 2023, 130, 105–114. [Google Scholar]
- Berry, S.; Betterton, C.; Karagiannidis, I. Understanding Weighted Average Cost of Capital: A Pedagogical Application. J. Financ. Educ. 2014, 40, 115–136. [Google Scholar]
- Methodology for Calculating the Required Revenue of the Hellenic Electricity Distribution Network Operator, 1st ed.; RAE Decision 1431/22.10.2020; RAE: Athens, Greece, 2020; Available online: https://www.raaey.gr/energeia/wp-content/uploads/2023/03/Decision-1431_2020-_EN_.pdf (accessed on 14 January 2026).
- Meletiou, A.; Vasiljevska, J.; Vitiello, S. DSO Observatory 2024—Unlocking Flexibility in Europe; JRC141953; Publications Office of the European Union: Luxembourg, 2025; Available online: https://publications.jrc.ec.europa.eu/repository/handle/JRC141953 (accessed on 14 January 2026).
- European Union. Commission Regulation (EU) 2015/1222 of 24 July 2015 establishing a guideline on capacity allocation and congestion management. OJL 2015, 197, 24–72. [Google Scholar]
- European Union. Regulation (EU) 2019/943 of the European Parliament and of the Council of 5 June 2019 on the internal market for electricity. OJL 2019, 158, 54–124. [Google Scholar]
- Papalexopoulos, A.; Beal, J.; Florek, S. Precise Mass-Market Energy Demand Management Through Stochastic Distributed Computing. IEEE Trans. Smart Grid 2013, 4, 2017–2027. [Google Scholar] [CrossRef]
- Trozzi, C. EMEP/EEA air pollutant emission inventory guidebook—2013: 1.A.3.d.i, 1.A.3.d.ii, 1.A.4.c.iii International navigation, national navigation, national fishing. In EMEP/EEA Air Pollutant Emission Inventory Guidebook—2013; EEA (European Environment Agency): Copenhagen, Denmark, 2013. [Google Scholar]


Disclaimer/Publisher’s Note: The statements, opinions and data contained in all publications are solely those of the individual author(s) and contributor(s) and not of MDPI and/or the editor(s). MDPI and/or the editor(s) disclaim responsibility for any injury to people or property resulting from any ideas, methods, instructions or products referred to in the content. |
© 2026 by the authors. Licensee MDPI, Basel, Switzerland. This article is an open access article distributed under the terms and conditions of the Creative Commons Attribution (CC BY) license.