Abstract
This study presents a comprehensive analysis of the marginal capacity credit of utility-scale solar and wind power in South Korea using an effective load-carrying capability-based methodology. This research makes three key contributions distinguishing it from previous works. First, the study introduces the concept of marginal capacity credit to quantify the contributions of newly added renewable energy capacities in power systems that already host significant solar and wind power capacities. Second, it evaluates the interaction effects between solar and wind power, revealing their complementary potential in enhancing system adequacy across different penetration levels. Third, it investigates how integrating energy storage systems mitigates intermittency and aligns renewable generation with peak demand. Results indicate that solar power provides relatively high marginal capacity credit at low penetration levels due to its alignment with peak demand, but its contribution declines as deployment expands and peak hours shift. Conversely, wind power maintains more stable marginal capacity credit and eventually surpasses solar power at higher penetration levels due to its broader generation profile. Storage integration notably enhances marginal capacity credit for both resources, with solar power gaining greater benefit from optimized charging and discharging strategies. These findings provide practical guidance for improving power system reliability and capacity planning under growing renewable penetration.
1. Introduction
The integration of renewable energy (RE)—particularly solar and wind power—plays a vital role in achieving carbon neutrality and establishing sustainable power systems. However, the inherent variability and intermittency of these resources pose significant challenges to maintaining power system reliability. Accordingly, quantifying the reliability contribution of RE sources is essential for effective power system planning and operation. The capacity credit (CC) serves as a key metric for assessing how much a generation source contributes to meeting systems adequacy requirements [1,2,3]. Among several CC estimation methods, the effective load-carrying capability (ELCC) approach is widely regarded for its robustness, as it accounts for both the stochastic nature of RE generation output and the dynamic characteristics of the power system [2,4,5]. Nevertheless, the computational complexity and extensive data requirements of the ELCC approach have motivated the development of simplified estimation methods [4,5,6,7].
Most existing studies have focused on evaluating CC when RE sources, such as solar or wind, are first integrated into power systems which are dominated by conventional, fossil fuel-based generation [2,8,9]. However, as renewable penetration increases, the presence of existing capacities significantly influences the reliability contributions of newly added RE capacities [7,10,11]. Furthermore, the integration of energy storage systems (ESSs) has been proposed as an effective solution to address RE variability by shifting RE power supply from surplus generation periods to peak demand hours. Despite the growing importance of storage systems, the impact of ESSs on CC—especially in systems already containing RE resources—remains underexplored [12,13]. In addition, the capacity factor (CF) of RE, representing the ratio of actual output to rated capacity, also plays a critical role in CC estimation [2,4,5]. The time resolution of CF data determines how accurately resource variability is captured; smaller intervals provide finer temporal detail but require more extensive datasets [14]. Estimation of CF typically involves either simulation models [14,15] or historical output data, with the latter often favored due to its practicality [2,3,8]. Recent studies have further examined how statistical confidence levels affect CC estimation, highlighting potential inaccuracies when using limited hourly CF data [16,17]. Additionally, CC estimation on the integration of both solar and wind energies has garnered attention, recognizing the distinct yet complementary generation characteristics of these energy sources [10,11].
It is noted that CC estimations for RE are integral to mid- to long-term capacity plans, especially in countries such as South Korea where a single electrical grid operates. Yet, official methodologies remain undisclosed, and policy documents often substitute “peak contribution” for true CC [18]. This has often led to mismatches between predicted and actual contributions of solar and wind power, challenging grid stability and necessitating curtailments. This study focuses on CC estimation based on the ELCC and statistical confidence levels, formally defining the concept of marginal capacity credit (mCC) and distinguishing itself from existing studies in several ways. First, it rigorously addresses the estimation of CC for newly added RE in power systems already containing renewable facilities, explicitly conditioning the capacity credit on the vector of existing solar and wind base capacities. This enables systematic mapping of how mCC varies across grids of base and incremental capacities, moving beyond conventional single-resource or one-off addition analyses [2,7,10,11]. Second, it evaluates how solar and wind capacities interact to affect each other’s CC through quantitative complementarity metrics and asymmetric sensitivity analysis. This joint approach reveals how the interaction effects between resources are not symmetric, with wind power showing greater sensitivity to changes in solar’s base capacity and charging strategy than vice versa. Third, it assesses the influence of ESS integration on the CC of solar and wind energy individually, incorporating stylized yet realistic operational schemes and clarifying the assumptions underlying storage modeling. To achieve these objectives, the study defines the concept of mCC as the capacity credit of newly added RE capacity conditional on existing RE base capacity; then, it introduces procedures for generating and refining the relevant input data using tolerance interval-based CF estimation and net load pattern normalization, and applies the proposed methods to the Korean power system calibrated to its LOLE adequacy target of 0.3 days per year (aligned with Korea’s mid-to-long-term power planning standards [18]). The mCC is calculated under various scenarios of input data, and the results are thoroughly analyzed. The results provide empirical evidence and policy-relevant insights for improving system reliability and renewable integration strategies in high-penetration contexts.
2. Methodology
2.1. Marginal Capacity Credit
The ELCC is a widely used metric for quantifying the additional load that a power system can reliably support due to the integration of a new power resource, while maintaining a predefined reliability criterion [1,2]. One of the critical reliability metrics in power systems is the loss of load expectation (LOLE), which quantifies the average number of days per year during which the system is unable to meet demand. Letting denote the power demand in MW and the generation capacity in MW at time , the LOLE of power systems can be expressed as follows [2,4]:
where represents the number of time points and is the probability that the power demand exceeds power capacity at time . Due to the inherent uncertainty in power generation availability, the generation capacity is often treated as a random variable [5,19]. This study assumes a binary operational state (‘on’ or ‘off’) for each generator, with independent operations across all generators. Based on these assumptions, a capacity outage probability table (COPT) can be constructed, detailing all possible capacity states and their associated probabilities [19]. The collection of traditional fossil fuel-based generators forms the reference system, where the rated capacities and outage probabilities of each generator are predefined [4,17,20].
Let denote the LOLE for a power demand and power output . For RE sources, CC quantifies the contribution of RE to meet system adequacy criteria, denoted as . Denoting CC as , it can be defined for a RE source with the rated capacity and the CF as follows [2,4,5]:
where . This definition applies to newly installed RE in a power system composed solely of conventional generators, whereas the concept of mCC relates to additional RE capacity in systems that already include existing renewable installations. In a power system with existing solar and wind capacities of and , respectively, the mCC for newly added solar capacity or wind capacity will be denoted as , where and for Hereafter, and will be referred to as the base capacity and the target capacity of RE (solar or wind as appropriate), respectively.
Let denote the CF of RE at time . When the base capacity is , the net load at time is expressed as = Then, the mCC can be defined as follows:
where and . Unlike traditional CC calculations, mCC accounts for the net load . Substituting for in the LOLE calculation allows mCC to reflect the contributions of additional RE in systems with existing renewable capacities. This nuanced approach highlights the interplay between new and existing RE, providing more accurate insights into their combined impacts on the system reliability.
The mCC calculation proceeds as follows: (1) for a given base capacity and incremental capacity , construct the reference system COPT and determine the net load using representative capacity factors and six years of demand data; (2) compute LOLE over T = 8760 hourly intervals per year, where is summed across all hours; (3) increment the system load (or equivalently, reduce available capacity) until LOLE equals the target 0.3 days/year, (i.e., the load increase is the ELCC); and (4) divide ELCC by to obtain the marginal capacity credit. This procedure ensures transparency in how mCC responds to existing renewable mix and uncertainty in capacity factors. While mCC is mathematically equivalent to incremental ELCC over the net load, its explicit conditioning on and formulation as provides three key conceptual advantages: (i) it enables mapping of capacity credit as a function of the existing renewable mix, which is essential for high-penetration systems; (ii) it clearly separates and quantifies the interaction effects between solar and wind, revealing asymmetric sensitivities; and (iii) it supports capacity planning decisions by showing how sequencing of solar, wind, and storage additions affect their respective reliability contributions, rather than evaluating isolated resources.
2.2. Representative Capacity Factors and Net Load Patterns
2.2.1. Representative Capacity Factors
In this study, the time unit is set to hours, with denoting 1:00 AM on 1 January and indicating 12:00 AM on 31 December, using consecutive numbers. All analyses employ hourly temporal resolution, which is used both for representative capacity factor estimation and for the LOLE calculation in the COPT framework. The CF at time (i.e., ) quantifying the efficiency of a solar or wind power output, is calculated as follows:
Statistical significance in CF estimation requires large datasets encompassing extensive hourly power output and capacity data. To address practical limitations in data acquisition while preserving the variability characteristics of RE data, this study segments the time period into distinct time blocks, a methodology adopted in existing literature [17]. It is assumed that the CFs within the same time block follow the same probability distribution. Consequently, statistically significant probability distributions are estimated for each time block where a sufficient number of samples are available. The lower bound of the tolerance interval for CF estimation, satisfying a specified uncertainty level , is then determined. The parameter represents the probability that the actual CF falls below the representative (lower bound) value; lower implies more conservative CF estimation aligned with high reliability targets. A value of corresponds to the 10th percentile of the CF distribution, representing the lower tail and aligning with Korea’s conservative approach to capacity adequacy (requiring LOLE ≤ 0.3 days/year). When , the representative CF corresponds to the median CF, and higher values approach more optimistic (upper percentile) estimates. This study adopts as the primary analysis case (unless otherwise noted), reflecting best practice in Korea’s capacity planning. A smaller uncertainty level results in a more conservative CF estimation. The time block, denoted as , is defined as follows.
where represents the duration of a time block in days, and the time slot denotes the hour of day . If , then the number of time slots remains consistent at for all time blocks. Otherwise, the duration of time blocks for the last days is adjusted to . For example, when , represents a set of consecutive 7 days belonging to the second time block starting from hour 10, given by However, since and , which gives , the time slots of time block are adjusted to 8 days. With a set of years () with historical CF data, CF values for a specific year within time block are denoted as . Aggregating data across different years produces a sample set for time block . Once the CF samples for each time block are determined, a probability distribution is fitted to each time block, and the representative CF is determined as the lower bound of the tolerance interval at the uncertainty level .
The integration of RE with storage devices addresses intermittency challenges and enhances energy supply efficiency by synchronizing energy delivery with demand patterns [12,13]. This study evaluates the impact of storage system integration on mCC of RE using a simplified storage system model. This stylized storage model is designed to represent an upper-bound scenario with idealized operational characteristics, enabling clear isolation of the effects of demand-aligned energy shifting on capacity credit. The model’s assumptions and limitations are detailed below, with explicit caveats about interpretation provided in Section 4. The system operates independently for solar and wind power, facilitating hourly charging and discharging, while prohibiting simultaneous operations. Energy charged within a cycle is discharged in the same cycle, with no assumed energy losses during charging, discharging, or storage. Furthermore, the storage system is considered to have sufficient capacity to reliably meet demand.
Let denote the proportion of RE power output allocated for charging and let () represent the set of charging hours. For an RE source with a capacity and a representative CF of at time , the charging output () is . Accordingly, the power output contributing to the power load at time is after deducting the charging output from the power output. This adjusted output, which incorporates the effect of charging (or discharging), is referred to as the effective CF (denoted as ), distinguishing it from the original representative CF ( The relationship between and is expressed as
Let () denote the set of discharging hours, where . The energy charged during a specific cycle is discharged entirely within the same cycle. In this study, the discharging output () at time is assumed to be proportional to the net load , as described below.
The relative contribution of the discharging output to the RE capacity is given by , for Consequently, the effective CF () accounting for both charging and discharging can be expressed as
Hereafter, unless otherwise stated or where no confusion arises, the effective CF defined in Equation (9) incorporating the presence of a storage system will be referred to as the representative CF and denoted as for the sake of simplicity.
2.2.2. Representative Net Load Patterns
The net load is derived from the base capacities of solar and wind power and the representative CFs (, ). A normalization procedure is applied to derive the so-called net load pattern for a given year by dividing the hourly net load by the maximum net load of the year. Aggregating normalized net load patterns across all years and re-normalizing yields the representative net load pattern as follows:
where denotes the net load pattern for year , with and denoting the net load at hour for year . This process ensures that the representative net load pattern accounts for inter-annual variability, enabling more accurate mCC estimations. Figure 1 illustrates an overview of the input data required for the mCC calculation, the associated processing steps involved, and the interrelationships among these components.
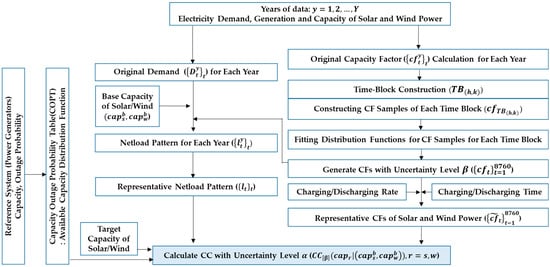
Figure 1.
Overview of input data and processing steps for mCC calculation.
3. Data and Results
3.1. Input Data
3.1.1. Reference System
The reference system for the probability distribution of available capacity in the power system in the Republic of Korea was established based on the domestic power system in 2022, focusing exclusively on conventional power generation sources and excluding RE [21], as shown in Table 1. Each category of power generator was further subdivided into subgroups based on the capacities of individual units. For instance, nuclear power was categorized into five subgroups of varying capacities, encompassing a total of 24 units. The total installed capacity () in the reference system is 110,237 MW, which accounts for approximately 82% of the installed capacity of power facilities in Korea as of January 2022. To construct the COPT, data on the outage probabilities of individual generators in the reference system is essential. However, since outage probability data is only publicly available on a monthly basis and categorized by fuel type, this study assumes that generators using the same fuel type share identical outage probabilities, regardless of generator type. The outage probabilities for each fuel type were calculated as a six-year average (2018–2023) based on historical data [21]. Figure 2 compares the monthly outage probabilities across various fuel types, while Figure 3 depicts the probability density function of available capacity derived from the COPT.

Table 1.
Reference system for capacity outage probability table (COPT).
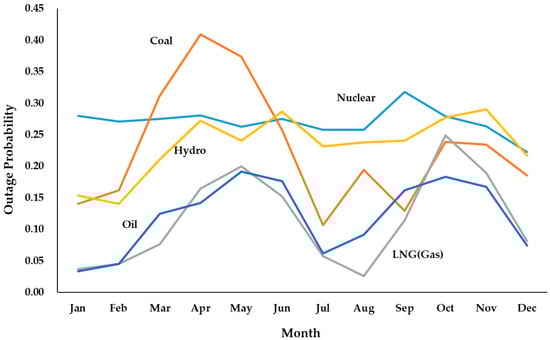
Figure 2.
Monthly outage probabilities for power generators by fuel type.
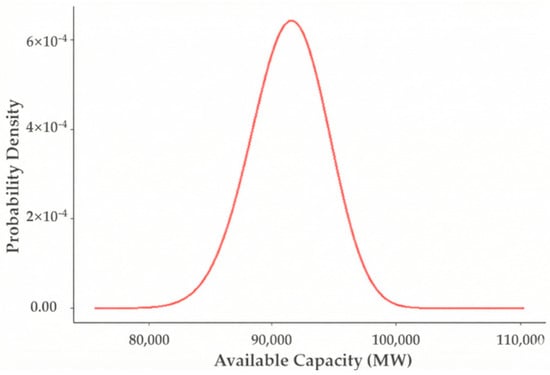
Figure 3.
Probability density function of available capacity from COPT.
3.1.2. Representative CFs of Solar and Wind Power
This study computes hourly CFs using annual data on power output and installed capacity for solar and wind power over 8760 h [21,22] based on the records from power producers contracted with the Korea Power Exchange (KPX). While wind power data covers the entire country, solar power data excludes behind-the-meter (BTM) installations; depending on the year, solar data accounts for 37% to 69% of the total national capacity. For CF calculations, wind power data from the most recent six years (2018–2023) are utilized, whereas solar energy relied on data from 2012 to 2017 (sourced from Electric Power Statistics Information System, EPSIS [21] and Public Data Portal [22]). This temporal discrepancy stems from the widespread deployment of storage systems for solar power starting from 2018 to reflect charging and discharging effects. In contrast, the limited adoption of storage systems for wind energy allowed for the use of the most recent wind data. Missing data or outliers due to curtailment are treated conservatively by exclusion, ensuring that representative CFs reflect generation capability rather than dispatch constraints. Representative CFs were generated using six years of data with time blocks () of 7 days, resulting in a sample size of 48 (=8 days/year × 6 years) for time block () and 42 (=7 days/year × 6 years) for all other time blocks. Three alternatives for the length of the time block—7 days, 14 days, and 1 month—were evaluated. Preliminary experiments identified a seven-day time block as the most effective for capturing the variability characteristics of the data while maintaining statistical significance. The statistical fit of CF samples was assessed using the Anderson–Darling (AD) test at a 5% significance level (i.e., ) [23]. When both the Normal and Weibull distributions satisfied the significance level, the distribution with the higher p-value was selected. Table 2 summarizes the results of the AD goodness-of-fit test for wind power across the time blocks .
Table 2.
Results of Anderson–Darling goodness-of-fit test for time blocks of wind power.
Figure 4 illustrates the seasonal and hourly representative CFs for solar and wind power. For solar power, the CF is highest between 11:00 AM and 1:00 PM across all seasons. Among the seasons, spring (March–May) exhibits the highest CF values, followed by summer (June–August), while winter (December–February) and autumn (September–November) show similar levels. In contrast, wind power displays significantly higher CFs during winter and the lowest values in summer. Notably, during the peak solar CF hours (11:00 AM–1:00 PM), wind CFs are relatively lower compared to other time periods. Figure 5 provides an example of summer CFs, illustrating variations influenced by the uncertainty level .
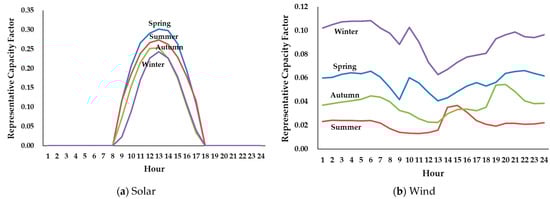
Figure 4.
Seasonal and hourly representative capacity factors for solar and wind power (
.
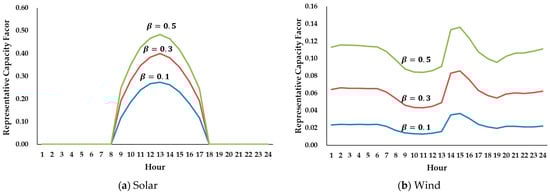
Figure 5.
Representative capacity factors under different uncertainty levels
in summer.
3.1.3. Representative Net Load and Charge/Discharge
Using six years of power demand data (2018–2023) and the previously calculated representative CFs, the representative net load pattern was determined. The reference system, representative CFs, and net load patterns form the complete input dataset for mCC estimation. Figure 6 compares the distribution of peak times—defined as the top 50 h of net load—for scenarios with and without the inclusion of base capacities for solar and wind energy. In the absence of RE, the net load is equal to the total power demand. Most of the top 50 peak hours occur during winter and summer, with summer accounting for more peak hours than winter. These peaks are predominantly concentrated between 9:00 and 10:00 AM and 5:00–7:00 PM. In Figure 6, the base capacities of RE are set at 10% of the total capacity of the reference system, amounting to 11,230 MW. The figure illustrates that the deployment of solar power shifts the top 50 peak net load hours to periods with lower solar CFs, highlighting its effectiveness in reducing net load during traditional peak demand hours. In contrast, such shifts are less pronounced for wind power, indicating that wind has a relatively limited impact on altering the timing of peak net load periods.
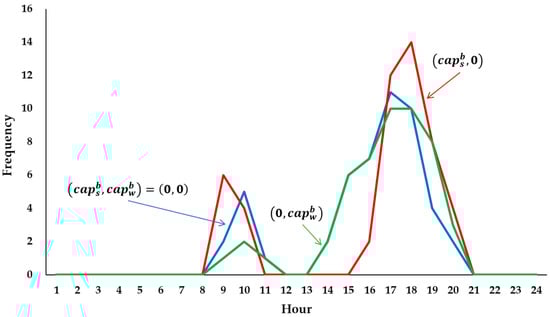
Figure 6.
Top 50 net load peak times for scenarios with and without solar and wind base capacities.
To evaluate the impact of storage systems integrated with RE on mCC, this study employs fixed charging and discharging schedules currently implemented in South Korea, as shown in Table 3. This schedule was chosen to reflect current regulatory practice and grid codes; however, it represents a stylized operational approach rather than an economically optimized dispatch strategy. When the base capacity of solar power is set to 10% of the total capacity, Figure 7 shows how changes in the charging rate () affect the top 50 peak hours.
Table 3.
Charging/discharging schedules for solar and wind power in different seasons [21].
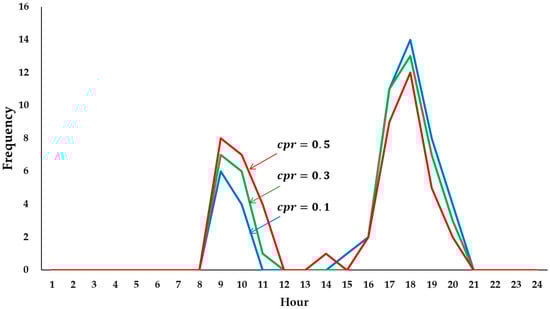
Figure 7.
Influence of solar charge rate on top 50 net load peak times.
Unlike scenarios without storage integration, which primarily shift peak hours to the periods of lower solar CFs, the inclusion of a storage system effectively redirects peak hours to the periods with higher solar CFs. Developing a fully optimized co-dispatch scheme that jointly minimizes system costs while respecting reliability constraints is beyond the scope of this work and is identified as future research. The simplified storage model assumes (i) no round-trip efficiency losses; (ii) unlimited intra-day energy capacity; (iii) fixed charging/discharging hours independent of real-time dispatch optimization; (iv) no inter-day or seasonal carry-over constraints; and (v) proportional allocation of discharge to net load within the DT window. These assumptions are designed to isolate the effect of idealized demand-aligned load shifting on mCC, providing an upper-bound estimate. This framework quantifies the relative gains in mCC from storage integration; realistic efficiency (e.g., 85–90%) and limited duration (e.g., 4 h energy capacity) would reduce these gains, particularly for solar. The results should be interpreted as indicative trends and upper bounds rather than operationally realizable plant-level values.
3.2. Marginal Capacity Credit (mCC) Estimations
3.2.1. Case Without Charging/Discharging
This study sets the target LOLE () level for mCC estimation at 0.3 days/year, consistent with Korea’s mid-to-long-term power planning standards [18]. Results show that mCCs decrease as deployment capacities increase, aligning with existing studies [2,8,9] that highlight the diminishing marginal contribution of additional capacity to system reliability. Furthermore, stricter uncertainty levels, represented by lower β values, yield more conservative mCC estimates [17]. The variation in mCC across multiple values of (0.1, 0.2, 0.3, 0.4, and 0.5) constitutes a built-in robustness assessment. Table 4 demonstrates that stricter uncertainty (lower ) yields significantly lower mCC values; for example, (conservative lower percentile) yields solar mCC of 0.0966 at 1% penetration, whereas yields 0.1923. This span quantifies the sensitivity of mCC estimates to confidence level assumptions and provides policymakers with a range of conservative-to-moderate estimates. Additionally, the comprehensive scenario analysis spanning penetration rates 1~30% and base/target capacity combinations explores the robustness of mCC trends across the anticipated deployment envelope for Korea’s renewable transition. Solar power shows higher mCCs than wind power at lower penetration rates, primarily due to its strong alignment with peak demand hours. However, as solar deployment capacity increases, its mCC declines more sharply because the peak net load shifts to periods with lower solar CFs. In contrast, wind power exhibits a more gradual decrease in mCC with increasing penetration rates. This stability stems from wind power’s more uniform generation profile, enabling it to consistently contribute to system reliability even at higher deployment levels. Unless otherwise specified, all experimental results presented below assume that . This represents a relatively conservative approach to estimating the mCC of RE and aligns most closely with the criteria used in Korea.
Table 4.
Marginal CCs for solar and wind power without storage systems under
.
Further analysis examines scenarios in which only one type of RE is included in the system. The results in Figure 8 and Table 5 show that as the base capacity increases, the mCC for both solar and wind power decreases. This decline is more pronounced for solar power, reflecting its rapidly diminishing marginal contribution to reliability as its share in the generation mix grows. Wind power, by contrast, experiences a relatively moderate reduction in mCC under similar conditions. These findings underscore the complementary nature of solar and wind power in enhancing system reliability. Solar power is particularly effective at addressing peak demand at lower deployment levels, while wind power sustains its reliability contribution more effectively at higher deployment levels due to its consistent output characteristics. To substantiate the claim of complementarity between solar and wind resources, the representative CFs in Figure 4 reveal important patterns. (i) Temporal Correlation: solar CF peaks between 11:00 AM and 1:00 PM across all seasons, whereas wind CF is significantly lower during these peak solar hours. Preliminary analysis of hourly CF time series for the period 2018–2023 (wind) and 2012–2017 (solar) yields a Pearson correlation coefficient of approximately −0.15 to −0.25 during peak solar hours, indicating negative or low correlation at critical reliability periods. (ii) Complementary Index: the frequency of hours where solar CF < 0.2 and wind CF > 0.3 (or vice versa) is approximately 8~12% of total hours, highlighting asymmetric complementarity in which wind is effective when solar is poor (especially during winter months and nighttime hours). (iii) Spatial Aggregation: current data reflect national-level aggregation of both solar and wind plants. More granular geographically diversified portfolios (e.g., coastal vs. inland wind sites, cloud patterns across regions) could amplify complementarity, especially for wind, though this refinement lies beyond the scope of the present analysis.
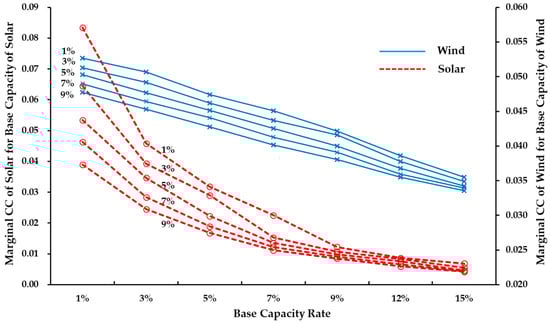
Figure 8.
Change in marginal CCs for solar and wind power with increasing base capacities.
Table 5.
Marginal CCs for solar and wind power without storage systems when only their own base capacities are given.
Figure 9 presents the mCC across various scenarios where the target capacity is fixed at 0.1 × TC, indicating that the combined incremental and base capacity rates total 10%. The X-axis shows different combinations of base and incremental capacity rates, with (10%, 0%) representing the scenario without any base capacity. As depicted in the figure, both solar and wind mCCs are at their highest in the absence of base capacity (i.e., (10%, 0%)) and gradually decrease as base capacity increases. The decline in mCC is more pronounced for solar power than for wind power, reflecting solar power’s greater sensitivity to increase in base capacity. On the other hand, Table 6 presents the variations in the mCC of solar and wind power as the base capacity of the other RE source changes. For a given incremental capacity of solar, the mCC generally decreases as the base capacity of wind increases. However, when the incremental capacity is very small (1–2%), a slight increase in mCC is observed, demonstrating a contrasting trend. This behavior differs from the results in Table 5, where the mCC consistently decreases with the increasing base capacity of its own energy source across all scenarios. In contrast, the mCC of wind power decreases uniformly as the base capacity of solar increases, regardless of the experimental conditions. Furthermore, the impact of solar’s base capacity on wind’s mCC is more pronounced than the corresponding impact of wind’s base capacity on solar’s mCC. This asymmetry is visually depicted in Figure 10, which highlights wind’s stronger sensitivity to changes in solar base capacity ratios compared to the reverse case. Finally, Table 7 presents the mCC values for incremental capacity additions of solar and wind power when both REs have existing base capacities. The results illustrate how the base capacities of solar and wind influence the mCC of incremental capacity for each RE type, demonstrating the interplay between their respective contributions to system reliability.
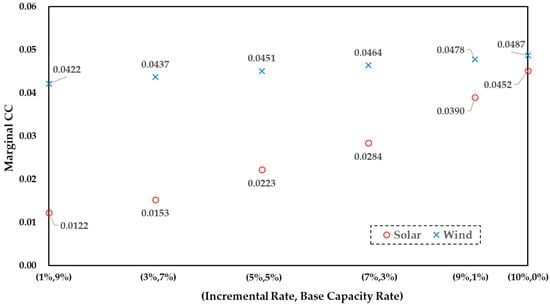
Figure 9.
Marginal CCs for combined base and incremental capacities (target capacity = 0.1 × TC).
Table 6.
Marginal CCs for solar and wind power without storage systems when only other source’s base capacity is given.
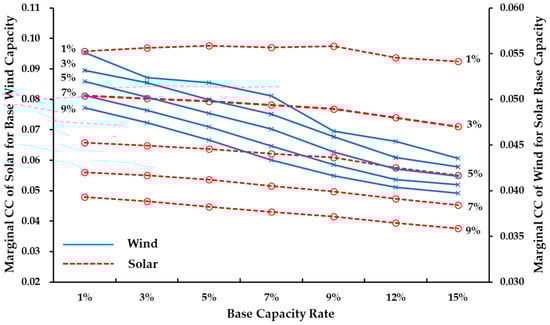
Figure 10.
Sensitivity of Marginal CCs to base capacities of other energy sources.
Table 7.
Marginal CCs for solar and wind power without storage systems when both base capacities are given.
A key finding is the asymmetric sensitivity of solar and wind mCC to each other’s base capacity. Table 6 shows: (i) Impact of Wind’s Base Capacity on Solar’s mCC: for a given incremental solar capacity (e.g., 5%), as wind’s base capacity increases from 1% to 15%, solar’s mCC remains relatively stable (0.0658 to 0.0550, a ~16% decline). (ii) Impact of Solar’s Base Capacity on Wind’s mCC: conversely, as solar’s base capacity increases from 1% to 15% (for a fixed 5% wind incremental capacity), wind’s mCC declines more sharply (0.0551 to 0.0435, a ~21% decline). This asymmetry is visually depicted in Figure 10 and reflects wind’s greater sensitivity to solar’s daytime peak-shaving effect on net load timing. This insight is critical for capacity planning: when prioritizing future capacity additions in Korea’s high-solar penetration scenario, wind capacity additions are more vulnerable to diminishing returns from increasing solar base capacity than vice versa, suggesting the need for tailored sequencing strategies.
3.2.2. Case with Charging/Discharging
This section presents the results from an analysis of the mCCs of solar and wind power incorporating the consideration of energy storage systems. Compared to the experimental results on mCC without storage systems presented in Table 4, the results clearly demonstrate that integrating a stylized (ideal) storage system enhances the mCC for both solar and wind power across all scenarios, regardless of the presence of a base capacity. However, the magnitude and pattern of this enhancement differ markedly between the two resources. For solar power (Table 8 vs. Table 4), the storage-induced mCC enhancement is substantial and grows with penetration rate. At 1% penetration, solar’s mCC increases from 0.0966 (, no storage) to 0.1077 (storage, ), a +11% uplift. At 30% penetration, the uplift increases to +82% (from 0.0187 to 0.0340), reflecting the growing benefit of demand-aligned energy shifting as solar output becomes more variable at high-capacity factors. This pattern reveals that storage is particularly valuable for solar in high-penetration contexts. For wind power (Table 8 vs. Table 4), storage also enhances mCC, but the gain diminishes at higher penetration rates. At 1% penetration, wind’s mCC increases from 0.0544 to 0.0680 (+25%), suggesting wind’s natural variability may be better served by storage initially. However, at 30% penetration, the uplift drops to +10% (from 0.0391 to 0.0430), indicating that wind’s already-stable contribution is less enhanced by load shifting. This contrasting pattern highlights how storage provides different value propositions for solar versus wind and underscores the need to systematically optimize charging rates in systems integrating both.
Table 8.
Marginal CCs for solar and wind power with storage systems having charging rate of 0.1 (i.e.,
and ).
Table 9 presents the mCC values for various combinations of base and incremental capacities, assuming a fixed charging rate of 0.1 and an uncertainty level of . Compared to Table 5, which was calculated under the same conditions but without integrated storage systems, the results clearly show that the integration of a storage system enhances the mCC for both solar and wind power across all scenarios, regardless of the presence of a base capacity. Figure 11 illustrates the relative increase in mCC attributed to the storage system, analyzed in terms of both base and incremental capacities. For the base capacity, solar power exhibits a consistent increase in mCC as the base capacity grows. Wind power, however, shows a more complex pattern: an initial decrease in mCC up to a certain base capacity threshold, followed by a subsequent increase. For incremental capacity, the relative increase in mCC for solar power rises steadily, while for wind power, it declines as incremental capacity expands.
Table 9.
Marginal CCs for solar and wind power with storage systems when their own base capacities are given and the charging rates are set at 0.1 (i.e., and ).
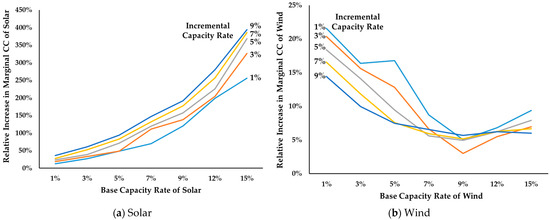
Figure 11.
Relative increases in marginal CCs with storage systems under different base and incremental capacity rates.
Table 10 and Table 11 present sensitivity analysis across three different charging rate combinations : (i) ; (ii) ; and (iii) . This sensitivity analysis reveals that wind’s charging strategy has a minimal effect on solar’s mCC. In Table 10, wind mCC at (5% solar base, 1% wind incremental) ranges from 0.0465 with to 0.0474 with , . Conversely, solar’s charging rate has a pronounced effect on wind’s mCC. In Table 11, solar mCC at the same base case ranges from 0.0519 with , to 0.0591 with ,. This asymmetry, as shown in Figure 12, underscores the interconnected dynamics between solar and wind in high-penetration systems: optimizing solar’s charging/discharging schedule is critical to managing wind’s reliability, whereas wind’s storage operation has limited back-action on solar (Figure 12). The results imply that in systems transitioning to high-solar penetration, investment priorities should emphasize: (i) optimizing solar-attached storage systems to maximize demand alignment and peak shifting; (ii) recognizing that wind-attached storage provides less marginal benefit at high penetration; and (iii) co-optimizing solar and wind charging schedules jointly rather than independently, given the strong cross-coupling revealed in Table 10 and Table 11. Future research should develop economically optimized co-dispatch strategies that balance reliability (mCC maximization) with system costs.
Table 10.
Marginal CCs for solar power with storage systems for different charging rates and base capacities.
Table 11.
Marginal CCs for wind power with storage systems for different charging rates and base capacities.
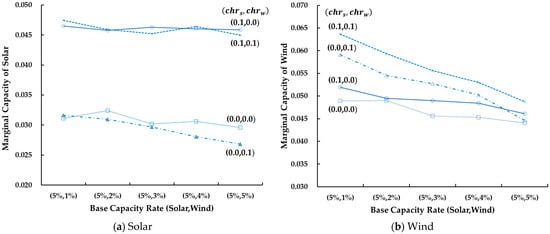
Figure 12.
Influence of charging rates on marginal capacity credit for solar and wind base capacities (incremental capacity rate = 1%).
4. Concluding Remarks
This study examines the marginal capacity credits of utility-scale solar and wind power in South Korea using the ELCC-based approach, providing valuable insights into the impact of renewable energy (RE) integration, variability, and storage systems on power system reliability. Key contributions include quantifying the mCC of newly added solar and wind capacities, analyzing interactions between different RE types, and assessing the influence of storage system integration on capacity credits. The findings reveal that solar power significantly enhance reliability at lower penetration levels due to its alignment with peak demand hours but becomes less effective as penetration increases. In contrast, wind power provides relatively stable contributions across all penetration levels, surpassing solar at higher levels due to its broader generation period. Moreover, integrating storage systems enhances the mCC of both solar and wind power, with solar benefiting more substantially from charging and discharging strategies that align energy supply with demand patterns.
The mCC framework and results provide guidance for capacity planning, renewable portfolio design, and capacity market design in Korea and other high-penetration systems: (i) Capacity Planning and Reserve Margin Determination: using conservative mCC values rather than heuristic “peak contribution” metrics ensures that official capacity adequacy targets are robustly met. At penetration rates above 20%, solar’s mCC declines sharply, as shown in Table 4, dropping from 0.0666 at 5% to 0.0187 at 30%, implying that simply scaling up solar capacity will not proportionally increase firm capacity. Wind’s more stable mCC suggests prioritizing wind in the 20~30% penetration regime. (ii) Renewable Portfolio Design (Solar vs. Wind Sequencing): the asymmetric complementarity results inform sequencing of solar and wind additions. Early-stage expansion can prioritize lower-cost solar, given its high mCC at low penetration. However, beyond 15% combined solar-wind penetration, the planning mix should shift toward wind and storage, given wind’s sustained mCC advantage and storage’s pronounced benefits for solar load-shifting. (iii) Energy Storage’s Role in Adequacy and Capacity Markets: storage enhances solar’s mCC by 11~82% across penetration levels as shown in Table 8, positioning storage as a critical resource in Korea’s capacity market. Policymakers should consider allocating explicit capacity credit to energy storage systems based on their operational characteristics, such as duration, efficiency, and dispatch rules. The results suggest that 4 h storage systems with realistic 85~90% round-trip efficiency would still provide 50~70% of the idealized benefits shown in Table 8, justifying investment in both battery storage and other forms of energy storage (e.g., compressed air and thermal storage).
While the analysis is calibrated to Korea’s power system, several insights generalize to other high-penetration jurisdictions: Most of all, Korea’s strong summer/winter seasonal peaks and high-solar-to-wind-capacity ratio are system-specific. Other regions with different peak timing (e.g., mild-climate systems with summer demand) or more balanced solar and wind mixes may exhibit different interaction patterns. Next, the declining solar mCC with increasing penetration is a robust trend across diverse systems, such as Spain [8] and western US [9], driven by the immutable diurnal cycle. Wind’s more stable mCC (lower decline rate with penetration) reflects its less synchronized generation profile relative to demand peaks, a feature common across temperate and polar climates. Asymmetric interaction effects (wind more sensitive to solar’s base capacity) are expected in systems where solar peaks during daytime demand and wind is uncorrelated with diurnal cycles. Storage’s dual benefit—enhanced mCC and demand alignment—applies universally, though the magnitude depends on storage duration, efficiency, and dispatch flexibility.
The study employs a stylized storage model with zero efficiency loss, unlimited energy capacity, and fixed charge/discharge schedules. While this clarifies the upper-bound impact of demand-aligned load shifting, operational reality includes round-trip efficiency losses, limited duration, and real-time dispatch optimization that may not follow fixed schedules. Future research may include the following topics: (i) develop co-optimized dispatch strategies that jointly optimize solar-wind-storage dispatch to minimize system costs while meeting reliability constraints, replacing the current stylized fixed-schedule assumption; (ii) incorporate realistic storage parameters (e.g., 85–90% round-trip efficiency, 4 h nominal duration) and perform sensitivity analysis on mCC under these realistic constraints; (iii) validate results using alternative capacity credit methodologies (e.g., convolution method, time-series simulation) to assess the robustness of the ELCC-based mCC framework; (iv) extend analysis to finer spatial resolution (zonal or nodal models) to account for transmission constraints and geographic diversification of wind resources, which may amplify solar-wind complementarity; and (v) explore the impact of demand-side management and demand response on mCC, as time-of-use pricing and load flexibility could substitute for or complement storage-based load shifting. These extensions would further enhance the practical applicability of mCC-based capacity planning methodologies for high-penetration renewable systems.
Author Contributions
Conceptualization, C.P. and Y.C.; methodology, C.P.; validation, Y.C. and Y.J.K.; formal analysis, C.P.; investigation, Y.C.; resources, Y.J.K.; data curation, Y.C.; writing—original draft preparation, C.P.; writing—review and editing, Y.J.K.; visualization, Y.C.; supervision, C.P.; project administration, Y.J.K.; funding acquisition, Y.J.K. All authors have read and agreed to the published version of the manuscript.
Funding
This research was funded by the National Research Foundation of Korea (NRF) grant funded by the Korea government (MSIT) (RS-2023-00242528).
Data Availability Statement
The original contributions presented in this study are included in the article. Further inquiries can be directed to the corresponding author.
Acknowledgments
Authors used language models to assist with review/editing. Authors reviewed and edited all output and take full responsibility.
Conflicts of Interest
The authors declare no conflicts of interest.
Abbreviations
The following abbreviations are used in this manuscript:
| RE | Renewable Energy |
| ELCC | Effective Load-Carrying Capability |
| CC/mCC | Capacity Credit/Marginal Capacity Credit |
| LOLE | Loss of Load Expectation |
| COPT | Capacity Outage Probability Table |
References
- IEA. Modelling the Capacity Credit of Renewable Energy Sources; International Energy Agency: Paris, France, 2011. [Google Scholar]
- Milligan, M.; Porter, K. The Capacity value of wind in the United States: Methods and implementation. Electr. J. 2006, 19, 91–99. [Google Scholar] [CrossRef]
- Zhou, E.; Cole, W.; Frew, B. Valuing variable renewable energy for peak demand requirements. Energy 2018, 165, 499–511. [Google Scholar] [CrossRef]
- Dent, C.J.; Keane, A.; Bialek, J.W. Simplified methods for renewable generation capacity credit calculation: A critical review. In Proceedings of the IEEE PES General Meeting, Minneapolis, MN, USA, 25–29 July 2010; pp. 1–8. [Google Scholar] [CrossRef]
- Amelin, M. Comparison of capacity credit calculation methods for conventional power plants and wind power. IEEE Trans. Power Syst. 2009, 24, 685–691. [Google Scholar] [CrossRef]
- Gami, D.; Sioshansi, R. Data challenges in estimating the capacity value of solar photovoltaics. IEEE J. Photovolt. 2017, 7, 1065–1073. [Google Scholar] [CrossRef]
- Ssengonzi, J.; Johnson, J.X.; DeCarolis, J.F. An efficient method to estimate renewable energy capacity credit at increasing regional grid penetration levels. Renew. Sustain. Energy Transit. 2022, 2, 100033. [Google Scholar] [CrossRef]
- Tapetado, P.; Usaola, J. Capacity credits of wind and solar generation: The Spanish case. Renew. Energy 2019, 143, 164–175. [Google Scholar] [CrossRef]
- Jorgenson, J.; Awara, S.; Stephen, G.; Mai, T. A systematic evaluation of wind’s capacity credit in the Western United States. Wind Energy 2021, 24, 1107–1121. [Google Scholar] [CrossRef]
- Liu, L.; Wang, Z.; Wang, Y.; Wang, J.; Chang, R.; He, G.; Tang, W.; Gao, Z.; Li, J.; Liu, C.; et al. Optimizing wind/solar combinations at finer scales to mitigate renewable energy variability in China. Renew. Sustain. Energy Rev. 2020, 132, 110151. [Google Scholar] [CrossRef]
- Guozden, T.; Carbajal, J.P.; Bianchi, E.; Solarte, A. Optimized balance between electricity load and wind-solar energy production. Front. Energy Res. 2020, 8, 16. [Google Scholar] [CrossRef]
- Mertens, T.; Bruninx, K.; Duerinck, J.; Delarue, E. Capacity credit of storage in long-term planning models and capacity markets. Electr. Power Syst. Res. 2021, 194, 107070. [Google Scholar] [CrossRef]
- Yong, P.; Cheng, L.; Zhu, H.; Tang, L.; Zhang, N.; Kang, C. Investigating the influence of storage on renewable energy capacity credit. In Proceedings of the 2019 IEEE Power & Energy Society General Meeting, Atlanta, GA, USA, 4–8 August 2019; pp. 1–5. [Google Scholar]
- Wu, C.; Zhang, X.; Sterling, M. Wind power generation variations and aggregations. CSEE J. Power Energy Syst. 2022, 8, 17–38. [Google Scholar]
- Ditkovich, Y.; Kuperman, A.; Yahalom, A.; Byalsky, M. A generalized approach to estimating capacity factor of fixed speed wind turbines. IEEE Trans. Sustain. Energy 2012, 3, 607–608. [Google Scholar] [CrossRef]
- Madaeni, S.H.; Sioshansi, R.; Denholm, P. Estimating the capacity value of concentrating solar power plants: A case study of the southwestern United States. IEEE Trans. Power Syst. 2012, 27, 1116–1124. [Google Scholar] [CrossRef]
- Paik, C.; Chung, Y.; Kim, Y.J. ELCC-based capacity credit estimation accounting for uncertainties in capacity factors and its application to solar power in Korea. Renew. Energy 2021, 164, 833–841. [Google Scholar] [CrossRef]
- MOTIE. The 10th Basic Plan of Long-Term Electricity Supply and Demand; Ministry of Trade, Industry and Energy: Sejong, Republic of Korea, 2023.
- Wang, X.; McDonald, J.R. Modern Power System Planning; McGraw-Hill International: Maidenhead, UK, 1994. [Google Scholar]
- Ahadi, A.; Reza, S.E.; Liang, X. Probabilistic reliability evaluation for power systems with high penetration of renewable power generation. In Proceedings of the 2017 IEEE International Conference on Industrial Technology, Toronto, ON, Canada, 22–25 March 2017; pp. 464–468. [Google Scholar]
- Electric Power Statistics Information System (EPSIS). Available online: http://epsis.kpx.or.kr (accessed on 20 July 2025).
- Public Data Portal. Available online: http://www.data.go.kr (accessed on 20 July 2025).
- William, Q.M.; Gerald, J.H.; Luis, A.E. Statistical Intervals: A Guide for Practitioners and Researchers; John Wiley & Sons, Inc.: Hoboken, NJ, USA, 2017. [Google Scholar]
Disclaimer/Publisher’s Note: The statements, opinions and data contained in all publications are solely those of the individual author(s) and contributor(s) and not of MDPI and/or the editor(s). MDPI and/or the editor(s) disclaim responsibility for any injury to people or property resulting from any ideas, methods, instructions or products referred to in the content. |
© 2026 by the authors. Licensee MDPI, Basel, Switzerland. This article is an open access article distributed under the terms and conditions of the Creative Commons Attribution (CC BY) license.