


Abstract
The lightning withstand performance of transmission lines is critically affected by grounding impulse characteristics, particularly for river-crossing towers where soil conditions are complex. This study develops a coupled seepage–electric field model to evaluate these characteristics under dynamic hydrological influences. A complex soil model is constructed integrating Bernoulli’s laminar flow equation with Richards’ equation for unsaturated seepage; long-term finite-element iterations simulate seepage dynamics, yielding distributed soil conductivity parameters that vary with river flow velocity, water depth, and impermeable layers. These parameters are then coupled with an electroquasistatic Maxwell framework to model impulse current dispersion. Validation against experimental data confirms the model’s accuracy. Results show that seepage increases moisture and lowers resistivity. Increasing flow from static to 10 m/s reduces riverbed pressure from 5.61 × 10⁴ Pa to 1.86 × 10⁴ Pa, shifting the 0 Pa isobar downward by 5.1 m, weakening seepage and raising impulse resistance. A shallower impermeable layer deflects seepage laterally, reducing nearby resistivity. Raising water depth from 5 m to 10 m increases pressure from 1.96 × 10⁴ Pa to 5.61 × 10⁴ Pa, enhancing seepage and lowering resistivity. These findings indicate that grounding design must holistically account for flow velocity, water depth, and subsurface barriers to ensure reliable lightning current dissipation and stable grid operation.
1. Introduction
Lightning strikes present a major risk to power system reliability. As such, the impulse grounding resistance of transmission towers serves as a paramount parameter in assessing the lightning performance of these lines [1,2,3]. Affected by the seepage interaction between river water and soil, the soil parameters around the grounding devices of river-crossing transmission towers exhibit distributed characteristics. Consequently, their lightning impulse current dispersion behavior shows significant differences compared to uniform soil structures [4]. A precise understanding of the impulse current dispersion characteristics from river-crossing tower grounding devices is a critical prerequisite for optimizing line lightning protection and safeguarding overall power system reliability.
Scholars worldwide have conducted extensive research on numerical computation methods for analyzing the impulse characteristics of grounding devices. The primary approaches include methods based on transmission line theory [5,6,7], circuit theory [8,9,10], and electromagnetic field theory [11,12,13,14,15,16,17,18,19]. Methods based on electromagnetic field theory can accurately describe the dispersion process of impulse currents in grounding conductors and the surrounding soil, avoiding errors introduced by approximations and simplifications required in circuit parameter extraction. These methods can be solved using moment methods, boundary element methods, or finite element methods based on boundary condition equations. The moment method solves continuous electromagnetic field equations by discretizing them into systems of algebraic equations. However, it faces challenges such as computationally intensive Green’s function calculations in complex soil structures and difficulties in handling soil nonlinearity. The boundary element method achieves dimensionality reduction and efficient analytical computation by transforming governing differential equations into boundary integral equations, which are then discretized into algebraic equations for solution. However, it struggles to handle soil nonlinearity and faces difficulties in analyzing frequency-domain characteristics. The adopted analytical approach, utilizing the finite element method grounded in Maxwell’s differential equations, is capable of accommodating complex soil models, grounding devices of arbitrary geometry, and distributed variations in soil resistivity induced by ionization during impulse dispersion. Furthermore, by incorporating couplings between electrical, thermal, and fluid fields, it enables accurate computation of grounding body characteristics under complex working conditions such as rivers, oceans and mountainous areas. References [11,12] analyzed the transient spatial distribution of the soil ionization zone around grounding conductors, emphasizing its time-varying and non-uniform nature under impulse currents. They developed a dynamic finite element framework by integrating spatial finite element discretization with the finite-difference time-domain (FDTD) technique to analyze the impulse response of grounding bodies. This approach achieves a dynamic coupling between the electric field and soil properties by defining each soil element’s resistivity as a function of the instantaneous electric field intensity at each computational time step, thereby allowing the field’s spatiotemporal evolution to dictate the material behavior. This technique characterizes with high accuracy how soil parameters vary both in space and time during the entire impulse current dispersion event.
Soil conductivity is a key factor affecting the impulse current dispersion process of grounding devices and thus their impulse characteristics [11,13]. Soil conductivity is influenced by soil type, porosity, water content, salt content, and other factors [16,20]. The nonlinear ionization phenomenon of soil under impulse current is a factor that must be considered in the calculation of impulse characteristics of grounding devices.
Reference [13] noted the practical challenge that essential, experimentally derived parameters—the critical soil breakdown field strength, residual resistivity coefficient, and resistivity attenuation coefficient—are notoriously difficult to acquire for direct engineering application. The authors developed a soil breakdown model incorporating spark effects and analyzed the influence patterns of these three parameters on impulse grounding resistance. To simplify calculations while accounting for the effects of soil dispersion, recommended parameter values were provided, and the impulse characteristics of vertical grounding bodies and needle-type grounding electrodes were analyzed. Reference [14] established a grounding device model considering soil ionization and comparatively analyzed the differences in surface potential distribution and electric field distribution in soil under impulse current before and after adding needle electrodes. The study demonstrated the following: The needle electrodes alter the local structure of the grounding device, which promotes spark effects and expands the current dispersion area. Experimental results verified the resistance-reducing effectiveness of the needle-type structure. Reference [15] investigated the impulse resistance reduction characteristics of needle-type conductors in grounding devices, analyzing the effects of tip enhancement and current shielding on electric field distribution. Through a combination of simulation and experiment, the study investigated the underlying mechanisms through which the length and spacing of needles govern the impulse resistance performance of grounding devices, and accordingly proposed optimization recommendations for these parameters.
To accurately characterize the impulse response of river-crossing grounding devices situated within complex soil environments, within the context of low-resistivity river regions, References [16,17] devised a spectrum of finite element models, including representations of vertically stratified, block-type, and river-elevation-dependent soil conditions. A quantitative analysis was conducted on the influence patterns of soil resistivity on both riverbanks and water depth on the current dispersion process and grounding resistance of the devices. The study concludes that water depth exhibits a strong correlation with the grounding device’s impulse performance, governing the resultant current dispersion pattern. For designing grounding devices in complex soil structures, it is recommended to adopt block-based soil models and elevation-difference models that account for actual water depth conditions. References [18,19] utilized a partitioned soil model distinguishing near-water-source zones (low soil resistivity) and far-water-source zones (high soil resistivity) to comparatively analyze the resistance reduction effects of different grounding device structures in plain and mountainous areas under varying soil resistivity and current frequency conditions. Based on the findings, optimized design schemes for grounding devices were proposed for different terrains. A gap in existing models is their oversimplified treatment of the genuine spatial heterogeneity inherent in soil moisture and resistivity.
For the grounding devices of river-crossing transmission towers, this paper first selects a specific environment with fixed influencing factors such as soil type and establishes a three-dimensional river–soil structure model that takes into account river depth and the elevation difference between the river surface and the ground. Furthermore, by employing Richards’ equation from unsaturated seepage theory, a coupled model integrating finite element method for soil seepage field and finite-difference time-domain method is constructed. This model obtains the spatial distribution of soil resistivity over long time scales. Within the seepage field model, the turbulent flow field of river velocity is simplified to a laminar flow field, and Bernoulli’s equation is employed to characterize the hydrostatic pressure field generated by the river water on the surrounding riverbanks and the riverbed substrate. This pressure field serves as the driving force for the seepage field. Finally, based on the spatially distributed soil resistivity calculated from the seepage field, this research adopts a spatial finite-element approach, governed by the electroquasistatic Maxwell’s equations, to model the complete impulse current dispersion process in the grounding device. This model is used to investigate the effects of river flow velocity, impermeable layers, and water depth on the magnitude of impulse grounding resistance, current density, and its distribution characteristics during current dispersion.
2. A Finite Element Model for the Impulse Characteristics of Grounding Devices Accounting for River Seepage Effects
2.1. Modeling the River Seepage Process
River water infiltrates soil pores through capillary action and surface tension, representing fluid flow in unsaturated porous media. The initial water saturation and hydraulic conductivity can be calculated using the Van Genuchten model. Based on the initial water potential and gravity, Richards’ equation is solved to update the water potential, water saturation, and hydraulic conductivity, thereby simulating the seepage process. Richards’ equation [21,22] is described as follows:
where ρ is the density of river water; Cm is the water capacity; Se is the saturation; S is the water storage coefficient; Hp is the pressure head; K is the hydraulic conductivity; g is the gravitational acceleration.
To analyze unsaturated flow and characterize the suction properties of soil under varying moisture conditions, the Van Genuchten model [23,24] is applied as follows:
where θ is the volumetric water content; θr is the residual liquid volume fraction of the soil; θs is the saturated liquid volume fraction of the soil; α, n, m are constitutive relationship constants of the model.
2.2. Mathematical Description of River Flow Process
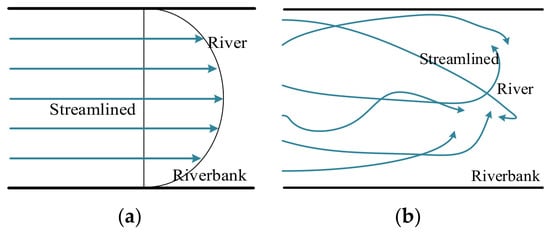
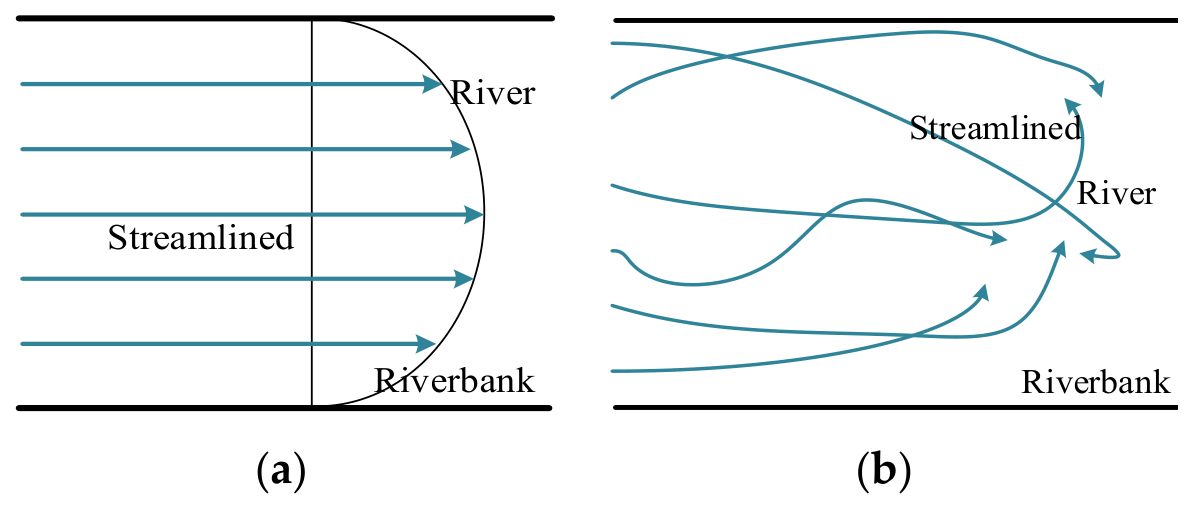
River flow velocity is influenced by multiple factors such as channel morphology, climate, and sediment concentration. When the flow velocity is low, fluid layers transition smoothly horizontally with minimal mixing, exhibiting distinct stratified flow characteristics known as laminar flow. When the flow velocity is high, streamlines within the river become intertwined, generating numerous vortices that disrupt the original laminar flow pattern. This flow state is referred to as turbulent flow, as illustrated in Figure 1.
Figure 1.
Schematic illustration of streamlines in slow-flowing and rapid-flowing rivers. (a) Schematic diagram of streamlines in a gentle river. (b) Schematic diagram of streamlines in a turbulent river.
British physicist Osborne Reynolds proposed using the Reynolds number to distinguish between laminar and turbulent flow regimes, as shown in Table 1. The Reynolds number in open channels is computed using the following expression:
where Re is the Reynolds number for open channels; v is the river flow velocity; L is the width of the open channel; μ is the dynamic viscosity of the fluid.
Table 1.
Criteria for Fluid Flow Regime Determination.
As a representative case, a river possessing a width of 40 m, a depth of 10 m, an average flow velocity of 0.5 m/s, and a water dynamic viscosity of 1 × 10⁻³ Pa·s is considered. The Reynolds number is calculated as 2 × 10⁷, which far exceeds the critical value for turbulent flow. Therefore, under normal conditions, rivers typically exhibit turbulent flow. In this state, the distribution of streamlines within the river becomes highly complex.
According to Bernoulli’s principle, the relationship between river flow velocity field and pressure field is given by Equation (4):
where p is the pressure at a given point in the fluid; v is the flow velocity at that point; h is the height of the point; C is a constant.
From Equation (1), it is evident that the soil seepage process depends solely on the pressure head Hp at the interface between the river and soil. Therefore, the velocity field within the river can be neglected, and only the influence of flow velocity at the soil-river interface on the seepage process need be considered. A laminar flow field simplification is adopted for calculating the river flow process.
2.3. Finite Element Model for Impulse Current Dispersion Process in Grounding Devices
After the pulse current is injected into the grounding device, it disperses through the grounding device into the soil, forming a conduction current density and electric field intensity; the relationship between them is . From Maxwell’s equations and the full current law, combined with the analysis of the physical process of lightning impulse current dispersion along the grounding device, it is known that the current in the soil includes impulse conduction current and displacement current. The conduction current density is , and the displacement current density is . It can be derived that the ratio of their absolute values is , where is the soil resistivity. Therefore, it is evident that the displacement current cannot be ignored during current dispersion. Soil is a non-magnetic medium; under lightning transients, the magnetic induction current is much smaller than the conduction current and displacement current. Therefore, the model neglects the magnetic induction term and adopts the electroquasistatic field equations to solve the time-varying current dispersion field in the soil. Introducing the electric potential and the electric field intensity , the potential distribution is governed by Laplace’s equation, which is determined jointly by the amplitude of the injected current, the electrode geometry, and the soil conductivity:
Boundary Conditions:
- (1)
- The potential at infinity is zero.
- (2)
- The normal current density at the ground surface is zero.
- (3)
- Conductor cross-sections with current injection satisfy:
- (4)
- Interfaces satisfy the continuity conditions for both electric potential and current density:
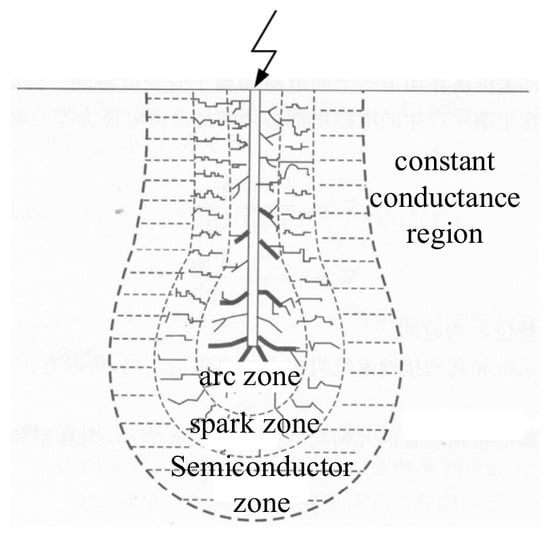
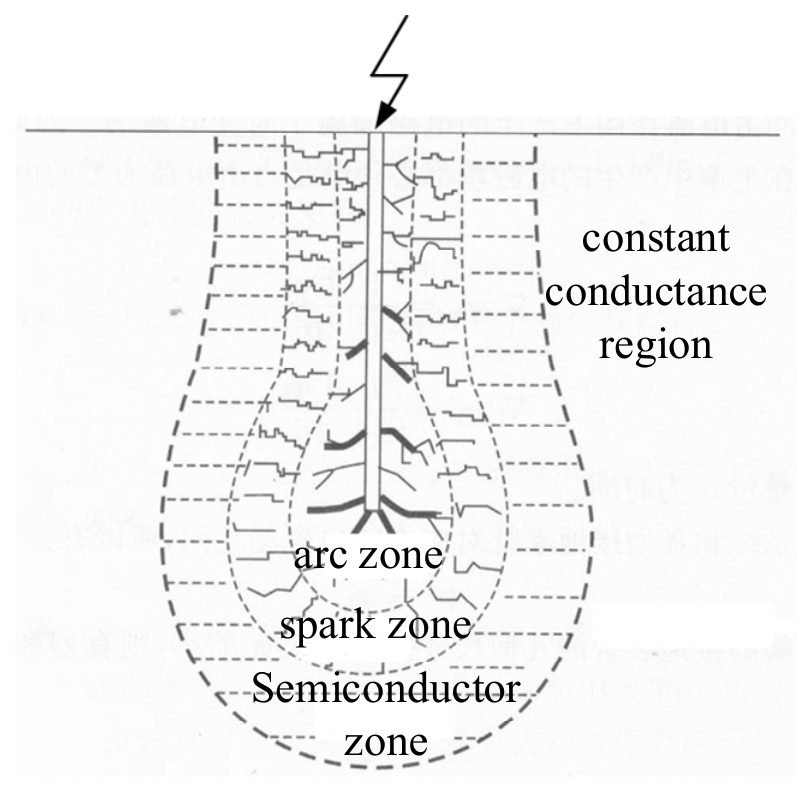
The soil ionization phenomenon induced by impulse current dispersion causes a four-zone distribution of soil resistivity near the grounding electrode: arc zone, spark zone, semiconductor zone, and constant conductivity zone [25,26], as illustrated in Figure 2.
Figure 2.
Zonal Distribution of Soil Resistivity Under Impulse Current Conditions.
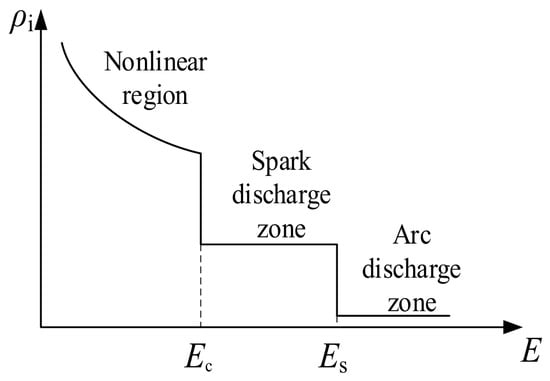
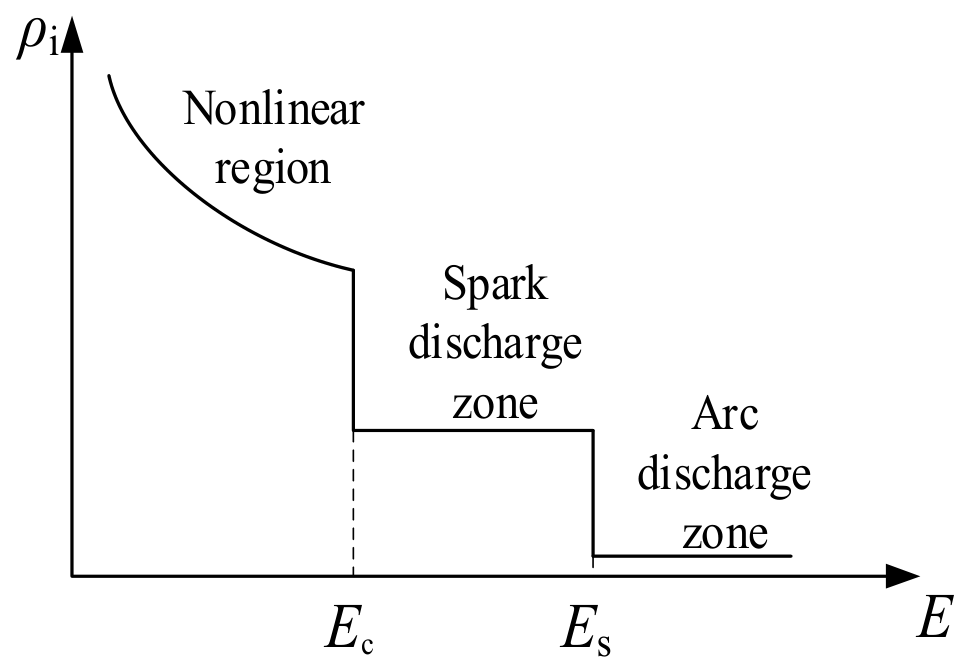
The relationship between instantaneous soil resistivity and electric field intensity is mathematically represented by a piecewise function, as illustrated in Figure 3 and formulated in Equations (10) and (11).
Figure 3.
Soil Resistivity Function.
In this formulation, ρi represents the instantaneous soil resistivity, ρs denotes the original soil resistivity, E indicates the local electric field intensity, Es stands for the critical electric field magnitude for arc formation, Ec the breakdown field strength magnitude in the spark region, and f(E) × ρs describes the electric-field-dependent resistivity function in the semiconductor zone [20].
2.4. Soil Structure Model
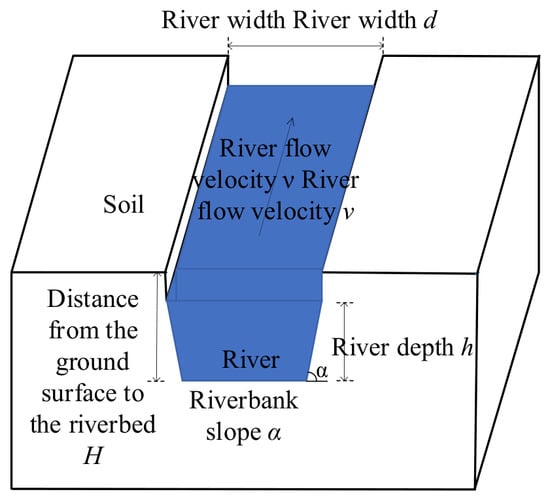
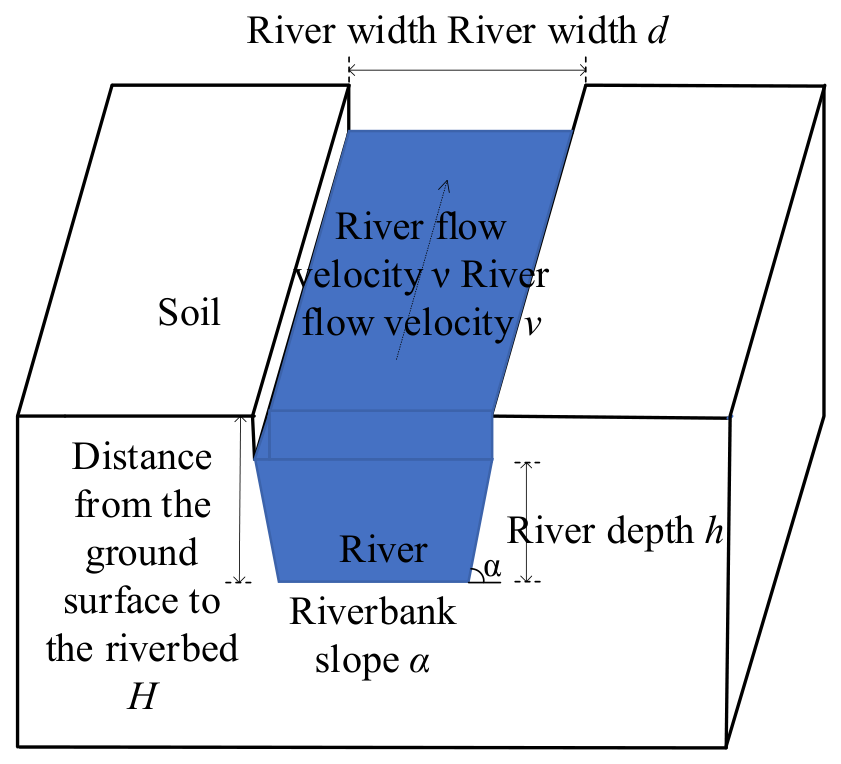
The primary objective of this work is to analyze the lightning impulse characteristics inherent to grounding devices for river-crossing transmission towers, a three-dimensional soil structure model is constructed, incorporating river depth h, riverbank slope angle α, river flow velocity υ, and riverbank surface elevation differences, as shown in Figure 4.
Figure 4.
Modeling of complex soil structure in riverine areas.
2.5. Multiphysics Coupling Between Seepage and Impulse Current Dispersion
2.5.1. Soil Resistivity and Moisture Saturation
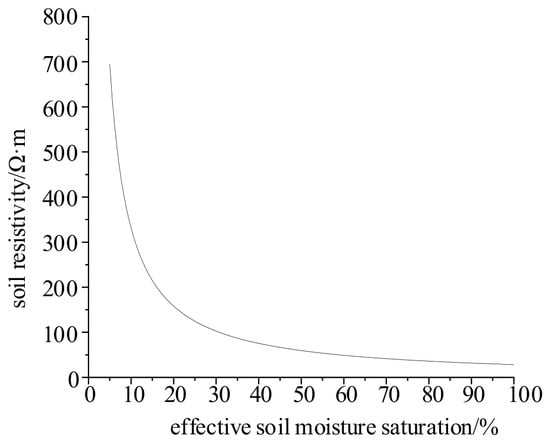
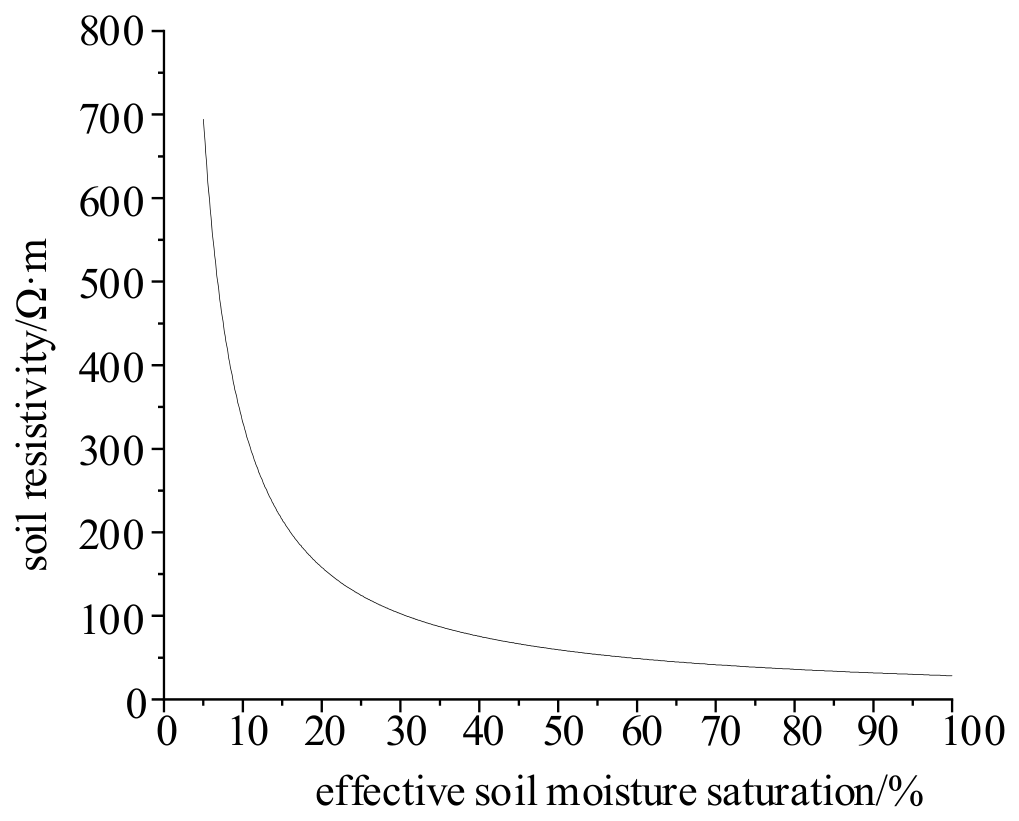
Soil resistivity is directly related to soil moisture saturation. The Archie model [27] provides the fundamental correlation between soil resistivity and moisture saturation, formulated as:
In this formulation, Sb represents the effective moisture saturation, while K and a are constants. Taking typical sandy loam soil as an example [28], the values of K and a are 38.67 and 1.067, respectively. The corresponding resistivity–saturation curve is illustrated in Figure 5.
Figure 5.
Resistivity–Saturation Curve for Sandy Loam Soil.
2.5.2. Instantaneous Soil Resistivity Under Seepage-Impulse Current Dispersion Coupling
To accurately calculate the instantaneous soil resistivity during lightning strikes on transmission towers, it is necessary to simultaneously consider both soil seepage and impulse current dispersion processes. The time scales of soil seepage and impulse current dispersion span hundreds of days and microseconds, respectively. The dynamic response of the instantaneous soil resistivity to both seepage-induced saturation changes and field-dependent ionization is captured by the expression:
3. Model Validation
This study validates the proposed coupled model by comparing its results with experimental data:
- (1)
- Full-scale power-frequency grounding resistance data for a square grounding device in riverside sandy soil.
- (2)
- Simulated data regarding the impulse grounding resistance of a star-shaped grounding device in high-resistivity soil.
3.1. Verification of Coupled Seepage and Diffuse Flow Grounding Characteristics Model
For grounding devices installed in highly porous sandy soil within river basins, Reference [29] measured the power-frequency grounding resistance. Table 2 lists the parameters characterizing the soil structure, with a square grounding device measuring 15 m inside length and buried at a depth of 0.8 m. Each corner of the square features a 19.5 m long vertical grounding electrode. A comparison of the model-calculated results against experimental measurements is presented in Table 3, showing a maximum deviation within 9%, which validates the effectiveness of the model. The error arises from the uncertainty in measurement.
Table 2.
Soil Parameters.
Table 3.
Power-frequency grounding resistance at different distances between the grounding device and the river channel.
3.2. Model Verification of Impulse Current Dispersion
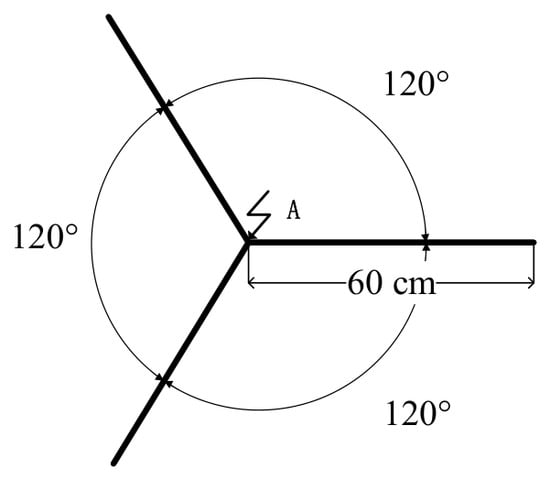
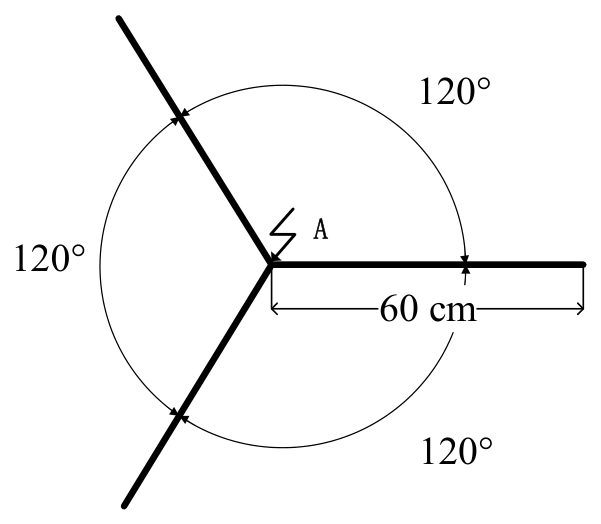
The star-shaped grounding electrode shown in Figure 6 is established using the aforementioned algorithm. The grounding electrode was configured with a 10 mm cross-sectional radius, a material resistivity of 1.7 × 10⁻⁷ Ω·m, and was installed at a burial depth of 1 m. The uniform soil resistivity is 1 × 10³ Ω·m. An 8/20 μs impulse current with amplitudes of 4.2 kA, 6.72 kA, 9.6 kA, and 13.52 kA is injected [30].
Figure 6.
Schematic diagram of star-shaped grounding electrode.
A comparison of the impulse grounding resistance calculated in this study against the simulation results reported in Reference [30] is summarized in Table 4 for different current amplitudes. The maximum deviation of 9.37% occurs at an impulse current amplitude of 13.52 kA. Considering the randomness inherent in the testing process and soil spark effects, the results are deemed valid.
Table 4.
Comparison of Calculated and Experimental Results of Impulse Grounding Resistance for Star-Shaped Grounding Electrodes.
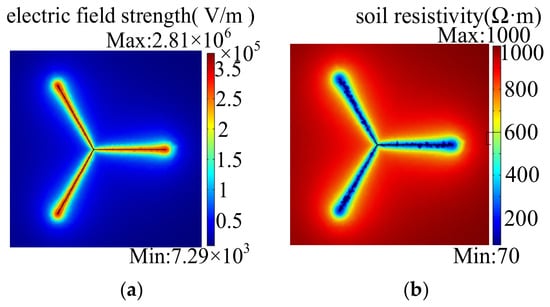
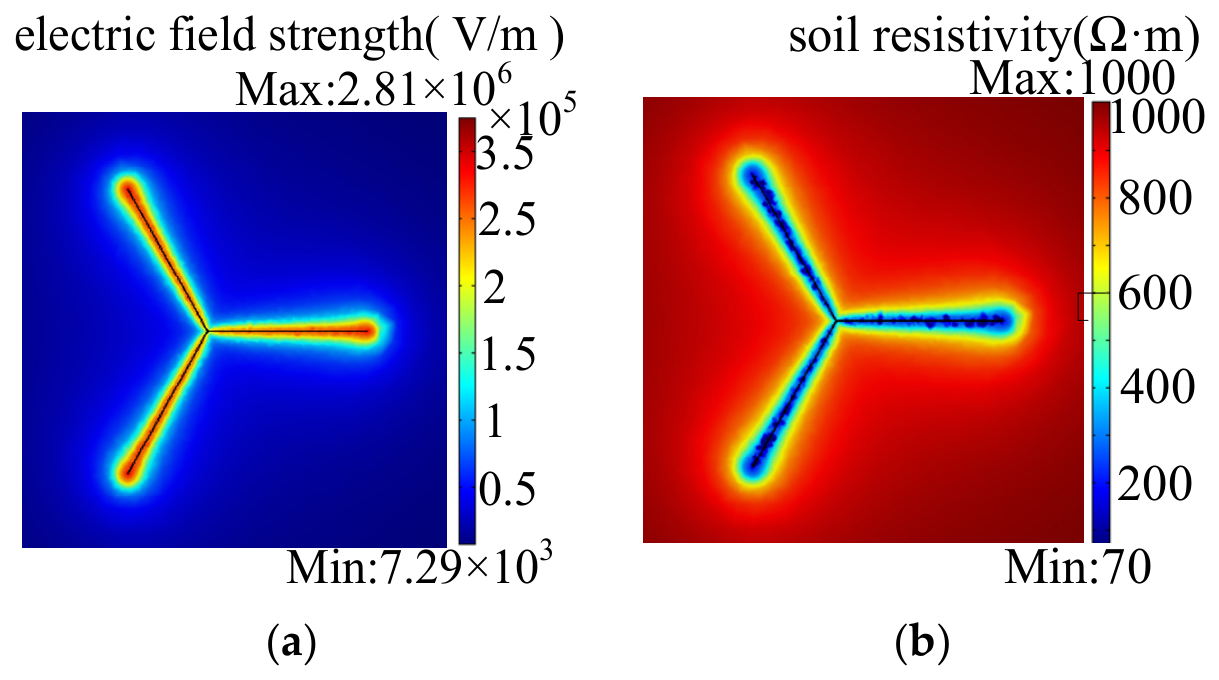
Figure 7 visualizes the subsurface electric field and resistivity patterns at a 1 m depth, induced by an impulse current amplitude of 6.72 kA. At the current peak, the electric field intensity near the electrode reaches a maximum of 2.81 × 10⁶ V/m, which exceeds the soil’s critical breakdown strength of 3 × 10⁵ V/m [26]. This triggers soil ionization, causing the local resistivity to plummet from 1 × 10³ Ω·m to 70 Ω·m (7% of its original value) and forming a spark discharge zone with a volume of 1.55 m3.
Figure 7.
Distribution of electric field intensity and resistivity at the peak moment of 6.72 kA current amplitude. (a) Electric field intensity distribution. (b) Resistivity distribution.
4. Impact of River Flow Velocity on the Impulse Current Dispersion
This study established a simulation framework analyzing flow velocity effects (0–10 m/s) on impulse current dispersion. The model incorporated a square grounding grid (10 m × 10 m) composed of 10 mm diameter round steel bars with electrical resistivity of 3.25 × 10⁻⁵ Ω·m, installed at 1 m depth and positioned 15 m from the river. The subsurface was characterized by soil resistivity of 500 Ω·m, porosity of 36%, saturated and residual water contents of 21.3% and 7% respectively, and permeability of 1 × 10⁻⁸ m−2. River water resistivity was set at 30 Ω·m with 3 m surface elevation variation. Excitation was provided by a 50 kA (2.6/50 μs) impulse current injected at a quadrilateral terminal.
4.1. Analysis of River Flow Velocity Effects on Seepage Processes
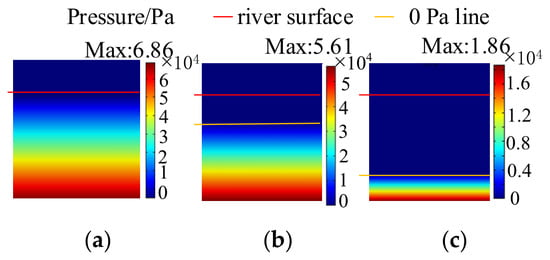
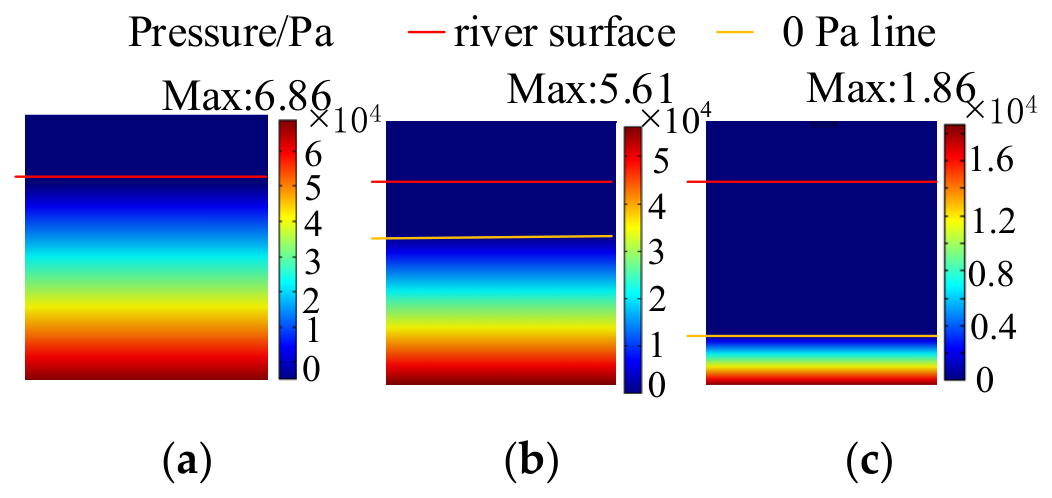
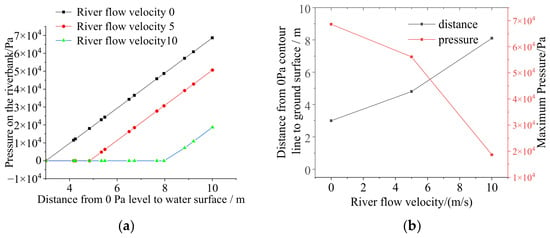
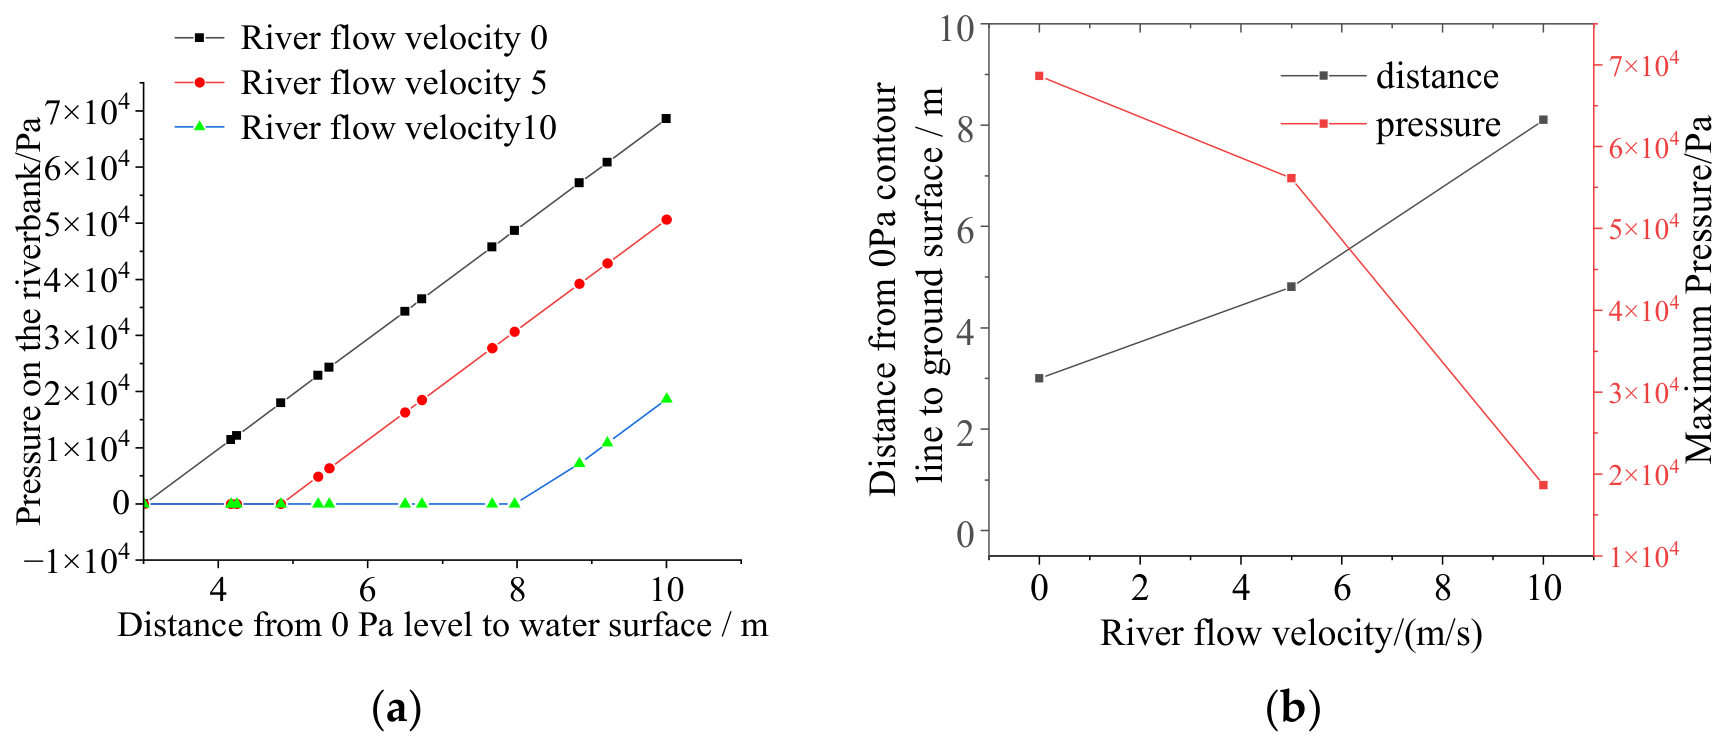
Figure 8 presents the pressure distribution at the interface between the river water and riverbank soil under different flow velocities of 0 m/s, 5 m/s, and 10 m/s. Pressure values were extracted along a vertical line from the river surface at the interface between the river water and the bank. The resulting curves showing how bank pressure varies with depth at three flow velocities are depicted in Figure 9. Figure 8 and Figure 9 show that when the flow velocity is 0 m/s, the force on the riverbank above the water surface is 0 Pa. The 0 Pa line aligns with the water surface, while the pressure on the riverbank below the water surface corresponds to the hydrostatic pressure. The pressure distribution exhibits a linear relationship with depth, reaching a maximum value of 6.86 × 10⁴ Pa at the riverbed. At a flow velocity of 5 m/s, the 0 Pa line shifts downward to 1.28 m below the river surface. The hydrostatic pressure exerted on the riverbank between the 0 Pa line and the river surface is relieved to zero by the flow velocity. Below the 0 Pa line, the hydrostatic pressure on the riverbank exhibits a linear increase with water depth, attaining its maximum value of 5.61 × 10⁴ Pa at the riverbed. At a flow velocity of 10 m/s, hydrostatic pressure is relieved by flow velocity within the 5.10 m zone below the river surface. The 0 Pa line is located 5.10 m below the river surface. Below this zone, the hydrostatic pressure on the riverbanks exhibits a linear increase with water depth, attaining its maximum value of 1.86 × 10⁴ Pa at the riverbed.
Figure 8.
Pressure distribution along riverbank under different flow velocities: (a) 0 m/s flow velocity; (b) 5 m/s flow velocity; (c) 10 m/s flow velocity.
Figure 9.
Relationship between pressure on riverbanks and river flow velocity. (a) Pressure on the riverbank. (b) Position of the 0 Pa Line and Maximum Pressure on the Riverbank.
In summary, the river flow velocity alters the pressure at the interface between the river water and the riverbank soil. As the flow velocity increases, the pressure decreases. According to Equations (1) and (2), a reduction in pressure leads to a decrease in the extent of river water infiltration. Moreover, the influence becomes more pronounced with higher flow velocities.
4.2. Flow Velocity Effect on Impulse Current Dispersion with an Impermeable Layer
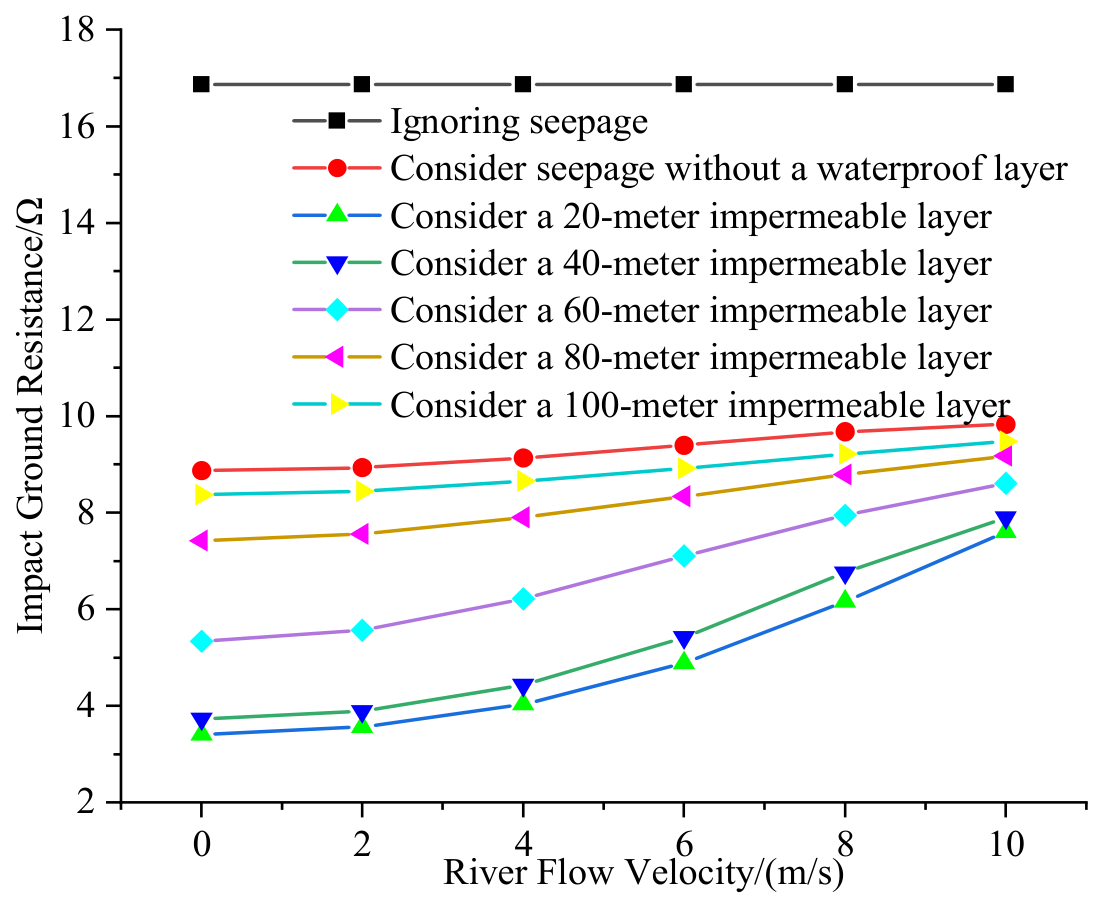
In geological formations, rock or soil layers with extremely low permeability (such as dense clay, mudstone, or intact bedrock) can effectively prevent the seepage or flow of groundwater (impermeable layers). To simulate the presence of an impermeable layer in actual soil conditions, the river parameters were configured as follows: depth of 7 m; a 3 m elevation differential between the water surface and ground; and flow velocities spanning 0 to 10 m/s. An analysis of the impulse grounding resistance was performed for three specific scenarios: (1) without considering seepage; (2) considering seepage without an impermeable layer; (3) considering seepage with an impermeable layer (depth:20–100 m). The results are shown in Figure 10.
Figure 10.
Impulse grounding resistance of the grounding device under different flow velocities.
4.2.1. Impact of Flow Velocity and Aquitard on Impulse Grounding Resistance
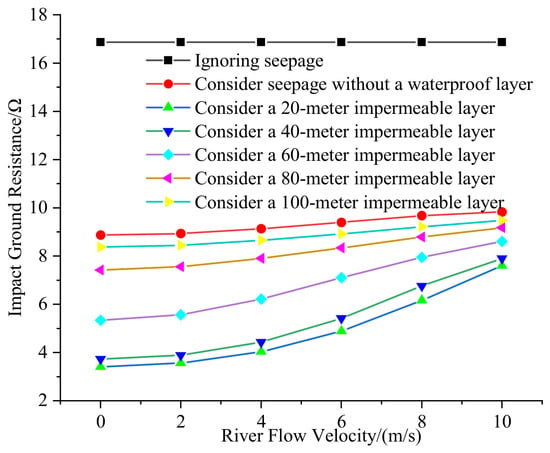
As shown in Figure 10, when seepage from the river into the soil on both banks is not considered, the impulse grounding resistance remains constant at 16.872 Ω, unaffected by the river flow velocity. When seepage from the river into the soil on both banks is considered without an impermeable layer, the low-resistivity zone formed by seepage primarily extends downward into deeper regions, with the soil structure approximating a vertically layered configuration. Simultaneously, it partially extends laterally to both sides. Simulation results demonstrate a definitive decrease in impulse grounding resistance when seepage is modeled, yielding values between 8.875 Ω and 9.632 Ω, in contrast to the significantly higher resistance predicted without it. As the river flow velocity increases, the pressure on the riverbank decreases, leading to a reduction in soil seepage. This results in an increase in the impulse grounding resistance, which gradually tends toward saturation. The low-resistivity zone formed by seepage primarily extends downward, and the impulse grounding resistance exhibits a weak correlation with the flow velocity.
When seepage from the river into the soil on both banks is considered in the presence of an impermeable layer, the low-resistivity zone formed by seepage tends to expand laterally along both sides of the river due to the obstruction of downward seepage by the impermeable layer. Under these conditions, the impulse grounding resistance is further reduced compared to the case without an impermeable layer. Moreover, the shallower the impermeable layer, the stronger its restraining effect on vertical seepage and the more it promotes lateral seepage, resulting in a lower impulse grounding resistance. Compared with the case without an impermeable layer, the weakening effect of riverbank pressure reduction on seepage intensity is more significant under the lateral seepage mode; therefore, the impulse grounding resistance exhibits a pronounced upward trend with increasing seepage velocity.
4.2.2. Impact Analysis of Flow Velocity on Subsurface Electric Field Intensity and Soil Resistivity
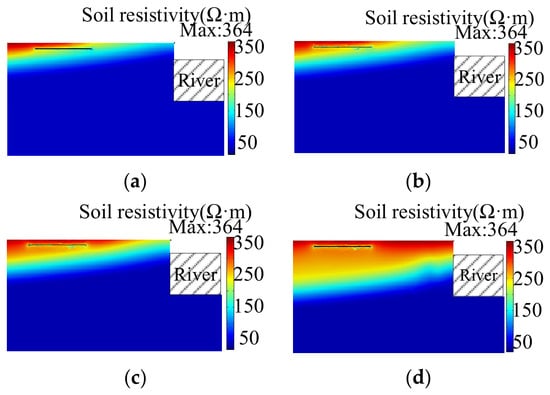
To isolate the role of river flow in the seepage-dispersion mechanism, the impermeable layer was fixed at 60 m depth, creating a controlled basis for analyzing velocity effects on grounding performance. Figure 11 illustrates the evolution of soil resistivity distribution near the grounding device and the riverbank in response to increasing flow velocities from 0 m/s to 10 m/s.
Figure 11.
Resistivity distribution near the grounding device under different flow velocities. (a) Resistivity distribution at 0 m/s flow velocity. (b) Resistivity distribution at 4 m/s flow velocity. (c) Resistivity distribution at 6 m/s flow velocity. (d) Resistivity distribution at 10 m/s flow velocity.
As shown in Figure 11, seepage leads to an increase in soil moisture content, resulting in a distinct low-resistivity zone (below 100 Ω·m) beneath and on both sides of the river. The soil resistivity surrounding the shallow-depth grounding device exhibits a reduction from an initial 500 Ω·m to approximately 300 Ω·m, with a laterally asymmetric pattern evident between its two sides. Additionally, the impulse dispersion process creates a localized ionized zone with low resistivity near the grounding device.
As the river flow velocity increases from 0 m/s to 10 m/s, the pressure on the riverbank decreases, leading to a reduction in lateral seepage. As a result, a significant enlargement of the relatively high-resistivity region is observed, accompanied by a corresponding rise in the soil resistivity around the grounding device. The difference in resistivity between the left and right sides of the device also decreases. At zero flow velocity, the soil resistivity on the two sides of the grounding device ranges from 169.7 Ω·m to 255.1 Ω·m, showing a noticeable difference. At flow velocities of 4 m/s, 6 m/s and 10 m/s, the resistivity on the two sides varies from 216.8 Ω·m to 273.1 Ω·m, from 256.1 Ω·m to 276.3 Ω·m, and from 272.2 Ω·m to 277.4 Ω·m, respectively.
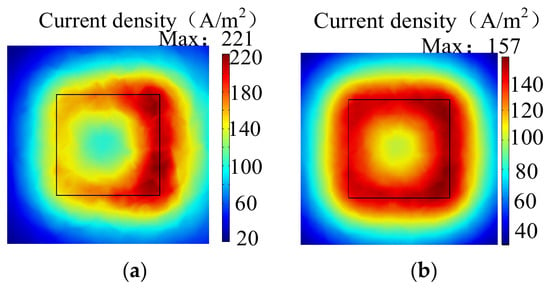
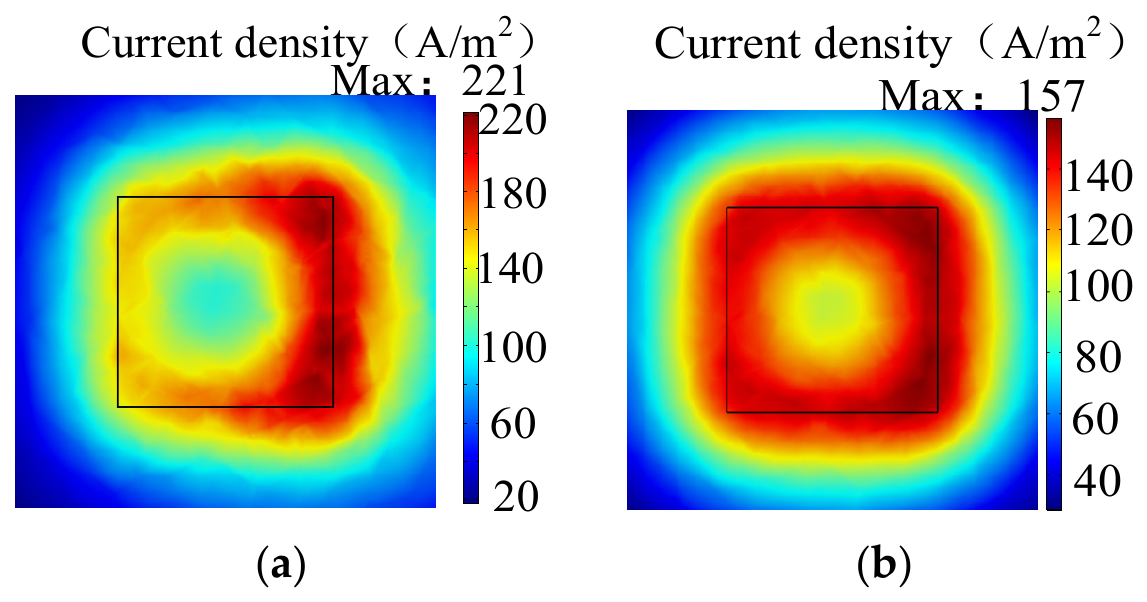
Increasing river flow velocity (0–10 m/s) induces soil electrical anisotropy, redirecting ground current at 3 m depth toward the lower-resistivity riverbank (Figure 12). At zero flow velocity, a significant difference in current density is observed on the two sides of the device, with maxima of 147.4 A/m2 and 201.1 A/m2, respectively, resulting in a difference of 53.7 A/m2. As the flow velocity increases, the current density distribution gradually becomes more uniform. When the flow velocity reaches 10 m/s, the maximum current densities on the two sides reach 150.4 A/m2 and 157 A/m2, respectively.
Figure 12.
Current density distribution near the grounding device under different flow velocities (aquitard depth: 60 m). (a) Current density distribution at 0 m/s. (b) Current density distribution at 10 m/s.
4.2.3. Impact Analysis of Aquitards on Subsurface Electric Field Intensity and Soil Resistivity
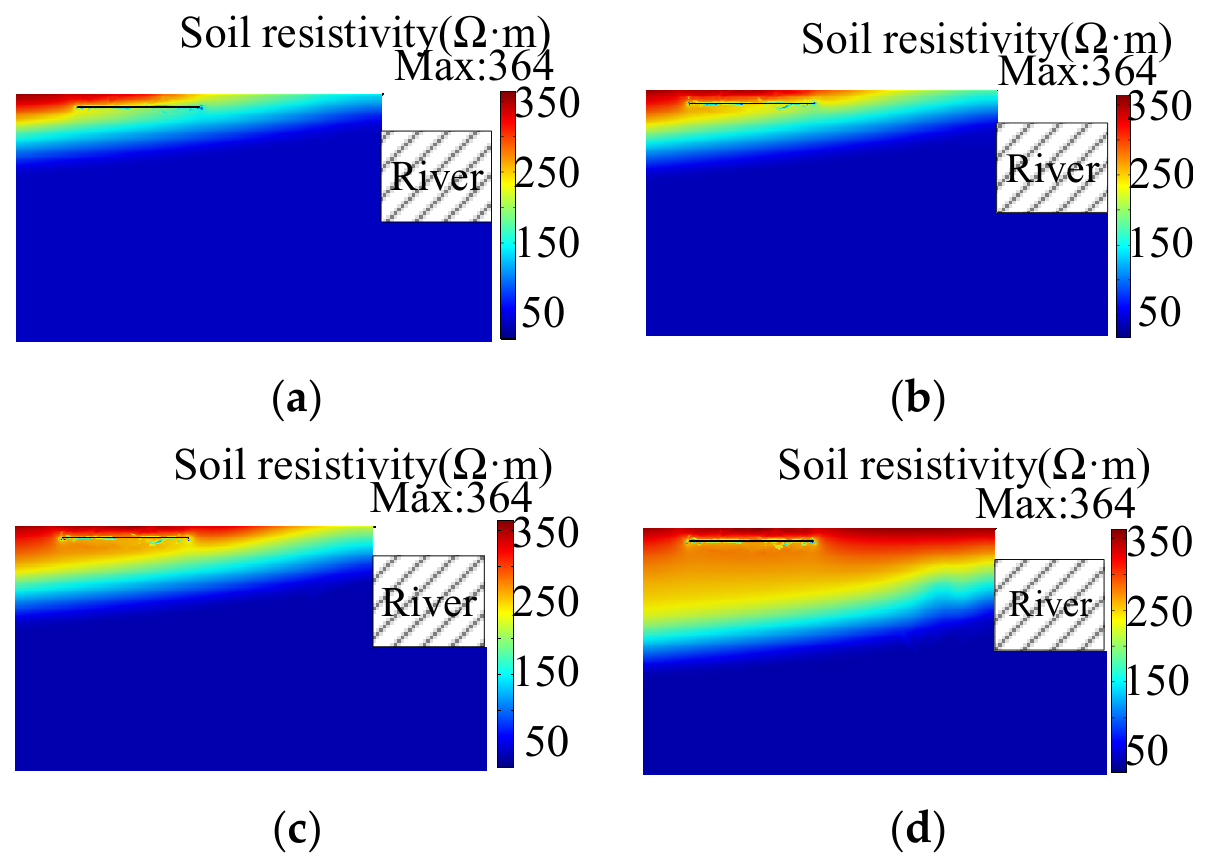
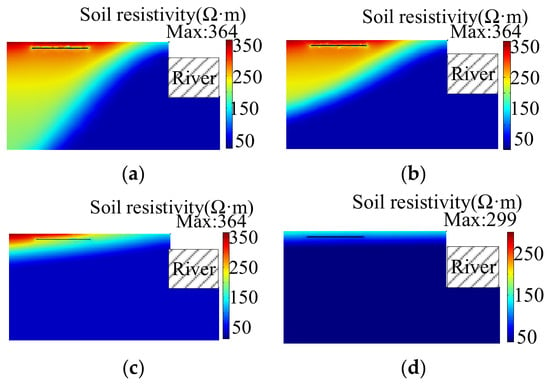
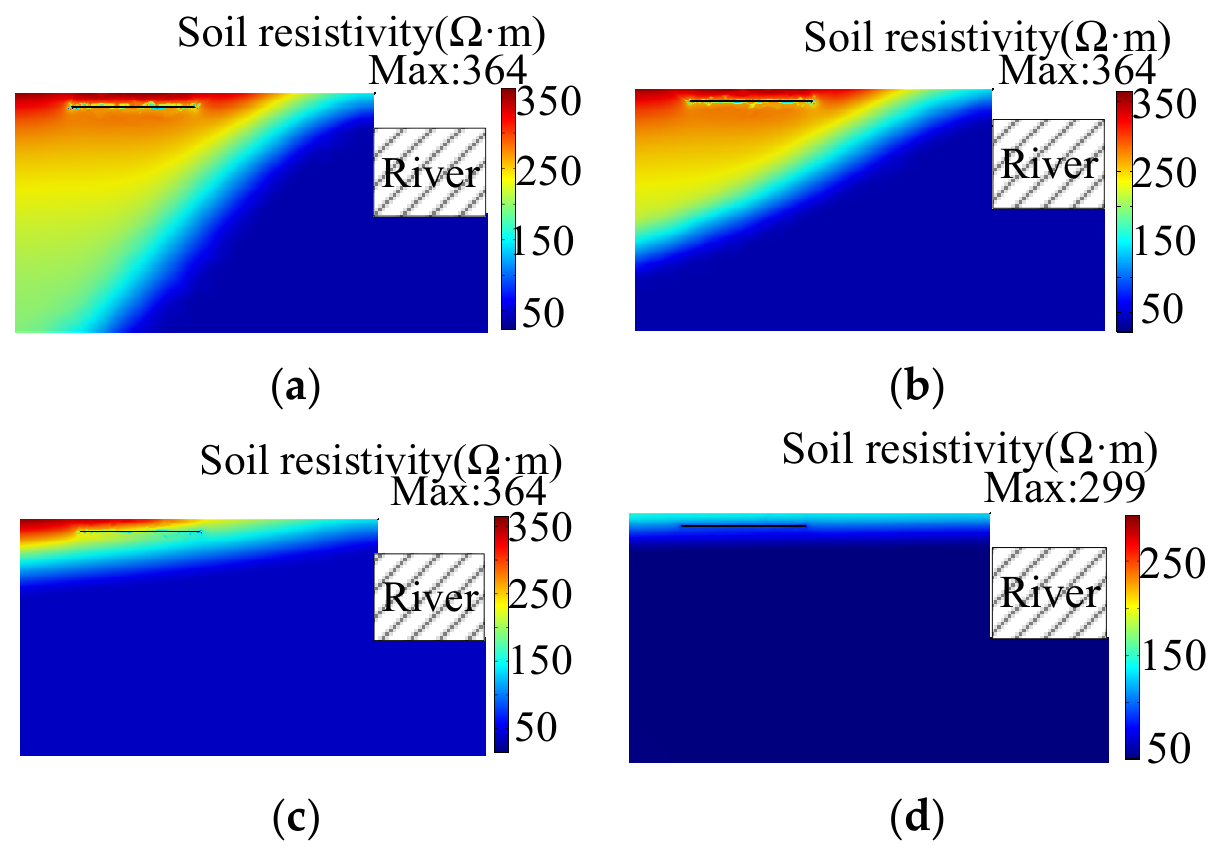
To analyze the influence of the impermeable layer depth on seepage and the dispersion process of the grounding device, the soil resistivity distribution near the grounding device was extracted under the following conditions: a river flow velocity of 0 m/s, with no impermeable layer, and with impermeable layers located at depths of 100 m, 60 m, and 20 m below ground. The results are shown in Figure 13.
Figure 13.
Resistivity distribution near the grounding device under different impermeable layer depths. (a) No impermeable layer. (b) Impermeable layer at 100 m depth. (c) Impermeable layer at 60 m depth. (d) Impermeable layer at 20 m depth.
The impermeable layer obstructs the downward seepage of river water, causing the low-resistivity zone formed by seepage to expand laterally along both sides of the river. The shallower the depth of the impermeable layer, the stronger its obstruction of vertical seepage and the more it promotes lateral expansion. When the impermeable layer is omitted, the soil resistivity in the immediate vicinity of the grounding device remains nearly uniform at a value of approximately 277.7 Ω·m. With the impermeable layer positioned at 100 m depth, the soil resistivity near the grounding device remains largely uniform but exhibits only a minor reduction to approximately 273.3 Ω·m. With the impermeable layer at 60 m depth, the soil resistivity exhibits a distinct asymmetric pattern around the grounding device: approximately 169.7 Ω·m on the river-facing side versus 255.1 Ω·m on the opposite side, demonstrating a clear lateral expansion of the conductive zone. At a depth of 20 m, the low-resistivity soil almost fully encapsulates the grounding device, creating a largely homogeneous low-resistivity environment with a value of approximately 95.7 Ω·m.
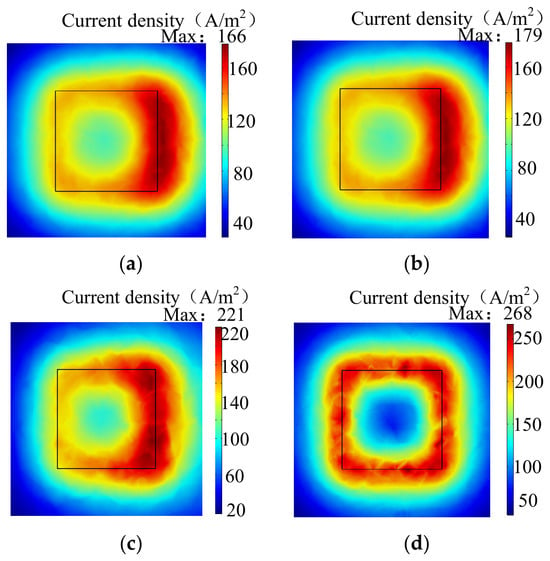
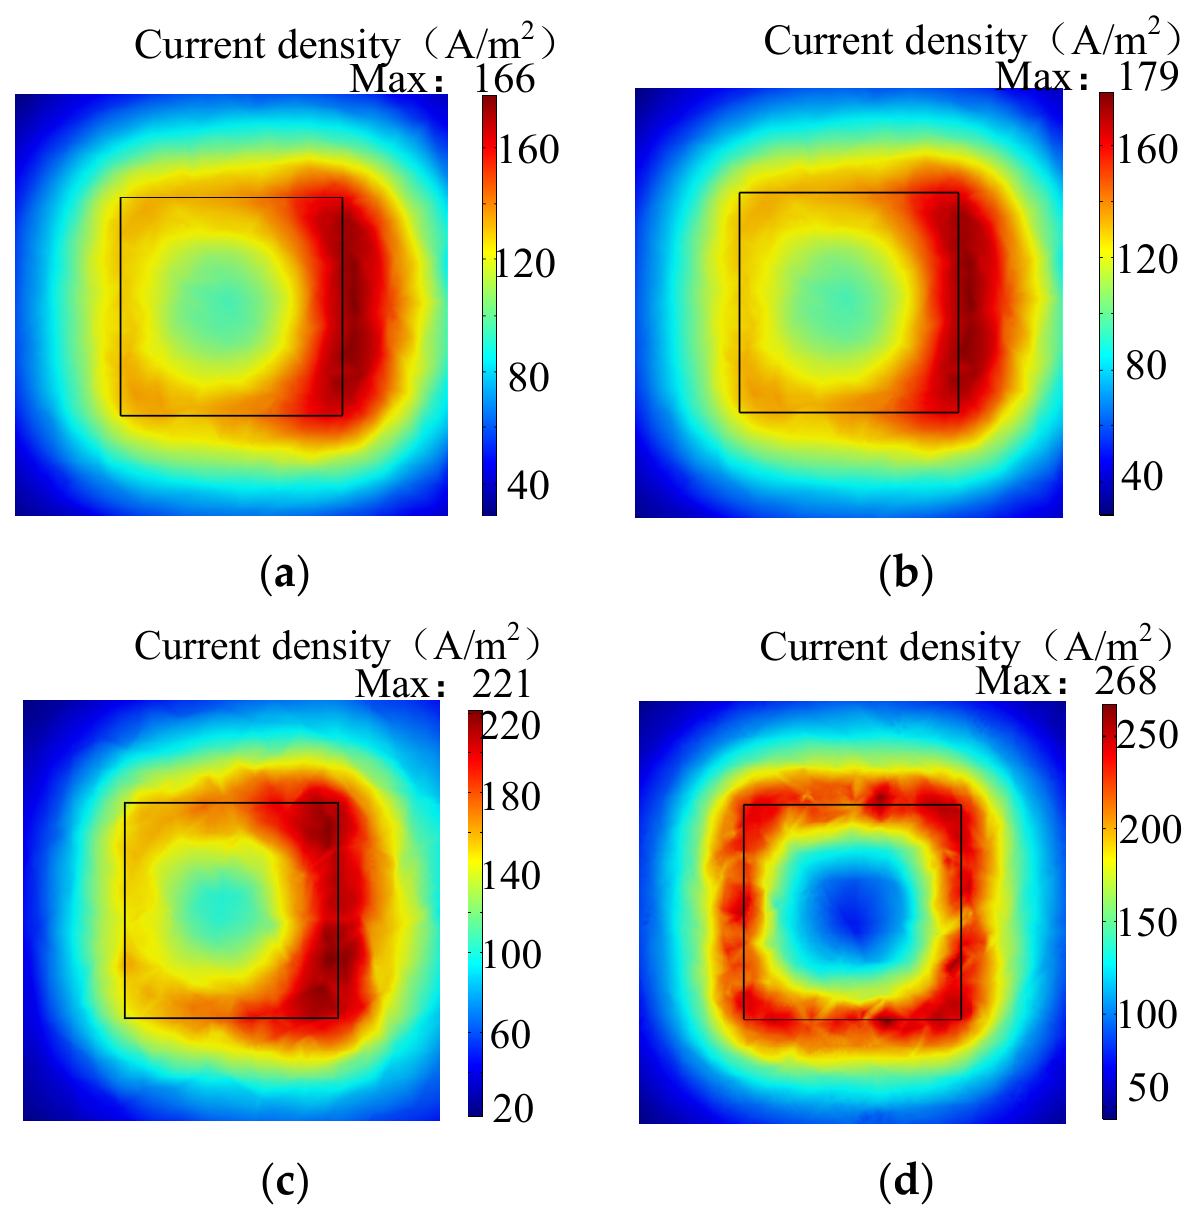
The current density distribution at a depth of 3 m below the grounding device under hydrostatic pressure conditions and different impermeable layer configurations (no impermeable layer, 100 m depth, 60 m depth, 20 m depth) is extracted as shown in Figure 14. Due to differences in soil resistivity, the ground current consistently disperses preferentially toward the river side of the grounding device, where resistivity is lower. When no impermeable layer is present, the maximum current densities on the two sides of the grounding device are 161.1 A/m2 and 123.6 A/m2, respectively. With an impermeable layer at 100 m depth, the values are 170.7 A/m2 and 129.6 A/m2. At 60 m depth, the current densities reach 201.1 A/m2 and 147.4 A/m2. When the impermeable layer is at 20 m depth, the difference in current density between the two sides is small, with values of 159.7 A/m2 and 159.4 A/m2, respectively.
Figure 14.
Current density distribution near the grounding device under different impermeable layer depths. (a) Current density distribution without impermeable layer. (b) Current density distribution with impermeable layer at 100 m depth. (c) Current density distribution with impermeable layer at 60 m depth. (d) Current density distribution with impermeable layer at 20 m depth.
In summary, the impermeable layer obstructs the downward seepage of river water, promoting the lateral expansion of a low-resistivity zone with high moisture content along both sides of the river, thereby reducing the soil resistivity in these areas. The lightning current preferentially selects a conduction path through the riverside soil adjacent to the grounding device, consequently lowering the overall impulse grounding resistance. Therefore, in the design of grounding devices for river-crossing transmission towers, the effects of river seepage should be taken into account. Both river flow velocity and the depth of the impermeable layer significantly influence the extent of seepage and the current dispersion characteristics of the grounding device.
5. Analysis of Soil Structure Effects on Impulse Current Dispersion Process
Variations in river depth drive the reconstruction of the pressure head gradient, which governs the evolution characteristics of the seepage field. The focus of this section is to reveal its role and the associated mechanism in determining the grounding device’s efficiency.
5.1. Impact of River Depth on Impulse Current Dispersion with an Impermeable Layer
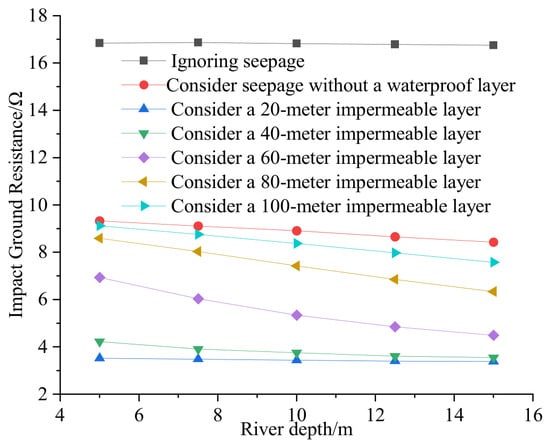
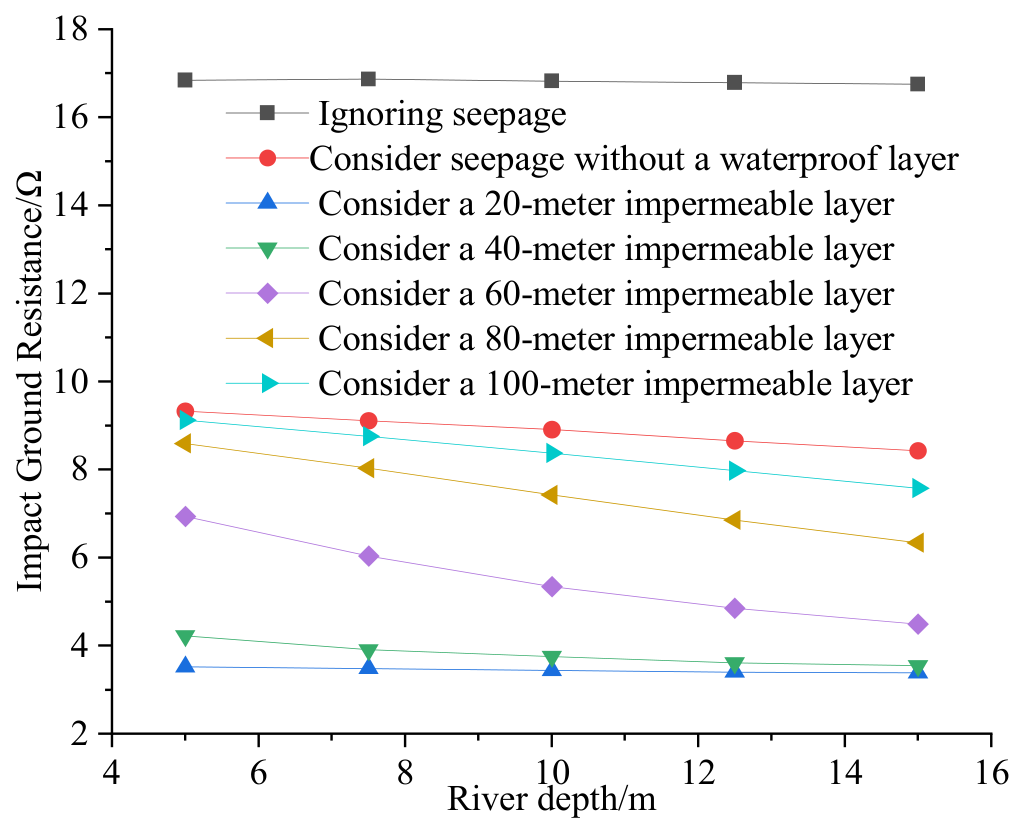
The impulse grounding resistance was calculated across a range of river depths (5–15 m) under three specific scenarios, given a 3 m river-to-ground elevation difference and hydrostatic pressure conditions: without considering seepage, considering seepage without an impermeable layer, and considering seepage with an impermeable layer (depth: 20 m–100 m). The calculation results are shown in Figure 15.
Figure 15.
Impulse grounding resistance of the grounding device under different river depth condition.
5.2. Analysis of the Impact of River Depth and Impermeable Layer on Impulse Grounding Resistance
Figure 15 illustrates that in the absence of river-to-soil seepage, an increase in water depth from 5 m to 15 m results in a larger volume of river water within the low-resistivity zone associated with the grounding device. This leads to a marginal decrease in impulse grounding resistance from 16.841 Ω to 16.748 Ω, representing a minimal reduction of 0.55%.
The presence of an impermeable layer during seepage induces the formation of a soil profile characterized by quasi-vertical stratification. The impulse grounding resistance demonstrates a significant reduction compared to the non-seepage case, declining from 9.327 Ω to 8.433 Ω as river depth increases. With greater river depth, the enhanced pressure-area coupling effect along the riverbank intensifies the seepage, further reducing the impulse grounding resistance. River depth is not a dominant factor governing the value of the impulse grounding resistance.
Under seepage conditions with an impermeable layer, the impermeable layer restricts the downward seepage of river water, causing the low-resistivity zone formed by seepage to expand laterally along both sides of the river. The presence of the impermeable layer thereby yields a lower impulse grounding resistance compared to the scenario where it is absent. An increase in river depth amplifies the pressure–area coupling along the bank, thereby promoting more intense seepage and ultimately lowering the impulse grounding resistance. However, due to the nonlinearity of the soil resistivity–saturation curve (Figure 5), an inverse relationship exists between the depth of the impermeable layer and the influence gradient of water depth on resistance, with shallower layers causing a more rapid spatial attenuation of this effect.
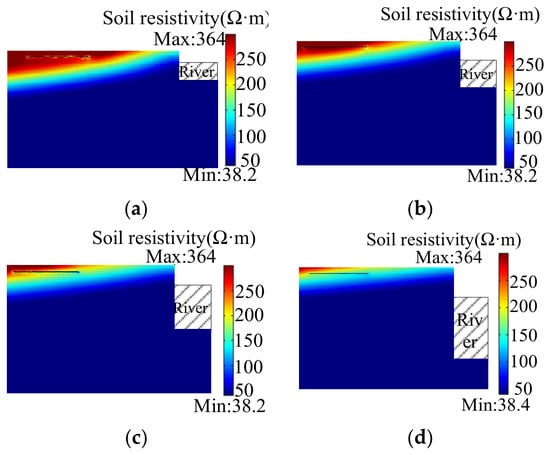
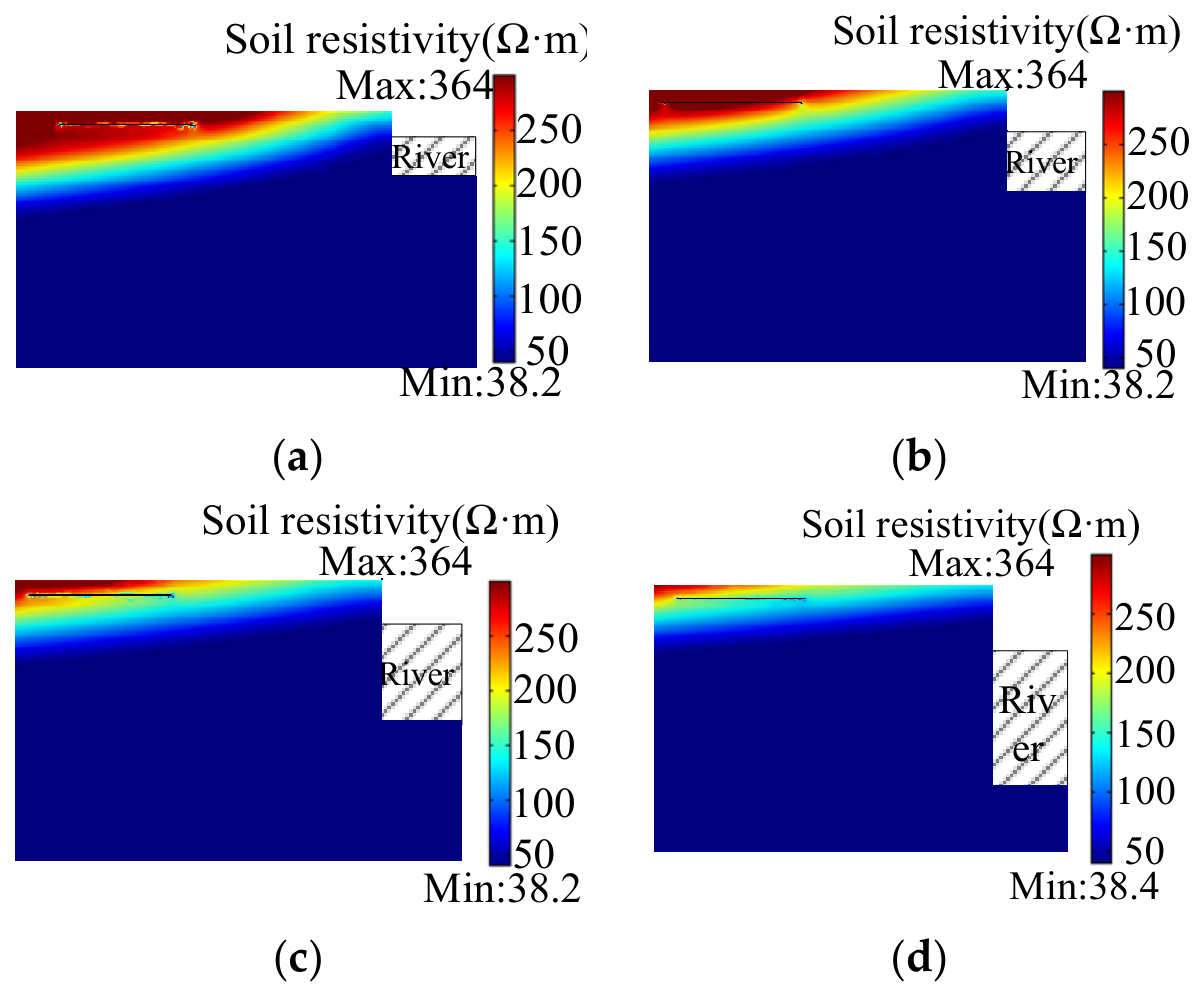
The resistivity distribution around the grounding device and river was investigated for increasing river depths (5 to 15 m) under a 60 m impermeable layer and hydrostatic pressure. The resulting distributions are presented in Figure 16.
Figure 16.
Soil resistivity distribution at different river depths. (a) Resistivity distribution at 5 m river depth. (b) Resistivity distribution at 7.5 m river depth. (c) Resistivity distribution at 10 m river depth. (d) Resistivity distribution at 15 m river depth.
As shown in Figure 16, the increase in river depth elevates the hydrostatic pressure at the riverbank, enhancing seepage intensity. However, due to the presence of the impermeable layer, vertical infiltration is hindered, promoting lateral expansion of river water. This results in an enlarged low-resistivity zone in the soil on both sides of the riverbank. When the river depth increases from 5 m to 15 m, the soil resistivity on the two sides of the grounding device is approximately 252 Ω·m and 276.6 Ω·m, and 137.3 Ω·m and 192.5 Ω·m, respectively.
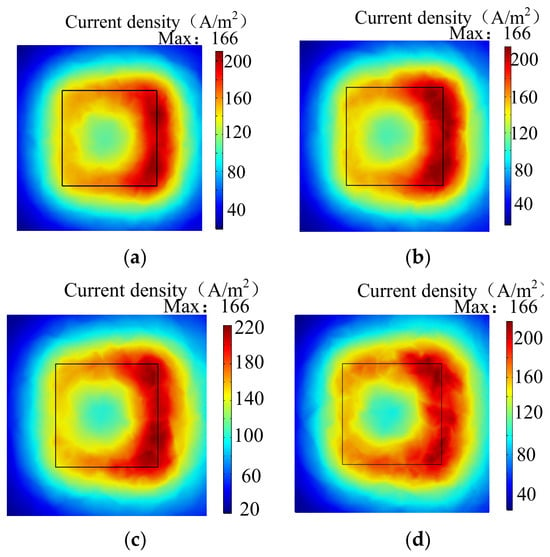
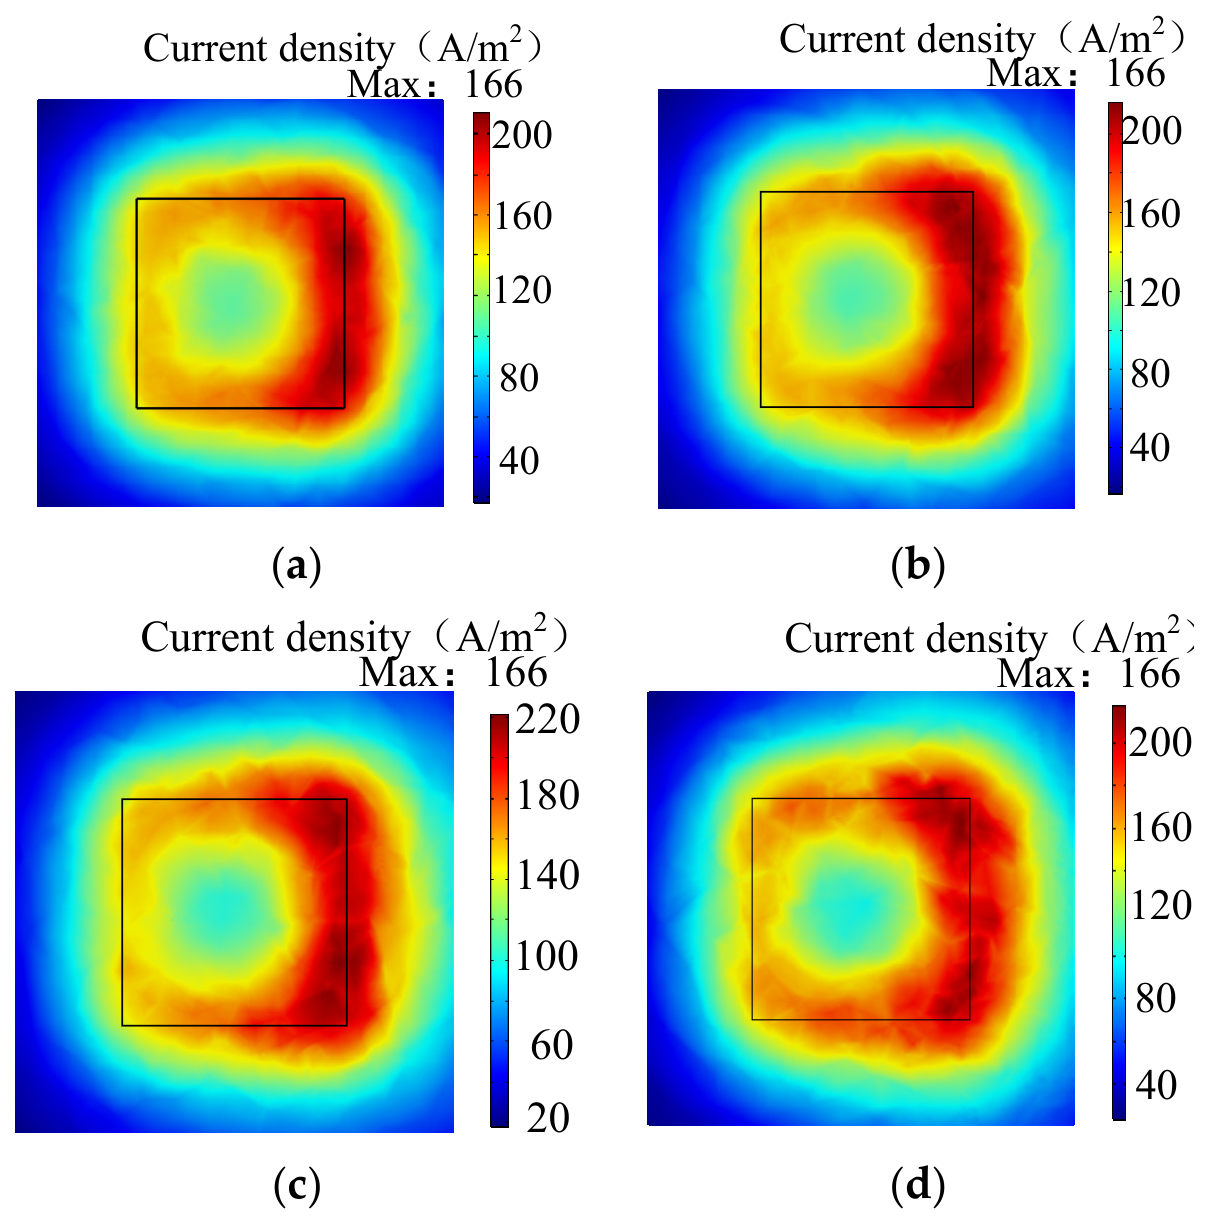
Figure 17 presents the extracted current density at a 3 m depth beneath the grounding device, revealing a pronounced difference between its two sides due to soil resistivity heterogeneity. As the river depth increases from 5 m to 15 m, the maximum current densities on the respective sides rise from 141.9 A/m2 and 195.3 A/m2 to 148.7 A/m2 and 200.3 A/m2.
Figure 17.
Current density distribution under different river depth conditions. (a) Current density distribution at 5 m river depth. (b) Current density distribution at 7.5 m river depth. (c) Current density distribution at 10 m river depth. (d) Current density distribution at 15 m river depth.
In summary, both river depth and the position of the impermeable layer regulate the processes of seepage and current dispersion. Therefore, in the site selection for cross-river transmission towers, comprehensive consideration should be given to water depth and the geological characteristics of the impermeable layer.
6. Conclusions
This study investigates the scenario of lightning strikes on cross-river transmission towers. Based on a coupled model of soil seepage and current dispersion, we analyze the effects of river flow velocity, bank slope, water depth, and impermeable layers on the seepage and impulse dispersion processes. The results demonstrate that the impulse grounding resistance of the grounding device is significantly lower when seepage is considered compared to when it is neglected. It is concluded that:
- (1)
- An increase in river flow velocity weakens the seepage effect and partially counteracts the hydrostatic pressure exerted by the river on the bank. As a result, the depth of the 0 Pa line shifts downward from the water surface, reducing both the pressure on the riverbank and the intensity of seepage. This, in turn, leads to an increase in soil resistivity and the impulse grounding resistance of the grounding device.
- (2)
- The impermeable layer inhibits vertical seepage while promoting lateral seepage. The shallower its burial depth, the lower the soil resistivity and the impulse grounding resistance of the grounding device. Conversely, an increase in river depth enhances bank pressure and seepage intensity, thereby reducing soil resistivity and the impulse grounding resistance of the grounding device.
Therefore, the design and site selection of grounding devices for cross-river transmission towers must comprehensively consider factors such as river flow velocity, depth, and the presence of impermeable layers to ensure the safe operation of the power system.
Author Contributions
Conceptualization, J.L. and X.C.; methodology, G.W.; software, G.W.; validation, J.L., Y.Y. and G.W.; formal analysis, K.W.; investigation, N.B.; resources, X.C.; data curation, G.W.; writing—original draft preparation, G.W.; writing—review and editing, K.W.; visualization, G.W.; supervision, J.L. All authors have read and agreed to the published version of the manuscript.
Funding
This research received no external funding.
Data Availability Statement
The data presented in this study are available on reasonable request from the corresponding author as the data from part of an ongoing study.
Conflicts of Interest
Authors Guangyin Wu and Yanan Yang were employed by the company State Grid Henan Electric Power Co., Ltd. The remaining authors declare that the research was conducted in the absence of any commercial or financial relationships that could be construed as potential conflicts of interest.
References
- Yan, W.; Xiao, C.; Wu, X.; Li, J.; Tang, X.; Yang, F. Calculation of Lightning Trip Out Rate of 10 kV Distribution Lines Based on Lightning Activity Characteristics. High Volt. Eng. 2021, 47, 1118–1127. [Google Scholar]
- Li, H.; Wang, J.; Huang, P.; Guo, K.; Wang, Y. Research on the Effect of an Air-Blown Interrupting Gap to Reduce the Rate of Lightning Tripping. Energies 2023, 16, 1474. [Google Scholar] [CrossRef]
- Gao, Z.; Cao, X.; Du, J.; Tian, M. Study on the Effect of Vertical Rod on Reducing Tower’s Impulse Grounding Resistance. High Volt. Appar. 2018, 54, 182–187. [Google Scholar]
- Sarkarati, S.; Tehranchi, M.M.; Mehrshahi, E. Precise calculation of electrical capacitance by means of quadruple integrals in method of moments technique. Math. Comput. Simul. 2023, 206, 231–240. [Google Scholar] [CrossRef]
- Mazzetti, C.; Veca, G.M. Impulse behavior of ground electrodes. IEEE Trans. Power Appar. Syst. 1983, 102, 3148–3156. [Google Scholar] [CrossRef]
- Liu, Y.; Theethayi, N.; Thottappillil, R. An Engineering Model for Transient Analysis of Grounding System Under Lightning Strikes: Non-uniform Transmission-Line Approach. IEEE Trans. Power Deliv. 2005, 20, 722–730. [Google Scholar] [CrossRef]
- Kumar, A.; Manickavasagam, K. Transmission line dynamic circuit model for effective length of ground electrode under lightning transients. IEEE Trans. Electromagn. Compat. 2022, 64, 543–550. [Google Scholar] [CrossRef]
- Geri, A.; Veca, G.M.; Garbagnati, E.; Sartorio, G. Non-linear behavior of ground electrodes under lightning surge currents: Computer modeling and comparison with experimental results. IEEE Trans. Magn. 1992, 28, 1442–1445. [Google Scholar] [CrossRef]
- Xia, C.; Chen, C.; Wen, X. The Research for Impulse Current and Voltage Distribution of Extended Grounding Electrode. High Volt. Eng. 2002, 28, 24–25,32. [Google Scholar]
- Lu, H.; Feng, Z.; Wen, X.; Dong, X.; Pan, Z.; Chen, W.; Lan, L. Full-time Electrical Network Model of the Transient Characteristics of the Grounding Devices Considering Soil Sparkover. Proc. CSEE 2017, 37, 7058–7065. [Google Scholar]
- Habjanic, A.; Trlep, M. The simulation of the soil ionization phenomenon around the grounding system by the finite element method. IEEE Trans. Magn. 2006, 42, 867–870. [Google Scholar] [CrossRef]
- Habjanic, A.; Trlep, M. The analysis of the additional substance influence on the grounding grid parameters by FEM. In Proceedings of the IEEE/ACES International Conference on Wireless Communications & Applied Computational Electromagnetics, Honolulu, HI, USA; IEEE: New York, NY, USA, 2005; pp. 545–548. [Google Scholar]
- Wu, Y.; Ruan, J.; Xia, J.; Huang, D.; Long, M. Finite Element Analysis on Impulse Current Dispersing Characteristics of Grounding Devices Considering Spark Effect. Insul. Surge Arresters 2019, 104–110. [Google Scholar]
- Li, J.; Jiang, J.; Li, L. Simulation and Experiment Study on Resistance-Reducing Mechanism of Grounding Device with Spicules. Power Syst. Technol. 2013, 37, 211–217. [Google Scholar]
- Zhu, B.; Sima, W.; Yuan, T.; Guo, R. Structure Parameter Optimization of Grounding Device With Needle-Shaped Conductors Based on Electric Field Distribution in Soil. Power Syst. Technol. 2015, 39, 2907–2914. [Google Scholar]
- Li, J.; Zhang, Y.; Guo, L.; Li, Y. Analysis the Effect of Complex Soil Structure on the Dispersion Mechanism of the Grounding Device in the Hydropower Station. Trans. China Electrotech. Soc. 2017, 32, 167–175. [Google Scholar]
- Luo, D.; Sima, W.; Yuan, T.; Liu, S.; Bai, Y.; Xian, C. Study on Grounding System Equivalent Model with Consideration of Vertical Drop of Soil. In Proceedings of the 2015 Academic Annual Meeting of the High Voltage Professional Committee; Chinese Society for Electrical Engineering: Xi’an, China, 2015. [Google Scholar]
- Zhan, Q.; Chen, Z.; Li, H.; Liu, Y.; Mei, C. Influence of Tower Grounding Lightning Currents on Surrounding Fish Ponds and Protective Measures. Guangdong Electr. Power 2018, 31, 127–133. [Google Scholar]
- Dong, G.; Gao, P.; Li, S.; Wang, Y.; Xu, W.; Xing, G. Influence of Grounding Grid on Extension Resistance Reduction of Tower Grounding Grid near Water Source Area. Insul. Surge Arresters 2023, 106–115. [Google Scholar]
- He, J.; Zeng, R.; Zhang, B. Grounding Technology for Power Systems; Science Press: Beijing, China, 2007. [Google Scholar]
- Clément, J.B.; Sous, D.; Bouchette, F.; Golay, F.; Ersoy, M. A Richards’ equation-based model for wave-resolving simulation of variably-saturated beach groundwater flow dynamics. J. Hydrol. 2023, 619, 129344. [Google Scholar] [CrossRef]
- MacKay, M.D.; Meyer, G.; Melton, J.R. On the discretization of richards equation in canadian land surface models. Atmos.-Ocean 2023, 61, 1–11. [Google Scholar] [CrossRef]
- Jiang, S.; Liu, X.; Huang, J.; Zhou, C. An improved Green-Ampt model for rainfall infiltration analysis of multi-layered heterogeneous soil slopes. Chin. J. Geotech. Eng. 2024, 46, 1177–1186. [Google Scholar]
- Song, X.; Tan, Y.; Lu, Y.; Liu, J.; Liu, Y.; Wei, H.; Lai, K.; Xu, Z. Experimental and numerical studies on the instability of simple homogeneous sandy slopes under different infiltration scenarios. Chin. J. Rock. Mech. Eng. 2024, 43, 1204–1218. [Google Scholar]
- Deng, C.; Zhou, W.; Wei, S.; Wang, H. Influence Analysis of Inductance Effect and Spark Effect on Lightning Impulse Characteristics of Grounding Conductors and Its Ambient Soil. High Volt. Eng. 2015, 41, 56–62. [Google Scholar]
- Liu, S.; Chao, Y.; Wang, F.; Yue, Y.; Huang, F.; Wang, C.; Duan, J. Impulse Performance Analysis of Grounding Devices Considering Soil Discharge. Insul. Surge Arresters 2020, 72–80. [Google Scholar]
- Archie, G.E. The electrical resistivity log as an aid in determining some reservoir characteristics. Trans. AIME 1942, 146, 241–295. [Google Scholar] [CrossRef]
- Li, H.; Li, H.; Chen, S. Influence of Seepage of Red Soil on Grounding Resistance of Tower on Shore of Lake. Water Resour. Power 2019, 37, 169–172,177. [Google Scholar]
- He, J.; Guo, L.; Chen, S.; Wang, P.; Xu, H.; Mei, C. Study on Influence of River Seepage on the Ground Resistance of Tower in Sandy Area During Dry Season. Insul. Surge Arresters 2019, 165–171. [Google Scholar]
- Lei, C. Research on Grounding Electrode Structure Design Based on Electric Field Distribution in Earth during Impulse Current Dispersion. Master’s thesis, Chongqing University, Chongqing, China, 2012. [Google Scholar]

Disclaimer/Publisher’s Note: The statements, opinions and data contained in all publications are solely those of the individual author(s) and contributor(s) and not of MDPI and/or the editor(s). MDPI and/or the editor(s) disclaim responsibility for any injury to people or property resulting from any ideas, methods, instructions or products referred to in the content. |
© 2026 by the authors. Licensee MDPI, Basel, Switzerland. This article is an open access article distributed under the terms and conditions of the Creative Commons Attribution (CC BY) license.