


Abstract
The fundamental dilemma of energy transition lies in whether an economy can guide its energy system to break free from deep dependence on fossil fuels in a sustained and orderly manner. This requires not only institutional incentives for innovation but also, more critically, a social-level shift in focus from “physical expansion” to “human development.” This paper incorporates these two conditions into a unified causal framework. Taking the pilot program for the construction of IP-strong provinces in China launched in 2016 as a quasi-natural experiment, and using panel data from 30 provincial-level administrative regions in China over the period 2010–2022, this study employs the Spatial Durbin Difference-in-Differences (SDM-DID) model and the Double Machine Learning (DML) method to examine the joint impacts and transmission mechanisms of the regional IP strong chain and the deep synergy between investment in physical capital and investment in human capital on energy green controllability. The findings are as follows. First, both the IP strong chain and deep synergy significantly improve energy green controllability. The local effect of deep synergy is far greater than the direct effect of the IP system itself, making it the core structural force driving the green transition. Second, the institutional dividend of the IP strong chain generates positive spatial spillovers to neighboring regions through the patent information disclosure channel. In contrast, the spatial spillovers of deep synergy are obstructed by administrative barriers and fiscal boundaries. Third, deep synergy plays a significant partial mediating role in the process through which the IP strong chain affects energy green controllability, with more than one-third of the total policy effect being released through this channel. Fourth, a path-wise test reveals a notable structural difference: the human capital investment path significantly outperforms the physical capital investment path in terms of transmission efficiency and robustness. This indicates that, at the current stage, the institutional effectiveness of the IP system in driving the green transition is largely achieved by improving the quality, capacity, and security level of human capital, rather than by restructuring the physical capital stock. The above conclusions remain robust after replacing the machine learning algorithm, adjusting the sample split ratio, and excluding the interference of concurrent competitive policies. This paper reveals the complete causal chain through which institutional public goods are transmitted to system governance capacity via the factor allocation structure, providing new empirical evidence for understanding the deep-seated relationship between intellectual property governance and the energy transition.
1. Introduction
The fundamental challenge of energy transition lies not in the availability of clean technologies, but in an economy’s ability to guide its energy system to break free from deep dependence on fossil fuels in a sustained and orderly manner. Extricating energy systems from high-carbon lock-in is never merely a story of technological substitution. It requires both continuous institutional incentives for innovation and a social-level shift in focus from physical expansion to human development. Failure to meet either condition may lead to stagnation or reversal in energy transition at some stage.
Existing research has examined these conditions largely in isolation. Studies on intellectual property and green development typically focus on whether patent protection incentivizes clean technology R&D [1,2], while research on investment structure emphasizes the productivity effects of physical infrastructure or the returns to education and health [3,4]. The energy transition literature has extensively documented carbon lock-in and the barriers to clean substitution [5,6], yet it rarely engages with how IP institutions or factor-allocation structures shape transition dynamics. This fragmentation leaves a critical gap: the causal chain linking institutional innovation, capital allocation, and energy governance capacity remains largely unexplored. This paper aims to bridge this gap by incorporating these three domains into a unified analytical framework.
At the institutional level, a policy experiment launched in China in 2016—the pilot program for building IP-strong provinces—offers insights that transcend the narrow perspective of patent protection. The core objective of this policy is to address a long-standing structural dilemma: the disconnect between IP and industrial chains. IP remains confined to legal protection, failing to serve as a link for technology transfer, collaborative innovation, and benefit-sharing across industrial chain segments. This paper terms this institution the “Regional IP Strong Chain,” an institutional upgrade that embeds IP into the full-chain operation of industrial governance through patent navigation, rapid rights enforcement, pledge financing, and standardization mechanisms. This institutional reform provides a quasi-natural experiment to examine whether strengthening IP–industrial chain linkages can reshape capital allocation criteria and ultimately drive energy transition.
At the social level, the sustainability of energy transition hinges on whether an economy prioritizes investment in physical expansion or human development. Investment in physical capital—expressways, transmission lines, industrial plants—can rapidly boost output but may not cultivate the engineers and skilled workers needed to design and maintain these systems. Investment in human development—education, healthcare and social security—accumulates long-term knowledge reserves but requires physical infrastructure as carriers. This paper defines “deep synergy” as the coupled state where these two investment directions shift from parallel, independent trajectories to a virtuous cycle of mutual activation and amplification. Only when physical investment aligns with human capabilities in direction and rhythm do the two investments generate sustained momentum for energy transition.
This paper uses panel data from 30 provincial-level administrative regions in China spanning 2010–2022 as the research sample. It employs the Spatial Durbin Difference-in-Differences model to identify the direct and spatial spillover effects of the regional IP strong chain on energy green controllability—a dynamic governance capacity indicator we develop from a cybernetics perspective. Additionally, it uses a Double Machine Learning framework to systematically examine the mediating mechanism of deep synergy while controlling for high-dimensional covariates and nonlinear confounding effects.
The main findings are as follows. Both the IP strong chain and deep synergy significantly improve energy green controllability. The local effect of deep synergy is far greater than the direct effect of the IP system itself, making it the core structural force driving the green transition. The institutional dividend of the IP strong chain generates positive spatial spillovers to neighboring regions through patent information disclosure, while the spatial spillovers of deep synergy are obstructed by administrative barriers and fiscal boundaries. Deep synergy plays a significant partial mediating role, with more than one-third of the total policy effect released through this channel. A path-wise test reveals a notable structural difference: the human capital investment path significantly outperforms the physical capital investment path in transmission efficiency, indicating that the institutional effectiveness of the IP system in driving the green transition is largely achieved by improving the quality and security level of human capital. These conclusions remain robust across alternative machine learning algorithms, sample split ratios, and competitive policy controls. This paper reveals the complete causal chain through which institutional public goods are transmitted to system governance capacity via factor allocation, providing new empirical evidence for understanding the deep-seated relationship between IP governance and energy transition.
2. Theoretical Mechanisms and Research Hypotheses
The energy transition faces a fundamental dilemma: clean technologies exist, yet economies struggle to break free from fossil fuel dependence. This paper argues that resolving this dilemma requires two interconnected conditions—institutional incentives for innovation at the policy level, and a reorientation of investment priorities from physical expansion to human development at the societal level. Our analytical framework connects these conditions through a clear causal chain: the regional intellectual property strong chain reshapes the capital allocation criteria, which in turn facilitates the deep synergy between physical and human capital investment; this synergy ultimately determines the extent to which an economy can stably guide its energy system toward a green trajectory.
2.1. The Regional IP Strong Chain and Energy Green Controllability
The regional intellectual property strong chain represents a systematic institutional reform that elevates intellectual property rights from a legal tool for protecting innovation achievements to an institutional hub that connects the upstream and downstream segments of industrial chains [7]. The policy was launched in 2016 through a pilot program that designated provinces as leading, supportive, or characteristic pilots according to their industrial foundations and innovation endowments. It operates through full-chain institutional supply, covering IP creation, protection, utilization, management, and services. Patent navigation provides technological direction for industrial planning, IP protection reduces the risk of knowledge spillovers [8], pledge financing alleviates capital constraints for technology-intensive enterprises, and industrial IP operation centers facilitate technology transfer and collaborative innovation [9]. This institutional architecture is designed to embed IP into the entire innovation decision-making process, enabling industrial chains to evolve from pure logistics and processing networks into transmission carriers of knowledge and technology flows [10].
The core outcome variable in our analysis is energy green controllability, which captures a region’s dynamic governance capacity in order to guide its energy system toward a clean and low-carbon direction in a sustained and orderly manner. We conceptualize this capacity through a cybernetic framework comprising four interacting dimensions. Green investment regulation represents input control, measuring the system’s ability to acquire transition resources through allocation of capital to clean energy infrastructure and industrial pollution abatement [3,11]. Clean substitution regulation represents process control, capturing the degree to which fossil energy is replaced by non-fossil sources across generation capacity, installed capacity, and final consumption [12,13]. Emission decoupling regulation represents feedback control, providing signals on whether the binding relationship between economic growth and carbon emissions is being loosened through both absolute and intensity-based measures [14,15]. Output guarantee regulation represents constraint control, setting boundary conditions that ensure the transition proceeds without sacrificing basic economic output, employment, and social stability [16,17]. These four dimensions together form a complete control loop of “input–transformation–monitoring–calibration.” A region with high energy green controllability features mutually supportive institutional arrangements, industrial structures, technological reserves, and social consensus [5,6] that make clean energy substitution and emission decoupling into long-term trends rather than temporary policy effects.
The IP strong chain enhances energy green controllability through three interconnected mechanisms. The first is innovation incentive and green technology supply [1]. By strengthening patent protection, expediting green patent examination, and improving the IP utilization system, this policy shifts the expected return curve for long-cycle R&D investments upward, making clean energy technologies that were previously too risky to pursue commercially viable. This technology supply effect directly supports clean substitution and emission decoupling while improving the conversion efficiency of green investment [2]. The second mechanism is structural optimization and factor reallocation [18]. Through patent navigation, pledge financing, and technology trading platforms, the IP system accelerates the growth of IP-intensive industries characterized by high value-added and low energy consumption. This structural shift reduces carbon emission intensity per unit of economic output and gradually replaces high-carbon production capacity. The third mechanism is targeted technology diffusion [19]. Institutional tools such as patent navigation and industrial IP operation centers reduce the search and transaction costs for clean energy technologies, turning green substitution from an “available technical option” into an “accessible market practice.” These mechanisms jointly operate on the local level, but their effects are not confined to administrative boundaries. Patent information disclosure creates a continuously accumulating technical knowledge base accessible to R&D personnel in neighboring regions [20], and the restructuring of the industrial chain that accompanies IP-driven upgrading may transfer standardized manufacturing links to adjacent regions [21]. Therefore, we propose the following hypotheses:
H1.
The regional intellectual property strong chain significantly improves local energy green controllability.
H2.
Improvements in the regional intellectual property strong chain in other regions generate positive spatial spillover effects on local energy green controllability.
2.2. Deep Synergy Between Physical and Human Capital Investment and Energy Green Controllability
Investment in physical capital and investment in human capital are two structural forces driving economic development [3,4], but they exert distinctly different effects on the energy green transition. Physical capital investment provides hardware support—clean energy infrastructure, smart grids, and transmission corridors—while human capital investment provides software support through professional engineering expertise, a well-educated industrial workforce, and social consensus that reduces resistance to transition. We define deep synergy between the two as a coupled state where they enter a virtuous cycle of mutual activation and amplification, rather than advancing along separate parallel tracks [22]. In this state, human knowledge and creativity maximize the benefits of physical investment, while physical infrastructure in turn creates broader space and possibilities for further human development. The term “deep” indicates that this synergy goes beyond aggregate co-growth—a natural phenomenon accompanying modernization in any economy—to emphasize structural adaptation and coupling, whether the direction of physical investment matches the demand structure of human development, and whether human capability structure fits the technical level of physical facilities.
This deep synergy improves energy green controllability through two primary mechanisms. The first is the green orientation of physical capital combined with human capital adaptation. The large-scale construction of clean energy infrastructure represents the greening of physical capital, but once these high-technology facilities are completed, insufficient professional operation and maintenance engineers, inadequate data analysts for smart grid dispatching, and shortages of technical personnel for energy storage systems will substantially reduce the return on investment and create implicit dependence on external expertise [23]. When human capital investment is precisely aligned with the direction of physical investment—through science and engineering education, vocational skill training, and lifelong continuing education—these dependence gaps can be gradually eliminated [24]. Local professionals reduce operation and maintenance costs, improve generation efficiency, and enable the energy transition to shift from reliance on external assistance to independent controllability. The second mechanism is social consensus construction supported by institutional infrastructure. The energy transition is fundamentally a social project involving the resettlement of displaced workers, adjustment of consumption habits, and redistribution of sunk costs. Investment in human capital, particularly social security and vocational training, reduces social frictional costs by ensuring that workers affected by industrial restructuring do not form persistent resistance [25]. At a higher level, when education systems integrate low-carbon knowledge and public cultural services disseminate green concepts, clean energy substitution evolves from a government policy goal into something driven by voluntary social action. This social consensus, however, relies on strong physical infrastructure as its material foundation—modern schools, digital teaching terminals, urban–rural information management systems, and medical service networks are the carriers through which human capital investment can spread effectively across society.
At the spatial level, deep synergy may generate spillover effects through cross-regional flow of human capital and the externality of physical infrastructure networks. When a region invests heavily in higher education and healthcare, it attracts high-quality human resources from surrounding areas, and these migrants build knowledge exchange bridges between inflow and outflow regions [26]. Similarly, regional medical centers and educational highlands naturally radiate to surrounding cities and counties, generating social benefits that extend beyond administrative statistical calibers [27]. However, the realization of such spatial spillovers depends critically on whether the synergy between physical and human capital investment can transcend administrative boundaries and form effective complementarity and linkage at the regional level, which is ultimately constrained by institutional fragmentation. Based on this analysis, we propose the following hypotheses:
H3.
Deep synergy between investment in physical capital and investment in human capital significantly improves local energy green controllability.
H4.
Improvements in deep synergy in other regions generate significant positive spatial spillover effects on local energy green controllability.
2.3. Mediating Role of Deep Synergy
The ultimate goal of constructing the IP strong chain is to reallocate capital flows through institutional supply—guiding more public and private capital to shift from simple physical capital accumulation toward the coordinated advancement of both physical and human capital accumulation. This transformation occurs because patent navigation provides clear technological direction for investment decisions, steering capital toward high-value-added activities with technological independence [28]. Simultaneously, the growth of IP-related businesses generates market demand for interdisciplinary legal talents, R&D personnel familiar with commercialization paths, and business professionals mastering international IP rules, transmitting signals to education and training systems. Moreover, while affecting the two investment directions separately, the IP strong chain also catalyzes their synergistic relationship: patent navigation guides both physical investment direction and human skill development; industrial IP operation centers reduce transaction costs while cultivating talent networks; and IP protection creates predictable innovation returns that both attract capital and provide career platforms for skilled talent. Consequently, physical and human capital investments no longer advance separately along their own logics but are organized and coordinated on the unified platform provided by the IP system.
The deep synergy driven by the IP strong chain ultimately enhances energy green controllability across multiple dimensions. Patent-oriented investment decisions channel more energy investment into efficient and clean production capacity; cross-regional diffusion of green patents provides mature technical solutions for neighboring regions; and strengthened IP protection promotes continuous iteration of energy-saving technologies, improving economic output efficiency per unit of energy input. The IP strong chain may drive these improvements through two separate mediating paths: one operating through physical capital investment, where improved IP protection and information transparency enable enterprises to choose production processes with higher technological content and lower energy consumption; and another operating through human capital investment, where better IP protection makes the return on human capital more predictable, leading to increased social investment in education, health, and social security that systematically enhances a region’s governance capacity over the energy transition. Therefore, we propose the following:
H5.
The regional intellectual property strong chain significantly improves energy green controllability by enhancing the deep synergy between investment in physical capital and investment in human capital.
H5a.
The regional intellectual property strong chain significantly improves energy green controllability by raising the level of investment in physical capital.
H5b.
The regional intellectual property strong chain significantly improves energy green controllability by raising the level of investment in human capital.
3. Research Design, Variable Description and Data Sources
3.1. Sample Selection and Data Sources
This paper selects panel data of 30 provincial-level administrative regions of the Chinese mainland from 2010 to 2022 as the research sample (the Xizang Autonomous Region, Hong Kong, Macao, and Taiwan regions are excluded due to missing key data).
The sample interval starts in 2010, with the following institutional milestone: after the promulgation of the Outline of the National Intellectual Property Strategy in 2008, all provinces experienced several years of institutional construction and experience accumulation. Around 2010, the embedding effect of the intellectual property (IP) system on industrial chains became observable. The study ends in 2022, as the latest complete annual data from authoritative statistical publications including the China Energy Statistical Yearbook and China Science and Technology Statistical Yearbook—the core data sources of this paper—were only available up to 2022 at the start of the research. The integrity and consistency of the data provide technical constraints for the closure of the sample interval.
The period 2010–2022 thus covers a complete institutional change cycle of China’s IP governance, which evolved from decentralized exploration to systematic promotion, and from single protection to full-chain industrial empowerment. This provides a natural institutional laboratory for this paper to examine its causal effect on energy green controllability from the perspective of institutional innovation.
For transparency and reproducibility, we provide detailed references to the primary data sources used in this study. The China Statistical Yearbook, China Energy Statistical Yearbook, China Science and Technology Statistical Yearbook, China Electronic Information Industry Statistical Yearbook, China Industrial Statistical Yearbook, China Investment Statistical Yearbook, China Education Statistical Yearbook, and China Health Statistics Yearbook are all publicly available through the National Bureau of Statistics of China website (http://www.stats.gov.cn/english (accessed on 20 March 2026)). The provincial statistical yearbooks are accessible through the official portals of each provincial Bureau of Statistics. Firm-level data are obtained from the Qichacha Enterprise Information Platform (https://www.qichacha.com (accessed on 20 March 2026)) and the iFinD Financial Database (https://www.51ifind.com (accessed on 20 March 2026)). Carbon emission data are derived from the China Emission Accounts and Datasets (CEADs), which are publicly accessible at https://www.ceads.net (accessed on 20 March 2026).
3.2. Explained Variable: Energy Green Controllability (EGC)
3.2.1. Theoretical Construction: Energy System Governance from the Perspective of Cybernetics
Energy green controllability is not a static measurement of the greening degree of the energy system, but a comprehensive assessment of a region’s dynamic governance capability to guide the orderly evolution of the energy system toward a clean and low-carbon direction. The logical origin of this concept can be traced back to the cybernetics paradigm founded by Wiener (1948) [29]. In Cybernetics, Wiener established “control and communication” as a unified framework for understanding all purposive systems. He pointed out that any goal-oriented system must rely on information feedback to continuously correct its own behavior, so as to maintain movement toward the goal amid disturbances.
This paradigm provides a fundamental methodological insight for energy governance: the green transition of the energy system is essentially a typical control problem. The target state is a low-carbon steady state dominated by clean energy; the initial state is the high-carbon reality deeply locked in fossil energy; control variables are policy interventions and capital allocation; feedback signals are emission data and energy efficiency indicators; and external disturbances come from technological mutations, international energy price fluctuations and macroeconomic cycle shocks.
Introducing Wiener’s cybernetics framework into the field of energy governance is not an abstract theoretical transplantation, but rather captures the core dilemma of energy transition: target navigation under uncertain conditions. The cybernetics governance model emphasizes that maintaining the system’s viability within ecological constraints requires a shift from static regulation to dynamic adaptive adjustment driven by continuous information feedback. This idea has been further developed in sustainable governance literature. Scholars have pointed out that the adaptability and evolvability required for sustainable complex systems must be supported by hierarchical cybernetics governance subsystems as a necessary condition.
Examining energy transition from the four-dimensional cybernetics framework of “input control–process control–feedback control–constraint control”, the scale and quality of the input determine the capability boundary of the system to acquire transition resources; the structure of the process determines the advancement efficiency of clean substitution; the sensitivity of feedback determines the response speed of the system in identifying deviations and triggering corrections; and the setting of constraint thresholds ensures that the transition proceeds above the bottom line of guaranteeing basic economic output and social acceptability. The coordinated feedback of the four dimensions forms a complete control loop of “input–transformation–monitoring–calibration”, which is the theoretical core of this paper’s measurement of energy green controllability.
Compared with existing comprehensive indices, energy green controllability has a clear distinction in conceptual positioning. Indicators such as the Sustainable Development Index or green total factor productivity focus on answering “how green the system is at present”, while controllability explores “whether the system can stably move toward a greener direction”. The Energy Transition Index (ETI) developed by the World Economic Forum (WEF) covers dual dimensions of system performance and transition readiness, providing an analytical framework that distinguishes “current performance” and “future capability” for understanding energy transition. However, the ETI takes the country as the evaluation unit, focuses on the macro assessment of institutional readiness and investment environment, and does not go deep into the structural interaction of the four control dimensions within provincial-level regions. Energy green controllability provides a supplement in this direction: it sinks the four-dimensional cybernetics structure to provincial spatial units, takes “controllability” rather than “greenness” as the core criterion, and thus provides a conceptual tool that is different from the existing indicators for energy governance research.
3.2.2. Measurement System and Index Synthesis
Based on the above theoretical framework, we constructed a comprehensive system for evaluating energy green controllability with four dimensions and 12 secondary indicators.
- (1)
- Green Investment Regulation (Input Control). Green investment is the channel through which the system obtains “transition resources” from the outside, and this dimension measures the extent to which a region is willing and able to inject capital into energy greening. In cybernetics logic, input control determines the resource flow available to the system. This dimension includes two indicators: energy industry investment reflects the capital commitment to clean energy infrastructure from the perspective of “source construction”, while completed investment in industrial pollution treatment reflects the remediation efforts for environmental damage of the existing high-carbon production system from the perspective of “end-of-pipe governance”. Simultaneous investment in both directions indicates that the system addresses carbon issues in two dimensions: “future increment” and “historical stock”.
- (2)
- Clean Substitution Regulation (Process Control). This is the core process mechanism by which the system breaks free from carbon lock-in; this dimension measures the degree of substitution of fossil energy by clean energy. In the cybernetics framework, process control determines the efficiency of converting input resources into the desired state. This dimension is measured progressively from three levels: new energy power generation reflects the actual production scale of clean electricity (capability layer), installed capacity of renewable energy reflects the potential space for future substitution (reserve layer), and the energy consumption structure reflects the penetration depth of substitution in terminal energy consumption links (effect layer). The three levels together form a process control measurement system of “capability–reserve–effect”.
- (3)
- Emission Decoupling Regulation (Feedback Control). Feedback control is the core regulation mechanism of a cybernetics system—the system needs accurate and timely signals to judge the deviation between its own state and the target. This dimension includes two indicators: total carbon emissions measure the absolute occupation scale of carbon natural capital, and carbon emissions per unit of industrial added value measure the carbon natural capital consumed per unit of economic output. The combination of the two avoids the statistical illusion of “total volume decline but no efficiency improvement” or “intensity decline but total volume expansion”, ensuring the accuracy and sensitivity of feedback signals.
- (4)
- Output Guarantee Regulation (Constraint Control). Constraint control sets boundary conditions for system operation—energy transition cannot be advanced at the cost of sacrificing basic economic output. This dimension includes four indicators: electricity consumption measures the total consumption of energy resources; purchased external electricity measures the degree of external energy dependence; industrial added value measures the absolute scale of output; and industrialization level measures the relative structure of output. The four indicators together form a four-dimensional constraint control system of “consumption–dependence–scale–structure”, ensuring that energy green controllability is not improved at the expense of economic stagnation.
Table 1 summarizes the complete evaluation index system, including the four dimensions, their secondary indicators, indicator attributes, and data sources.
Table 1.
Comprehensive evaluation index system of energy green controllability (EGC).
This paper adopts the entropy method for objective weighting. The basic principle of the entropy method is derived from the information entropy theory of Shannon (1948) [30]: information entropy is a measure of the uncertainty degree of a system. If the degree of variation in an indicator among evaluation units is larger, it means that the indicator contains richer discriminative information, makes a greater contribution to the comprehensive evaluation, and should be assigned a higher weight; otherwise, the weight is correspondingly reduced. The score ranges from 0 to 1, and a larger value indicates stronger energy green controllability of the province in the corresponding year.
We also conducted principal component analysis to check robustness. This method extracts the shared variation among all indicators and abandons variance-dependent weighting in order to tackle the bias arising from correlations between sub-indicators when constructing the composite index. We also employed equal weighting to completely remove the effect of indicator variance on weight allocation.
3.3. Core Explanatory Variable: Regional Intellectual Property Strong Chain (IP)
The regional intellectual property (IP) strong chain is a systematic institutional reform implemented at the provincial administrative region level. It promotes the deep embedding of intellectual property rights into all links of regional industrial chains by strengthening the full-chain institutional supply of IP creation, protection, utilization, management and services.
In 2016, the China National Intellectual Property Administration (CNIPA) officially launched the first batch of pilot programs for the construction of IP-strong provinces, designating Guangdong as a leading pilot and Guangxi and other provinces as characteristic pilots. In June of the same year, the CNIPA and the People’s Government of Guangdong Province signed the third round of high-level IP cooperation consultation agreement, establishing “building a leading IP-strong province” as the core objective.
This paper operationalizes this policy into a policy treatment dummy variable IP. If a province is approved as a pilot for the construction of an IP-strong province in the current year and subsequent years, the IP takes a value of 1; otherwise, it takes a value of 0. The policy implementation time for all pilot provinces is calculated from 2016, as detailed in Table 2.
Table 2.
Treatment group regions and implementation time of the policy treatment variable (IP) for the regional intellectual property strong chain.
3.4. Mechanism Variable: Deep Synergy Between Investment in Physical Capital and Investment in Human Capital (COL)
3.4.1. Conceptual Basis and Theoretical Origin
The deep synergy between investment in physical capital and investment in human capital is the core mediating variable constructed in this paper. The proposal of this construct stems from a theoretical reflection on the long-separated discussions of physical capital and human capital in economic growth theory.
In his human capital externality model, Lucas (1988) demonstrated that human capital accumulation is not only a direct contributor to output, but also drives the continuous improvement of total factor productivity (TFP) through knowledge spillover effects [31]. Romer’s (1990) endogenous technological change framework positions human capital as the core input for the production of new technologies and knowledge, emphasizing its irreplaceability in the creation of new products and processes [32]. However, these two theoretical threads have evolved relatively independently for a long time. Research on physical capital focuses on the driving effect of infrastructure investment on productivity, while research on human capital centers on returns to education and skill premiums. The structural coupling relationship between the two investment directions has not received sufficient attention or quantitative characterization in the empirical dimension for a long time.
At a deeper theoretical level, Acemoglu and Autor (2011) [33] proved from the perspective of skill-biased technological change that the degree of complementarity between physical capital and human capital determines the nature and distributional effects of technological progress. Advanced physical capital can only fully release its efficiency in the hands of labor with corresponding skill levels, while the output potential of high-quality human capital is also constrained without the support of advanced physical platforms [33]. From the perspective of the comparative political economy of welfare states, Goldin and Katz (2008) revealed the prerequisite relationship between social security and skill formation: social protection incentivizes more resources to be allocated to education and training by reducing the individual risk of human capital investment, thus forming a positive feedback loop between social security and skill accumulation [34].
Based on the above theoretical context, this paper proposes the concept of “deep synergy between investment in physical capital and investment in human capital”. It refers to a coupled state in which investments in physical capital and human capital no longer advance along separate parallel tracks, but enter a virtuous cycle of mutual activation and amplification. The core judgment of this construct is as follows: investment in physical capital provides a physical platform and instrumental conditions for the exertion of human capabilities, while human capabilities determine the extent to which the benefits of physical capital investment can be released. A higher degree of synergy means lower frictional loss between the two and higher overall system efficiency. In the context of energy transition, this synergy means that the construction and operation of clean energy infrastructure are aligned with the cultivation and security of high-skilled labor in terms of direction and rhythm.
3.4.2. Index System, Entropy Method Weighting and Coupling Coordination Degree Calculation
This paper constructs a comprehensive evaluation index system for investment in physical capital and investment in human capital from two categories (primary dimensions), forming a complete framework of “primary dimension–secondary dimension–tertiary indicator”.
- Index System of Investment in Physical Capital
Investment in physical capital refers to the formation and accumulation of material capital. In New Structural Economics, Lin (2011) emphasized that the infrastructure structure must be continuously upgraded along with the evolution of the factor endowment structure to transform potential comparative advantages into actual competitive advantages [35]. Infrastructure is not an exogenous given condition, but a dynamic variable endogenous to the stage of economic development. There are systematic differences in the type and scale of infrastructure required at different stages of development.
- Information infrastructure investment. Information infrastructure is the most basic form of public capital in the digital economy era. In their knowledge economy analysis framework, Chen and Dahlman (2006) listed ICT infrastructure as the first of the five pillars, holding that it determines the efficiency of knowledge production, dissemination and utilization [36]. The uniqueness of information infrastructure lies in its network externality: the access of each new user increases the value for existing users, which gives information infrastructure investment an inherent characteristic of increasing returns to scale. The existence of the digital divide not only hinders the diffusion of knowledge, but also restricts the popularization of clean energy technologies and the refinement of energy management.
- Integrated infrastructure investment. Integrated infrastructure is the intersection of the physical and digital worlds, covering transportation and logistics networks, radio and television coverage, meteorological observation stations, and e-commerce support systems. The classic study by Aschauer (1989) [37] revealed the important contribution of public infrastructure investment to productivity. The expansion of expressways, railways and public transport not only reduces the cost of factor mobility, but also reshapes the spatial organization of economic activities [37]. In the context of this paper, the perfection of integrated infrastructure directly determines the flow efficiency of goods, services and talents, as well as the geographical radius and service depth that the e-commerce ecosystem can cover.
- Innovation infrastructure investment. Innovation infrastructure is the institutional and physical carrier of knowledge production and technological progress. Research by Black and Lynch (2005) shows that the contribution of knowledge capital investment such as R&D input, patent output and technology market transactions to economic growth has long been underestimated by the System of National Accounts (SNA) [38]. In the logical framework of this paper, innovation infrastructure investment is the key hub connecting “investment in physical capital” and “investment in human capital”. R&D equipment and laboratories are in the form of physical capital, while their output is knowledge and skills condensed in the human brain. It is this dimension that provides a structural channel for the transformation of investment in physical capital into investment in human capital.
- Index System for Investment in Human Capital
Investment in human capital refers to the accumulation of human capital and the all-round development of human beings. Mincer’s (1975) human capital investment theory laid the basic framework for analyzing the returns to education and health investment: education and training mean the delay of current consumption, and their returns are reflected in the continuous improvement of future labor productivity and income [39]. Earlier, Schultz (1961) systematically demonstrated the key contribution of human capital investment to economic growth [40]. In the analysis of this paper, investment in human capital is the core proxy variable to measure the degree of a region’s shift from “physical expansion” to “human development”.
- Education and talent cultivation investment. Education is the most fundamental channel for human capital formation, as well as the most important engine for intergenerational mobility and long-term economic growth. In the context of energy transition, the improvement of education level not only means higher-quality technical R&D personnel and engineering managers, but also greater overall social acceptance and application capacity of green and low-carbon technologies and management models.
- Healthcare and protection investment. Health is the physiological basis of human capital. Bloom and Canning (2000) demonstrated the direct effect of health improvement on labor productivity, as well as its indirect effect of enhancing incentives for education investment by extending working life and expected return cycles [41]. In the energy transition, front-line workers in industrial pollution control and manual workers in the construction of clean energy infrastructure all need good physical conditions as support. The accessibility of medical resources and the perfection of the public health system determine the fundamental health status of the labor force.
- Employment and talent utilization investment. Employment is the market channel for the realization of human capital value. The vitality of the labor market—the scale of new jobs, the absorption capacity of the private economy, and the expanding trend of service industry employment—reflects whether an economy can effectively transform its human capital accumulation into real productivity. The increase in the proportion of employment in the tertiary industry is itself an evolution of the industrial structure toward low energy consumption. Meanwhile, high-quality employment growth is also the economic foundation for social stability and the sustainability of energy transition investment.
- Social security investment. Social security is the “safety net” for human capital investment. A sound social insurance system reduces the risk of individuals’ long-term human capital investment and incentivizes more resources to be allocated to education and training. In the specific context of energy transition, the role of the social security system is particularly critical. Jobs in the traditional fossil energy industry will inevitably shrink during the transition, and the transition period of unemployment and reemployment needs the buffer provided by the social security system to avoid the concentrated outbreak of the social costs of the transition.
The specific composition of the index system is detailed in Appendix A, Table A1.
The entropy method weighting procedure is applied to the indicator sets of investment in physical capital and investment in human capital, respectively. The composite index of investment in physical capital is denoted as (Physical Capital), and the composite index of investment in human capital is denoted as (Human Capital).
3.4.3. Coupling Coordination Degree Model
After measuring the development levels of the two independent systems through weighting with the entropy method, it is necessary to synthesize them into a measurement of “deep synergy”. We used the coupling coordination degree model to complete this synthesis. Originally applied in physics to characterize the intensity of the interaction between different circuit components, the core logic of this model is to simultaneously measure the degree of interaction between systems (coupling degree) and the overall development level of the systems (coordination degree). The coupling coordination degree is generated by taking the geometric mean of these two indicators.
Here, denotes the coupling degree, which measures the intensity of the interaction between the two systems and has a value range of [0, 1]. A value closer to 1 indicates a deeper mutual influence between the systems. denotes the comprehensive coordination index, which reflects the overall development level of the two systems. and are undetermined weights. This paper assumes that the two systems of investment in physical capital and human capital are equally important in deep synergy, so the value of is adopted. is the final synthesized coupling coordination degree, with a value range of [0, 1]. The economic implication of this indicator is the degree of deep synergy between investment in physical capital and investment in human capital in a region, which depends not only on the respective development levels of the two systems, but, more critically, on the matching efficiency of their co-frequency resonance.
The choice of equal weights (α = β = 0.5) for the comprehensive coordination index T requires justification. We adopted this specification because our conceptualization of “deep synergy” emphasizes the coupled state of mutual activation and amplification between the two systems, rather than the relative superiority of either investment direction. In the absence of strong prior theoretical guidance that one type of investment should be weighted more heavily than the other in determining synergy, equal weighting represents the most neutral and commonly adopted practice in the coupling coordination degree literature. This approach ensures that the resulting COL index reflects the balanced interaction between physical and human capital investment, rather than being driven by the dominance of either system. To assess the sensitivity of our results to this weighting assumption, we conducted robustness checks by varying the weights within a reasonable range (α = 0.4, β = 0.6 and α = 0.6, β = 0.4). The estimated coefficients of COL on EGC and the mediation ratios remain qualitatively unchanged, confirming that our core conclusions are not driven by the specific choice of α and β.
3.5. Control Variables
To eliminate the confounding effects of other factors on energy green controllability and accurately identify the net effects of the IP strong chain and deep synergy, we select five control variables based on the energy transition and structural change literature. Each variable is chosen because it captures a distinct channel through which economic structure, human resources, government behavior, or technological capacity may influence a region’s ability to guide its energy system toward a green trajectory. Below, we specify the measurement and hypothesized mechanism for each.
Industrial structure rationalization (STR). Industrial structure rationalization reflects the effectiveness of factor allocation among industries. A more rationalized structure implies that resources are allocated to sectors where they yield the highest marginal returns, which tends to reduce wasteful energy consumption and improve energy efficiency. This paper uses the reciprocal of the Theil index as a measurement. The calculation formula of the Theil index is as follows:
Among them, and denote the added value and employment of the s-th industry, respectively, and and represent the regional gross domestic product (GDP) and total employment. STR takes its reciprocal value: .
Human capital level (HC). The level of human capital reflects the skill and knowledge reserves of the labor force, which form the absorptive capacity foundation for technological innovation and knowledge diffusion. Regions with higher human capital levels are better able to adopt and implement advanced clean energy technologies and energy-saving practices, thereby accelerating the green transition. This paper uses the natural logarithm of the average number of college students per 100,000 people for measurement.
Industrial structure advancement (AIS). Industrial structure advancement measures the degree of leap of the industrial structure from a low-level form to a high-level form. A higher share of the tertiary industry typically implies a structural weakening of the dependence of economic growth on high-carbon energy, as service sectors are generally less energy-intensive than manufacturing. This paper uses the ratio of the added value of the tertiary industry to the added value of the secondary industry for measurement: .
Government intervention intensity (GOV). The intensity of government intervention reflects the relative scale and influence of the public sector in the macro economy. On one hand, government spending on public goods such as infrastructure and environmental protection may promote green transition; on the other hand, excessive intervention may distort market signals and reduce allocative efficiency. This paper uses the ratio of local general public budget expenditure to GDP for measurement: .
R&D I=intensity (RD). The R&D input intensity is the core input variable driving technological innovation. Higher R&D expenditure is expected to accelerate the development and diffusion of clean energy technologies, improve energy efficiency, and reduce the cost of emission abatement. This paper uses the proportion of local fiscal expenditure on science and technology in the general public budget expenditure for measurement: .
The data for the above control variables are all derived from the China Statistical Yearbook, China Science and Technology Statistical Yearbook, and statistical yearbooks of each province.
3.6. Quasi-Natural Experiment Design and Model Construction
3.6.1. Spatial Difference-in-Differences Model
To comprehensively identify the direct effect and spatial spillover effect of the intellectual property (IP) strong chain on energy green controllability (EGC), this paper constructs three types of spatial panel models to select the optimal specification through subsequent diagnostic tests.
The validity of the traditional difference-in-differences (DID) model relies on the fundamental assumption of independent individual treatment units, namely the Stable Unit Treatment Value Assumption (SUTVA). However, the transition of the energy system can hardly be completely confined by administrative boundaries. Capital flows, talent migration, technology diffusion and institutional imitation may all transmit the policy effect of a province to neighboring regions with similar economic structures. LeSage and Pace (2009) [42] systematically pointed out in their monograph on spatial econometrics that ignoring such spatial dependence will lead to a biased estimation of policy effects. Accordingly, drawing on the spatial panel model system of Elhorst (2014) [43], this paper constructs the Spatial Autoregressive Difference-in-Differences model (SAR-DID), Spatial Error Difference-in-Differences model (SEM-DID), and Spatial Durbin Difference-in-Differences model (SDM-DID).
where denotes the spatial weight matrix, the specification logic of which is elaborated below; is the spatial autoregressive coefficient; is the coefficient vector of the spatial lag term of explanatory variables; is the spatial error autocorrelation coefficient; and represent time and spatial fixed effects, respectively; and is the set of control variables.
The final specification of the three models will be determined through a systematic diagnostic procedure including the Robust LM test, Hausman test, LR test and Wald test. The effect decomposition of the optimal model will yield a direct effect and indirect effect. The direct effect measures the final impact of local explanatory variables on the local explained variable after passing through the spatial feedback loop, while the indirect effect measures the pure spatial spillover of local explanatory variables on all other regions (LeSage & Pace, 2009) [42].
After the diagnostic test confirms that the SDM-DID is the optimal specification, this paper further constructs an extended model with interaction terms:
3.6.2. Specification of the Spatial Weight Matrix
The spatial weight matrix is the core identification tool in spatial econometrics, whose essential function is to convert the unobservable spatial correlation structure into a measurable exogenous weight system. There are three common types of spatial weight matrices. The geographic adjacency matrix defines spatial correlation based on shared boundaries, but it implies strict assumptions that spatial effects are homogeneous within administrative boundaries and decline abruptly beyond the boundaries. The geographic distance matrix assigns weights through the decay function of physical distance, which is smoother, but still equates “proximity” with “geographic closeness”. In contrast, the economic distance matrix breaks away from the geographic logic and takes the similarity of economic structure as the inverse measure of correlation intensity: regions with similar economic development levels may have intensive institutional imitation and factor flows, even if they are not geographically adjacent.
The research topic of this paper—intellectual property system and energy governance—precisely falls into the scenario where institutional diffusion depends more on economic gradients than geographic distance. In view of this, this paper selects the economic distance spatial weight matrix:
where and are the average per capita GDP of province i and j during the sample period, respectively. The matrix is processed with row standardization.
3.6.3. Double Machine Learning Model
Standard parametric models face the risk of misspecification when the relationship between the outcome variable and high-dimensional control variables involves complex nonlinearities and interactions. To address this concern while maintaining valid statistical inference for the low-dimensional treatment parameters, we employed the Double Machine Learning (DML) framework developed by Chernozhukov et al. [44]. The core innovation of DML lies in its ability to remove regularization bias through the combination of orthogonalization and cross-fitting, thereby allowing flexible machine learning algorithms to estimate nuisance functions without compromising the asymptotic normality of the treatment effect estimator.
Consider the partially linear model that forms the basis of our empirical analysis. For a given outcome variable (energy green controllability), a treatment variable (either the IP strong chain policy indicator or the deep synergy index), and a high-dimensional vector of control variables X, the model takes the form , where is the treatment parameter of interest and is an unknown, potentially complex function of the controls. A direct approach would be to estimate using machine learning and then recover , but this naive procedure suffers from regularization bias because the machine learning estimator of is shrunk toward zero to prevent overfitting, which in turn contaminates the estimate of . The DML framework resolves this issue by constructing a Neyman-orthogonal score function that is insensitive to first-order errors in the estimation of the nuisance parameters. The orthogonal score for the partially linear model is defined as , where denotes the observed data, represents the nuisance parameters, and is the propensity score or the conditional expectation of the treatment variable, given the controls. This score satisfies the orthogonality condition , meaning that the moment condition used to identify is locally invariant to small perturbations in the nuisance functions, which is the key property that eliminates regularization bias.
To implement the estimation, we adopt a cross-fitting procedure that prevents overfitting and avoids the over-rejection of the null hypothesis that can arise when the same observations are used to estimate both the nuisance functions and the treatment effect. Specifically, we randomly split the full sample of 390 province–year observations into folds of approximately equal size. For each fold , we used the observations from the other folds to train the machine learning models for the nuisance functions. The gradient-boosting tree algorithm was employed as the primary learner for both and due to its ability to capture complex nonlinear patterns and interactions while maintaining computational efficiency. Using the estimated nuisance functions from the auxiliary folds, we then computed the orthogonal scores for each observation in the held-out fold k. This procedure was repeated across all five folds, ensuring that every observation contributed to the final estimation through a score that was constructed using nuisance functions estimated from a separate subset of the data. The final estimate was obtained by solving the sample analog of the orthogonal moment condition, which reduced to a simple linear regression of the residualized outcome variable on the residualized treatment variable, where residualization was performed using the cross-fitted predictions from the auxiliary folds. In other words, we regressed using the observations from fold k, and then aggregated the estimates across folds. Standard errors for the treatment parameter were computed using the conventional asymptotic variance formula for the orthogonal score, which is valid under the DML framework and did not require additional corrections for the first-stage estimation of the nuisance functions because the orthogonality condition ensured that the effect of nuisance estimation error on the treatment coefficient vanished asymptotically. The validity of this inference procedure relied on the cross-fitting step to control the complexity of the nuisance estimators and the use of sufficiently fast convergence rates for the machine learning learners, conditions that were satisfied by gradient boosting under standard regularity assumptions. This DML approach allows us to flexibly control for the confounding effects of industrial structure rationalization, human capital level, industrial structure advancement, government intervention intensity, R&D intensity, and the individual and time fixed effects, without imposing restrictive linear functional form assumptions or arbitrarily selecting a subset of controls to include in a parametric specification.
3.6.4. Double Machine Learning Mediation Effect Model
To test the mediating transmission mechanism of deep synergy, we combined the stepwise regression method with the DML framework. The basic procedure of the stepwise method was proposed by Baron and Kenny (1986) [45]. To make the statistical inference more robust, we performed the Sobel Z test, Aroian test, and Goodman test (Sobel, 1982) [46].
The overall mediation effect test consists of the following system of equations:
For the mediation effect test of the two sub-paths (H5a: IP → PHC → EGC; H5b: IP → HCM → EGC), in the above equation system was replaced by and , respectively. All equations adopted the gradient-boosting tree algorithm and 5-fold cross-fitting.
To test the transmission mechanism through which deep synergy between investment in physical capital and investment in human capital mediates the effect of the regional intellectual property strong chain on energy green controllability, we embedded the stepwise regression logic within the Double Machine Learning framework. The stepwise approach, originally proposed by Baron and Kenny [45], proceeds through three stages: first, establish the total effect of the independent variable on the outcome; second, establish the effect of the independent variable on the mediator; and third, examine the change in the independent variable’s coefficient when the mediator is included in the model, with a significant reduction indicating a mediation effect. To enhance the statistical rigor, we report the Sobel Z statistic alongside the Aroian and Goodman tests, which provide complementary assessments of the significance of the indirect effect [46].
It is important to clarify the identifying assumptions underlying the mediation interpretation. The causal interpretation of the indirect effect requires what is known as sequential ignorability. This assumption consists of two parts: first, conditional on the observed control variables, the treatment variable is independent of the potential outcomes and potential mediator states; second, conditional on the observed control variables and the actual treatment status, the mediator is independent of the potential outcomes. In our context, this means that we must assume that, after conditioning on the rich set of controls, including industrial structure, human capital level, government intervention, R&D intensity, and the fixed effects, there are no unobserved confounders that affect either the relationship between the IP strong chain and deep synergy, or the relationship between deep synergy and energy green controllability. While our DML framework flexibly accounts for observed confounding through the machine learning estimation of nuisance functions, the sequential ignorability assumption itself is fundamentally untestable with observational data. Therefore, our mediation results should be interpreted as evidence consistent with the proposed transmission pathway, rather than as a definitive causal decomposition. The estimated indirect effect captures the portion of the association between the IP strong chain and energy green controllability that operates through deep synergy, under the maintained assumption that all relevant confounders have been adequately controlled for.
The overall mediation effect test consists of the following system of equations, all estimated using the gradient-boosting tree algorithm with 5-fold cross-fitting:
Equation (1) estimates the total effect of the IP strong chain on energy green controllability: .
Equation (2) estimates the effect of the IP strong chain on the mediator, deep synergy: .
Equation (3) includes both the IP strong chain and deep synergy to separate the direct effect from the indirect effect transmitted through the mediator: .
The indirect effect is computed as the product , and its statistical significance is assessed using the Sobel, Aroian, and Goodman tests. For the separate path mediation tests examining Hypothesis H5a (IP → PHC → EGC) and Hypothesis H5b (IP → HCM → EGC), the mediator COL in the above equation system is replaced by PHC (investment in physical capital) and HCM (investment in human capital), respectively.
To formally test these two separate mediation paths, we define the following equations. For the human capital path (IP → HCM → EGC), the three-stage regression system is:
For the physical capital path (IP → PHC → EGC), we replace HCM with PHC in Equations (5) and (6), while Equation (4) remains unchanged as the total effect benchmark. The indirect effects are computed as the product of the respective path coefficients, and their significance is assessed using the Sobel, Aroian, and Goodman tests.
All equations include the same set of control variables and fixed effects as in the benchmark specification.
4. Analysis of Empirical Results
4.1. Preliminary Descriptive Statistics and Correlation Analysis
Before proceeding to the formal spatial econometric analysis, we first present the descriptive statistics and correlation matrix for all variables used in the empirical models. Table 3 reports the mean, standard deviation, and minimum and maximum values for each variable over the full sample period. The mean value of energy green controllability (EGC) is 0.285, with a standard deviation of 0.125, indicating considerable variation across provinces and over time. The regional intellectual property strong chain dummy (IP) has a mean of 0.175, reflecting that approximately 17.5% of the province–year observations are treated by the policy. The deep synergy index (COL) ranges from 0.112 to 0.872, with a mean of 0.481, suggesting that the coupling coordination between physical and human capital investment varies substantially across regions. Among the control variables, industrial structure rationalization (STR) exhibits a mean of 0.524, human capital level (HC) has a mean of 4.682, industrial structure advancement (AIS) averages 1.241, government intervention intensity (GOV) averages 0.235, and R&D intensity (RD) averages 0.021.
Table 3.
Descriptive statistics of all variables.
Table 4 presents the pairwise correlation matrix for all variables. The correlation between IP and EGC is positive at 0.185, and the correlation between COL and EGC is positive at 0.412, with both providing preliminary support for our hypotheses. The correlation coefficients among the control variables are generally moderate, with the highest being between GOV and STR (0.418). To formally assess multicollinearity, we computed the variance inflation factor (VIF) for each variable. The VIF values range from 1.27 to 2.41, with a mean VIF of 1.68; all are substantially below the conventional threshold of 10. This result confirms that multicollinearity does not pose a serious threat to the reliability of our regression estimates.
Table 4.
Correlation matrix and variance inflation factors.
4.2. Spatial Autocorrelation Test
Before conducting formal spatial econometric analysis, the global spatial autocorrelation test on the explained variable is an indispensable diagnostic step. The necessity of this test lies in the core assumption of spatial econometric methods: there is non-negligible spatial dependence between observation units that are geographically or economically correlated. If such dependence does not exist, complex models including spatial lag or spatial error terms should not be used. Conversely, if the explained variable shows significant spatial correlation characteristics but traditional econometric methods that ignore spatial interaction effects are still adopted, the estimation results will be biased due to the omission of spatial dependence.
This paper adopts two complementary statistics to test the spatial autocorrelation characteristics of energy green controllability (EGC). The first is the most widely used Global Moran’s I index, with the calculation formula as follows:
where is the observed value of the i-th spatial unit, is the sample mean, is the corresponding element of the spatial weight matrix, and n is the total number of spatial units. The value of Moran’s I ranges from −1 to 1. A positive value indicates that observed values with similar levels tend to be geographically adjacent (positive spatial autocorrelation); a negative value means that observed values with different levels tend to be interlaced in space (negative spatial autocorrelation); and a value close to zero indicates no spatial autocorrelation [47].
The second is Geary’s c Statistic, with the calculation formula as follows:
Compared with Moran’s I, Geary’s c is more sensitive when detecting local spatial correlation patterns. The value of this statistic ranges from 0 to 2, with 1 as the critical value: a value less than 1 means small differences in attribute values between adjacent spatial units, namely positive spatial autocorrelation; a value greater than 1 indicates large differences between adjacent units, namely negative spatial autocorrelation. The introduction of Geary’s c as a supplement to Moran’s I can, to a certain extent, control the risk of misjudgment caused by differences in the construction assumptions of the statistics in a single test [48].
Table 5 reports the test results of the Global Moran’s I and Geary’s c for EGC under the specification of the economic distance spatial weight matrix from 2010 to 2022. The data show that during the entire sample period, the Moran’s I value of EGC fluctuated slightly between 0.078 and 0.104, and was significantly positive at the 1% level in all years. The Geary’s c value remained stable in the range of 0.851 to 0.878, which was also significantly less than 1 at the 1% level. The independent test results of the two indicators are highly consistent and mutually reinforcing, jointly indicating that EGC is not randomly and independently distributed among provinces, but presents a robust and sustained positive spatial agglomeration phenomenon. Provinces with high EGC tend to be surrounded by neighboring provinces with equally high levels, while provinces with low EGC tend to be surrounded by neighboring provinces with equally low levels. In other words, there is a significant “level convergence” characteristic between each province and its neighboring regions.
Table 5.
Global Moran’s I and Geary’s c for energy green controllability under the economic distance spatial weight matrix.
Further observation of the time trend shows that the Moran’s I value increased slightly from 2013 to 2016, rising from 0.084 in 2012 to 0.101 in 2013 and 0.104 in 2014, and then slowly fell back to around 0.08. This period coincided with the intensive promotion stage of the pilot program for the IP-strong province strategy. The gradient difference in institutional construction and innovation output between pilot and non-pilot provinces may have increased the statistical intensity of spatial autocorrelation in the short term. As the pilot experience gradually spread to non-pilot provinces and the independent institutional construction in non-pilot regions accelerated, the inter-provincial gap converged to a certain extent, and the Moran’s I value also showed a trend of mean reversion. Although the magnitude of this change is limited, it provides the necessary empirical basis for the subsequent inclusion of spatial correlation into the causal identification model.
In addition to the global test, the Local Moran Scatter Plot can reveal the specific position of each spatial unit in the agglomeration pattern in more detail. This paper selects two time points, the first year (2010) and the last year (2022) of the sample, to draw the Local Moran Scatter Plot of EGC, as shown in Figure 1. Observation of the two sub-figures shows that most provinces fall into the first quadrant (High–High (H-H) Cluster) and the third quadrant (Low–Low (L-L) Cluster), while the number of provinces located in the second quadrant (low values surrounded by high values, i.e., L-H Cluster) and the fourth quadrant (high values surrounded by low values, i.e., H-L Cluster) is relatively small.
Figure 1.
Local Moran scatter plot of energy green controllability (EGC) under the economic distance spatial weight matrix. (a) Local Moran scatter plot of EGC in 2010. (b) Local Moran scatter plot of EGC in 2022.
This distribution structure indicates that the spatial pattern of EGC is dominated by positive agglomeration in both 2010 and 2022, with an obvious polarization between high and low levels. Some provinces have formed a virtuous cycle and agglomeration advantages of energy green governance, while others are deeply trapped in low-level lock-in, and the spatial boundary between the two types of regions has strong stability. Compared with 2010, the scatter distribution in 2022 has no essential structural change. The shift in a small number of provinces indicates that some regions have achieved relative level improvement during the sample period, but the original agglomeration pattern has not been broken on the whole. This further strengthens the aforementioned conclusion that EGC has always maintained a non-negligible spatial interaction characteristic among provinces with similar economic structures.
Based on the above test results, it can be concluded that EGC is not independently distributed among provinces during the sample period, but it has sustained a significant positive spatial autocorrelation. Therefore, in the subsequent policy effect analysis, it is necessary to adopt a model specification that can incorporate the spatial interaction mechanism to accurately estimate the respective contributions of direct and indirect effects.
4.3. Diagnostic Tests of the Spatial Econometric Model
The spatial autocorrelation test confirms the stable positive spatial agglomeration of energy green controllability (EGC) among provinces, but this fact alone is insufficient to determine the specific transmission structure of spatial correlation. Spatial dependence may arise from different channels: it may stem from the direct feedback of local EGC on neighboring regions (spatial autoregressive effect), from the systematic diffusion of unobservable factors omitted by the model across regions (spatial error effect), or from both mechanisms.
Different model specification assumptions correspond to different logics of effect estimation, and specification bias will lead to misjudgments of the direction and intensity of the direct policy effect and spillover effect. Therefore, before the formal decomposition of policy effects, it is necessary to identify the specification that best fits the data generation process from competitive model settings through a progressive diagnostic procedure.
The starting point of the diagnosis is the fundamental question of “whether spatial effects need to be introduced”. Based on the residuals of ordinary least squares (OLS) regression, the Lagrange Multiplier (LM) test provides a statistical basis for judging the existence of spatial error effects and spatial lag effects. However, the standard LM test has a non-negligible limitation: when the spatial error effect exists in the data, the LM statistic for testing the spatial lag effect will have an over-rejection bias due to model misspecification, and vice versa.
The Robust Lagrange Multiplier test proposed by Anselin et al. (1996) [49] is designed to overcome this defect. By making a local correction for another spatial effect when testing one spatial effect, it ensures that the two tests maintain their respective asymptotic validity in the presence of the other effect. From the perspective of construction principles, the Robust LM test applies a local adjustment term dependent on the score vector and elements of the information matrix to the standard LM statistic, thereby correcting the direction and magnitude of misspecification bias.
For the data structure of this paper, the Robust LM statistic of the spatial error effect far exceeds the 1% critical value, and the Robust LM statistic of the spatial lag effect is also significant at the 10% level. Both reject the null hypothesis that there is no spatial effect in their respective directions. This result indicates that there are non-negligible spatial error effects and spatial lag effects in the data simultaneously. Adopting either the Spatial Autoregressive Model (SAR) or the Spatial Error Model (SEM) alone will lose information adequacy due to incomplete specification. Therefore, the generalized nested form of the two—the Spatial Durbin Model (SDM)—should be taken as the candidate starting point for the analysis.
The second round of diagnosis addresses the determination of the effect form. The (7) statistic of the Hausman test is 61.10, which rejects the null hypothesis that there is no systematic difference between random effects and fixed effects, and clearly points to the fixed effects specification. It is further necessary to confirm the dimension of the fixed effects. Taking the SDM with spatio-temporal dual fixed effects as the benchmark, the likelihood ratio (LR) test is carried out with the simplified versions, including only time fixed effects and only spatial fixed effects as the constrained models, respectively.
The results show that the LR (10) for the time fixed effect is as high as 598.17, and the LR (10) for the spatial fixed effect also reaches 52.46, both of which reject the null hypothesis of the simplified specification at the 1% level. This indicates that there are non-negligible intertemporal common trends and persistent heterogeneous characteristics among provinces in the sample data. Controlling only one source of heterogeneity is insufficient to provide a clean identification environment. Therefore, the spatio-temporal dual fixed effects constitute the benchmark specification for the empirical analysis of this paper.
The final round of diagnosis confirms whether the SDM can be further simplified into SAR or SEM from the perspective of ex post verification. If SAR or SEM is already a sufficient summary of the data generation process, the parameters of the spatial lag terms of explanatory variables additionally included in the SDM are statistically redundant—they will not substantially improve the goodness of fit of the model, nor will they challenge the parameter constraints.
The likelihood ratio test provides the first basis for this judgment: the LR (7) of SDM relative to SAR is 20.74 (p = 0.0042), and that relative to SEM is 17.54 (p = 0.0142), with both rejecting the null hypothesis of simplification at the 5% level. The Wald test provides a second independent verification from the perspective of linear constraints. The test of the null hypothesis that the coefficients of the spatial lag terms of all explanatory variables are jointly zero yields a Wald (7) of 24.43 (p = 0.0010), ruling out the possibility of simplifying SDM to SAR.
A more refined test targets the “spatial error degradation constraint”—the specific condition that there is a fixed proportional relationship between the spatial lag term coefficients of all explanatory variables and their main equation coefficients. The Wald (7) is 21.19 (p = 0.0035), which also rejects the notion that SDM can be simplified to SEM. The two types of tests are logically complementary: the likelihood ratio test compares the overall difference in the degree of data fit between the two models, while the Wald test directly evaluates whether a specific parameter constraint holds under unconstrained estimation. When the two reach a consistent conclusion, the reliability of model selection is cross-verified.
All diagnostic test results are summarized in Table 6. After the above three rounds of diagnosis, this paper locks the Spatial Durbin Model with spatio-temporal dual fixed effects based on the economic distance spatial weight matrix as the benchmark specification. This choice means that when decomposing the effects of the regional IP strong chain and deep synergy on EGC, it is necessary to simultaneously incorporate the spatial autoregressive channel of the explained variable and the spatial spillover channel of the explanatory variables, and jointly control the unobserved heterogeneity in the time and spatial dimensions in the estimation. Before formally entering the effect decomposition, this paper strictly follows the complete screening path from the judgment of the existence of spatial effects to the determination of the effect form and then to the verification of the non-simplifiability of the model, to ensure that the adopted spatial econometric strategy has a sufficient empirical basis at the model specification level.
Table 6.
Diagnostic tests for the Spatial Econometric Model.
4.4. Effect Decomposition and Analysis Based on the Benchmark Regression of the Spatial Econometric Model
After the optimal model form is confirmed, the next task is to convert the estimation results of the Spatial Durbin Model (SDM) into marginal effects with clear policy implications. A well-known but easily overlooked technical detail in spatial econometrics is that the point estimation coefficients of explanatory variables in models containing spatial interaction terms are not directly equal to their marginal effects on the explained variable. The fundamental reason for this phenomenon is the existence of the spatial feedback loop.
When an explanatory variable in the local region changes, this change not only has a direct effect on the explained variable in the local region, but also transmits to neighboring regions through the spatial weight matrix and changes the explained variable in neighboring regions. The change in the explained variable in neighboring regions will in turn affect the local region through the spatial autoregressive channel, forming a circular transmission path of “local region → neighboring regions → local region”. LeSage and Pace (2009) [42] elaborated on this mechanism in Introduction to Spatial Econometrics, and proposed a partial differential method to decompose the total effect into direct effect and indirect effect. The direct effect incorporates the net contribution of the above spatial feedback loop and measures the average impact of changes in local explanatory variables on the local explained variable. The indirect effect excludes local feedback and purely measures the average spillover effect of changes in local explanatory variables on the explained variable in all other regions.
Table 7 presents the decomposition results of the benchmark SDM and the extended model with the interaction term in the two dimensions of direct effect and indirect effect under the spatiotemporal dual fixed effects specification.
Table 7.
Estimation results for direct and indirect effects of the Spatial Durbin Model.
The estimation results of the benchmark SDM show that the spatial autoregressive coefficient ρ is −1.079, which is significantly negative at the 1% level. This negative value reveals a notable spatial characteristic: among regions with similar economic structures, EGC does not show a coordinated and simultaneous growth trend, but presents a competitive trade-off relationship. The underlying logic may lie in the inter-provincial scarcity of resources such as clean energy project investment, carbon emission quota allocation, and agglomeration of green technology talents. The advancement of a region in these dimensions may compress the development space of regions with similar economic structures to a certain extent, thus showing a negative interaction pattern statistically.
At the local effect level, the performance of the two core explanatory variables is consistent with theoretical expectations. The direct effect of IP is significantly positive at the 10% level (0.018), indicating that the launch of the IP-strong province pilot has a positive driving effect on local EGC, and Hypothesis H1 is preliminarily verified. The direct effect of COL reaches 0.369 and is highly significant at the 1% level, meaning that every increase in the coupling coordination degree between investment in physical capital and investment in human capital can significantly enhance the local controllability of the green transition of the energy system. Hypothesis H3 is strongly supported at the direct effect level.
The results of the spatial spillover dimension show a clear binary differentiation. The indirect effect of IP is 0.236, which is significantly positive at the 5% level, indicating that the institutional dividend generated by the construction of the IP strong chain—especially the improvement of patent examination standards and the perfection of the patent information public service platform—can diffuse to neighboring regions through patent literature disclosure and talent mobility and promote the improvement of EGC in a wider range. Hypothesis H2 is thus verified. In contrast, although the indirect effect of COL is positive (0.758), it fails to pass the conventional significance level test, and Hypothesis H4 cannot be statistically supported at the indirect effect level.
The insignificance of this effect reflects the practical obstacles faced by the spatial spillover of deep synergy. The driving effect of deep synergy between investment in physical capital and investment in human capital on EGC can be effectively exerted locally because the benefits of synergy can be smoothly transmitted and digested within the same administrative and fiscal system. Local government investment in education directly improves the quality of the local labor force, and expenditure on social security directly enhances the local expectation of social stability. These benefits inherently have geographical boundaries. Once crossing administrative boundaries, the transmission chain begins to be blocked.
Even if the labor force in neighboring regions does not have professional skills available in the local region, it is difficult to achieve free mobility without cross-regional social security portability and mutual recognition of public services. Even if the local high-quality medical resources are open to patients from surrounding areas, they cannot produce the same improvement effect on energy decision-making and labor health levels in surrounding areas as in the local region. Local governments inherently prioritize local residents in the supply of public services, leading to a substantial attenuation of the positive externalities of deep synergy at administrative boundaries.
Therefore, the insignificant indirect effect of COL does not mean that deep synergy has no theoretical potential for spatial spillover, but reveals that institutional segmentation—especially administrative barriers in fiscal burden-sharing, social security portability, and mutual recognition of public services—still imposes a hard constraint on the cross-regional transmission of deep synergy at the current stage. The implicit prerequisite of Hypothesis H4—that the benefits of synergy can smoothly cross administrative boundaries—has not been fully satisfied in reality, so the positive spillover mechanism is inhibited by institutional frictions.
The extended model with the interaction term IP × COL further reveals the catalytic effect of the institutional environment on social synergy effects—and the boundary of this catalysis in the spatial dimension. At the direct effect level, the coefficient of the interaction term is 0.145 and highly significant at the 1% level. This result clearly indicates that the IP strong chain system can effectively amplify the improvement effect of deep synergy between investment in physical capital and investment in human capital on local EGC.
When patent navigation provides a clear technical direction for industrial investment, and IP protection makes the return on human capital investment of enterprises and individuals more reliably guaranteed, investment in physical capital and investment in human capital are no longer two isolated parallel tracks, but are more effectively coordinated on the unified information platform provided by the IP system. This improvement in coordination efficiency is directly translated into a higher degree of controllability of the local energy system in the dimensions of green investment, clean substitution and emission decoupling.
In sharp contrast, the coefficient of the interaction term at the indirect effect level is −0.331 and fails to pass the significance test. This means that the institutional amplification effect of the IP strong chain on deep synergy cannot be effectively radiated to neighboring regions at present. The reason for this limitation needs to be understood by returning to the transmission boundary of the moderated variable itself.
The previous analysis has clarified that the spatial spillover channel of COL is blocked by administrative barriers and institutional segmentation. As an institutional lever that can catalyze synergy effects, the radiation radius of the regulatory role of the IP strong chain is fundamentally constrained by the transmission radius of the synergy effect itself. When the channel for the outward radiation of deep synergy has not been fully opened, no matter how much the IP system enhances the effectiveness of synergy locally, it cannot produce a significant identification effect in the spatial dimension. Therefore, the catalytic effect of the IP strong chain on EGC shows a pattern of “locally effective but spatially insignificant” in the data.
The introduction of the interaction term also causes a reversal in the direction of the direct effect coefficient of IP. In the benchmark model, the direct effect of IP is 0.018 and significantly positive at the 10% level; in the extended model, this coefficient becomes −0.056 and significantly negative at the 5% level. This change means that when the model strips out the indirect contribution of the IP strong chain through deep synergy via the interaction term, the direct net effect of IP itself on EGC turns negative. The frictional costs that may accompany the implementation of the IP strong chain policy, such as uneven quality of patent applications and short-term centralized adjustment of examination resource allocation, are reflected in this net effect.
This just confirms an important judgment from the opposite direction: the main path of the IP strong chain driving the improvement of EGC does not lie in the direct and strong intervention of the system itself on the energy system, but in the system indirectly releasing the ability of the energy system to evolve in an orderly manner toward greening by catalyzing the deep integration and positive interaction between investment in physical capital and investment in human capital. Without the transmission channel of deep synergy, the direct effect of the IP system on the energy system is limited and even shows short-term frictions. For this reason, positioning deep synergy as a mediating transmission mechanism, rather than just a parallel explanatory variable, has clear theoretical significance and empirical necessity.
Before interpreting the effect decomposition results, it is worth addressing the coefficient of determination (R2) reported in Table 7. The R2 values of 0.191 for the benchmark model and 0.159 for the extended model are relatively low, which may raise concerns about the explanatory power of the model. However, in the context of panel data analysis with both individual and time fixed effects, low R2 values are not uncommon and do not necessarily indicate a poorly specified model. The inclusion of fixed effects absorbs a substantial portion of the cross-sectional and temporal variation in the dependent variable, and the R2 statistic in such specifications primarily reflects the explanatory power of the time-varying covariates after netting out these fixed effects. More importantly, the primary objective of our empirical analysis is causal identification of the policy effects and transmission mechanisms, rather than maximizing in-sample prediction accuracy. The significance levels and magnitude of the core explanatory variables—IP, COL, and their interaction term—remain robust across multiple specifications and diagnostic tests, which provides stronger evidence for our substantive conclusions than the R2 statistic alone. Furthermore, the robustness checks reported in Section 4.8, including alternative model specifications and variable constructions, confirm that our findings are not driven by model fit concerns.
4.5. Parallel Trend Test
The causal interpretation of the “before-and-after comparison” in the difference-in-differences (DID) model relies on an unobservable but indirectly testable premise: the treatment group and the control group follow a parallel trend before the policy shock. This does not require the two groups of samples to be completely identical in advance—in fact, provinces selected as pilots for the intellectual property (IP) strong chain inherently have a more complete industrial foundation and a more dynamic innovation ecosystem—but rather it examines a more prudent question: whether there were signs of accelerating divergence between the two groups on the eve of policy implementation.
If the answer is yes, the observed ex post gap cannot be cleanly attributed to the policy, as a considerable part of it is a self-fulfilling prophecy of the inherent differences between the two groups. Only when there is no significant divergence before policy implementation can the subsequent gradual inter-group deviation be reasonably interpreted as the causal imprint of the policy.
To empirically test this hypothesis, this paper adopts the analytical framework of the event study methodology. Taking the first period before policy implementation as the baseline period (normalized to zero), we generate dummy variables for each relative period before and after the policy shock and incorporate them into the regression equation together with the set of control variables:
where is energy green controllability, represents the dummy variable for the relative time window of the policy ( indicates the pre-policy period, indicates the policy implementation period, and indicates the post-policy period), is the vector of control variables (including industrial structure rationalization, human capital level, industrial structure advancement, government intervention intensity, and R&D intensity), and and denote individual fixed effects and time fixed effects, respectively.
When presenting the estimated coefficients for each period, this paper does not directly use the raw intercepts from the regression. Instead, we take the average level of the coefficients in the pre-policy periods as the visual baseline and perform an overall coordinate translation of the point estimates for all time points. This treatment does not change the statistical properties of the coefficients, but reduces the arbitrariness of graphical interpretation. When the point estimates of the pre-policy periods are closely and symmetrically distributed around the zero line, the judgment of the pre-event parallel trend no longer depends on the visually estimated relative distance, but is transformed into a clearer criterion: whether the confidence interval of each coefficient covers the zero value.
Figure 2 presents the intuitive results of the parallel trend test. The coefficients of the four estimation windows before policy implementation (from pre4 to pre1) are all closely clustered around the zero line, and their 95% confidence intervals all cover the zero value without exception, showing no statistically significant fluctuation. This empirical fact indicates that before the implementation of the IP strong chain policy, there was no pre-existing divergent trend in EGC between the treatment group and the control group.
Figure 2.
Parallel trend test.
In the period of policy implementation, the coefficient starts to rise from the zero line and enters the positive range. In the three subsequent post-policy windows (post1 to post3), the coefficients remain in the positive range continuously. The above evidence shows that the emergence of the policy effect is not an instantaneous level jump, but a gradual process unfolding over time, which provides support in the time dimension for the causal logic of the decomposition of direct and indirect effects in the previous section.
4.6. Placebo Test
There is a hidden but fatal threat to causal inference: even if the treatment group and the control group pass the parallel trend test, the estimated value of the policy effect may still be the product of some unobservable systematic random fluctuations. In other words, the observed “policy effect” may not be caused by the intellectual property (IP) strong chain system itself. Instead, there may be an inherent fluctuation pattern in the data that appears at a specific frequency and amplitude regardless of the policy, which happens to overlap with the implementation time point of the policy. The placebo test provides a line of defense against this threat.
Its core logic can be expressed as a counterfactual inquiry: if the policy implementation time is deliberately disrupted, and the policy treatment status is randomly assigned to observation units that are not actually eligible for the policy, can we still “detect” an effect of the same significance and magnitude in the data? If the answer is yes, the effect observed in the benchmark regression is essentially a ubiquitous statistical waveform unrelated to the policy itself. If the answer is no—that is, the spurious policy shock only generates noise randomly scattered around zero—then the non-accidental nature of the benchmark regression results is strongly corroborated.
The placebo test was carried out according to the following steps. First, while keeping the real correlation structure between covariates and the explained variable unchanged, we performed 500 rounds of random permutations on the policy treatment variable of the IP strong chain in the sample. Each permutation essentially constructs a set of placebo policies: the policy treatment status is randomly assigned to certain provinces, and the policy implementation time is also randomly assigned, thus completely severing the link between the policy variable and the real institutional reform.
Subsequently, we repeat the benchmark regression using these 500 sets of placebo policy variables and extract the estimated coefficient and standard error of each regression to form the empirical distribution of placebo policy effects. If the policy effect identified in the benchmark regression is real, these 500 placebo coefficients should be closely clustered around zero, and the vast majority of them should be statistically indistinguishable from zero. Meanwhile, the real estimated coefficient obtained from the benchmark regression should be clearly located in the tail region of this distribution.
Figure 3 presents the distribution pattern of the above placebo policy effects. The horizontal axis represents the regression coefficients of the placebo policy variable, the blue scatter points mark the coefficient estimates and corresponding p-values of each placebo regression, and the red kernel density curve depicts the overall shape of the placebo coefficient distribution. Two characteristics are clearly identifiable in the figure.
Figure 3.
Placebo test.
First, the kernel density curve of the placebo coefficients presents an approximately symmetrical shape centered on zero. The vast majority of placebo coefficients are tightly compressed in a narrow interval on both sides of zero, and none of the placebo coefficients are close to the magnitude of the real policy effect in the benchmark regression in absolute value. This distribution structure directly rejects the alternative hypothesis that “the policy effect is merely a universal statistical fluctuation”. If the benchmark regression results were only accidental noise, noise of this magnitude should have a high probability of being reproduced in the randomization process, rather than being systematically absent from the entire placebo coefficient distribution.
Second, the p-values of the placebo coefficients are far from the significance thresholds of 0.05 or 0.10 in most cases, indicating that after artificially cutting off the link between the policy and institutional reform, these placebo policies are almost universally “insignificant” at conventional confidence levels. Taken together, the positive effect of the IP strong chain on energy green controllability captured by the benchmark regression can hardly be attributed to the driving force of some unknown random factors that happen to coincide with the policy implementation time.
4.7. Benchmark Regression Based on Double Machine Learning
The Spatial Durbin Model in the previous section preliminarily separates the direct and indirect effects of the intellectual property (IP) strong chain and deep synergy on energy green controllability (EGC) within the framework incorporating spatial interaction effects. However, the validity of any parametric model is inherently constrained by its preset functional form. When control variables have a high dimension and there are potential nonlinear entanglements with core explanatory variables, the linear specification may distort the direction and magnitude of policy effect estimates.
This issue deserves particular prudence in provincial panel data: the relationships between variables such as industrial structure, human capital, government intervention intensity, and the energy system usually present different slopes and even different directions at different stages of economic development; it is difficult for linear models to fully characterize such structural variations.
The introduction of Double Machine Learning (DML) provides a path to alleviate the above concerns. Its core idea can be stated as follows: instead of pre-specifying the functional form of control variables entering the equation, the machine learning algorithm is allowed to learn this form from the data. Meanwhile, the regularization bias inherent in machine learning estimation under high-dimensional settings is avoided through the technical design of orthogonalization and sample splitting.
The work of Chernozhukov et al. (2018) [44] laid the theoretical foundation for this method. They proved that under the triple guarantees of Neyman orthogonal moment conditions, high-quality machine learning estimation and cross-fitting, the estimator of low-dimensional treatment parameters has asymptotic normality, thus supporting conventional statistical inference. The greatest advantage of this framework is that it can flexibly capture complex nonlinear interactions among control variables without worrying that such flexibility comes at the cost of the consistency and distribution approximation of parameter estimation.
The DML benchmark analysis in this paper adopts the gradient-boosting tree as the baseline algorithm and performs 5-fold cross-fitting on the sample. The set of control variables includes industrial structure rationalization, human capital level, industrial structure advancement, government intervention intensity, R&D intensity, and individual and time fixed effects. The results of the benchmark regression are summarized in Table 8.
Table 8.
Benchmark regression results of double machine learning.
Column (1) of Table 8 shows that the estimated coefficient of the IP strong chain (IP) on EGC is 0.037, which is significantly positive at the 1% level. After effectively stripping the potential complex interference of high-dimensional covariates, the IP strong chain policy still significantly promotes the improvement of EGC, confirming the robustness of Hypothesis H1. Column (2) shows that the estimated coefficient of deep synergy between investment in physical capital and investment in human capital (COL) is 0.465, which is also highly significant at the 1% level, reconfirming the positive driving effect of deep synergy on EGC.
A horizontal comparison of the absolute values of the coefficients in the two columns reveals that the effect of COL is much larger than the direct effect of IP—the former is about 12 times the latter. The economic implication of this huge gap is that the direct intervention power of the IP system itself on EGC is relatively limited, and the real driving force for the transition comes from the deepening of the coupling coordination between investment in physical capital and investment in human capital. This finding forms a logical echo with the phenomenon that “the IP coefficient reverses to negative after stripping the synergy effect” in the previous interaction term analysis: the contribution of the IP strong chain is more reflected as a catalytic effect, rather than directly participating in the reconstruction of the energy system.
4.8. Mediation Effect Test: The Transmission Role of Deep Synergy Between Investment in Physical Capital and Investment in Human Capital
The effect decomposition of the Spatial Durbin Model confirms the direct impacts of the intellectual property (IP) strong chain and deep synergy on energy green controllability (EGC), respectively, but these two lines of action are not independent paths advancing in parallel. The previous theoretical mechanism predicted that an important function of the IP strong chain is to catalyze the coupling and synchronization between investment in physical capital and investment in human capital. When patent navigation guides the direction of physical capital and IP protection guarantees the return on human capital, investment in physical capital and investment in human capital are no longer two separate tracks extending independently, but are more effectively coordinated on the unified information platform provided by the IP system. The ultimate goal of this catalytic effect is the systematic improvement of EGC. If this transmission logic holds, deep synergy plays the role of a mediating bridge between the IP strong chain and the EGC.
To test this mechanism path, this paper embeds the logical structure of stepwise regression into the double machine learning (DML) framework. The test procedure of the stepwise method follows a clear hierarchical progressive logic: first, confirm whether the total effect of the core explanatory variable on the explained variable exists—this is the basic prerequisite for the establishment of the mediation effect; second, test whether the core explanatory variable has a significant impact on the mediating variable; finally, observe the change direction and magnitude of the direct effect in the equation that includes both the core explanatory variable and the mediating variable. If the total effect is significant, the path coefficients of the two segments constituting the indirect effect are respectively significant, and the direct effect shows an identifiable attenuation in value, the existence of a partial mediation effect can be determined. Considering that the statistical inference power of the stepwise method for the product of coefficients is relatively conservative, this paper reports the Z-statistics of three coefficient product tests, namely the Sobel test, Aroian test and Goodman test, after the stepwise method, to obtain cross-validation of the judgment basis.
The complete estimation results of the mediation effect are summarized in Table 9. All equations adopt the gradient-boosting tree algorithm and 5-fold cross-fitting. The set of control variables includes industrial structure rationalization, human capital level, industrial structure advancement, government intervention intensity and R&D intensity, while individual fixed effects and time fixed effects are controlled. Among them, Equation (1) estimates the total effect of the IP strong chain (IP) on energy green controllability (EGC), Equation (2) estimates the effect of IP on the mediating variable—deep synergy between investment in physical capital and investment in human capital (COL)—and Equation (3) includes both IP and COL to separate the direct effect and the indirect effect transmitted through COL.
Table 9.
Mediation effect test results.
The results of Equation (1) show that the total effect of the IP strong chain on EGC is 0.037, which is significantly positive at the 1% level, constituting the precondition for the mediation effect analysis. In Equation (2), the effect of IP on COL is 0.030, which is also significant at the 1% level, confirming that the improvement of the IP system can effectively promote the improvement of the coupling coordination degree between the two systems of investment in physical capital and investment in human capital. The existence of this effect has a solid institutional logic: patent navigation provides clear guidance on the technical feasibility for capital investment, reducing the risk of ineffective investment; the growth of IP-intensive industries has spawned demand for interdisciplinary talents in law, technology transfer and patent management, guiding education and training resources to tilt toward these fields; the strengthening of IP protection makes the return on human capital investment of enterprises and individuals more predictable, incentivizing more resources to be allocated to human development. After including both IP and COL in Equation (3), the effect of COL on EGC is as high as 0.451 and highly significant at the 1% level, while the direct effect of IP drops from 0.037 of the total effect to 0.024, a decrease of more than one-third. This set of coefficient patterns—significant total effect, respectively significant path coefficients of the two segments of the indirect effect, and a substantial decline in the value of the direct effect—systematically points to a judgment: deep synergy between investment in physical capital and investment in human capital plays a significant partial mediating role in the process of the IP strong chain improving EGC.
In terms of the magnitude of the mediation effect, the calculation shows that the proportion of the indirect effect transmitted through deep synergy in the total effect is about 36.8%. The message conveyed by this ratio is that more than one-third of the effect of the IP strong chain in promoting the improvement of EGC is achieved by promoting the coupling coordination between investment in physical capital and investment in human capital, rather than the direct intervention of the system itself on the energy system. The Z-statistic of the Sobel test is 2.687, the Z-statistic of the Aroian test is 2.657, and the Z-statistic of the Goodman test is 2.717, all of which are significant at the 1% level. The consistency of the three product tests provides robust statistical support for the existence of the mediation effect. Thus, Hypothesis H5 is empirically confirmed—deep synergy between investment in physical capital and investment in human capital constitutes a key transmission channel for the IP strong chain to release the effectiveness of the energy green transition.
4.9. Robustness Checks
For an empirical conclusion to withstand rigorous scrutiny, a single benchmark specification is insufficient. In the benchmark regression, the choice of machine learning algorithm (gradient-boosting tree), the number of cross-fitting folds, and the boundary of the control variable set all imply the researcher’s prior judgments. If these judgments themselves exert a material impact on the conclusions, the policy effects and mediation paths presented in the benchmark model may not be a true reflection of the inherent structure of the data, but rather an artifact of specific model specifications.
The value of robustness checks lies in relaxing these specification conditions one by one and examining the same core question: whether the conclusions still hold when identifiable changes are made to the analytical presets. This paper conducts robustness checks from three dimensions: replacing the machine learning algorithm to eliminate the interference of single algorithm preference, adjusting the number of cross-fitting folds to test the sensitivity of the sample splitting method, and incorporating contemporaneous competitive policy variables into the high-dimensional control variable set to purify the policy identification environment. All checks fully retain the three-stage estimation framework of the mediation effect, and simultaneously report the three statistics of the Sobel test, Aroian test and Goodman test. The test results are summarized in Table 10.
Table 10.
Robustness check results.
First, we consider the robustness of algorithm replacement. The gradient-boosting tree adopted in the benchmark regression has the advantage of flexibly capturing complex nonlinear interactions between variables, but this flexibility itself also constitutes a potential concern: whether the conclusions only hold under this specific learning mechanism. This paper replaces the algorithm with a linear support vector machine (SVM) for re-testing.
The results show that the total effect coefficient is 0.011 and significant at the 1% level, the effect of IP on COL is 0.015 and significant at the 1% level, and the effect of COL on EGC is 0.296 and significant at the 1% level. The Sobel Z statistic is 3.864, the Aroian Z statistic is 3.832, and the Goodman Z statistic is 3.896, all of which far exceed the 1% critical value. In other words, after replacement with an algorithm with a completely different learning logic and different assumptions about data distribution, the mediation transmission path is still robust, and the benchmark conclusions are not sensitive to algorithm selection.
Second, we test the sensitivity of the number of cross-fitting folds. In double machine learning, the choice of the number of folds is directly related to the relative size of the auxiliary sample and the main sample, which in turn affects the estimation accuracy of the nuisance function. This paper adjusts the benchmark 5-fold to 8-fold and 4-fold, respectively.
Under the 8-fold specification, the Sobel Z statistic is 2.911, significant at the 1% level. Under the 4-fold specification, the Sobel Z statistic is 1.936, significant at the 10% level, the Aroian Z statistic is 1.912 (p < 0.10), and the Goodman Z statistic is 1.962 (p < 0.05). Although the significance levels of the three tests fluctuate, they consistently point to the existence of the mediation effect. The corresponding fluctuation of the mediation ratio—a certain degree of swing in the mediation effect value under differences in sample splitting—is a normal phenomenon of double machine learning under finite samples, not a warning signal for the reliability of the conclusions. Importantly, no matter how the number of folds changes, the transmission chain of IP → COL → EGC is always statistically identifiable.
Finally, we eliminate the interference of contemporaneous competitive policies. During the policy window period of the IP strong chain pilot, Chinese provinces simultaneously promoted a number of institutional experiments, among which the pilot program for the construction of innovative provinces is the most representative. This system aims to improve the overall regional innovation capacity, and its policy connotation—including increasing R&D investment subsidies, building scientific and technological innovation platforms, and optimizing the innovation ecosystem—has multiple overlapping areas with the IP strong chain. If not controlled, it may confound the identification of the net effect of the IP strong chain policy.
This paper incorporates the policy dummy variable of the innovative province construction pilot into the high-dimensional control variable set and re-runs the full-process estimation. The results show that the total effect of IP is 0.029, the effect of IP on COL is 0.028, and the effect of COL on EGC is as high as 0.503, all of which are significant at the 1% level. The Sobel Z statistic is 3.226 (p < 0.01), the Aroian Z statistic is 3.203 (p < 0.01), and the Goodman Z statistic is 3.249 (p < 0.01). After completely purifying the confounding effects of contemporaneous competitive policies, the mediation transmission path of deep synergy between investment in physical capital and investment in human capital is not only still robust, but its transmission intensity is further enhanced compared with the benchmark model. This further confirms the independence and reliability of this mechanism path.
The benchmark spatial econometric results reported in Section 5.3 were obtained under the specification of the economic distance spatial weight matrix, which assumes that the spatial interaction intensity between provinces is inversely proportional to their differences in per capita GDP. While this choice is theoretically justified by the nature of our research question—institutional diffusion and factor flows depend more on economic gradients than on geographic adjacency—the possibility remains that the results, particularly the differentiated spatial spillover patterns between IP strong chain and deep synergy, may be sensitive to the specific weighting scheme employed. To address this concern, we re-estimated the Spatial Durbin Model using two alternative spatial weight matrices and report the direct and indirect effects of the core explanatory variables in Table 11. The first alternative is the geographic inverse distance matrix, where the weight between province i and province j is defined as the reciprocal of the great-circle distance between their provincial capitals. This matrix captures spatial dependence that decays with physical distance, reflecting mechanisms such as technology diffusion through geographic proximity and cross-border labor mobility. The second alternative is the economic–geographic nested matrix, constructed as a Hadamard product of the normalized geographic distance matrix and the normalized economic distance matrix, which allows spatial correlation to arise from both geographic proximity and economic similarity. This nested specification provides a more comprehensive characterization of inter-regional dependence by allowing the two sources of proximity to jointly determine the spatial weight.
Table 11.
Robustness checks with alternative spatial weight matrices (direct and indirect effects).
The results from these alternative specifications are presented in Table 11. They demonstrate that our core conclusions are robust to the choice of spatial weight matrix. Under all three matrix specifications, the direct effect of COL remains strongly positive and statistically significant at the 1% level, confirming that deep synergy between physical and human capital investment consistently enhances local energy green controllability regardless of how spatial dependence is modeled. The indirect effect of COL, however, fails to reach conventional significance levels across all specifications, reinforcing our main finding that the spatial spillover of deep synergy is effectively blocked by administrative barriers and fiscal boundaries. For the IP strong chain, the direct effect is positive but only marginally significant under the geographic distance matrix and the nested matrix, while the indirect effect remains consistently positive and statistically significant across all three specifications. This stable pattern supports our interpretation that the institutional dividends of the IP system, particularly the technical knowledge base formed through patent information disclosure, can diffuse across regions regardless of the specific spatial weighting structure. The interaction term IP × COL exhibits a positive and highly significant direct effect under all matrices, while its indirect effect remains statistically insignificant, further confirming that the catalytic role of the IP system in amplifying the local benefits of deep synergy is a robust phenomenon that does not extend to spatial spillovers under current institutional conditions. Taken together, these robustness checks provide strong evidence that our key findings are not artifacts of the chosen spatial weight matrix, and they lend additional credibility to the conclusion that administrative fragmentation constitutes a binding constraint on the cross-regional transmission of deep synergy benefits.
A further concern regarding the validity of our empirical results pertains to the construction of the energy green controllability index. While the entropy method provides an objective weighting scheme based on the information content of each indicator, and the cybernetic framework offers a coherent theoretical justification for the four-dimensional structure, the reviewer rightly notes that some components may mechanically reflect the economic scale rather than genuine green controllability. For instance, energy industry investment and industrial added value are naturally larger in more economically developed provinces, which could potentially bias the composite index toward reflecting economic size rather than governance capacity. To address this concern, we reconstruct the EGC index using two alternative approaches and re-estimate our benchmark DML models.
The first alternative is principal component analysis, which extracts the common variation across all 12 sub-indicators and retains the first principal component as the composite measure. Unlike the entropy method, PCA does not assume that indicators with greater variation are more important; instead, it identifies the linear combination that maximizes the explained variance. The second alternative is the equal weighting method, where the four dimensions—green investment regulation, clean substitution regulation, emission decoupling regulation, and output guarantee regulation—are each assigned a weight of 0.25, and within each dimension, the constituent indicators are equally weighted. This approach completely eliminates any influence of indicator variation on the weighting scheme and provides a useful benchmark for assessing whether our results are driven by the specific weighting logic of the entropy method.
The results of these robustness checks are reported in Table 12. Under both alternative constructions, the estimated coefficients of both IP and COL on EGC remain positive and statistically significant at the 1% level, confirming that our core findings are not artifacts of the entropy weighting procedure. The magnitude of the coefficients exhibits some variation across methods—the PCA-based estimates are somewhat larger while the equal-weight estimates are slightly smaller—but the direction, significance, and relative ordering of the effects remain unchanged. Most importantly, the coefficient of COL is consistently about ten times larger than that of IP across all specifications, reinforcing our central conclusion that deep synergy between physical and human capital investment constitutes the primary structural driver of energy green controllability, while the IP system plays a more indirect role. The consistency of results across these alternative index constructions provides strong evidence that the EGC index captures meaningful variation in energy governance capacity rather than merely reflecting economic scale. We therefore maintain confidence that our empirical findings are robust to the specific method used to synthesize the EGC composite index.
Table 12.
Robustness checks with alternative EGC index constructions (DML benchmark regression).
4.10. Separate Path Mediation Effect Test: Independent Transmission of Investment in Human Capital and Investment in Physical Capital
The mediation effect test in the previous section has confirmed at the overall level that the deep synergy between investment in physical capital and investment in human capital is the key transmission channel for the intellectual property (IP) strong chain to release the effectiveness of improving energy green controllability (EGC). However, “deep synergy” itself is a coupled construct—it is formed by the interweaving of two independent systems of investment in physical capital and investment in human capital through the institutional platform.
What the overall test cannot answer is: how much transmission power is borne by each of the two separate paths? Does the IP strong chain transform institutional effectiveness into the green controllability of the energy system by improving the structure of physical capital (investment in physical capital), upgrading the quality of human capital (investment in human capital), or through the joint force of the two paths? Conducting separate mediation effect tests on these two dimensions is not only a further decomposition and deepening of the overall hypothesis, but also has clear policy implications: if there is a significant difference in the transmission intensity between the two paths, the priority of policy resource allocation between “physical capital” and “human capital” has an empirical basis.
This paper applies the double machine learning (DML) mediation effect framework to the two separate paths of investment in human capital (HCM) and investment in physical capital (PHC), respectively, conducts three-stage stepwise regression in turn, and reports the three product of coefficients test statistics of the Sobel test, Aroian test and Goodman test. The test results are summarized in Table 13.
Table 13.
Separate path mediation effect test results.
First, we examine the separate path of investment in human capital. The effect of the IP strong chain on investment in human capital is 0.030 and significant at the 1% level; the effect of investment in human capital on EGC is 0.490, which is also highly significant at the 1% level. Meanwhile, the direct effect of IP drops from 0.037 of the total effect to 0.023, a decrease of nearly 40%. The Sobel Z statistic is 2.772, the Aroian Z statistic is 2.746, and the Goodman Z statistic is 2.800, all of which are significant at the 1% level.
This evidence clearly indicates that investment in human capital constitutes an independent and efficient transmission channel for the IP strong chain to promote the improvement of EGC. Its mediation ratio reaches 39.1%, meaning that the transition effectiveness released by the IP strong chain through improving the quality of human capital contributes nearly 40% of the total effect. The realistic foundation of this transmission effectiveness comes from a concise economic logic: when the IP system makes the return on human capital more predictable—the patent achievements of R&D personnel can obtain more effective legal protection, and the professional services of technology transfer personnel can obtain more stable market pricing—social resources are more likely to be allocated to education, training, health and other fields. Such allocation cannot be directly mandated by the system itself, but is the result of indirect guidance by the system through reshaping the incentive structure. A higher-quality labor force means more accurate and efficient operation and maintenance of clean energy equipment, more sustained and powerful independent iteration of energy-saving technologies, and more conscious public understanding and participation in energy transition, thereby systematically enhancing the region’s controllability over the green transition of the energy system.
Next, we look at the separate path of investment in physical capital. The effect of IP on investment in physical capital is 0.030, significant at the 5% level; the effect of investment in physical capital on EGC is 0.351, significant at the 1% level; and the direct effect of IP drops from 0.037 of the total effect to 0.029. The Sobel Z statistic is 1.895, the Aroian Z statistic is 1.847, and the Goodman Z statistic is 1.947, all of which are significant at the 10% level.
The mediation effect of investment in physical capital is positive in direction and statistically significant, but it is relatively weaker than the investment in human capital path in terms of both significance level and mediation ratio (27.7%). This gap is largely related to the large stock scale, high structural inertia, and difficulty in fundamental adjustment in the short term of physical capital investment. Once expressways and factories are built, they are locked in for a long time, while the depreciation and upgrading of high-tech equipment and digital infrastructure require continuous verification of the return on capital investment. This means that the transformation of IP system signals into the substantial upgrading of the energy efficiency level of large-scale physical capital stock needs to go through a longer and more indirect transmission chain than investment in human capital. Shortening this transmission chain is not only achieved by improving the IP system, but also requires the coordinated efforts of supporting systems such as financial regulation and industrial policies to jointly promote the substantial change in the direction of capital flow.
The comparison of the two separate paths reveals valuable structural information. The mediation effect of investment in human capital is slightly better in terms of intensity and significance, indicating that at the current stage, the effectiveness of the IP strong chain in promoting EGC is largely released through the “software” channel of improving the quality, capability and security level of human capital. Improvements in education, health, social security and other fields constitute the smoothest path for the transformation of institutional effectiveness into transition momentum. Although the “hardware” channel of investment in physical capital is also operating, its transmission chain is longer, it involves more demands for institutional coordination, and the release of effectiveness is relatively slow.
On this basis, Hypothesis H5a and Hypothesis H5b are both empirically supported: investment in human capital and investment in physical capital each independently constitute an effective mediation path for the IP strong chain to improve EGC. The two separate paths jointly support the establishment of the overall mediation transmission mechanism, but the investment in the human capital path performs more prominently in terms of transmission efficiency and statistical robustness.
5. Research Conclusions and Policy Recommendations
5.1. Research Conclusions
Based on the four-dimensional analytical framework of cybernetics, this paper constructs energy green controllability (EGC), a dynamic governance capability indicator distinct from the static “greening level”. Taking the panel data of 30 provincial administrative regions in China from 2010 to 2022 as the sample, this paper systematically examines the impacts and transmission mechanisms of the regional intellectual property (IP) strong chain and the deep synergy between investment in physical capital and investment in human capital on EGC, using the Spatial Durbin Difference-in-Differences (SDM-DID) model and Double Machine Learning (DML) method. The main conclusions are as follows.
First, the regional IP strong chain significantly improves EGC, and this improvement effect is not derived from the direct intervention of the system in the energy system, but is indirectly realized by reshaping the decision-making criteria for capital investment. In the spatial dimension, the positive driving effect of the IP strong chain on the local region is verified, and the spillover of its institutional dividend to neighboring regions is also empirically supported—the technical knowledge base formed by the disclosure of patent information constitutes the main channel for cross-regional transmission.
Second, the deep synergy between investment in physical capital and investment in human capital has a significant and strong promoting effect on EGC, and its local effect is far greater than the direct effect of the IP strong chain itself, indicating that deep synergy is the core structural driving force for the green transition of the energy system. However, the spatial spillover channel of deep synergy is blocked by administrative barriers and institutional segmentation—the fiscal boundaries of provincial administrative regions constitute hard constraints on cross-regional transmission in public service fields such as healthcare, education, and social security. This finding reminds policymakers that the benefits of synergy have a strong geographical lock-in effect under the current governance framework. To achieve a wider range of spatial radiation, the primary task is not to increase the local degree of synergy, but to open up institutional channels across administrative regions.
Third, the deep synergy between investment in physical capital and investment in human capital constitutes a key mediating path for the IP strong chain to improve EGC. The benchmark mediation effect shows that more than one-third of the policy effect is released through the channel of deep synergy. More importantly, the two separate paths—investment in physical capital and investment in human capital—each independently play a significant mediating role, but the investment in the human capital path is significantly better than the investment in the physical capital path in terms of the transmission intensity, statistical robustness and mediation ratio. This finding reveals a thought-provoking structural fact: at the current stage, the effectiveness of the IP strong chain system in promoting EGC does not largely depend on the direct transformation of the physical capital structure, but releases the transition momentum of the system by improving the quality, capability and security level of human capital. This is the most distinctive empirical structural insight provided by the mediation analysis for this paper.
Fourth, robustness checks show that the mediation transmission effect of deep synergy remains robust regardless of whether the machine learning algorithm is replaced, the sample splitting ratio is adjusted, or the interference of competitive policies such as the contemporaneous pilot program for the construction of innovative provinces is eliminated. It is particularly noteworthy that after excluding competitive policies, the intensity of the mediation effect is enhanced compared with the benchmark model—this indicates that the IP strong chain and the pilot program for the construction of innovative provinces do not mutually reinforce each other at the factor allocation level, but each bear institutional functions of different dimensions.
5.2. Policy Recommendations
First, embed industrial chain IP governance into energy transition decision-making. Reverse the traditional investment logic of capital chasing cheap factors at the root level of decision-making criteria, and shift it to a new path of pursuing technological barriers and innovation density. Specific institutional measures include: formally incorporating patent navigation into the feasibility demonstration process of major energy investment projects, making technological autonomy and technological added value a capital allocation yardstick with higher weight than resource endowment and cost depression; setting up a special energy technology section in industrial IP operation centers and implementing priority examination and targeted transformation for key emission reduction fields such as energy storage, hydrogen energy, and carbon capture, utilization and storage (CCUS); incorporating the cultivation, transformation and industrialization indicators of high-value green patents into the local government energy assessment system; and changing the current practice of taking the completed amount of technological transformation investment as the single standard for energy efficiency assessment.
Second, build cross-administrative collaborative channels to release the social benefits of deep synergy from the local region to the wider regional scope. The empirical findings of this paper reveal that the failure of deep synergy between investment in physical capital and investment in human capital at the spatial spillover level is caused by institutional segmentation rather than resource scarcity. The key threshold to solve this dilemma is to break through fiscal boundaries. This paper suggests that under the institutional framework of the construction of a unified national market, priority should be given to promoting cross-administrative mutual recognition and interconnection in the two fields of education and social security. In terms of specific operation, pilot the “cross-regional accumulation of social security rights and interests” mechanism to achieve seamless portability of social security payment years and benefit entitlements of workers across different provinces, and establish a “cost-sharing and benefit-sharing mechanism for education investment” to enable the education and training achievements of outflow regions to obtain appropriate compensation in inflow regions, thus providing an institutional prerequisite for the free cross-regional flow of human capital. These institutional constructions are the prerequisites for releasing the spatial positive externalities of deep synergy—without this prerequisite, any marginal improvement in the local synergy level will be blocked within the boundaries of administrative divisions.
Third, adjust the focus of investment, shifting from the emphasis on “investment in physical capital” to the coordinated advancement of “investment in physical capital and investment in human capital”. The structural difference in the mediation effects of the two separate paths shows that the transformation of institutional effectiveness into green transition momentum at the current stage is more dependent on the quality of human capital. Continuously increasing investment in human capital—especially in vocational education, skill training and public health that are highly correlated with the needs of industrial chain modernization—can produce two simultaneous effects: the direct effect is to provide qualified labor supply for the green operation of the energy system, and the indirect effect is to enhance the public’s willingness to support and participate in energy transition policies through the improvement of social stability expectations. In terms of institutional design, it is recommended to pre-align the skill-training system with local clean energy industry planning to ensure that the construction and operation of clean energy bases have sufficient local talent reserves, and to avoid the structural mismatch where equipment waits for talent and talent has no scope for its abilities.
Fourth, establish a dynamic monitoring and diagnosis mechanism to quickly identify the imbalance signals of deep synergy. This paper constructs the EGC measurement system from the perspective of cybernetics, and its theoretical enlightenment is that any systematic project with a directional goal requires continuous calibration of feedback signals. It is recommended to establish an annual diagnostic report system for the “adaptation degree of investment in physical capital and investment in human capital” at the provincial government level and continuously track the matching degree between the deployment progress of information infrastructure and the training scale of digital technology talents, the synchronization between the growth rate of installed capacity of clean energy and the reserve of professional and skilled talents in related fields, and the coordination between the coverage of the social security network and the employment transition pressure of energy-intensive industries. The early warning value of this system lies in that it can send signals before the structural imbalance is solidified into path lock-in, and gain valuable reaction time for policy adjustment.
Fifth, grasp the rhythm of institutional diffusion and implement targeted policies by category. The placebo test of this paper rules out the possibility that the policy effect is only random fluctuation, but the effect decomposition and robustness analysis also reveal a fact that cannot be avoided: the spatial spillover of deep synergy has not been fully realized at the current stage, and there is still room for optimization in the transition momentum released by the IP strong chain through deep synergy. These three characteristics provide a clear positioning for understanding the stage of the system—the core task at present is to consolidate and deepen the transmission mechanism at the local level, rather than rushing to pursue institutional output in the spatial dimension. It is equally important to maintain a clear understanding of regional heterogeneity while implementing universal policies. The comparative advantage of some provinces lies in the green transition of high-end manufacturing, while the stock advantage of other provinces is more likely to come from the large-scale layout of clean energy bases. Policy design should allow the former to reduce embodied carbon in the production process more through innovation and standards and allow the latter to find their own green growth path in the large-scale export of clean electricity. Enabling each region to find a differentiated positioning adapted to its own endowment in the macro transition is the bottom-line guarantee to prevent the expansion of inter-regional development gaps caused by one-size-fits-all policies.
5.3. Limitations and Future Research Directions
Several limitations should be acknowledged when interpreting our findings. First, while the DML framework flexibly controls for observed confounders and the event study supports the parallel trends assumption, our mediation analysis relies on the sequential ignorability assumption, which requires that no unobserved confounders affect the IP–synergy or synergy–EGC relationships after conditioning on the controls. This assumption is fundamentally untestable with observational data, and therefore our mediation results should be interpreted as evidence consistent with the proposed transmission pathway rather than a definitive causal decomposition. We have accordingly used cautious language throughout the manuscript, referring to mediating pathways and indirect effects rather than asserting causal mediation. Second, the measurement of energy green controllability inevitably involves some degree of measurement error, and although we have conducted robustness checks using alternative index constructions, the entropy weights reflect sample variation rather than inherent theoretical importance. Third, our provincial-level analysis masks within-province heterogeneity, and the spatial weight matrix specification, while subjected to alternative specifications, inevitably reflects prior assumptions about inter-regional dependence.
Future research could extend our analysis in several directions. As more recent data become available, longer-term effects of the IP strong chain policy could be assessed to examine whether the mediating role of deep synergy strengthens or weakens over time. Additionally, future studies could explore more disaggregated data at the city or firm level to better capture within-province heterogeneity, and could investigate whether the institutional barriers blocking the spatial spillover of deep synergy are gradually dismantled as China’s unified national market construction progresses. Comparative studies across different institutional contexts would also help determine the generalizability of our findings beyond the Chinese setting.
Author Contributions
Conceptualization, Y.W. and K.L.; methodology, Y.W.; software, Y.W. and L.Z.; validation, Y.W., L.Z. and K.L.; formal analysis, Y.W.; investigation, Y.W., L.Z. and K.L.; resources, K.L.; data curation, Y.W. and L.Z.; writing—original draft preparation, Y.W.; writing—review and editing, Y.W. and K.L.; visualization, Y.W.; supervision, K.L.; project administration, K.L.; funding acquisition, K.L. All authors have read and agreed to the published version of the manuscript.
Funding
This research was funded by the National Social Science Fund of China, grant number 22CTQ028, titled “Research on the Construction and Synergistic Evolution of an Innovation Ecosystem Integrating ‘Technology-Economy-Region’ Information under the ‘Dual Carbon’ Goals”.
Data Availability Statement
The original contributions presented in this study are included in the article.
Conflicts of Interest
The authors declare no conflicts of interest.
Appendix A
Table A1.
Comprehensive evaluation index system of investment in physical capital and investment in human capital.
References
- He, Q.; Du, W.; Wu, J. Intellectual property protection, green technology innovation, and energy transition: An evolutionary game analysis. Energy Econ. 2025, 151, 108901. [Google Scholar] [CrossRef] [Scilit]
- Nie, S. Does intellectual property rights protection matter for low-carbon transition? The role of institutional incentives. Econ. Model. 2024, 140, 106842. [Google Scholar] [CrossRef] [Scilit]
- Jin, W.; van der Ploeg, F.; Zhang, L. How clean capital slows down disinvestment of carbon-intensive capital in the low-carbon transition. J. Econ. Dyn. Control 2024, 162, 104857. [Google Scholar] [CrossRef] [Scilit]
- Dai, J.; Ahmed, Z.; Alvarado, R.; Ahmad, M. Assessing the nexus between human capital, green energy, and load capacity factor: Policymaking for achieving sustainable development goals. Gondwana Res. 2024, 129, 452–464. [Google Scholar] [CrossRef] [Scilit]
- Bernstein, S.; Hoffmann, M. Climate politics, metaphors and the fractal carbon trap. Nat. Clim. Change 2019, 9, 919–925. [Google Scholar] [CrossRef] [Scilit]
- Geels, F.W. Regime resistance against low-carbon transitions: Introducing politics and power into the multi-level perspective. Theory Cult. Soc. 2014, 31, 21–40. [Google Scholar] [CrossRef] [Scilit]
- Yang, G.; Zhang, Y.; Yu, X. Intellectual property rights and the upgrading of the global value chain status. Pac. Econ. Rev. 2020, 25, 185–204. [Google Scholar] [CrossRef] [Scilit]
- Gao, X.; Zhao, Y. Does intellectual property protection promote green innovation in firms? A perspective on R&D spillovers and financing constraints. PLoS ONE 2023, 18, e0288315. [Google Scholar] [CrossRef] [Scilit] [PubMed]
- Wang, S.; Zhou, H.; Zhao, T. Configuration paths to high-value patents: Evidence from patents winning the China Patent Awards. Scientometrics 2024, 129, 2633–2658. [Google Scholar] [CrossRef] [Scilit]
- Li, Y.; Zhang, Y.; Hu, J.; Wang, Z. Insight into the nexus between intellectual property pledge financing and enterprise innovation: A systematic analysis with multidimensional perspectives. Int. Rev. Econ. Financ. 2024, 93, 700–719. [Google Scholar] [CrossRef] [Scilit]
- Kim, J.E. Regulation trumps economics? Examining renewable energy policy, diffusion and investment in 80 developing countries. Energy Res. Soc. Sci. 2020, 70, 101613. [Google Scholar] [CrossRef] [Scilit]
- Zhao, C.; Wang, J.; Dong, K.; Wang, K. How does renewable energy encourage carbon unlocking? A global case for decarbonization. Resour. Policy 2023, 83, 103622. [Google Scholar] [CrossRef] [Scilit]
- Tong, D.; Zhang, Q.; Zheng, Y.; Caldeira, K.; Shearer, C.; Hong, C.; Qin, Y.; Davis, S.J. Committed emissions from existing energy infrastructure jeopardize 1.5 °C climate target. Nature 2019, 572, 373–377. [Google Scholar] [CrossRef] [Scilit] [PubMed]
- Haberl, H.; Wiedenhofer, D.; Virág, D.; Kalt, G.; Plank, B.; Brockway, P.; Fishman, T.; Hausknost, D.; Krausmann, F.; Leon-Gruchalski, B.; et al. A systematic review of the evidence on decoupling of GDP, resource use and GHG emissions, part II: Synthesizing the insights. Environ. Res. Lett. 2020, 15, 065003. [Google Scholar] [CrossRef] [Scilit]
- Dawid, S.; Vinardell, S.; Valderrama, C. Can green economic growth and carbon emission reduction coexist? A decoupling study in the energy sector. J. Clean. Prod. 2026, 549, 147867. [Google Scholar] [CrossRef] [Scilit]
- Shayegh, S.; Reissl, S.; Roshan, E.; Calcaterra, M. An assessment of different transition pathways to a green global economy. Commun. Earth Environ. 2023, 4, 448. [Google Scholar] [CrossRef] [Scilit]
- Ghouse, G.; Aslam, A.; Bhatti, M.I. Green energy consumption and inclusive growth: A comprehensive analysis of multi-country study. Front. Energy Res. 2022, 10, 939920. [Google Scholar] [CrossRef] [Scilit]
- Yao, L.; Li, A.; Wang, S. The impact of intellectual property demonstration policies on carbon emission efficiency. Sci. Rep. 2024, 14, 15336. [Google Scholar] [CrossRef] [Scilit] [PubMed]
- Xu, A.; Song, M.; Xu, S.; Wang, W. Accelerated green patent examination and innovation benefits: An analysis of private economic value and public environmental benefits. Technol. Forecast. Soc. Change 2024, 200, 123105. [Google Scholar] [CrossRef] [Scilit]
- Büttner, B.; Firat, M.; Raiteri, E. Patents and knowledge diffusion: The impact of machine translation. Res. Policy 2022, 51, 104584. [Google Scholar] [CrossRef] [Scilit]
- Ranocchia, C.; Lambertini, L. Porter Hypothesis vs Pollution Haven Hypothesis: Can There Be Environmental Policies Getting Two Eggs in One Basket? Environ. Resour. Econ. 2021, 78, 177–199. [Google Scholar] [CrossRef] [Scilit]
- Chen, Z.; Marin, G.; Popp, D.; Vona, F. The employment impact of a green fiscal push: Evidence from the American recovery and reinvestment act. Brook. Pap. Econ. Act. Forthcom. 2021, 2, 27321. [Google Scholar] [CrossRef] [Scilit]
- Briggs, C.; Atherton, A.; Gill, J.; Langdon, R.; Rutovitz, J.; Nagrath, K. Building a ‘Fair and Fast’ energy transition? Renewable energy employment, skill shortages and social licence in regional areas. Renew. Sustain. Energy Transit. 2022, 2, 100039. [Google Scholar] [CrossRef] [Scilit]
- Nathaniel, S.P.; Yalçiner, K.; Bekun, F.V. Assessing the environmental sustainability corridor: Linking natural resources, renewable energy, human capital, and ecological footprint in BRICS. Resour. Policy 2021, 70, 101924. [Google Scholar] [CrossRef] [Scilit]
- Creti, A.; Ftiti, Z. Energy, just transition, and sustainability: What’s new? Energy Econ. 2024, 139, 107872. [Google Scholar] [CrossRef] [Scilit]
- Gao, X.; Zhu, J.; Zhu, H.; Zhang, X. Spatial spillover effects of skilled migration on innovation in China. Heliyon 2024, 10, e30849. [Google Scholar] [CrossRef] [Scilit] [PubMed]
- Dingyu, O.; Siyao, H. Spatial Effect of Public Service Product Supply on the Level of Urban Innovation. Econ. Geogr. 2024, 44, 106–115. [Google Scholar]
- Jee, S.J. Knowledge for a warmer world: A patent analysis of climate change adaptation technologies. arXiv 2022, arXiv:2108.03722. [Google Scholar]
- Wiener, N.; von Neumann, J. Cybernetics or Control and Communication in the Animal and the Machine. Phys. Today 1949, 2, 33–34. [Google Scholar] [CrossRef] [Scilit]
- Shannon, C.E. A mathematical theory of communication. Bell Syst. Tech. J. 1948, 27, 379–423. [Google Scholar] [CrossRef] [Scilit]
- Lucas, R.E., Jr. On the mechanics of economic development. J. Monet. Econ. 1988, 22, 3–42. [Google Scholar] [CrossRef] [Scilit]
- Romer, P.M. Endogenous technological change. J. Political Econ. 1990, 98, S71–S102. [Google Scholar] [CrossRef] [Scilit]
- Acemoglu, D.; Autor, D. Skills, tasks and technologies: Implications for employment and earnings. In Handbook of Labor Economics; Elsevier: Amsterdam, The Netherlands, 2011; Volume 4, pp. 1043–1171. [Google Scholar]
- Goldin, C.; Katz, L.F. The race between education and technology. In Inequality in the 21st Century; Routledge: Oxfordshire, UK, 2018; pp. 49–54. [Google Scholar]
- Lin, J.Y. New structural economics: A framework for rethinking development. World Bank Res. Obs. 2011, 26, 193–221. [Google Scholar] [CrossRef] [Scilit]
- Chen, D.H.; Dahlman, C.J. The Knowledge Economy, the KAM Methodology and World Bank Operations; World Bank Institute Working Paper No. 37256; World Bank Institute: Washington, DC, USA, 2005. [Google Scholar]
- Aschauer, D.A. Is public expenditure productive? J. Monet. Econ. 1989, 23, 177–200. [Google Scholar] [CrossRef] [Scilit]
- Black, S.E.; Lynch, L.M. Measuring organizational capital in the new economy. In Measuring Capital in the New Economy; University of Chicago Press: Chicago, IL, USA, 2005; pp. 205–236. [Google Scholar]
- Mincer, J. Education, experience, and the distribution of earnings and employment: An overview. In Education, Income, and Human Behavior; McGraw-Hill: New York, NY, USA, 1975; pp. 71–94. [Google Scholar]
- Schultz, T.W. Investment in human capital. Am. Econ. Rev. 1961, 51, 1–17. [Google Scholar]
- Bloom, D.E.; Canning, D. The health and wealth of nations. Science 2000, 287, 1207–1209. [Google Scholar] [CrossRef] [Scilit] [PubMed]
- LeSage, J.; Pace, R.K. Introduction to Spatial Econometrics; Chapman and Hall/CRC: Boca Raton, FL, USA, 2009. [Google Scholar]
- Elhorst, J.P. Spatial Econometrics: From Cross-Sectional Data to Spatial Panels; Springer: Berlin/Heidelberg, Germany, 2014; Volume 479. [Google Scholar]
- Chernozhukov, V.; Chetverikov, D.; Demirer, M.; Duflo, E.; Hansen, C.; Newey, W.; Robins, J. Double/debiased machine learning for treatment and structural parameters. Econom. J. 2018, 21, C1–C68. [Google Scholar] [CrossRef] [Scilit]
- Baron, R.M.; Kenny, D.A. The moderator–mediator variable distinction in social psychological research: Conceptual, strategic, and statistical considerations. J. Personal. Soc. Psychol. 1986, 51, 1173. [Google Scholar] [CrossRef]
- Sobel, M.E. Asymptotic confidence intervals for indirect effects in structural equation models. Sociol. Methodol. 1982, 13, 290–312. [Google Scholar] [CrossRef] [Scilit]
- Anselin, L. Local indicators of spatial association—LISA. Geogr. Anal. 1995, 27, 93–115. [Google Scholar] [CrossRef] [Scilit]
- Cliff, A.D.; Ord, J.K. Spatial Processes: Models & Applications; Pion: London, UK, 1981; Volume 44. [Google Scholar]
- Anselin, L.; Bera, A.K.; Florax, R.; Yoon, M.J. Simple diagnostic tests for spatial dependence. Reg. Sci. Urban Econ. 1996, 26, 77–104. [Google Scholar] [CrossRef] [Scilit]
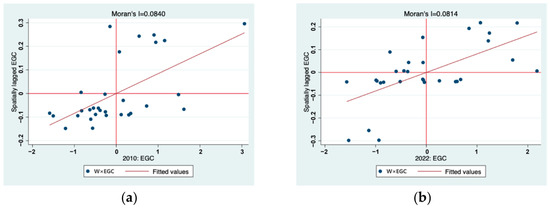
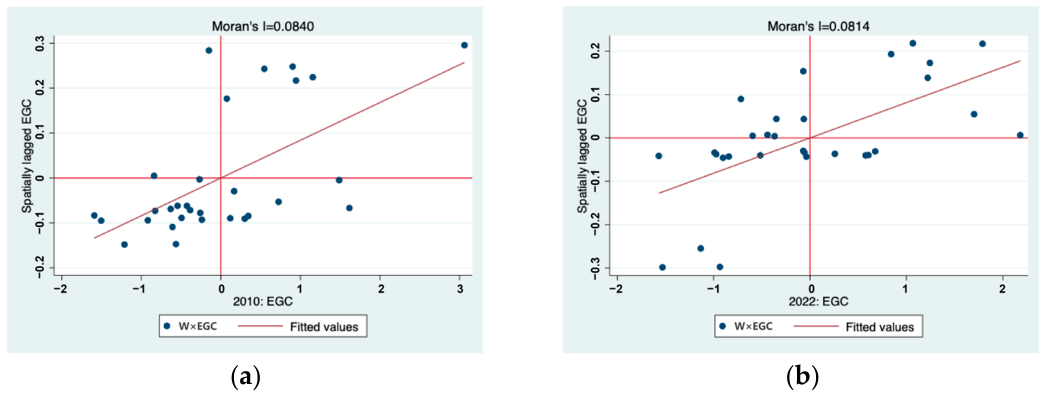
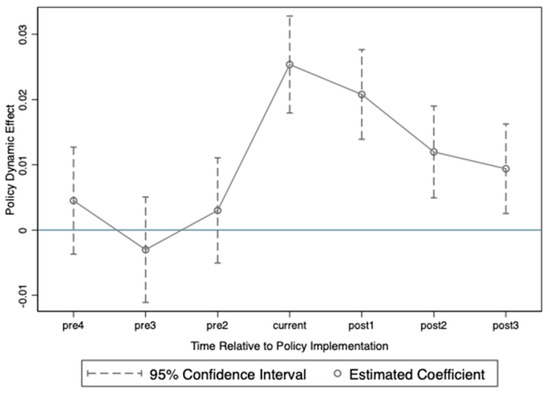
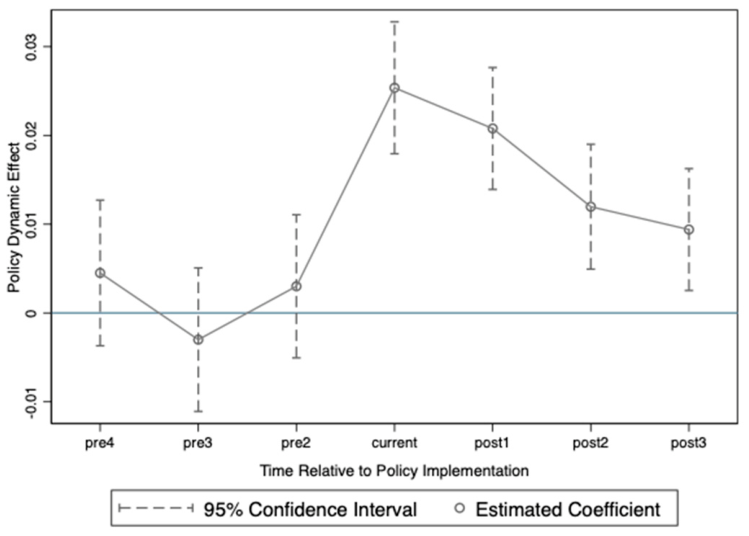
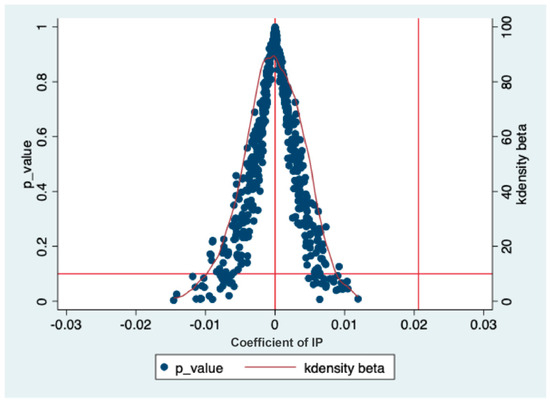
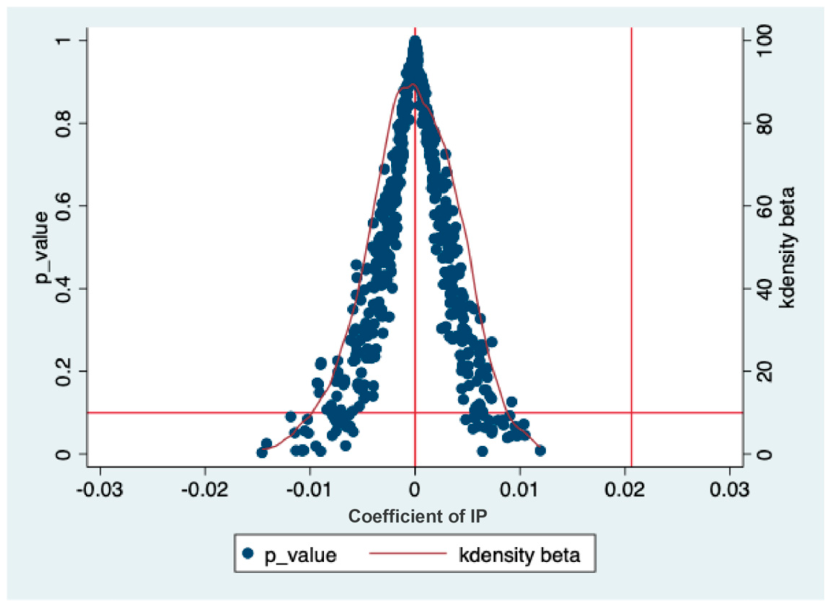

Disclaimer/Publisher’s Note: The statements, opinions and data contained in all publications are solely those of the individual author(s) and contributor(s) and not of MDPI and/or the editor(s). MDPI and/or the editor(s) disclaim responsibility for any injury to people or property resulting from any ideas, methods, instructions or products referred to in the content. |
© 2026 by the authors. Licensee MDPI, Basel, Switzerland. This article is an open access article distributed under the terms and conditions of the Creative Commons Attribution (CC BY) license.